| OUTCOME | N STUDIES (n women) | EFFECT | CERTAINTY OF EVIDENCE |
| Relative
(95% CI) | Absolute
(95% CI) |
| IM pethidine 50 mg/100 mg versus placebo |
| Maternal satisfaction with analgesia measured during labour (number of women satisfied or very satisfied after 30 minutes) | 1 (50) | RR 7.00
(0.38 to 128.87) | 0 fewer per 1000
(from 0 fewer to 0 fewer) | ⊕⊝⊝⊝
VERY LOW a,b |
| Maternal pain score or pain measured in labour (described as good or fair after 1 hour) | 1 (118) | RR 1.75
(1.24 to 2.47) | 310 more per 1000
(from 99 more to 608 more) | ⊕⊕⊝⊝
LOW a,c |
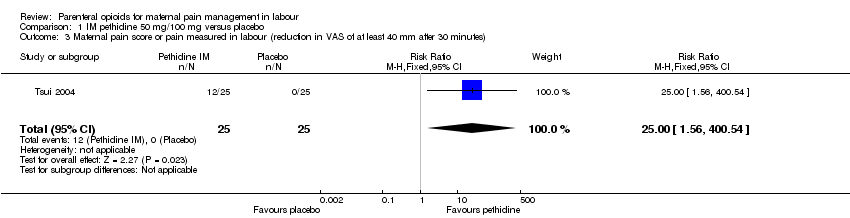
| Maternal pain score or pain measured in labour (reduction in VAS of at least 40 mm after 30 minutes) | 1 (50) | RR 25.00
(1.56 to 400.54) | 0 fewer per 1000
(from 0 fewer to 0 fewer) | ⊕⊕⊝⊝
LOW a,d |
| Additional analgesia required | 1 (50) | RR 0.71
(0.54 to 0.94) | 278 fewer per 1000
(from 58 fewer to 442 fewer) | ⊕⊕⊝⊝
LOW a,c |
| Epidural | 1 (50) | RR 0.50
(0.14 to 1.78) | 120 fewer per 1000 (from 187 more to 206 fewer) | ⊕⊝⊝⊝
VERY LOW a,b |
| IM pentazocine versus placebo |
| Maternal pain score measured during labour | 1 (89) | ‐ | MD 3.60 lower
(9.91 lower to 2.71 higher) | ⊕⊕⊝⊝
LOW e |
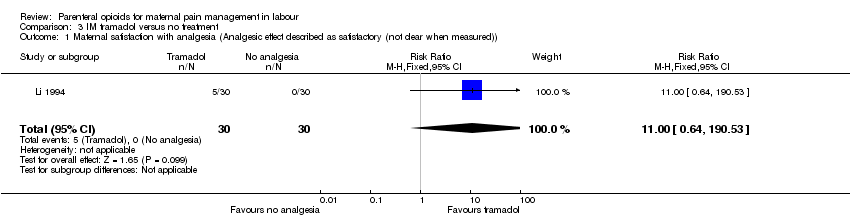
| IM tramadol versus no treatment |
| Maternal satisfaction with analgesia (Analgesic effect described as satisfactory (not clear when measured)) | 1 (60) | RR 11.00
(0.64 to 190.53) | 0 fewer per 1000
(from 0 fewer to 0 fewer) | ⊕⊝⊝⊝
VERY LOW b,f |
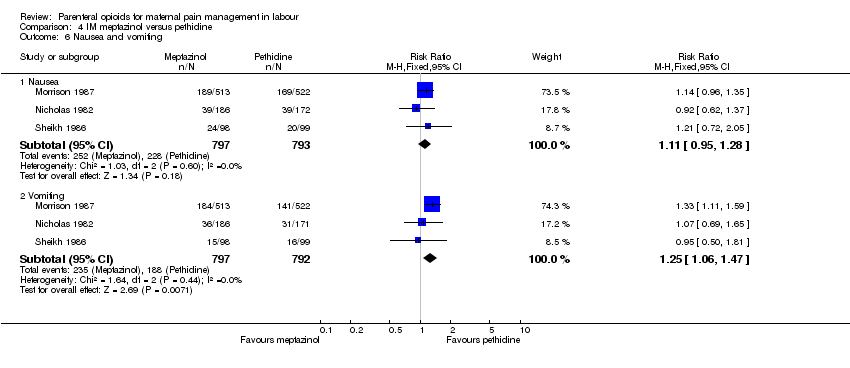
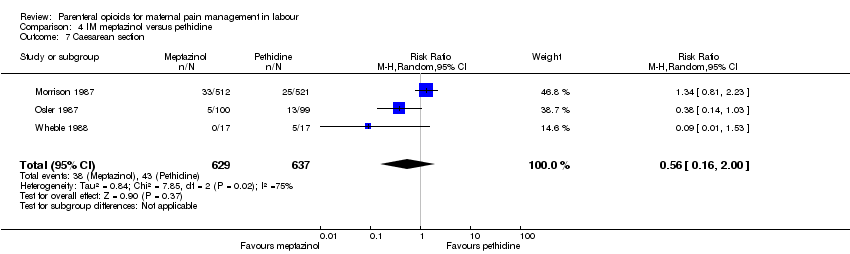
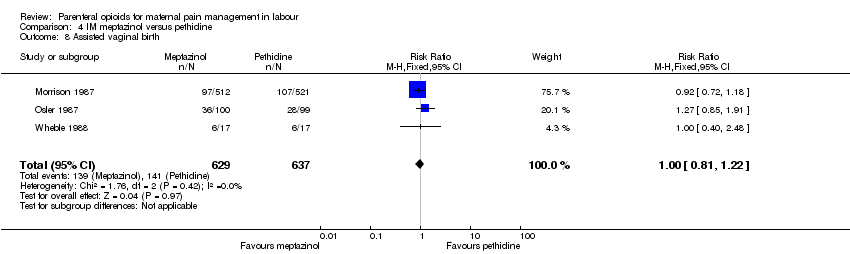
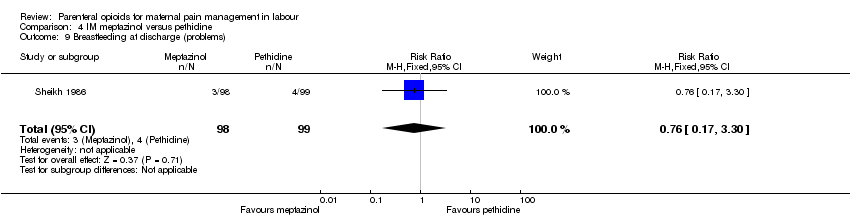
| IM meptazinol versus pethidine |
| Maternal pain score or pain measured in labour (Maternal pain relief poor or none (3‐5 PN)) | 1 (801) | RR 1.01
(0.91 to 1.12) | 6 more per 1000
(from 57 fewer to 77 more) | ⊕⊕⊝⊝
LOW a,g |
| Maternal pain score or pain measured in labour (Pain intensity 4 or 5 on 5‐point scale (1 hour)) | 2 (239) | RR 1.11
(0.69 to 1.80) | 79 more per 1000
(from 223 fewer to 576 more) | ⊕⊝⊝⊝
VERY LOW e,h |
| Additional analgesia required | 2 (233) | RR 1.03
(0.88 to 1.20) | 20 more per 1000
(from 81 fewer to 134 more) | ⊕⊝⊝⊝
VERY LOW e,h |
| Epidural | 4 (788) | RR 0.96
(0.71 to 1.29) | 7 fewer per 1000
(from 52 fewer to 52 more) | ⊕⊝⊝⊝
VERY LOW g,i |
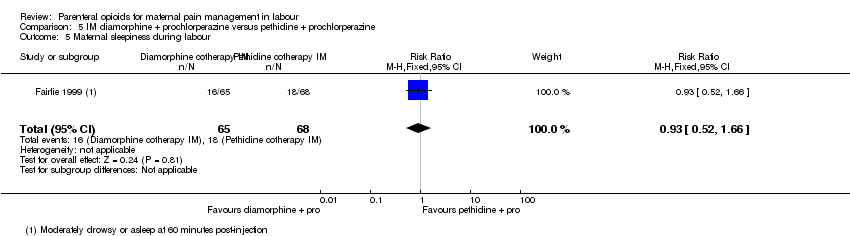
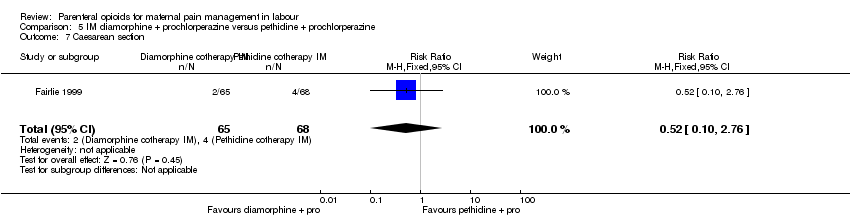
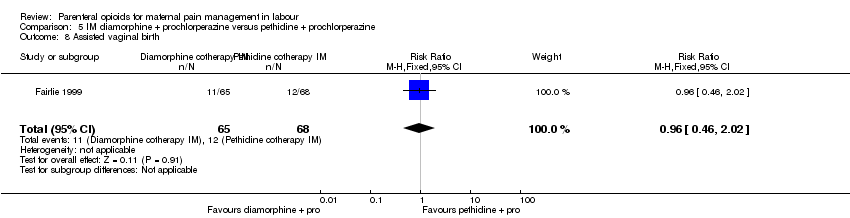
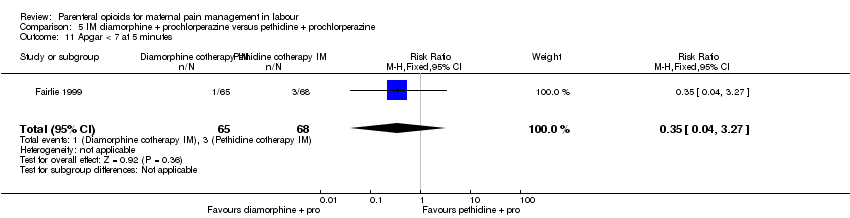
| IM diamorphine + prochlorperazine versus pethidine + prochlorperazine |
| Maternal satisfaction with analgesia in labour measured during the postnatal period (Global assessment of pain relief at 24 hours) | 1 (133) | RR 0.88
(0.67 to 1.16) | 78 fewer per 1000
(from 104 more to 214 fewer) | ⊕⊝⊝⊝
VERY LOW a,e |
| Maternal pain score or pain measured in labour (Pain intensity at 1 hour (moderate or severe)) | 1 (133) | RR 0.85
(0.72 to 1.01) | 130 fewer per 1000
(from 9 more to 243 fewer) | ⊕⊝⊝⊝
VERY LOW a,e |
| Additional analgesia required | 1 (133) | RR 1.35
(0.53 to 3.40) | 36 more per 1000
(from 48 fewer to 247 more) | ⊕⊝⊝⊝
VERY LOW a,b |
| Epidural | 1 (133) | RR 1.22
(0.72 to 2.07) | 58 more per 1000
(from 74 fewer to 283 more) | ⊕⊝⊝⊝
VERY LOW a,b |
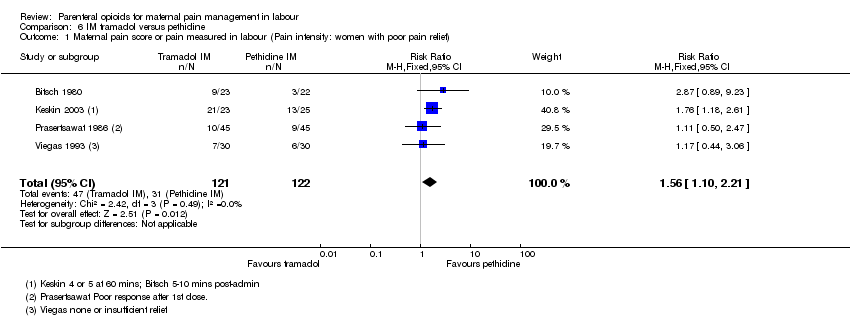
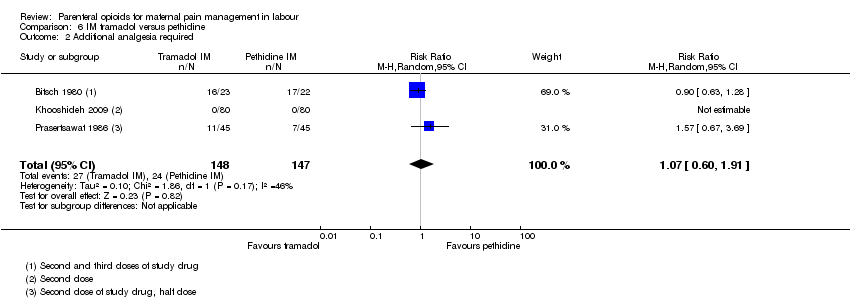
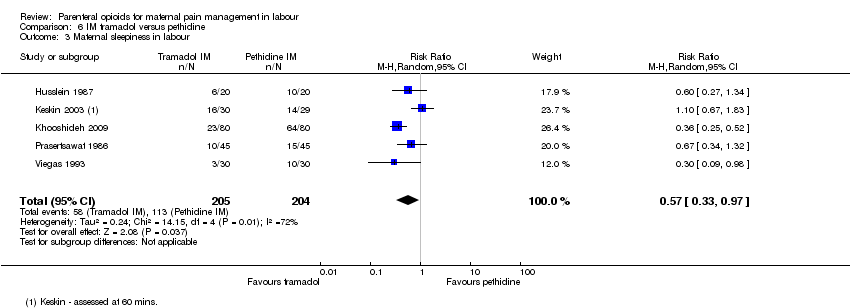
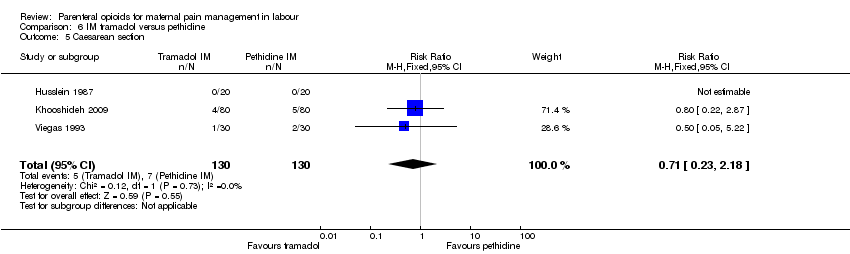
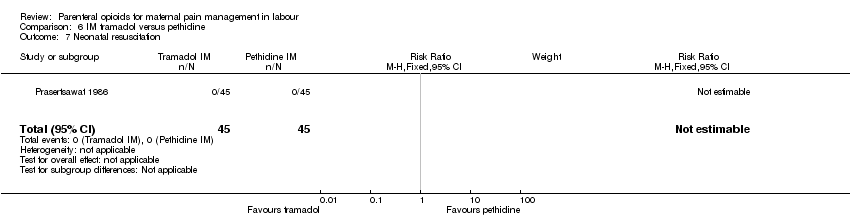
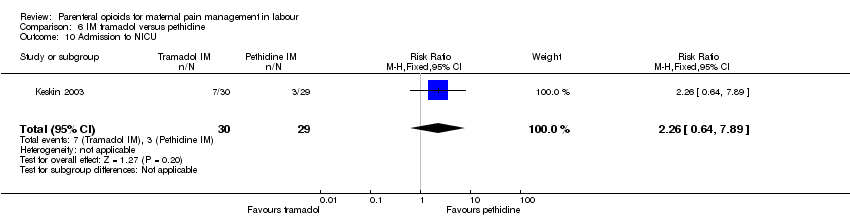
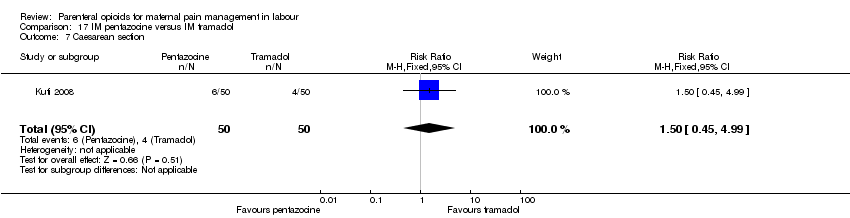
| IM tramadol versus pethidine |
| Maternal pain score or pain measured in labour (Pain intensity: women with poor pain relief) | 4 (243) | RR 1.56
(1.10 to 2.21) | 142 more per 1000
(from 25 more to 307 more) | ⊕⊕⊝⊝
LOW c,j |
| Additional analgesia required | 3 (295) | RR 1.07
(0.60 to 1.91) | 11 more per 1000
(from 65 fewer to 149 more) | ⊕⊝⊝⊝
VERY LOW e,j |
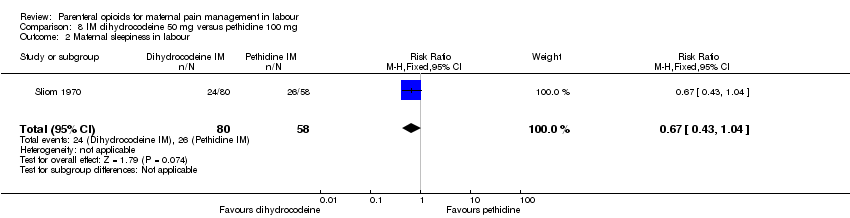
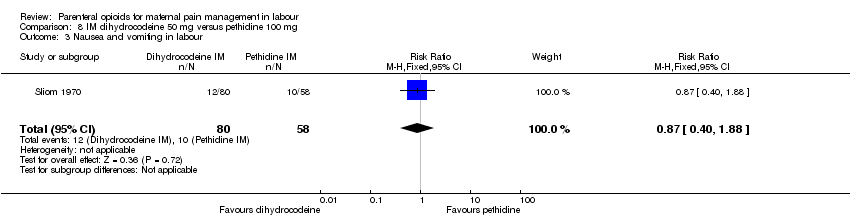
| IM dihydrocodeine 50 mg versus pethidine 100 mg |
| Maternal pain score or pain measured in labour (Maternal pain relief poor at 1 hour) | 1 (138) | RR 1.09
(0.64 to 1.86) | 25 more per 1000
(from 99 fewer to 237 more) | ⊕⊝⊝⊝
VERY LOW a,e |
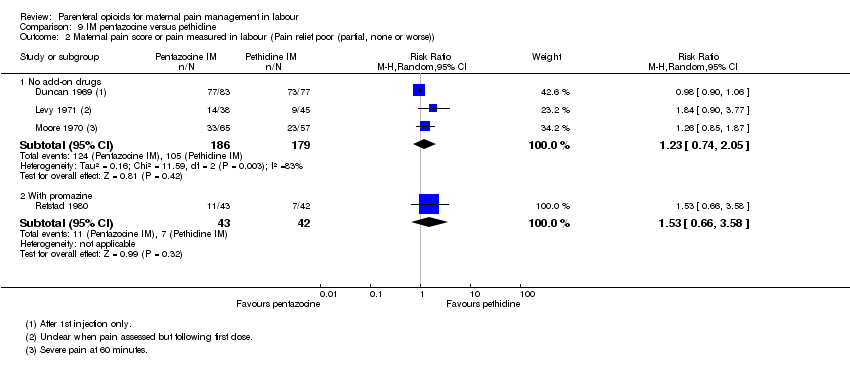
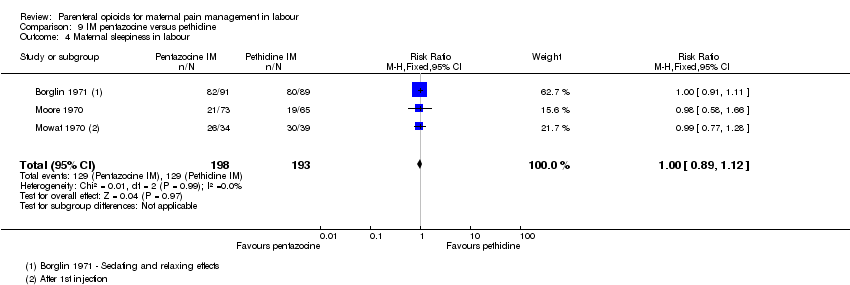
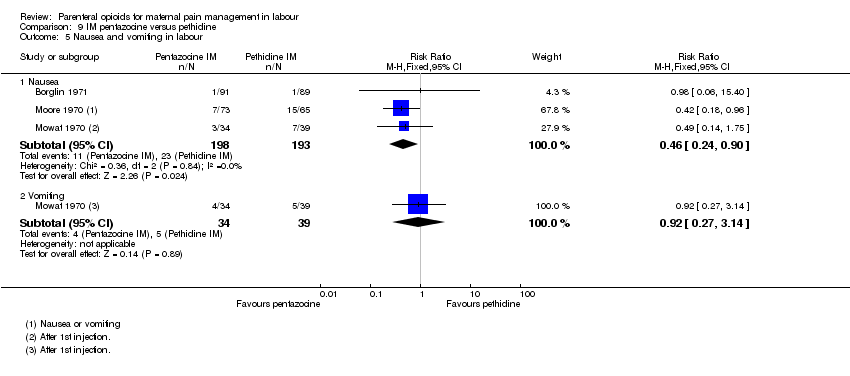
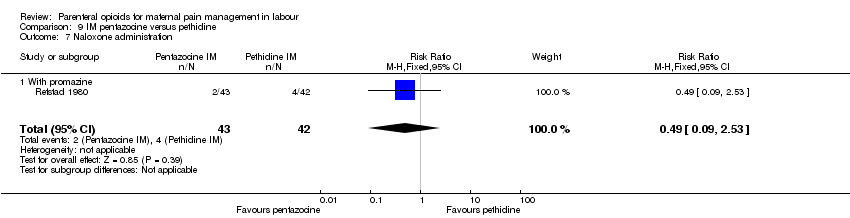
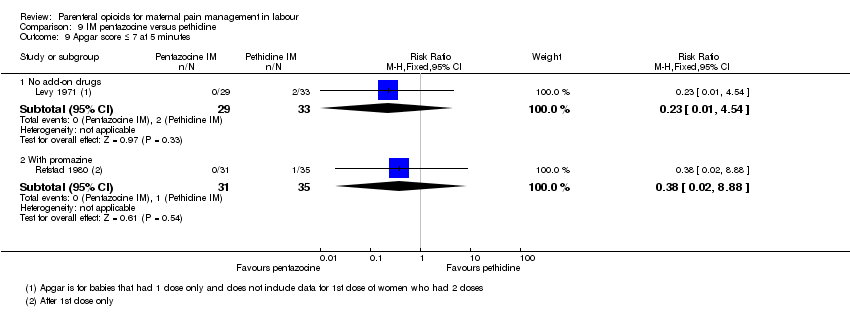
| IM pentazocine versus pethidine |
| Maternal satisfaction with analgesia measured during labour (Pain relief (good or very good) at delivery) | 2 (253) | RR 1.08
(0.92 to 1.27) | 51 more per 1000
(from 51 fewer to 171 more) | ⊕⊝⊝⊝
VERY LOW e,h |
| Maternal pain score or pain measured in labour (Pain relief poor (partial, none or worse)) ‐ No add‐on drugs | 3 (365) | Average RR 1.23
(0.74 to 2.05) | 135 more per 1000
(from 153 fewer to 616 more) | ⊕⊝⊝⊝
VERY LOW g,i,k |
| Maternal pain score or pain measured in labour (Pain relief poor (partial, none or worse)) ‐ With promazine | 1 (85) | RR 1.53
(0.66 to 3.58) | 88 more per 1000
(from 57 fewer to 430 more) | ⊕⊝⊝⊝
VERY LOW b,f |
| Additional analgesia required ‐ pentazocine | 1 (94) | RR 0.91
(0.50 to 1.65) | 30 fewer per 1000
(from 167 fewer to 217 more) | ⊕⊝⊝⊝
VERY LOW b,f |
| Additional analgesia required ‐ pentazocine + promazine | 1 (85) | RR 1.67
(0.73 to 3.84) | 112 more per 1000
(from 45 fewer to 473 more) | ⊕⊝⊝⊝
VERY LOW b,f |
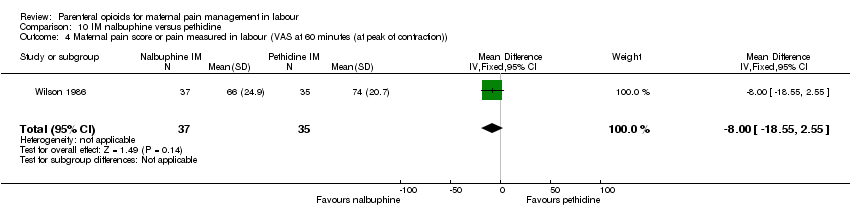
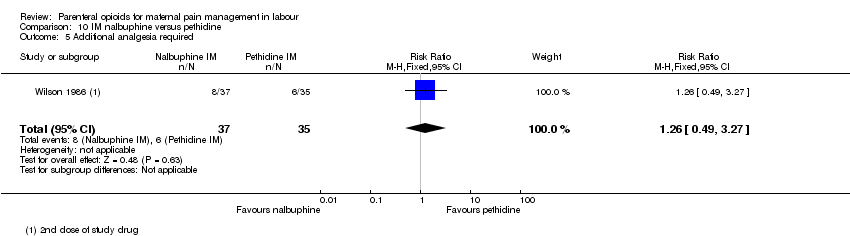
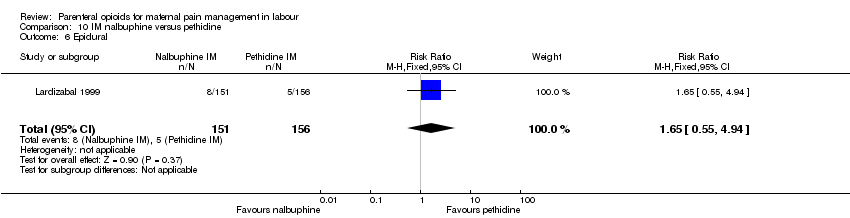
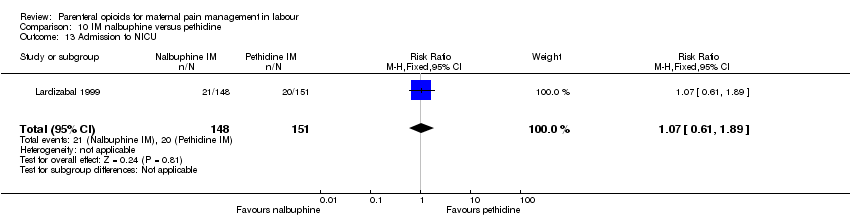
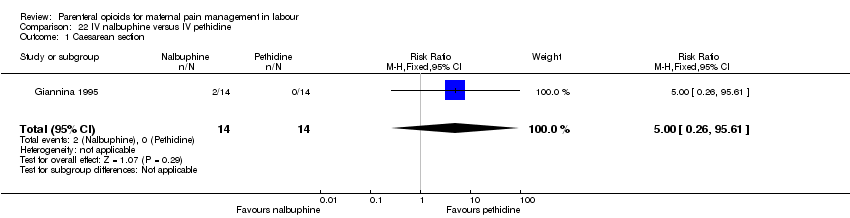
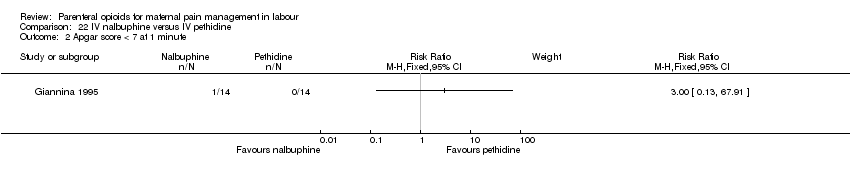
| IM nalbuphine versus pethidine |
| Maternal satisfaction with analgesia measured during the postnatal period (numbers dissatisfied) | 1 (72) | RR 0.73
(0.55 to 0.96) | 231 fewer per 1000
(from 34 fewer to 386 fewer) | ⊕⊕⊝⊝
LOW a,c |
| Maternal satisfaction with analgesia measured during labour (Pain free) | 1 (40) | RR 6.00
(0.79 to 45.42) | 250 more per 1000
(from 10 fewer to 1000 more) | ⊕⊝⊝⊝
VERY LOW b,f |
| Maternal pain score or pain measured in labour (Pain intensity at 30 minutes: women with severe pain) | 1 (295) | RR 0.86
(0.59 to 1.26) | 40 fewer per 1000
(from 75 more to 118 fewer) | ⊕⊝⊝⊝
VERY LOW a,e |
| Maternal pain score or pain measured in labour (VAS at 60 minutes (at peak of contraction)) | 1 (72) | ‐ | MD 8.00 lower
(18.55 lower to 2.55 higher) | ⊕⊝⊝⊝
VERY LOW a,e |
| Additional analgesia required | 1 (72) | RR 1.26
(0.49 to 3.27) | 45 more per 1000
(from 87 fewer to 389 more) | ⊕⊝⊝⊝
VERY LOW a,b |
| Epidural | 1 (307) | RR 1.65
(0.55 to 4.94) | 21 more per 1000
(from 14 fewer to 126 more) | ⊕⊕⊝⊝
LOW l |
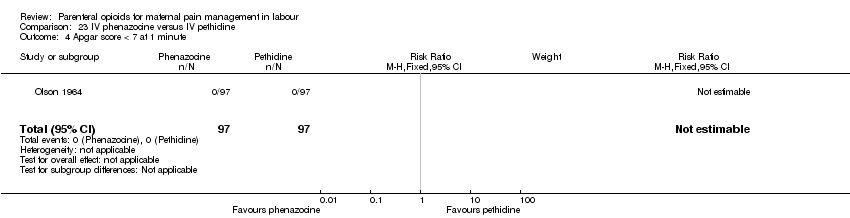
| IM phenazocine versus pethidine |
| Epidural | 1 (212) | RR 1.31 (0.58 to 2.97) | 27 more per 1000 (from 36 fewer to 169 more) | ⊕⊝⊝⊝
VERY LOW a,b |
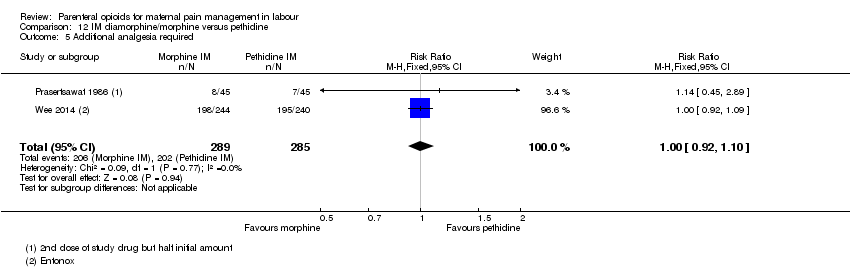
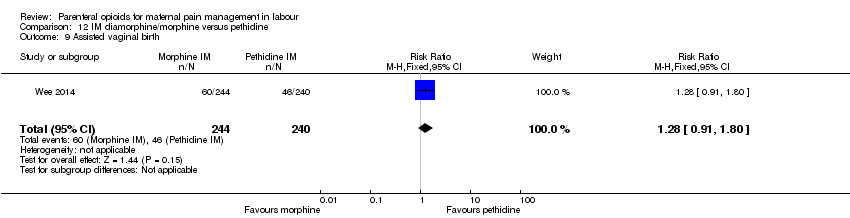
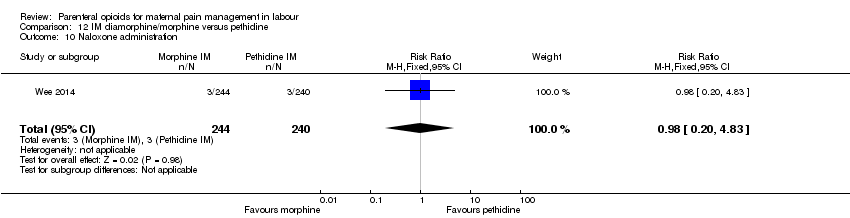
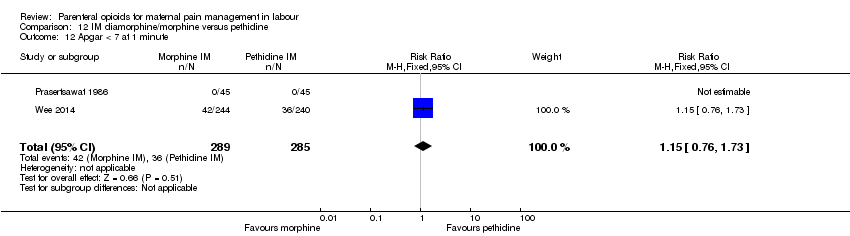
| IM diamorphine/morphine versus pethidine |
| Maternal satisfaction with analgesia (number of women satisfied or very satisfied) | 1 (484) | RR 1.13
(1.02 to 1.26) | 92 more per 1000
(from 14 more to 184 more) | ⊕⊕⊕⊕
HIGH |
| Maternal satisfaction with analgesia measured during labour or during the postnatal period (Pain relief described as poor) | 1 (90) | RR 1.22
(0.56 to 2.66) | 44 more per 1000
(from 88 fewer to 332 more) | ⊕⊝⊝⊝
VERY LOW a,b |
| Additional analgesia required | 2 (574) | RR 1.00
(0.92 to 1.10) | 0 fewer per 1000
(from 57 fewer to 71 more) | ⊕⊕⊕⊝
MODERATE g |
| Maternal pain relief at 30 mins | 1 (484) | ‐ | MD 0.80 lower
(1.24 lower to 0.36 lower) | ⊕⊕⊕⊕
HIGH |
| Maternal pain relief at 60 mins | 1 (484) | ‐ | MD 0.80 lower
(1.26 lower to 0.34 lower) | ⊕⊕⊕⊕
HIGH |
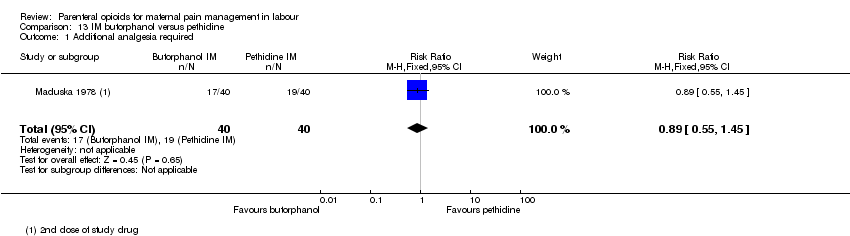
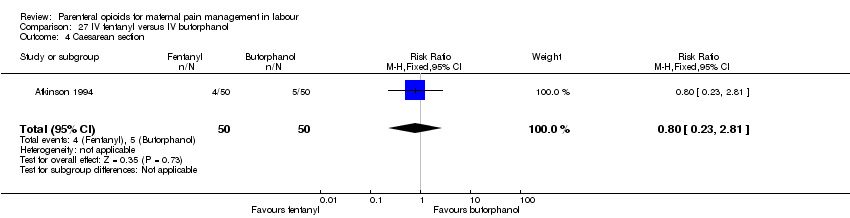
| IM butorphanol versus pethidine |
| Additional analgesia required | 1 (80) | RR 0.89
(0.55 to 1.45) | 52 fewer per 1000
(from 214 fewer to 214 more) | ⊕⊝⊝⊝
VERY LOW a,b |
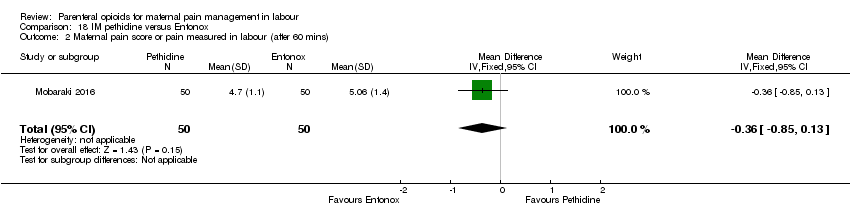
| IM pethidine versus Entonox |
| Maternal pain score or pain measured in labour (after 30 mins) | 1 (100) | ‐ | MD 1.66 higher
(1.17 higher to 2.15 higher) | ⊕⊝⊝⊝
VERY LOW c,f |
| Maternal pain score or pain measured in labour (after 60 mins) | 1 (100) | ‐ | MD 0.36 lower
(0.85 lower to 0.13 higher) | ⊕⊝⊝⊝
VERY LOW e,f |
| IV pethidine versus placebo |
| Maternal pain score or pain measured in labour (Pain score 30 mins post analgesia) | 1 (240) | ‐ | MD 4.10 lower
(4.56 lower to 3.64 lower) | ⊕⊕⊕⊝
MODERATE c |
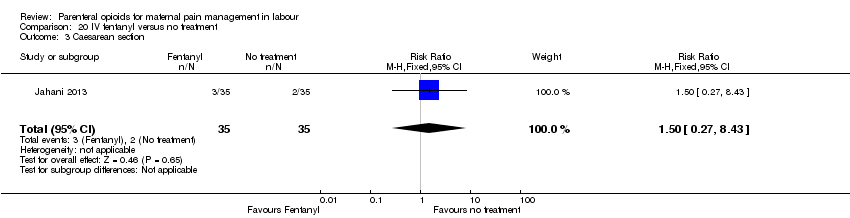
| IV fentanyl versus no treatment |
| Maternal pain score or pain measured in labour (Pain score 1 hour post‐analgesia) | 1 (70) | ‐ | MD 5.00 lower
(5.47 lower to 4.53 lower) | ⊕⊝⊝⊝
VERY LOW d,f |
| Maternal pain score or pain measured in labour (Pain intensity (Severe) after 1 hour) | 1 (70) | RR 0.02
(0.00 to 0.25) | 868 fewer per 1000
(from 664 fewer to 886 fewer) | ⊕⊝⊝⊝
VERY LOW d,f |
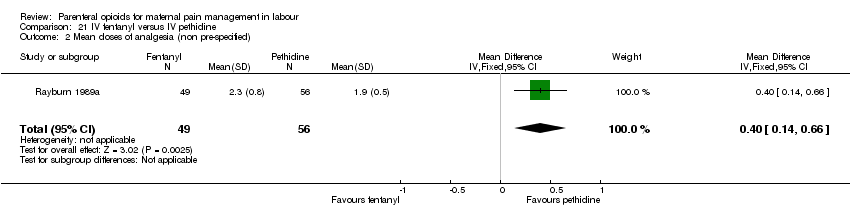
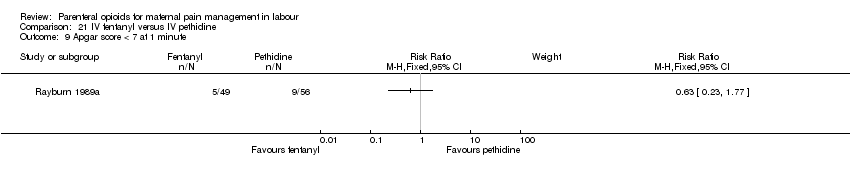
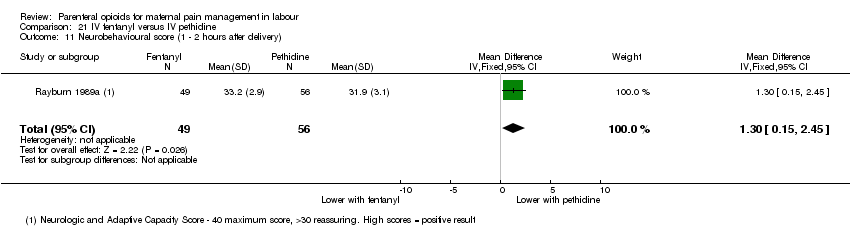
| IV fentanyl versus IV pethidine |
| Maternal pain score or pain measured in labour (Pain score 1 hour after drug administration) | 1 (105) | ‐ | MD 0.20 lower
(1.18 lower to 0.78 higher) | ⊕⊕⊝⊝
LOW a,c |
| Mean doses of analgesia (non pre‐specified) | 1 (105) | ‐ | MD 0.40 higher
(0.14 higher to 0.66 higher) | ⊕⊕⊝⊝
LOW a,c |
| IV phenazocine versus IV pethidine |
| Maternal satisfaction with analgesia measured during labour (women with fair or poor relief) | 1 (194) | RR 0.72
(0.48 to 1.10) | 104 fewer per 1000
(from 37 more to 193 fewer) | ⊕⊝⊝⊝
VERY LOW a,b |
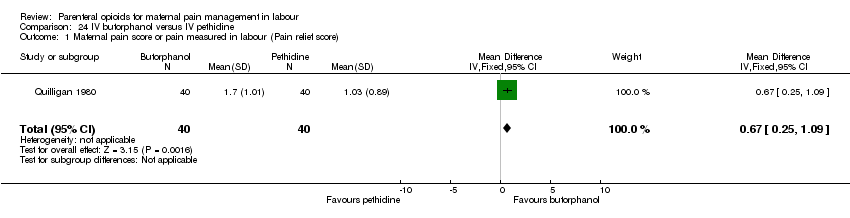
| IV butorphanol versus IV pethidine |
| Maternal pain score or pain measured in labour (Pain relief score) | 1 (80) | ‐ | MD 0.67 higher
(0.25 higher to 1.09 higher) | ⊕⊕⊝⊝
LOW a,c |
| Maternal pain score or pain measured in labour (Pain score (1 hour after drug administration)) | 1 (80) | ‐ | MD 0.60 lower
(1.02 lower to 0.18 lower) | ⊕⊕⊝⊝
LOW a,c |
| Additional analgesia required | 1 (100) | RR 0.96
(0.63 to 1.45) | 19 fewer per 1000
(from 178 fewer to 216 more) | ⊕⊝⊝⊝
VERY LOW a,e |
| Epidural | 1 (200) | RR 1.00
(0.30 to 3.35) | 0 fewer per 1000
(from 35 fewer to 118 more) | ⊕⊝⊝⊝
VERY LOW a,b |
| IV morphine versus pethidine |
| Maternal satisfaction with analgesia (assessed 3 days postpartum) | 1 (141) | RR 0.87
(0.78 to 0.98) | 124 fewer per 1000
(from 19 fewer to 210 fewer) | ⊕⊕⊝⊝
LOW a,c |
| Additional analgesia required | 1 (143) | RR 3.41
(1.90 to 6.12) | 373 more per 1000
(from 139 more to 793 more) | ⊕⊕⊝⊝
LOW a,d |
| IV Nisentil versus IV pethidine |
| Maternal satisfaction with analgesia, maternal pain score or pain measured in labour, additional analgesia, epidural | 1 (395) | ‐ | ‐ | No trial reported these outcomes. |
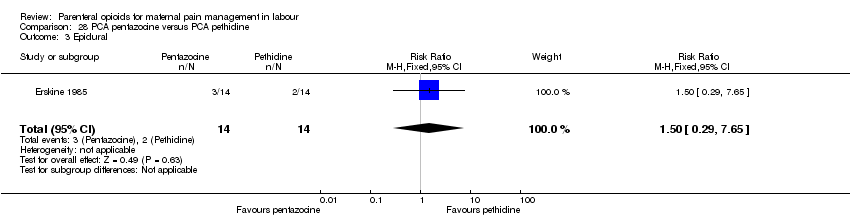
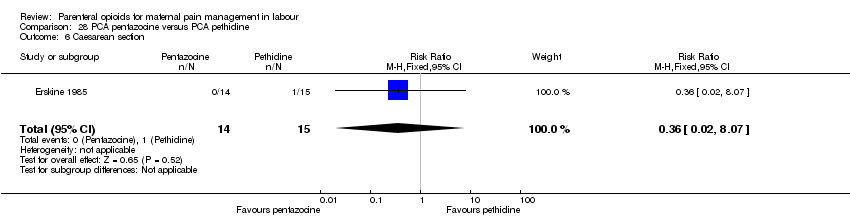
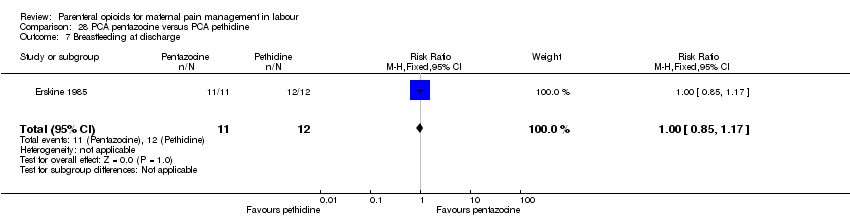
| PCA pentazocine versus PCA pethidine |
| Maternal pan score or pain measured in labour | 1 (23) | ‐ | SMD 0.76 lower
(1.62 lower to 0.09 higher) | ⊕⊝⊝⊝
VERY LOW a,e |
| Maternal pan score or pain measured in labour (rated as good one day after birth) | 1 (28) | RR 0.82
(0.51 to 1.32) | 141 fewer per 1000
(from 251 more to 385 fewer) | ⊕⊝⊝⊝
VERY LOW a,e |
| Epidural | 1 (28) | RR 1.50
(0.29 to 7.65) | 71 more per 1000
(from 101 fewer to 950 more) | ⊕⊝⊝⊝
VERY LOW a,e |
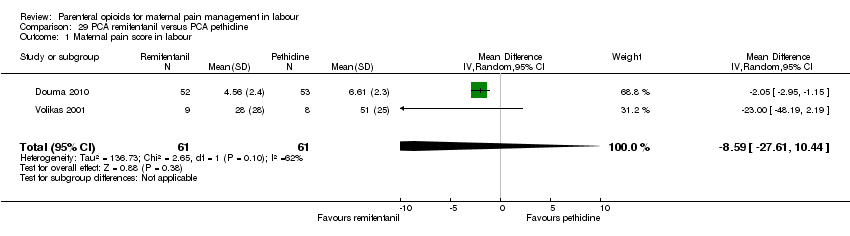
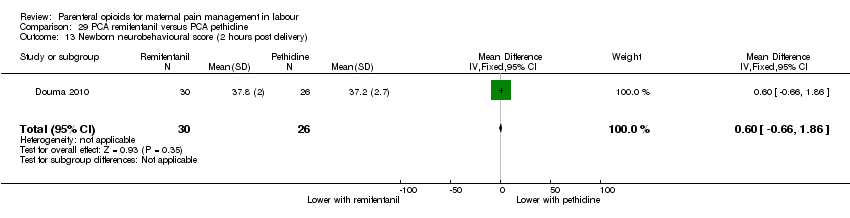
| PCA remifentanil versus PCA pethidine |
| Maternal pain score in labour | 2 (122) | ‐ | MD 8.59 lower
(27.61 lower to 10.44 higher) | ⊕⊕⊝⊝
LOW e |
| Additional analgesia required | 2 (56) | RR 0.86
(0.69 to 1.08) | 124 fewer per 1000
(from 71 more to 276 fewer) | ⊕⊝⊝⊝
VERY LOW e,h |
| Epidural | 2 (122) | RR 0.42
(0.20 to 0.89) | 181 fewer per 1000
(from 34 fewer to 249 fewer) | ⊕⊕⊕⊝
MODERATE d |
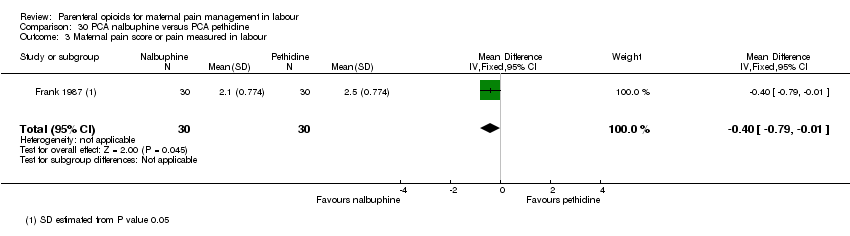
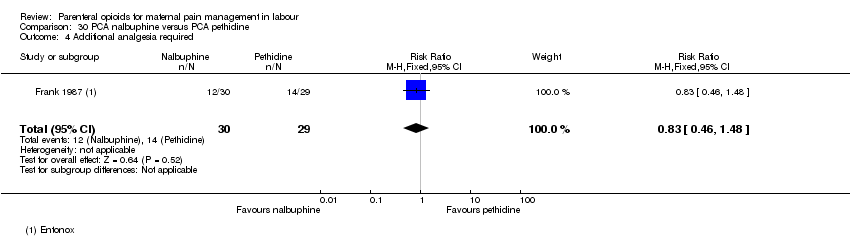
| PCA nalbuphine versus PCA pethidine |
| Maternal satisfaction with analgesia in labour measured during the postnatal period (rated good or excellent) | 1 (60) | RR 1.29
(0.88 to 1.89) | 164 more per 1000
(from 68 fewer to 504 more) | ⊕⊝⊝⊝
VERY LOW a,e |
| Maternal satisfaction with analgesia in labour measured during the postnatal period (Would use the same pain relief again) | 1 (59) | RR 1.06
(0.79 to 1.43) | 43 more per 1000
(from 152 fewer to 311 more) | ⊕⊝⊝⊝
VERY LOW a,e |
| Maternal pain score or pain measured in labour | 1 (60) | ‐ | MD 0.40 lower
(0.79 lower to 0.01 lower) | ⊕⊕⊝⊝
LOW a,c |
| Additional analgesia required | 1 (59) | RR 0.83
(0.46 to 1.48) | 82 fewer per 1000
(from 232 more to 261 fewer) | ⊕⊝⊝⊝
VERY LOW a,b |
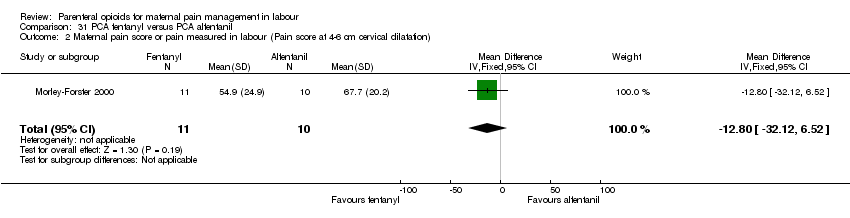
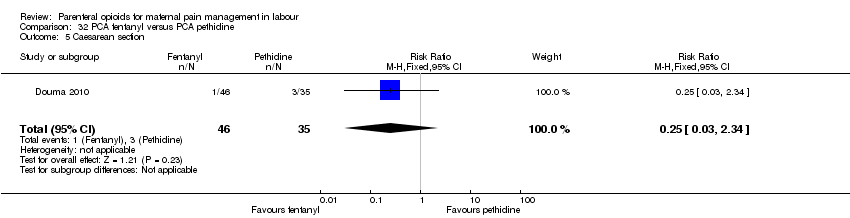
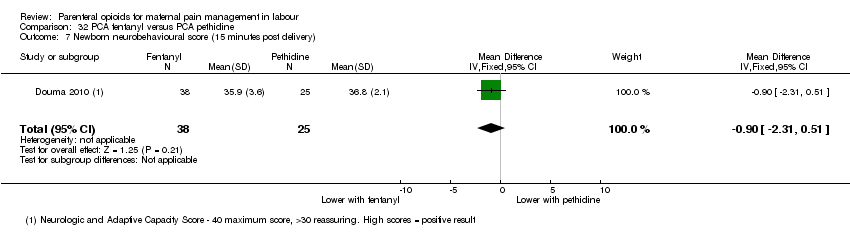
| PCA fentanyl versus PCA pethidine |
| Maternla pain score measured in labour | 1 (107) | ‐ | MD 0.65 lower
(1.56 lower to 0.26 higher) | ⊕⊕⊝⊝
LOW e |
| Epidural | 1 (107) | RR 0.44
(0.21 to 0.92) | 190 fewer per 1000
(from 27 fewer to 268 fewer) | ⊕⊕⊕⊝
MODERATE d |
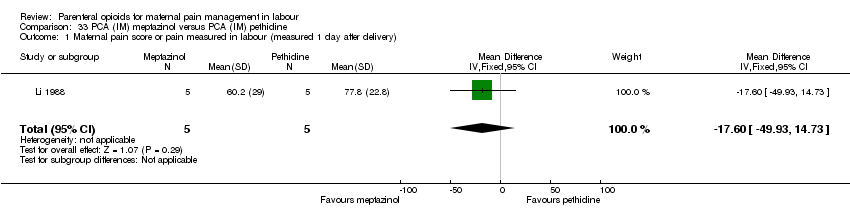
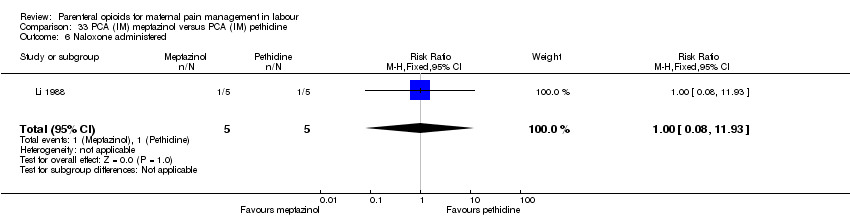
| PCA (IM) meptazinol versus PCA (IM) pethidine |
| Maternal pain score or pain measured in labour (measured 1 day after delivery) | 1 (10) | ‐ | MD 17.60 lower
(49.93 lower to 14.73 higher) | ⊕⊝⊝⊝
VERY LOW a,b |
| Satisfied with mode of administration (PCA IM) | 1 (10) | RR 1.00
(0.71 to 1.41) | 0 fewer per 1000
(from 290 fewer to 410 more) | ⊕⊝⊝⊝
VERY LOW a,b |
| Epidural | 1 (10) | RR 3.00
(0.15 to 59.89) | 0 fewer per 1000
(from 0 fewer to 0 fewer) | ⊕⊝⊝⊝
VERY LOW a,b |
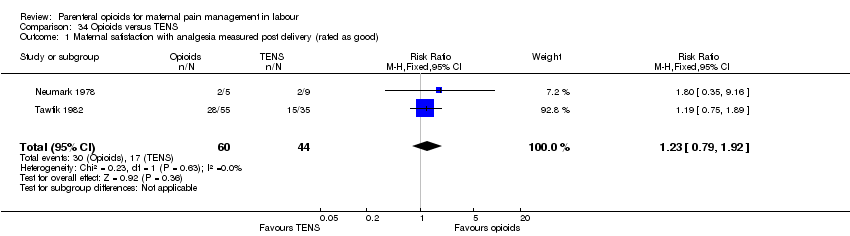
| Opioids versus TENS |
| Maternal satisfaction with analgesia measured post delivery (rated as good) | 2 (104) | RR 1.23
(0.79 to 1.92) | 89 more per 1000
(from 81 fewer to 355 more) | ⊕⊝⊝⊝
VERY LOW b,h |
| Maternal pain score measured during labour | 2 (290) | Average RR 1.15
(0.81 to 1.61) | 97 more per 1000
(from 122 fewer to 393 more) | ⊕⊝⊝⊝
VERY LOW a,e,k |
| Maternal pain score measured during labour (after 30 minutes) | 1 (60) | ‐ | MD 20 lower
(26.09 lower to 13.91 lower) | ⊕⊕⊝⊝
LOW a,c |
| Maternal pain score measured during labour (after 60 minutes) | 1 (60) | ‐ | MD 20.00 lower
(25.16 lower to 14.84 lower) | ⊕⊕⊝⊝
LOW a,c |