| Study ID | Treatment | Local AEs | Systemic AEs | Serious AEs | Withdrawals |
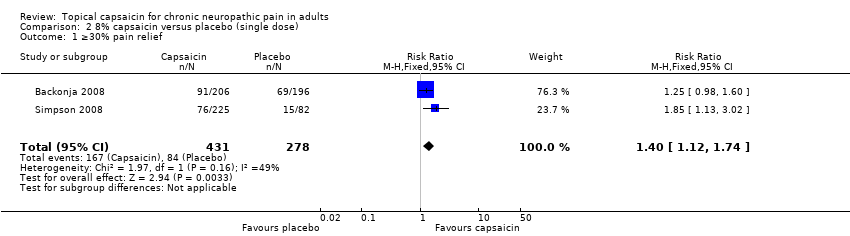
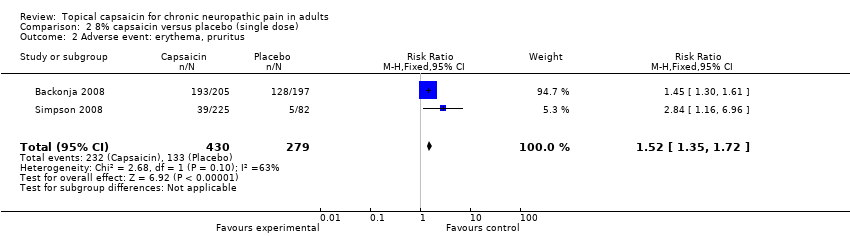
| Backonja 2008 | (1) Capsaicin 8% patch, n = 206
(2) Placebo patch, n = 196 | Erythema:
(1) 193/205
(2) 128/197 Cough not reported, so <3% | Various, all ≤ 5% in both groups | (1) 10/205
(2) 6/197 (1 in capsaicin group judged related to medication) | AE:
(1) 1/205
(2) 0/197 Other:
(1) 18/205 (10 LoE, 8 other)
(2) 18/198 (9 LoE, 9 other) |
| Bernstein 1989 | (1) Capsaicin 0.075% cream, n = 16
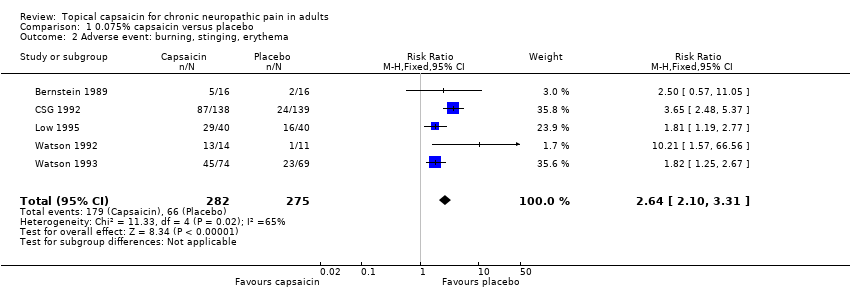
(2) Vehicle cream, n = 16 | Burning, stinging, erythema
(1) 5/16
(2) 2/16 | None | None | AE: none Other:
3 lost to follow up ‐ no details of group or time |
| Biesbroeck 1995 | (1) Capsaicin 0.075% cream, n = 118
(2) Amitriptyline 25 to 125mg (oral), n = 117 | Total skin AEs:
(1) 68/118 (52 burning)
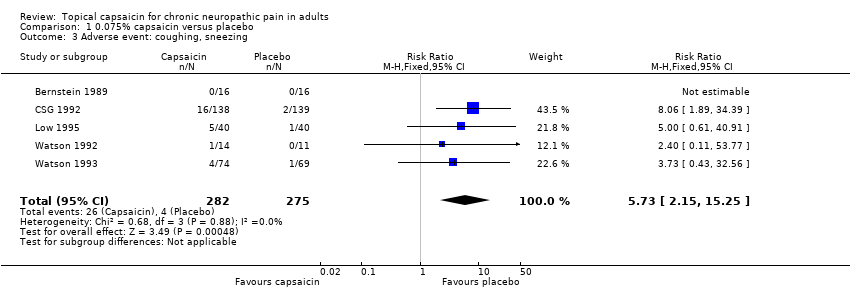
(2) 2/117 (unspecified) Cough/sneeze:
(1) 7/118
(2) 1/117 | None with capsaicin Limited therapeutic dose for majority of amitriptyline participants | (1) None (2) Not reported | AE: none related to capsaicin Other: (1) 14 did not contribute any post baseline efficacy data
(2) 9 did not contribute any post baseline efficacy data |
| Capsaicin study group 1992 | (1) Capsaicin 0.075% cream, n = 138 (2) Vehicle cream, n = 139 | Burning: (1) 87/138 (2) 17/139 Cough/sneeze: (1) 16/138 (2) 2/139 Burning, cough, sneeze, rash, erythema: (1) 113 events (2) 29 events | Other AE: (1) 6/138 (2) 8/139 Increased pain: (1) 2/138 (2) 5/139 | No data | AE: (1) 18/138 (2) 5/139 Other: (1) 20/138 (7 non‐compliant, 10 other health problems, 3 other) (2) 15/139 (6 non‐compliant, 2 lack of efficacy, 5 other health problems, 2 other) |
| Ellison 1997 | (1) Capsaicin 0.075% cream, n = 49 (2) Placebo cream, n = 50 | Significantly more burning, redness and coughing with capsaicin than placebo (P <0.0001) | No data | No data | AE: no data from first phase Other: no data |
| Low 1995 | (1) Capsaicin 0.075% cream, n = 40 (2) Placebo cream, n = 40 | Burning: (1) 29/40 (2) 16/40 Sneezing: (1) 5/40 (2) 1/40 Itching: (1) 4/40 (2) 2/40 Rash: (1) 5/40 (2) 0/40 | No data | No data | 1 did not complete entire study ‐ no further details |
| Simpson 2008 | (1) Capsaicin patch 8% 30 min, n = 72 (2) Capsaicin patch 8% 60 min, n = 78 (3) Capsaicin patch 8% 90 min, n = 75 (4) Placebo patch, n = 82 | Pruritus: (1‐3) 39/225 (4) 5/82 Burning: (1‐3) 18/225 Warson 1993 (4) 2/82 Cough: (1) 5/225 (2) 1/82 | Various, ≤ 5% in both groups, except URTI (8%, 6%) | (1‐3) 1/225 (4) 2/82 (all deaths, all judged unrelated to study medication) | AE: (1‐3) 2/225 (4) 1/82 Other: (1‐3) 19/225 (1 LoE, 18 other) (4) 8/82 (2 LoE, 6 other) |
| Watson 1992 | (1) Capsaicin 0.075% cream, n = 14 (2) Vehicle cream, n = 11 | Burning: (1) 13/14 (2) 1/11 Cough: (1) 1/14 (2) 0/11 | No data | No data | AE: (1) 1/14 (2) 0/11 Other: (1) 0/14 (2) 1/11 (recurrence of malignancy) |
| Watson 1993 | (1) Capsaicin 0.075% cream, n = 74 (2) Vehicle cream, n = 69 | Burning,stinging, erythema: (1) 45/74 (2) 23/69 Cough: (1) 4/74 (2) 1/69 | No more than 3/group with any systemic AE. No significant difference between groups | None | AE: (1) 18/74 (1) 2/69 Other: (1) 2/74 (2) 1/69 Exclusions: 12 participants treated did not meet entrance criteria, further 6 had protocol violations |