Psychostimulant drugs for cocaine dependence
Abstract
Background
Cocaine dependence is a severe disorder for which no medication has been approved. Like opioids for heroin dependence, replacement therapy with psychostimulants could be an effective therapy for treatment.
Objectives
To assess the effects of psychostimulants for cocaine abuse and dependence. Specific outcomes include sustained cocaine abstinence and retention in treatment. We also studied the influence of type of drug and comorbid disorders on psychostimulant efficacy.
Search methods
This is an update of the review previously published in 2010. For this updated review, we searched the Cochrane Drugs and Alcohol Group Trials Register, CENTRAL, MEDLINE, Embase and PsycINFO up to 15 February 2016. We handsearched references of obtained articles and consulted experts in the field.
Selection criteria
We included randomised parallel group controlled clinical trials comparing the efficacy of a psychostimulant drug versus placebo.
Data collection and analysis
We used standard methodological procedures expected by Cochrane.
Main results
We included 26 studies involving 2366 participants. The included studies assessed nine drugs: bupropion, dexamphetamine, lisdexamfetamine, methylphenidate, modafinil, mazindol, methamphetamine, mixed amphetamine salts and selegiline. We did not consider any study to be at low risk of bias for all domains included in the Cochrane 'Risk of bias' tool. Attrition bias was the most frequently suspected potential source of bias of the included studies. We found very low quality evidence that psychostimulants improved sustained cocaine abstinence (risk ratio (RR) 1.36, 95% confidence interval (CI) 1.05 to 1.77, P = 0.02), but they did not reduce cocaine use (standardised mean difference (SMD) 0.16, 95% CI −0.02 to 0.33) among participants who continued to use it. Furthermore, we found moderate quality evidence that psychostimulants did not improve retention in treatment (RR 1.00, 95% CI 0.93 to 1.06). The proportion of adverse event‐induced dropouts and cardiovascular adverse event‐induced dropouts was similar for psychostimulants and placebo (RD 0.00, 95% CI −0.01 to 0.01; RD 0.00, 95% CI −0.02 to 0.01, respectively). When we included the type of drug as a moderating variable, the proportion of patients achieving sustained cocaine abstinence was higher with bupropion and dexamphetamine than with placebo. Psychostimulants also appeared to increase the proportion of patients achieving sustained cocaine and heroin abstinence amongst methadone‐maintained, dual heroin‐cocaine addicts. Retention to treatment was low, though, so our results may be compromised by attrition bias. We found no evidence of publication bias.
Authors' conclusions
This review found mixed results. Psychostimulants improved cocaine abstinence compared to placebo in some analyses but did not improve treatment retention. Since treatment dropout was high, we cannot rule out the possibility that these results were influenced by attrition bias. Existing evidence does not clearly demonstrate the efficacy of any pharmacological treatment for cocaine dependence, but substitution treatment with psychostimulants appears promising and deserves further investigation.
PICO
Plain language summary
Efficacy of psychostimulant drugs for cocaine dependence
Review question
We investigated whether psychostimulant substitution was safe and effective for treating patients with cocaine dependence.
Background
Cocaine dependence is a frequent disorder for which no medication has been approved for treatment. Substitution therapy involves the replacement of the abused drug, which is often illegal and used several times a day, by a legal, orally administered and longer‐acting one. A substitute drug has to have similar effects as the abused one, but with a lower addictive potential, enabling drug abstinence and patient adherence to medical and psychological assistance. This strategy can increase the abstinence rate in patients with heroin and tobacco dependence. In this review, we investigated whether psychostimulant substitution with medications that have psychostimulant effect was effective for treating patients with cocaine dependence.
Search date: the evidence is current to 15 February 2016.
Studies and participants' characteristics
We reviewed the evidence about the effect of psychostimulants on cocaine abstinence, safety and retention to treatment in patients with cocaine dependence. We found 26 studies that had enrolled 2366 participants and investigated the effects of psychostimulants against placebo for cocaine abuse or dependence. Most participants were men (75%) in their middle age (mean age 39.6 years). About half (47.6%) were African American, and 39.3% were white. The most common way they used cocaine was smoking. All but two studies took place in the USA, and they studied the effects of nine medications with a psychostimulant effect: bupropion, dexamphetamine, lisdexamfetamine, methylphenidate, modafinil, mazindol, methamphetamine, mixed amphetamine salts and selegiline. All clinical trials provided psychotherapy. Study length ranged from 6 to 24 weeks.
Key results
Investigators assessed cocaine abstinence (determined by urinalysis) in participants receiving the study intervention versus those receiving placebo. Though some analyses found that cocaine abstinence was higher with psychostimulants than with placebo, we are uncertain whether psychostimulants decrease cocaine use among participants who continue to use it or if they increase the number of people who stay clean, as the quality of the evidence was very low.
We also investigated the effect of the interventions studied on treatment retention. This outcome is important because withdrawing treatment and scheduled visits can suggest relapse to cocaine use. Psychostimulants probably make little or no difference when compared with placebo (moderate quality of evidence)
Psychostimulants appear well tolerated and are not associated with serious adverse events. Furthermore, psychostimulants show more favourable outcomes for some groups of patients, such as methadone‐maintained, dual heroin‐cocaine addicts, for whom there were positive results on both cocaine and heroin use.
Quality of the evidence
We did not consider any study to be free from risk of bias. We judged the quality of evidence to be very low for the outcomes of cocaine use and sustained abstinence but moderate for retention in treatment.
University researchers performed all studies with public funding, although eight of them also had additional private funding.
Conclusions
The efficacy of psychostimulants for cocaine dependence is not entirely clear, but these treatments appear promising and deserve further investigation.
Authors' conclusions
Summary of findings
| Psychostimulants for cocaine dependence | ||||||
| Patient or population: people with cocaine dependence Comparison: placebo | ||||||
| Outcomes | Illustrative comparative risks* (95% CI) | Relative effect | No of participants | Quality of the evidence | Comments | |
| Assumed risk | Corresponding risk | |||||
| Control | Psychostimulants | |||||
| Cocaine use assessed by the mean (SD) proportion of cocaine‐free urinalysis across the study per participant | — | The mean cocaine use assessed by the mean (SD) of the proportion of cocaine‐free urinalysis across the study per participant in the intervention groups was | — | 526 | ⊕⊝⊝⊝ | SMD 0.16 (−0.02 to 0.33) |
| Sustained cocaine abstinence | Study population | RR 1.36 | 1549 | ⊕⊝⊝⊝ | — | |
| 164 per 1000 | 224 per 1000 | |||||
| Moderate | ||||||
| 147 per 1000 | 200 per 1000 | |||||
| Number of participants who finished the study | Study population | RR 1.00 | 2205 | ⊕⊕⊕⊝ | — | |
| 566 per 1000 | 566 per 1000 | |||||
| Moderate | ||||||
| 542 per 1000 | 542 per 1000 | |||||
| *The basis for the assumed risk (e.g. the median control group risk across studies) is provided in footnotes. The corresponding risk (and its 95% confidence interval) is based on the assumed risk in the comparison group and the relative effect of the intervention (and its 95% CI). | ||||||
| GRADE Working Group grades of evidence | ||||||
| aAttrition bias was unclear or high for all the included studies. | ||||||
Background
The overall prevalence of cocaine use disorders has been declining over the last several years after decades of uninterrupted increase. This is mainly a reflection of trends in Europe and the Americas (UNDOC 2015). In the USA, there were 1.5 million current cocaine users aged 12 or older (0.6% of the population) in 2013, and 855,000 people had experienced past year dependence or abuse (0.3% of the population) (SAMSHA 2014). In the European Union (EU), cocaine is the most commonly used illicit stimulant drug, although most users live in just a few member states. In 2014, EMCDDA 2015 estimated that about 15.6 million, or 4.6% of adults aged 15 to 64 years, had used cocaine at some point in their lifetime, and 3.4 million, or 1% of adults, had used cocaine in the previous year.
Cocaine also remained the primary drug of concern in Latin America and the Caribbean in 2013, and in Australia since 2004 more people have been using cocaine but with less frequency. Use in Asia is low, at a prevalence of 0.05% among the population aged 14 to 65 years. Thus, the estimated annual prevalence of cocaine use by region is 0.4% in Africa, 1.4% in the Americas, 0.05% in Asia, 0.7% in Europe and 1.6% in Oceania (UNDOC 2015).
In 2013, 584,000 Americans aged 12 or older reported receiving treatment for cocaine use in the previous year (SAMSHA 2014). In Europe, cocaine was cited as the primary drug for 13% of all people who entered specialised drug treatment in 2013 (55,000), and for 16% of those entering treatment for the first time (25,000). Spain, Italy and the United Kingdom were the EU countries treating most of the people (EMCDDA 2015).
The prevalence of cocaine use and cocaine use disorders is particularly high in vulnerable groups, such as people with attention deficit/hyperactivity disorder (ADHD) or opioid dependence. Prevalence studies in people with substance use disorders have shown ADHD rates of 23.1% (Van Emmerik‐Van Oortmerssen 2012). Among cocaine abusers seeking treatment, lifetime ADHD prevalence ranges from 9.9% to 34.6%, depending on the study (Van Emmerik‐Van Oortmerssen 2012). Dual dependence on both opiates and cocaine occurs in about 60% of people admitted to methadone maintenance treatment in the USA and negatively impacts prognosis (Kosten 2003). A broad range of people (24% to 66%) receiving office‐based buprenorphine treatment for opioid dependence are also cocaine users (Chinazo 2014). Furthermore, cocaine dependence is also prevalent in the needle exchange programs for opioid abusers (Kidorf 2004).
Description of the condition
Cocaine use disorders comprised two clinical entities in the fourth edition of the Diagnostic and Statistical Manual of Mental Disorders (DSM‐IV) (American Psychiatric Association 2000): cocaine abuse and cocaine dependence. While cocaine abuse was characterised by hazardous cocaine use, DSM‐IV defined cocaine dependence as compulsive drug use that could result in tolerance or withdrawal. In the current DSM‐5 classification (American Psychiatric Association 2013), no distinction exists between abuse and dependence, and cocaine use disorder – a pattern of cocaine use leading to significant impairment and distress – is included among other stimulant use disorders. Cocaine use can be accompanied by drug craving (strong desire or urge for consumption), tolerance and development of withdrawal symptoms. Clinicians specify how severe (mild, moderate and severe) the cocaine disorder is depending on the number of symptoms.
From a biological point of view, cocaine addiction appears as a dopaminergic, glutamatergic and GABAergic dysregulation. Cocaine is a dopamine (DA) and also a norepinephrine (NE) reuptake inhibitor, and thus it increases DA in the nucleus accumbens, a process that has been associated with drug‐reinforcing properties (Koob 1988; Volkow 1997a). With repeated cocaine use, studies have reported a down‐regulation of both DA release and DA2 receptors in striatum (Volkow 1990; Volkow 1996; Volkow 1997b; Volkow 2004). The dopaminergic dysfunction could explain the appearance of tolerance and withdrawal. Additionally, glutamate hyperactivity also takes place, mainly in the prefrontal cortex and amygdala, which have projections to nucleus accumbens (Kalivas 2005). This glutamatergic dysfunction could be involved in the two remaining cocaine dependence characteristics: a compulsive pattern of cocaine use and relapse to cocaine use after a cocaine‐free period (Kalivas 2005). Furthermore, the output from the accumbens to the ventral pallidum is GABAergic and peptidergic, and decreased GABA release in the ventral pallidum has been associated with cocaine‐seeking behaviour (Kalivas 2007).
Description of the intervention
Given that DA, glutamate and GABA are involved in the neurobiology of cocaine use disorders, drugs modulating the action of these neurotransmitters are reasonable candidates for treating the conditions. DA has a pivotal role in establishing addictive behaviour, so many studies have tested dopaminergic drugs for treating cocaine addiction, with diverse approaches targeting DA, ranging from administration of cocaine like‐drugs (replacement therapy) to treating people with agonist or antagonists of dopamine receptors (Kalivas 2007). Given the successful results of replacement therapy in heroin, described in Mattick 2009, and in nicotine dependence (Hartmann‐Boyce 2014), the use of cocaine like‐drugs, such as central nervous system (CNS) stimulants, could be the most promising strategy.
Replacement therapy involves substituting the abused, often illegal drug, which users take parenterally several times a day, with a legal, orally administered one with a longer half‐life. A substitute drug has a similar mechanism of action and behavioural effect as the abused one but has a lower addictive potential and blocks drug craving and withdrawal, leading to drug abstinence and favouring adherence to medical and psychological assistance (Gorelick 2004; Grabowski 2004b).
How the intervention might work
CNS stimulants indirectly increase DA, and if administered orally with long‐lasting compounds, they could normalise the DA dysfunction associated with cocaine addiction. Over the last decade, replacement therapy with CNS stimulants has been gaining support (Gorelick 2004). Studies have assessed several CNS stimulants for cocaine abuse, including in people with comorbid disorders such as ADHD or opioid dependence (Castells 2007; Cunill 2015; Perez de los Cobos 2014).
Why it is important to do this review
Different studies have investigated around 50 drugs for treating cocaine dependence, but none of them have clearly demonstrated efficacy (Kleber 2007; Minozzi 2015a; Minozzi 2015b; Pani 2011). Consequently, neither the Food and Drug Administration (FDA) nor the European Medicines Agency (EMA) has approved any medication for the treatment of cocaine use disorders. However, since promising results have been shown with CNS stimulants (Castells 2007), several clinical trials on these drugs are currently underway.
Objectives
To assess the effects of psychostimulants for cocaine abuse and dependence. Specific outcomes include sustained cocaine abstinence and retention in treatment. We also studied the influence of type of drug and comorbid disorders on psychostimulant efficacy.
Methods
Criteria for considering studies for this review
Types of studies
We included only randomised parallel group placebo‐controlled clinical trials.
Types of participants
Participants were community adults meeting DSM criteria (regardless of edition) for cocaine abuse or dependence. We also included studies enrolling patients with comorbid conditions (i.e. psychiatric comorbidity or opioid dependence).
Types of interventions
Experimental intervention
CNS stimulants for cocaine abuse. Because "psychostimulant" and "CNS stimulant" are not terms describing a pharmacological group but a pharmacological effect, there is not a single list of drugs with this effect. Instead, drug classification systems such as the Anatomical Therapeutic Chemical (ATC) Classification and the American Hospital Formulary Service (AHFS) Pharmacologic‐Therapeutic Classification System divide CNS stimulants into several groups according to their main indication (AHFS 2014; ATC 2015). To identify a complete list of drugs with psychostimulant effect, we performed a search among all drugs belonging to groups or subgroups suspected of containing potential psychomotor stimulants. In the ATC classification, these pharmacological groups were N06BA (centrally acting sympathomimetics), A08AA (centrally acting antiobesity products), N06BC (xanthine derived), N06BX (other psychostimulants and nootropics), N07BA (drugs used in nicotine dependence) and R03DA (xanthines) from t. In the AHFS classification, the groups were 12:92 (miscellaneous autonomic drugs), 28:16.04.92 (antidepressants, miscellaneous), 28:20.04 (amphetamines), 28:20.92 (anorexigenic agents and respiratory and cerebral stimulants, miscellaneous) and 86:16 (respiratory smooth muscle relaxants). We also included drugs metabolised to a known psychostimulant such as selegiline, and we reviewed the World Anti‐Doping Agency (WADA) list (WADA 2016) and other sources of information in pharmacology and psychopharmacology (Brayfield 2014; Brunton 2011). From this list of potential CNS stimulants, we included only those drugs having at least one published study showing a CNS stimulant effect in our definitive list of psychostimulants. We defined a CNS stimulant effect as increased CNS activity resulting in fatigue relief, improved performance in simple tasks, increased locomotor activity and anorexia in healthy people.
Control intervention
Placebo.
Types of outcome measures
Primary outcomes
-
Reduction of cocaine use, assessed by mean (standard deviation (SD)) proportion of negative urinalysis across the study per participant
-
Sustained cocaine abstinence (number of patients who achieved sustained cocaine abstinence)
-
Retention in treatment (number of patients who finished the study)
Secondary outcomes
Efficacy
-
Self‐reported cocaine use
-
Cocaine craving (assessed by a quantitative scale)
-
Survival
-
Clinical severity assessed by the Clinical Global Impression (investigator‐ and participant‐rated)
-
Endpoint severity
-
Improvement
-
Proportion achieving substantial clinical improvement
-
-
Depression symptoms assessed by a standardised instrument
For studies including dual opioid‐cocaine abusers
-
Heroin use assessed by mean (SD) proportion of negative urinalysis across the study per patient
-
Sustained heroin abstinence (number of participants who achieved sustained heroin abstinence)
-
Self‐reported heroin use
For studies including dual ADHD patients‐cocaine abusers
-
ADHD symptoms severity assessed by a standardised instrument
Safety outcomes
-
Number of patients who dropped out the study due to any adverse event
-
Number of patients who dropped out the study due to any cardiovascular adverse events
-
Number of patients who abused study medication
-
Number of patients experiencing any serious advers event
Search methods for identification of studies
Electronic searches
In Appendix 1, we have listed the search methods we used in the original review (Castells 2010).
For the update, we searched the following databases.
-
Cochrane Drugs and Alcohol Group (CDAG) Specialised Register (searched 21 January 2014 in CRSLive).
-
CENTRAL (2016, Issue 1) using the search strategy outlined in Appendix 3.
-
MEDLINE (PubMed) (from 2008 to 15 February 2016) using the search strategy outlined in Appendix 4.
-
Embase (Elsevier, EMBASE.com) (from 2008 to 15 February 2016) using the search strategy outlined in Appendix 5.
-
Web of Science (Thomson Reuters) (from 2008 to 15 February 2016) using the search strategy outlined in Appendix 6.
We searched and identified for ongoing clinical trials and unpublished studies via Internet searches on the following sites.
-
centerwatch.com (searched 15 February 2016).
-
clinicaltrials.gov (searched 15 February 2016).
-
www.isrctn.com (searched 15 February 2016).
-
www.who.int/ictrp (searched 15 February 2016).
Searching other resources
Personal contact
We asked the corresponding authors of all included studies, along with experts in the field and pharmaceutical companies, to identify other published, unpublished or ongoing trials.
Citations
-
We handsearched the reference lists of retrieved studies and relevant review articles to identify any further studies.
-
For each included study, we performed a citation search in the Institute for Scientific Information (ISI) Web of Science to identify any later studies that may have cited it.
All searches included non‐English language literature and studies with English abstracts. When we considered that the reports were likely to meet inclusion criteria, we had them translated.
Data collection and analysis
Selection of studies
Three review authors (of XC, RC and CP) inspected abstracts of potentially relevant studies and retrieved the full text of those studies deemed to be relevant. When we identified unpublished trials, we contacted the coordinators to request data.
Data extraction and management
Three review authors (XC, RC, CP) inspected the full text of retrieved papers using a piloted data extraction sheet. We resolved any disagreement by consensus or appeal to a fourth author (DC). In case of missing information, we emailed authors to request missing data. If we did not receive an answer within a month of the first email, we made a second attempt.
We extracted the following data.
-
Study description and funding.
-
Author.
-
Year of publication.
-
Country.
-
Author affiliation: pharmaceutical industry (yes/no).
-
Study funding: pharmaceutical industry (yes/no).
-
-
Methods.
-
Sequence generation.
-
Allocation concealment.
-
Blinding of patients/clinicians/therapists/assessors.
-
Design: single site/multisite.
-
Study duration (from randomisation to treatment completion).
-
Number of participants.
-
Handling of drop‐outs (intention‐to‐treat (ITT) versus per protocol)
-
Instruments administered to assess study outcomes.
-
-
Participants.
-
Inclusion/exclusion criteria.
-
Sex.
-
Age (mean, SD).
-
Ethnicity (% white, % African American, % other).
-
Employment status (% unemployed).
-
Comorbid disorders (% with comorbid psychiatric disorders).
-
-
Intervention.
-
Type of CNS stimulant.
-
Dose.
-
Pharmaceutical presentation.
-
Adherence (by method used to assess treatment adherence).
-
Adjunc psychological interventions (description of the adjunct psychological interventions).
-
-
Outcomes.
-
Cocaine use by means of urine screen (mean (SD) proportion of cocaine‐free urinalysis across the study per patient)
-
Sustained cocaine abstinence. The number of patients achieving sustained cocaine abstinence, assessed with urinalysis, regardless of the definition used for of the length of abstinence.
-
Number of patients who finished the study.
-
Self‐reported cocaine use (mean (SD) days of cocaine use across the study).
-
Cocaine craving (mean (SD) cocaine craving score at study conclusion).
-
Clinical impression (number of patients obtaining a clinical global impression (CGI) score of 1 or 2 at study conclusion)
-
Anxiety symptoms severity (mean (SD) cocaine anxiety score at study conclusion)
-
Depression symptoms severity (mean (SD) cocaine depression score at study conclusion)
-
Heroin use by means of urine screen (mean (SD) proportion of heroin‐free urinalysis across the study per patient)
-
Sustained heroin abstinence. The number of patients achieving sustained heroin abstinence (regardless how studies define length of abstinence), assessed with urinalysis.
-
Self‐reported heroin use (mean (SD) days of heroin use across the study).
-
ADHD severity (mean ADHD (SD) at study conclusion and number of patients achieving a 30% decrease in the ADHD severity score).
-
Participants who dropped out due to adverse events (number of patients who dropped out due to any adverse event, number of patients who dropped out due to cardiovascular adverse events).
-
Number of patients who had serious adverse events.
-
Number of patients who abused study medication.
-
Assessment of risk of bias in included studies
We assessed the risk of bias in this review using the criteria recommended in the Cochrane Handbook for Systematic Reviews of Interventions (Higgins 2011) (see Table 1). The recommended approach for assessing risk of bias in studies included in Cochrane reviews uses a two‐part tool, addressing seven specific domains, namely sequence generation, allocation concealment (both pertaining to selection bias), blinding of participants and providers (performance bias), blinding of outcome assessors (detection bias), incomplete outcome data (attrition bias), selective outcome reporting (reporting bias) and other sources of bias. The first part of the tool involves describing what investigators reported happening in the study. The second part of the tool involves assigning judgement of high, low or unclear the risk of bias for that entry. To make these judgments, we used the criteria indicated by Higgins 2011 and adapted it to the addiction field. See Table 1 for details.
| Item | Judgment | Description |
| 1. Random sequence generation (selection bias) | Low risk | The investigators describe a random component in the sequence generation process such as: random number table; computerised random number generator; coin tossing; shuffling cards or envelopes; throwing dice; drawing of lots; minimisation. |
| High risk | The investigators describe a non‐random component in the sequence generation process such as: odd or even date of birth; date (or day) of admission; hospital or clinic record number; alternation; judgement of the clinician; results of a laboratory test or a series of tests; availability of the intervention. | |
| Unclear risk | Insufficient information about the sequence generation process to permit judgement of low or high risk | |
| 2. Allocation concealment (selection bias) | Low risk | Investigators enrolling participants could not foresee assignment because 1 of the following, or an equivalent method, was used to conceal allocation: central allocation (including telephone, web‐based, and pharmacy‐controlled, randomisation); sequentially numbered drug containers of identical appearance; sequentially numbered, opaque, sealed envelopes. |
| High risk | Investigators enrolling participants could possibly foresee assignments because 1 of the following methods was used: open random allocation schedule (e.g. a list of random numbers); assignment envelopes without appropriate safeguards (e.g. if envelopes were unsealed or nonopaque or not sequentially numbered); alternation or rotation; date of birth; case record number; any other explicitly unconcealed procedure. | |
| Unclear risk | Insufficient information to permit judgement of low or high risk. This is usually the case if the method of concealment is not described or not described in sufficient detail to allow a definite judgement. | |
| 3. Blinding of participants and providers (performance bias) Objective outcomes | Low risk | No blinding or incomplete blinding, but the review authors judge that the outcome is not likely to be influenced by lack of blinding; Blinding of participants and key study personnel ensured, and unlikely that the blinding could have been broken. |
| High risk | No blinding or incomplete blinding, and the outcome is likely to be influenced by lack of blinding; Blinding of key study participants and personnel attempted, but likely that the blinding could have been broken, and the outcome is likely to be influenced by lack of blinding | |
| Unclear risk | Insufficient information to permit judgement of low or high risk | |
| 4. Blinding of participants and providers (performance bias) Subjective outcomes | Low risk | Blinding of participants and providers ensured and unlikely that the blinding could have been broken |
| High risk | No blinding or incomplete blinding, and the outcome is likely to be influenced by lack of blinding; Blinding of key study participants and personnel attempted, but likely that the blinding could have been broken, and the outcome is likely to be influenced by lack of blinding | |
| Unclear risk | Insufficient information to permit judgement of low or high risk | |
| 5. Blinding of outcome assessor (detection bias) Objective outcomes | Low risk | No blinding of outcome assessment, but the review authors judge that the outcome measurement is not likely to be influenced by lack of blinding Blinding of outcome assessment ensured, and unlikely that the blinding could have been broken |
| High risk | No blinding of outcome assessment, and the outcome measurement is likely to be influenced by lack of blinding; Blinding of outcome assessment, but likely that the blinding could have been broken, and the outcome measurement is likely to be influenced by lack of blinding | |
| Unclear risk | Insufficient information to permit judgement of low or high risk | |
| 6.Blinding of outcome assessor (detection bias) Subjective outcomes | Low risk | Blinding of outcome assessment ensured, and unlikely that the blinding could have been broken |
| High risk | No blinding of outcome assessment, and the outcome measurement is likely to be influenced by lack of blinding; Blinding of outcome assessment, but likely that the blinding could have been broken, and the outcome measurement is likely to be influenced by lack of blinding | |
| Unclear risk | Insufficient information to permit judgement of low or high risk | |
| 7. Incomplete outcome data (attrition bias) For all outcomes except retention in treatment | Low risk | No missing outcome data; Reasons for missing outcome data unlikely to be related to true outcome (for survival data, censoring unlikely to introduce bias); Missing outcome data balanced in numbers across intervention groups, with similar reasons for missing data across groups; For dichotomous outcome data, the proportion of missing outcomes compared with observed event risk not enough to have a clinically relevant impact on the intervention effect estimate; For continuous outcome data, plausible effect size (difference in means or standardised difference in means) among missing outcomes not enough to have a clinically relevant impact on observed effect size; Missing data have been imputed using appropriate methods; All randomised participants are reported/analysed in the group they were allocated to by randomisation irrespective of non‐adherence and co‐interventions (intention‐to‐treat) |
| High risk | Reason for missing outcome data likely to be related to true outcome, with either imbalance in numbers or reasons for missing data across intervention groups; For dichotomous outcome data, the proportion of missing outcomes compared with observed event risk enough to induce clinically relevant bias in intervention effect estimate; For continuous outcome data, plausible effect size (difference in means or standardised difference in means) among missing outcomes enough to induce clinically relevant bias in observed effect size; 'As‐treated' analysis done with substantial departure of the intervention received from that assigned at randomisation. | |
| Unclear risk | Insufficient information to permit judgement of low or high risk (e.g. number randomised not stated, no reasons for missing data provided; number of dropouts not reported for each group) | |
| 8. Selective reporting (reporting bias) | Low risk | The study protocol is available and all of the study's pre‐specified (primary and secondary) outcomes that are of interest in the review have been reported in the pre‐specified way; The study protocol is not available but it is clear that the published reports include all expected outcomes, including those that were pre‐specified (convincing text of this nature may be uncommon). |
| High risk | Not all of the study’s pre‐specified primary outcomes have been reported; 1 or more primary outcomes is reported using measurements, analysis methods or subsets of the data (e.g. subscales) that were not pre‐specified; 1 or more reported primary outcomes were not pre‐specified (unless clear justification for their reporting is provided, such as an unexpected adverse effect); 1 or more outcomes of interest in the review are reported incompletely so that they cannot be entered in a meta‐analysis; The study report fails to include results for a key outcome that would be expected to have been reported for such a study. | |
| Unclear risk | Insufficient information to permit judgement of low or high risk | |
| 9. Other bias | Low risk | The study appears to be free from other sources of bias. |
| High risk | There is at least 1 important risk of bias. For example, the study: Had a potential source of bias related to the specific study design used; Stopped early due to some data‐dependent process (including a formal‐stopping rule); Had extreme baseline imbalance; Has been claimed to have been fraudulent; or Had some other problem. | |
| Unclear risk | There may be a risk of bias, but there is either: Insufficient information to assess whether an important risk of bias exists; or Insufficient rationale or evidence that an identified problem will introduce bias. |
The tool contains a single entry for the domains of sequence generation and allocation concealment (avoidance of selection bias) for each study. We considered blinding of participants, personnel and outcome assessors (avoidance of performance bias and detection bias) separately for objective outcomes (e.g. dropout, use of substance of abuse measured by urinalysis, participants relapsed at the end of follow‐up, participants engaged in further treatments) and subjective outcomes (e.g. duration and severity of signs and symptoms of withdrawal, craving, self‐reported use of substance, side effects, social functioning as integration at school or at work, family relationship). We considered incomplete outcome data (avoidance of attrition bias) for all outcomes except retention in treatment, which, by definition, is not affected by this source of bias.
Measures of treatment effect
We introduced treatment effect measures into Review Manager (RevMan) 5 to pool data. We calculated three different measures of treatment effect.
We calculated count data, such as the efficacy on drug use, as continuous data. We extracted the mean (SD) proportion of drug free‐urinalysis over the planned number of urinalyses per patient, comparing active treatment and placebo groups. We did not compare the proportion of negative urinalysis between active intervention and placebo. We calculated the standardised mean difference (SMD) for each comparison to allow combination.
For categorical efficacy outcomes, such as sustained drug abstinence, we calculated the risk ratio (RR) for each comparison.
For categorical safety outcomes, such as the number of patients who dropped out of the study due to any adverse event, we calculated the risk difference (RD). We preferred RD to RR because several studies had no events for either the active or control interventions, preventing us from calculating the RR for these studies, which would have resulted in an overestimation of the intervention effect on adverse event‐induced dropouts. We calculated 95% confidence intervals (CI) for each measure of treatment effect.
Unit of analysis issues
We handled studies with multiple comparisons as follows. When several independent comparisons were available, for example, methylphenidate + psychotherapy versus placebo + psychotherapy versus methylphenidate + fake psychotherapy versus placebo + fake psychotherapy, we included them as two independent studies (methylphenidate + psychotherapy versus placebo + psychotherapy, on the one hand, and methylphenidate + fake psychotherapy versus placebo + fake psychotherapy, on the other). In studies with multiple and correlated interventions (for example, methylphenidate 20 mg versus methylphenidate 40 mg versus placebo), we combined experimental groups into a single group and included it in the meta‐analysis as a single comparison. For binary data, we added sample sizes and the number of participants with the event across groups. We combined continuous data using the formulae described in section 7.7.3.8, 'Combining groups' of the Cochrane Handbook for Systematic Reviews of Interventions (Higgins 2011).
There were no unit of analysis issues regarding the inclusion of cross‐over clinical trials because we excluded such trials from the review.
Dealing with missing data
We used the ITT sample size as a denominator for categorical variables, such as the number of patients achieving sustained cocaine abstinence.
For continuous data, we entered the sample size used in the calculations of the mean and SD into RevMan.
We did not impute missing data.
Assessment of heterogeneity
We investigated heterogeneity by means of the I2 and Chi2 statistic.
Assessment of reporting biases
We constructed funnel plots to investigate any relationship between effect size and study precision (closely related to sample size). Such a relationship could be due to publication or related biases or due to systematic differences between small and large studies. If we identified a relationship, we examined clinical diversity of the studies as a possible explanation (Egger 1997).
If we found a statistically significant result, we calculated the number of negative studies with an average sample size needed to neutralise this effect.
Data synthesis
We used the random‐effects model to calculate weighted averages and 95% CIs.
Subgroup analysis and investigation of heterogeneity
Regardless of the existence of statistical heterogeneity, we planned the following subgroup analyses.
-
Type of CNS stimulant: amphetamine derivative, bupropion, modafinil, etc.
-
Clinical definition of cocaine use disorder: are cocaine abusers included? Yes/no.
-
Comorbidities: was the presence of a comorbidity (opioid dependence, ADHD) an inclusion criterion? Yes/no.
-
Study quality and risk of bias: high and unclear risk of bias versus low.
-
Type of administered scales: self‐ versus hetero‐administered.
-
Single site versus multisite.
-
Funding: with versus without pharmaceutical industry funding.
We performed subgroup analyses only when results from at least two studies were available.
We did not perform the analysis of the influence of the type of administered scale because there were too few studies reporting suitable outcomes for this subanalysis (depression symptoms and ADHD severity).
Likewise, we did not undertake the analysis of the impact of the source of funding because all studies were publicly funded, and pharmaceutical industry funding only involved the supply of study medication in a few studies.
Sensitivity analysis
We carried out a sensitivity analysis for safety outcomes. We calculated the RR instead of the RD used in the primary analyses.
Summary of findings table
We assessed the overall quality of the evidence for the primary outcomes using the GRADE system, which takes into account issues not only related to internal validity but also to external validity, such as directness of results (GRADE 2004; Guyatt 2008; Guyatt 2011; Schunemann 2006). The 'Summary of findings' tables present the main findings of a review in a transparent and simple tabular format, providing key information concerning the quality of evidence, the magnitude of effect of the interventions examined and the sum of available data on the main outcomes.
The GRADE system uses the following criteria for assigning grades of evidence.
-
High: further research is very unlikely to change our confidence in the estimate of effect.
-
Moderate: further research is likely to have an important impact on our confidence in the estimate of effect and may change the estimate.
-
Low: further research is very likely to have an important impact on our confidence in the estimate of effect and is likely to change the estimate.
-
Very low: any estimate of effect is very uncertain.
The following reasons merit the downgrading of evidence: serious (−1) or very serious (−2) limitation to study quality; important inconsistency (−1); some (−1) or major (−2) uncertainty about directness; imprecise or sparse data (−1); and high probability of reporting bias (−1).
Results
Description of studies
Results of the search
This is an update of a Cochrane review first published in 2010 (Castells 2010). In the first version of this review, we retrieved 32 full‐text articles for more detailed evaluation; we excluded half of them, thus including 16 trials that satisfied all the criteria for inclusion in the review.
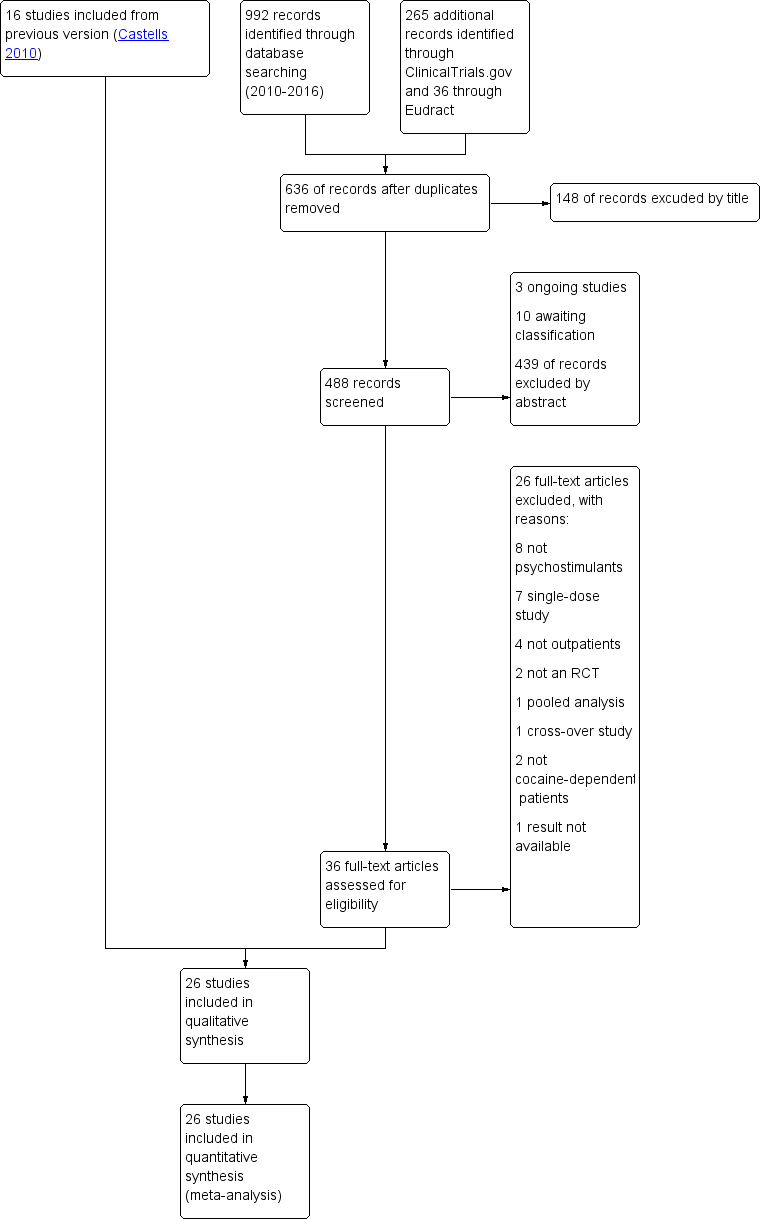
In the present update, we identified 488 reports, 3 of which were ongoing studies, 10 were awaiting classification and 439 were excluded on the basis of title and abstract. We inspected the full text of 36 studies and excluded 26. Thus, we identified and included 10 new studies in this update, in addition to the 16 studies included in the previous version (see Figure 1).

Study flow diagram.
Included studies
Twenty‐six studies met the inclusion criteria of this review. All studies investigated a psychostimulant drug intervention, but two had a factorial design and also assessed the efficacy of a behavioural intervention (Dürsteler‐MacFarland 2013; Poling 2006). One study compared two CNS stimulants against placebo (Schmitz 2012). In eleven studies, the presence of a comorbid psychiatric disorder was an inclusion criteria: opioid dependence in six (Dürsteler‐MacFarland 2013; Grabowski 2004a; Margolin 1995a; Margolin 1995b; Margolin 1997; Poling 2006), ADHD in three (Levin 2007; Levin 2015; Schubiner 2002), and alcohol dependence and schizophrenia in one each (NCT00142818; Perry 2004). University researchers performed all studies, 17 with public funding (Anderson 2009; Dürsteler‐MacFarland 2013; Elkashef 2006; Grabowski 1997; Grabowski 2001; Grabowski 2004a; Kampman 2015; Levin 2007; Levin 2015; Mooney 2009; Mooney 2015; Morgan 2016; Poling 2006; Schmitz 2012; Schmitz 2014; Schubiner 2002; Shoptaw 2008), and 8 with both public and private funding (Dackis 2005; Dackis 2012; Margolin 1995a; Margolin 1995b; Margolin 1997; Perry 2004; Shearer 2003; Stine 1995). One study did not describe the funding source (NCT00142818).
Participants
The included studies randomised 2366 participants, mostly middle aged (mean age 39.6 years) men (74.7%). About half (47.6%) were African American, and 39.3% were white. Mean lifetime cocaine use ranged from 7.7 to 22.4 years. Thirteen studies reported the route of cocaine use, with inhalation being the most common (60.8%). See Table 2 for details on additional participant characteristics.
| Sample size (N) | 2366 |
| Sex % female | 25.3 |
| Age Mean age (years) | 39.6 |
| Ethnicity % white % black % other | 39.3 47.6 13.1 |
| Employment status % currently employed | 39.3 |
| Days of cocaine use/month Range | 10.6‐17.8 |
| Length of cocaine use Range of mean lifetime cocaine use (years) | 7.7‐22.4 |
| Route of cocaine use % intranasal % intrapulmonary % intravenous | 23.8 60.8 14.7 |
| Comorbidities % opioid dependence % alcohol dependence | 21.4 10.4 |
aBaseline patient characteristics are presented for trials reporting this information. Sex was available for all studies; age for all studies but one; ethnicity, for 22 studies; the presence of opioid and alcohol dependence, for 24 and 19, respectively; lifetime cocaine use, for 17; days of cocaine use in a month, for 15; employment, for 9; and route of cocaine use, for 13.
Interventions and settings
Investigators assessed nine drugs: bupropion in three studies (Margolin 1995a; Poling 2006; Shoptaw 2008), dexamphetamine in four (Grabowski 2001; Grabowski 2004a; Schmitz 2012; Shearer 2003), lisdexamfetamine in one (Mooney 2015), methylphenidate in four (Dürsteler‐MacFarland 2013; Grabowski 1997; Levin 2007; Schubiner 2002), modafinil in eight (Anderson 2009; Dackis 2005; Dackis 2012; Kampman 2015; Morgan 2016; NCT00142818; Schmitz 2012; Schmitz 2014), mazindol infour (Margolin 1995b; Margolin 1997; Perry 2004; Stine 1995), methamphetamine in one (Mooney 2009), mixed amphetamine salts in one (Levin 2015), and selegiline in one (Elkashef 2006).
Participants received psychotherapy in addition to the studied intervention in all studies: in 13, they received cognitive behavioural therapy (CBT); in 5, counselling; in 1, CBT + counselling; in 3, CBT + contingency management (CM); in 1, modified CBT + motivational intervention; in 1, psychoeducation + relapse prevention therapy + CBT; and in 1, case management + behavioural contingency + group psychotherapy. One study randomised participants to CBT or to CM in addition to pharmacological treatment with methylphenidate or placebo.
Eight studies were multicentre trials (Anderson 2009; Dürsteler‐MacFarland 2013; Elkashef 2006; Levin 2007; Levin 2015; Margolin 1995a; Shearer 2003; Stine 1995), seventeen single‐centre (Dackis 2005; Dackis 2012; Grabowski 1997; Grabowski 2001; Grabowski 2004a; Kampman 2015; Margolin 1995b; Margolin 1997; Mooney 2009; Mooney 2015; Morgan 2016; Perry 2004; Poling 2006; Schmitz 2012; Schmitz 2014; Schubiner 2002; Shoptaw 2008), and one did not specify the number of study sites (NCT00142818). All studies took place in the USA except Shearer 2003 and Dürsteler‐MacFarland 2013, which were performed in Australia and Switzerland, respectively.
Study length ranged from 6 to 24 weeks, with an average length of 12.6 weeks.
Excluded studies
We excluded 38 studies from this review (See Characteristics of excluded studies and Figure 1). Eleven were not randomised, placebo‐controlled clinical trials, eight were RCTs that investigated pharmacological interventions other than psychostimulants, seven were RCTs that administered a single dose of psychostimulants, four were RCTs that included only inpatients, four did not include cocaine‐dependent patients, one was an RCT with a cross‐over design, another was a pooled analysis of RCTs, another did not report the results, and a final one was a laboratory study without outpatient follow‐up.
Risk of bias in included studies
We present a comprehensive description of the risk of bias for each study in the Characteristics of included studies and a summary in Figure 2 and Figure 3.

Methodological quality graph: review authors' judgements about each methodological quality item presented as percentages across all included studies.
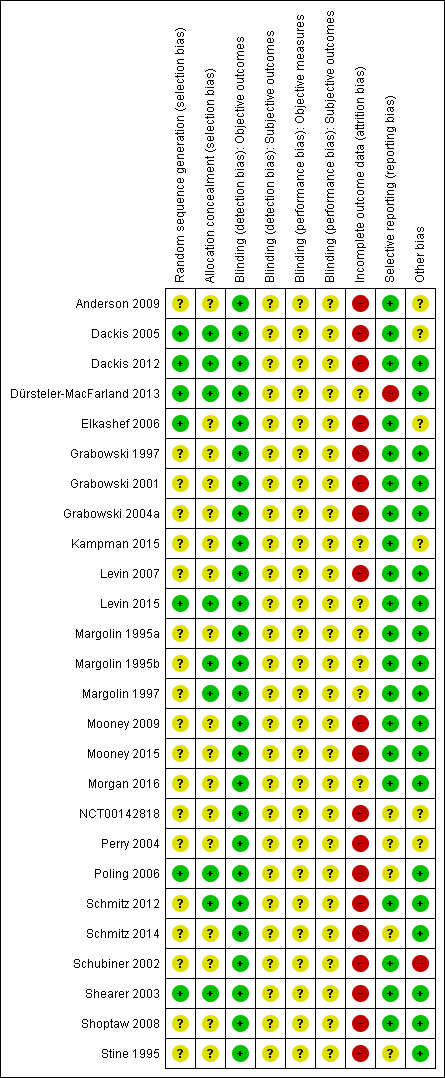
Methodological quality summary: review authors' judgements about each methodological quality item for each included study.
Allocation
We deemed sequence generation and allocation concealment to be adequate in seven studies (Dackis 2005; Dackis 2012; Dürsteler‐MacFarland 2013; Elkashef 2006; Levin 2015; Poling 2006; Shearer 2003) and nine studies (Dackis 2005; Dackis 2012; Dürsteler‐MacFarland 2013; Levin 2015; Margolin 1995b; Margolin 1997; Poling 2006; Schmitz 2012; Shearer 2003), respectively. In the remaining studies, the risk of bias due to sequence generation and allocation concealment was unclear.
Blinding
Since the pharmacological interventions studied have powerful behavioural effects that may reveal the assigned intervention, we could not rule out the risk of performance and detection bias on subjective outcomes. For the same reason, we rated performance bias on objective outcomes to be unclear. Conversely, we considered the risk of detection bias to be low for objective outcomes because the measure of this type of outcomes is unlikely to be influenced by the awareness of the studied intervention.
Incomplete outcome data
We assessed 19 studies as being at high risk of attrition bias (Anderson 2009; Dackis 2005; Dackis 2012; Elkashef 2006; Grabowski 1997; Grabowski 2001; Grabowski 2004a; Levin 2007; Mooney 2009; Mooney 2015, NCT00142818; Perry 2004; Poling 2006; Schmitz 2012; Schmitz 2014; Schubiner 2002; Shearer 2003; Shoptaw 2008; Stine 1995) and 7 as being at unclear risk (Dürsteler‐MacFarland 2013; Kampman 2015; Levin 2015; Margolin 1995a; Margolin 1995b; Margolin 1997; Morgan 2016).
Selective reporting
We considered the risk of reporting bias to be low in 20 studies (Anderson 2009; Dackis 2005; Dackis 2012; Elkashef 2006; Grabowski 1997; Grabowski 2001; Grabowski 2004a; Kampman 2015; Levin 2007; Levin 2015; Margolin 1995a; Margolin 1995b; Margolin 1997; Mooney 2009; Mooney 2015; Morgan 2016; Schmitz 2012; Schubiner 2002; Shearer 2003; Shoptaw 2008), high in 1 (Dürsteler‐MacFarland 2013), and unclear in the remaining five.
Other potential sources of bias
Seventeen studies were free of other biases. Schubiner 2002 excluded patients from the analysis, so we considered it to be at high risk of bias. Five had unbalanced participantcharacteristics at baseline, so we considered the risk of bias to be unclear (Anderson 2009; Dackis 2005; Elkashef 2006; Kampman 2015; Perry 2004). NCT00142818 did not provided sufficient information to permit judgment, so we also considered it to be at unclear risk.
Effects of interventions
See: Summary of findings for the main comparison Psychostimulants for cocaine dependence
We compared any psychostimulant versus placebo, and we present primary outcomes in Figure 4, Figure 5, Figure 6 and in the summary of findings Table for the main comparison.

Forest plot of comparison: 1 Psychostimulants vs placebo: primary analysis, outcome: 1.1 Cocaine use assessed by the mean (SD) proportion of cocaine‐free urinalyses across the study per patient.

Forest plot of comparison: 1 Psychostimulants vs placebo: primary analysis, outcome: 1.2 Sustained cocaine abstinence.

Forest plot of comparison: 1 Psychostimulants vs placebo: primary analysis, outcome: 1.3 Number of patients who finished the study.
Primary outcomes
Cocaine use
The mean cocaine use across the study was infrequently reported. Eight studies involving 526 participants assessed cocaine use by measuring the mean (SD) proportion of cocaine‐free urinalysis across the study per patient (Grabowski 1997; Grabowski 2004a; Levin 2007; Morgan 2016; Poling 2006; Schubiner 2002; Shearer 2003; Shoptaw 2008). We did not find any significant difference between groups (SMD 0.16, 95% CI −0.02 to 0.33; Analysis 1.1, Figure 4) nor any heterogeneity.
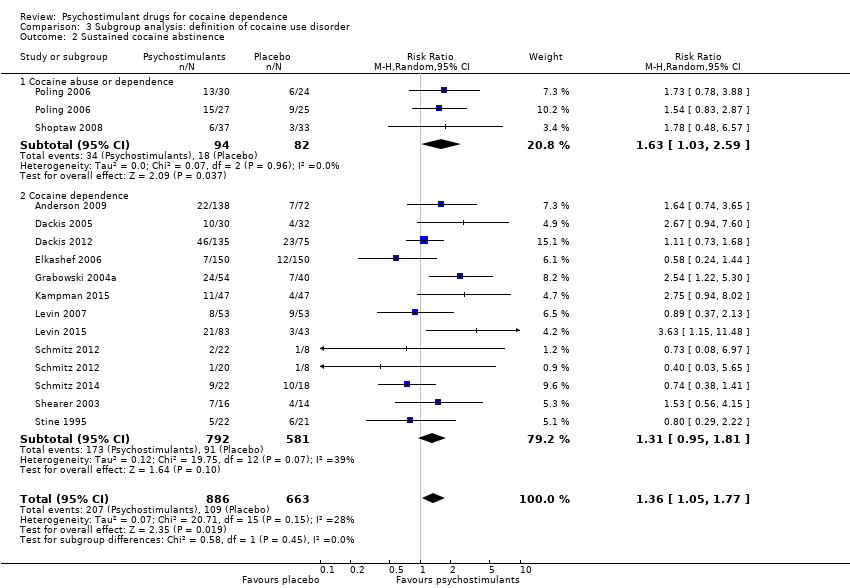
Sustained cocaine abstinence
Fourteen studies involving 1549 participants reported the effect of the studied intervention on sustained cocaine abstinence (Anderson 2009; Dackis 2005; Dackis 2012; Elkashef 2006; Grabowski 2004a; Kampman 2015; Levin 2007; Levin 2015; Poling 2006; Schmitz 2012; Schmitz 2014; Shearer 2003; Shoptaw 2008; Stine 1995). Investigators considered three weeks to be 'sustained' abstinence in all but Levin 2007, which used a two‐week definition. The result of the meta‐analysis favoured the psychostimulant group (RR 1.36, 95% CI 1.05 to 1.77, P = 0.02; Analysis 1.2, Figure 5). We found no significant heterogeneity. To further analyse the efficacy of psychostimulants for achieving sustained cocaine abstinence, we calculated the RD and the number needed to treat for an additional beneficial outcome (NNTB). The RD was 0.07 (P = 0.02), and the NNTB was 14.
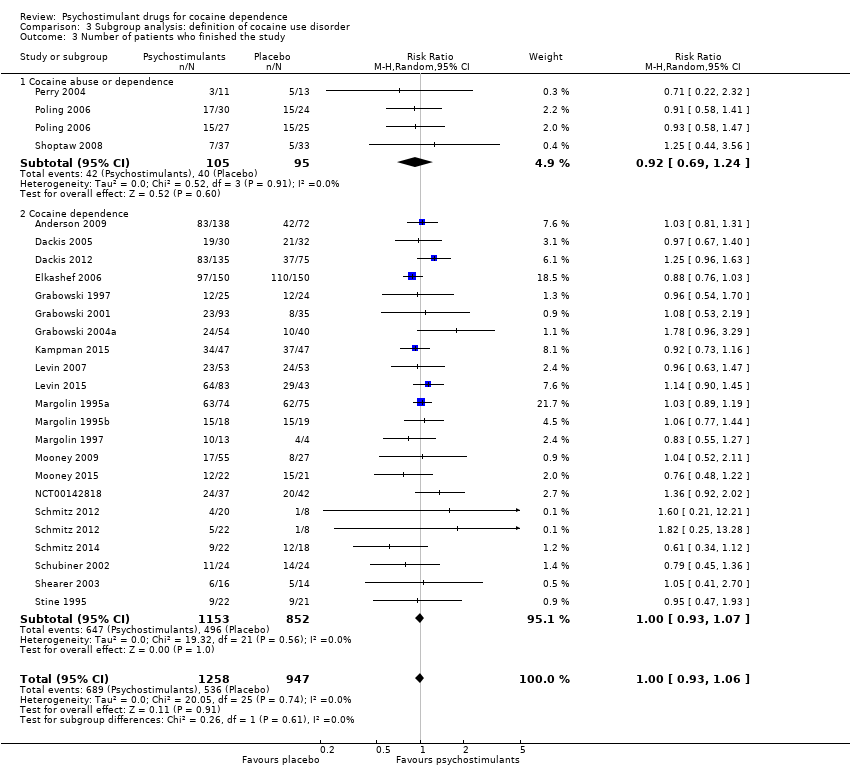
Number of participants who finished the study (retention in treatment)
This outcome was available for all studies but two (Dürsteler‐MacFarland 2013; Morgan 2016), and data from 2205 participants contributed to the meta‐analysis (see Analysis 1.3, Figure 6). We did not find a significant difference between groups (RR 1.00, 95% CI 0.93 to 1.06), nor did we find any heterogeneity.
Secondary outcomes
Efficacy
Self‐reported cocaine use
One study involving 28 participants reported this outcome (Stine 1995). We did not find any significant difference between groups (SMD 0.00, 95% CI −0.74 to 0.74; Analysis 1.4).
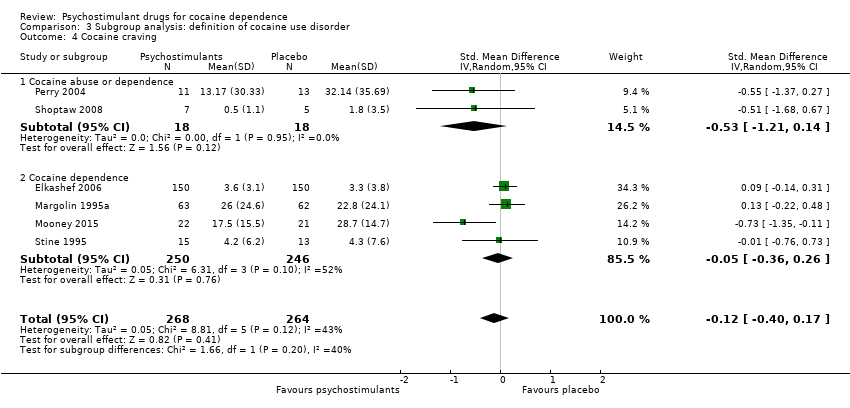
Cocaine craving
Six studies involving 532 participants reported cocaine craving (Elkashef 2006; Margolin 1995a; Mooney 2015; Perry 2004; Shoptaw 2008; Stine 1995). There was no significant difference between groups (SMD −0.12, 95% CI −0.40 to 0.17; Analysis 1.5). We found moderate heterogeneity (I2 = 43%).
Survival
No study reported survival outcomes.
Addiction severity (participant‐rated CGI‐severity scale)
One study involving 300 participants reported on participant‐rated addiction severity (Elkashef 2006). The result of the meta‐analysis favoured psychostimulants (SMD 0.28, 95% CI 0.05 to 0.50; P = 0.02; Analysis 1.6).
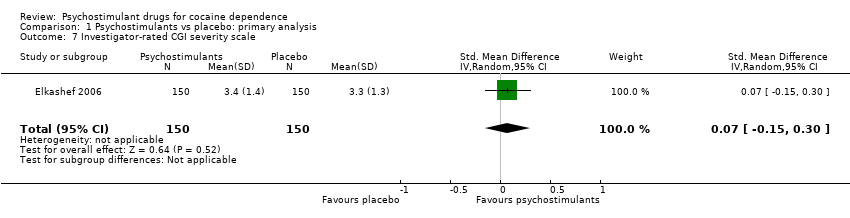
Addiction severity (investigator‐rated CGI‐severity scale)
One study involving 300 participants reported on investigator‐rated addiction severity (Elkashef 2006). There was no significant difference between groups (SMD 0.07, 95% CI −0.15 to 0.30; Analysis 1.7).
Addiction severity improvement (participant‐rated CGI‐improvement scale)
One study involving 300 participants reported participant‐rated addiction severity improvement (Elkashef 2006).The result favoured psychostimulants (SMD 0.27, 95% CI 0.04 to 0.50; P = 0.02; Analysis 1.8).
Addiction severity improvement (investigator‐rated CGI‐improvement scale)
One study involving 300 participants reported investigator‐rated addiction severity improvement (Elkashef 2006). There was no significant difference between groups (SMD 0.00, 95% CI −0.23 to 0.23; Analysis 1.9).
Substantial addiction severity improvement (investigator‐rated CGI‐improvement scale = 1 or 2)
One study involving 106 participants reported the proportion of participants achieving substantial addiction severity improvement (Levin 2007). There was no significant difference between groups (RR 0.81, 95% CI 0.57 to 1.15; Analysis 1.10).
Global activity functioning
No study reported this outcome, so we could not analyse it.
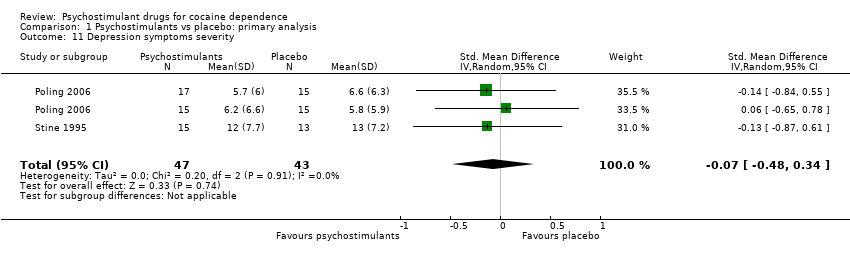
Depression symptoms
Two studies involving 90 participants reported on symptoms of depression (Poling 2006; Stine 1995). We found no significant difference between groups (SMD −0.07, 95% CI −0.48 to 0.34; Analysis 1.11), nor did we find any heterogeneity.
For studies including dual opioid‐cocaine abusers
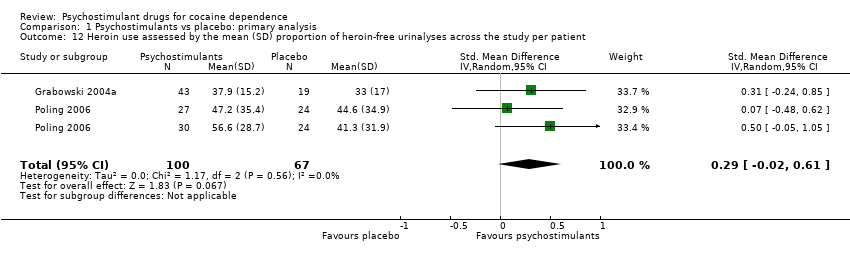
Heroin use assessed by the mean (SD) proportion of heroin‐free urinalysis across the study per participant
Two studies involving 167 participants reported on heroin use (Grabowski 2004a; Poling 2006). We found no significant difference between experimental and control groups (SMD 0.29, 95% CI −0.02 to 0.61; P = 0.07; Analysis 1.12), nor did we find any heterogeneity.
Sustained heroin abstinence
Two studies involving 199 participants reported on sustained heroin abstinence (Grabowski 2004a; Poling 2006). The result of the meta‐analysis favoured psychostimulants (RR 1.77, 95% CI 1.31 to 2.40; P = 0.0002; Analysis 1.13). We found moderate heterogeneity (I2 = 38%).
Self‐reported heroin use
No study reported on self‐reported heroin use, so we could not analyse the outcome.
For studies including dual ADHD patients‐cocaine abusers
ADHD severity
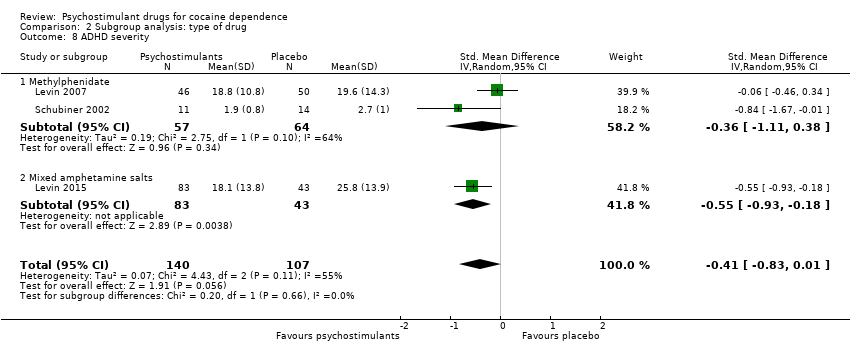
Three studies involving 247 participants reported on ADHD severity (Levin 2007; Levin 2015; Schubiner 2002). We did not find a significant difference between groups (SMD −0.41, 95% CI −0.83 to 0.01; P = 0.06; Analysis 1.14). There was high heterogeneity (I2 = 55%).
Safety
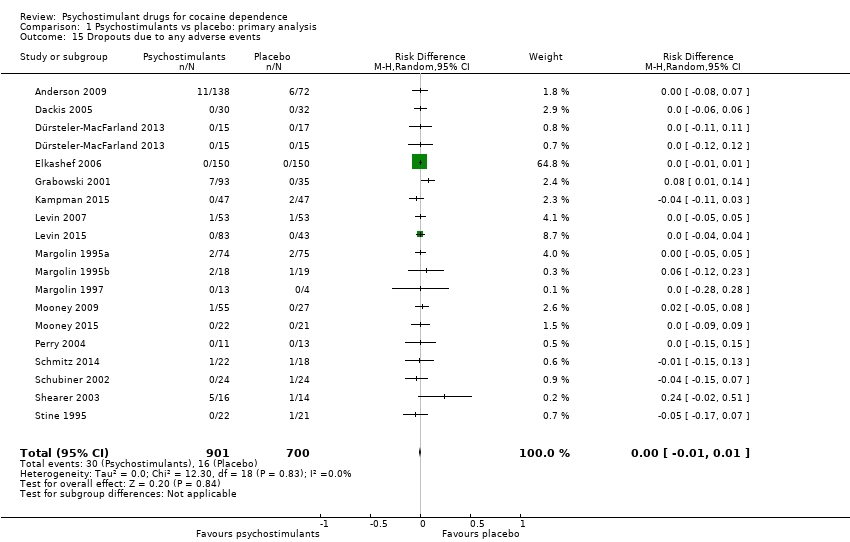
Dropouts due to any adverse event
Eighteen studies involving 1601 participants reported on dropouts due to adverse events (Anderson 2009; Dackis 2005; Dürsteler‐MacFarland 2013; Elkashef 2006; Grabowski 2001; Kampman 2015; Levin 2007; Levin 2015; Margolin 1995a; Margolin 1995b; Margolin 1997; Mooney 2009; Mooney 2015; Perry 2004; Schmitz 2014; Schubiner 2002; Shearer 2003; Stine 1995). The meta‐analysis did not show any significant difference between groups (RD 0.00, 95% CI −0.01 to 0.01; Analysis 1.15). We did not find any heterogeneity.
Dropouts due to cardiovascular adverse event
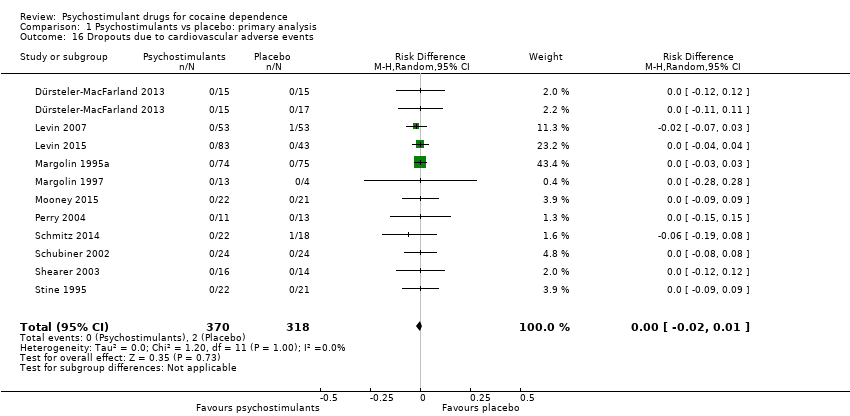
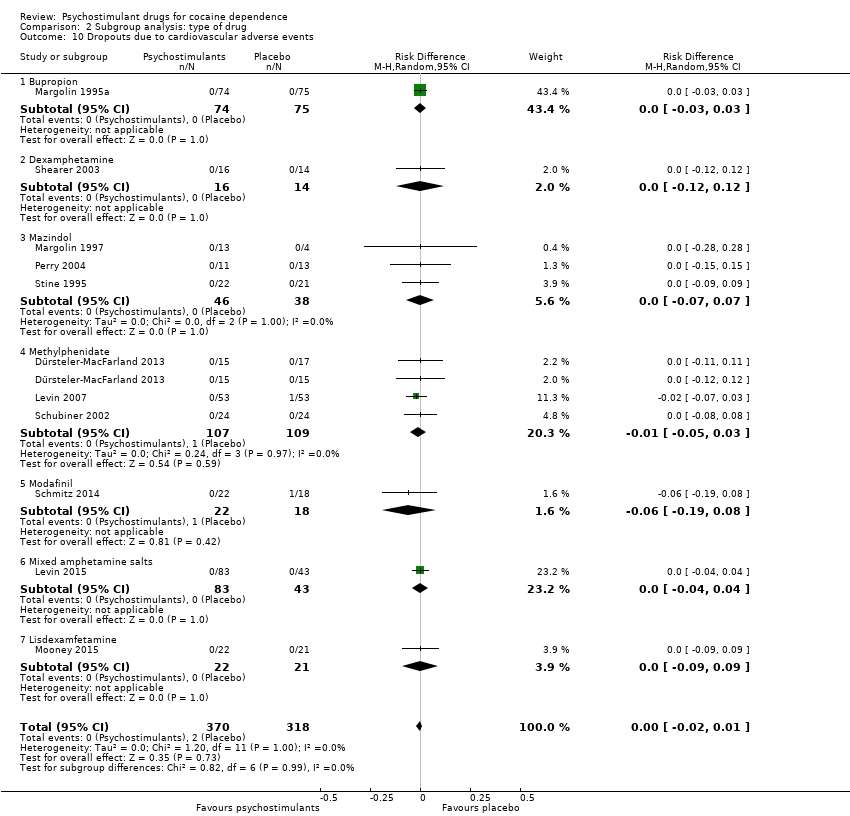
Eleven studies involving 688 participants reported on dropouts due to cardiovascular adverse events (Dürsteler‐MacFarland 2013; Levin 2007; Levin 2015; Margolin 1995a; Margolin 1997; Mooney 2015; Perry 2004; Schmitz 2014; Schubiner 2002; Shearer 2003; Stine 1995). The meta‐analysis did not show any significant difference between groups (RD 0.00, 95% CI −0.02 to 0.01; Analysis 1.16). We did not find any heterogeneity.
Medication abuse
This outcome was not available from any study, so we could not analyse it.
Serious adverse events
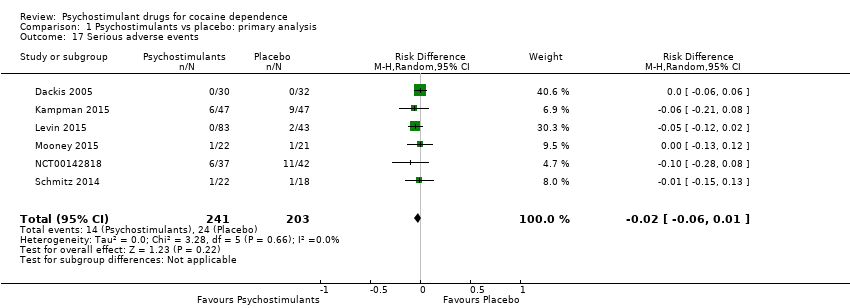
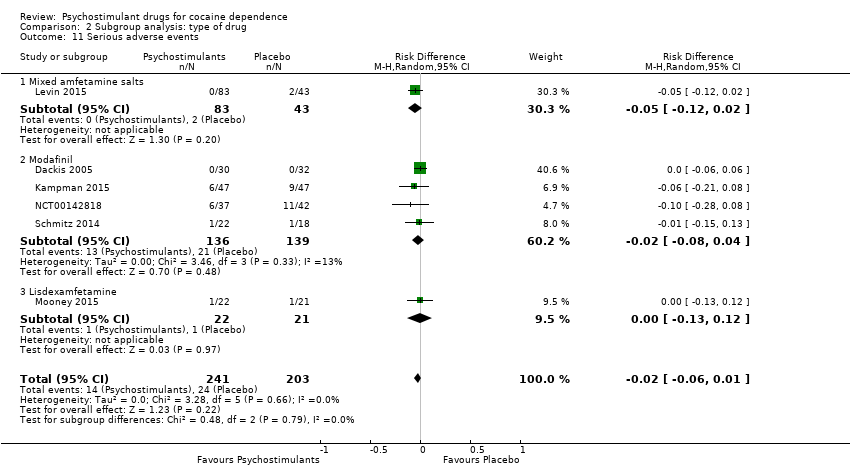
Six studies involving 444 participants reported on serious adverse events (Dackis 2005; Kampman 2015; Levin 2015; Mooney 2015; NCT00142818; Schmitz 2014). The meta‐analysis did not show any significant difference between groups (RD: −0.02, 95% CI −0.06 to 0.01; Analysis 1.17). We did not find any heterogeneity
Subgroup analyses
We did not find any between‐subgroup differences for any subgroup analyses. Nevertheless, these analyses identified some subgroups within which the interventions studied were more efficacious than placebo. Modafinil was more efficacious than placebo for reducing cocaine use (Analysis 2.1), bupropion, dexamphetamine and mixed amphetamine salts were more efficacious than placebo for achieving sustained cocaine abstinence (Analysis 2.2), dexamphetamine was found to improve heroin abstinence in participants with a comorbid heroin dependence (Analysis 2.7), and mixed amphetamine salts improved ADHD symptom severity in participants with comorbid ADHD (Analysis 2.8). Psychostimulants were more efficacious than placebo for achieving sustained cocaine abstinence in studies that included participants with cocaine abuse and cocaine dependence (Analysis 3.2). Psychostimulants reduced cocaine use and increased sustained cocaine abstinence in studies in which ADHD was not an inclusion criterion (Analysis 4.1). Psychostimulants increased sustained cocaine abstinence in studies in which heroin dependence was an inclusion criterion (Analysis 5.2).
We performed subgroup analyses for risk of bias as stated in the protocol, but none of them showed a statistically significant difference between subgroups.
Reporting bias analysis
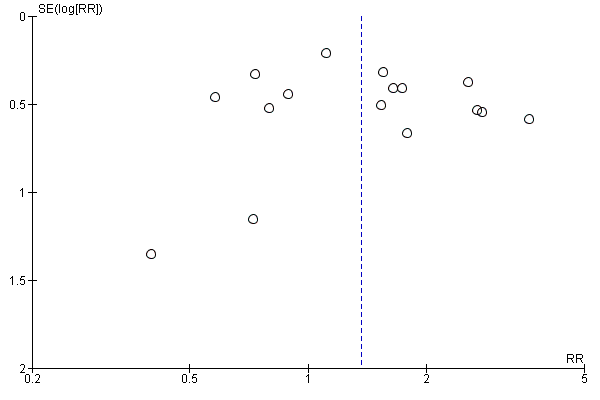
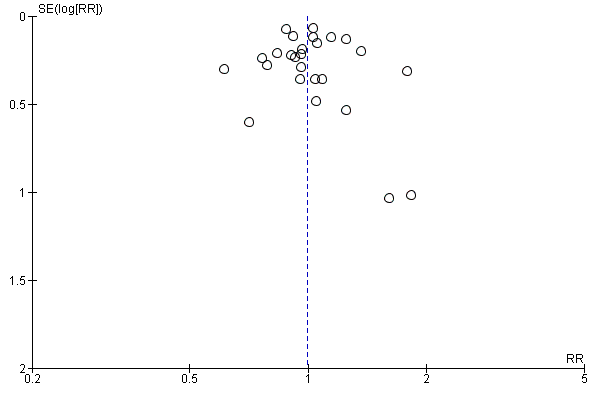
We constructed funnel plots of the three primary outcome variables, and none were suggestive of reporting bias (see Figure 7; Figure 8; Figure 9).

Funnel plot of comparison: 1 Psychostimulants vs placebo: primary analysis, outcome: 1.1 Cocaine use by means of urine screen.

Funnel plot of comparison: 1 Psychostimulants vs placebo: primary analysis, outcome: 1.2 Sustained cocaine abstinence.

Funnel plot of comparison: 1 Psychostimulants vs placebo: primary analysis, outcome: 1.3 Number of patients who finished the study (retention).
Sensitivity analysis
We carried out a sensitivity analysis for safety outcomes, calculating RR instead of RD.
For dropouts due to AEs, we did not obtain a significant result (RR 1.11, 95% CI 0.60 to 2.02; P = 0.74; Analysis 6.1). We did not find any heterogeneity.
For dropouts due to cardiovascular adverse events, we did not obtain a significant result (RR 0.48, 95% CI 0.09 to 2.70; P = 0.41; see Analysis 6.2). We found no heterogeneity.
Discussion
Summary of main results
This review of the effects of psychostimulants for cocaine dependence showed mixed results on the primary outcomes. We found very low quality evidence that psychostimulants did not decrease cocaine use among participants who continue to take it and moderate quality evidence that they do not improve treatment retention in comparison to placebo. Nevertheless, we found very low quality evidence that a higher proportion of participants achieved sustained cocaine abstinence with psychostimulants than with placebo. However, while the relative improvement of sustained cocaine abstinence was notable, the absolute benefit was relatively small. In consonance with reviews such as Mattick 2009 showing the efficacy of substitute treatment for heroin use and Hartmann‐Boyce 2014 showing improvements for nicotine dependence, the findings of this review suggest that psychostimulants are a promising treatment for cocaine dependence.
Psychostimulants did not improve cocaine craving or symptoms of depression. Although the effect of psychostimulants on depression symptoms was only available for a handful of studies, it is worth highlighting the negative result on this outcome because it could suggest that the positive effects that these drugs appear to have on sustained cocaine abstinence were not accompanied by similar effects on mood. Psychostimulants showed acceptable short‐term safety, and we found no differences with placebo on the rate of dropouts due to adverse events or cardiovascular adverse events or the incidence of serious adverse eventss. Nevertheless, this review focused on serious adverse events and on adverse events that were serious enough to deserve study withdrawal. Thus, a comprehensive review of psychostimulant safety, including mild and long‐term adverse events, is still necessary.
The included studies evaluated nine drugs with psychostimulant effects or metabolised to a psychostimulant drug: bupropion, dexamphetamine, mazindol, methamphetamine, methylphenidate, mixed amphetamine salts, lisdexamfetamine, modafinil and selegiline. For some of them, we found statistically significant effects. Bupropion, dexamphetamine and mixed amphetamine salts appeared to be more efficacious than placebo in achieving sustained cocaine abstinence. Modafinil appeared to be more efficacious than placebo in reducing cocaine use. Lisdexamfetamine significantly improved cocaine craving compared to placebo. Dexamphetamine was more efficacious than placebo in achieving sustained heroin abstinence in participants with both cocaine and opioid dependence. Mixed amphetamine salts significantly improved ADHD severity compared to placebo in participants with comorbid ADHD. Selegiline appeared to improve CGI, but only when it was investigator‐rated. Readers should interpret these findings with caution because the number of studies investigating each type of drug was small and therefore it is not possible to conclude that there are specific drug effects depending on the type of psychostimulant.
It is important to note that some of the included drugs, such as bupropion, modafinil or selegiline, are not usually considered psychostimulants nor classified within the psychostimulant section in drug classification systems (ATC 2015; AHFS 2014). Selegiline is not a psychostimulant itself, but it is metabolised to amphetamine and methamphetamine (Shin 1997). However, its psychostimulant and reinforcing effects appear to be stereoselective, being more pronounced with D‐selegiline than with the L‐isomer that is used in the clinical practice (Yasar 2006a). Moreover, the therapeutic dose of selegiline is lower than that administered in laboratory studies that have assessed its psychostimulant and reinforcing effects (Engberg 1991; Mahmood 1997; Yasar 2006b). Unlike selegiline, modafinil and bupropion appear to have psychostimulant properties by themselves. Indeed, some studies show that they, like cocaine and other psychostimulants, block the dopamine transporter (Dwoskin 2006; Learned‐Coughlin 2003; Madras 2006; Volkow 2009; Zolkowska 2009), and others demonstrate their locomotor‐stimulating effects (Cousins 2001; Makris 2007; Redolat 2005; Zolkowska 2009). In addition, both drugs have some substitute properties for cocaine and for other prototypical CNS stimulants in discriminative stimulus studies (Craft 1996; Dopheide 2007; Evans 1987; Katz 2000). At the same time, it is worth noting that some people misuse both bupropion and modafinil (Jasinski 2000; Langguth 2009; McCormick 2002; Welsh 2002).
Though several studies support the notion that no pharmacological intervention is efficacious for all cocaine dependent patients but only for some subgroups with specific clinical characteristics (Kampman 2004; Kosten 2005; McDowell 2005), the subgroup analyses of this review did not identify any such characteristics, as there were no between‐subgroup statistically significant differences. Given that the number of studies within each subgroup was low, we cannot rule out the possibility that true differences were not identified in this review due to lack of statistical power.
Psychostimulants were more efficacious than placebo for achieving both sustained cocaine and heroine abstinence in methadone‐maintained participants with comorbid heroin dependence. This finding may suggest the possibility of an underlying interaction between opioids and psychostimulants (Castells 2009; Leri 2003). These hopeful findings must be interpreted with the utmost care because they were based on only two out of five published clinical trials, for which data were available in a way that allowed statistical meta‐analysis.
Overall completeness and applicability of evidence
The external validity of this review is limited by the inclusion/exclusion criteria of the included studies. Most studies took place in the USA, hampering the generalisability of the findings to other regions. Besides, there is an overrepresentation of dual opioid‐cocaine dependent participants in comparison to clinical samples. Conversely, the studies usually excluded participants with comorbid alcohol dependence or major depressive disorder, which are frequent comorbid disorders.
Quality of the evidence
It is important to assess clinical trial quality and its influence on meta‐analysis results because it is associated with biased results, with lower quality studies showing more favourable outcomes to the studied intervention (Jüni 2001). In our review, we did not consider any study to be at a low risk of bias for all domains, therefore we cannot rule out the possibility that the main results are biased. Nevertheless, we stress that we did not find any statistically significant differences in any subgroup analysis between studies with a high or unclear risk of bias and those with a low risk of bias. Such a finding would demonstrate that the results of the meta‐analysis could be biased.
We could not analyse the influence of attrition bias because all included studies had a high dropout rate and were therefore at a high or unclear risk of having biased results because of the incompleteness of the analysed data. Nevertheless, attrition bias does not affect all study outcomes. Since no missing data exist for study retention or adverse event‐induced dropout, these outcomes are free from this source of bias. With the exception of 'sustained cocaine abstinence' and 'retention', the number of studies included in the meta‐analyses was small. Therefore the precision of the calculated effects is low. This is particularly true for many subgroup analyses.
Another factor that can affect the quality of the evidence in this review is the fact that we pooled the results of studies investigating drugs with different mechanisms of action, and we did not control for the influence of their dose. To do so, we would have had to understand the pharmacodynamic equivalence between these drugs, and to our knowledge, this information is not available.
For some subgroup analyses, the number of studies and participants included is low and so is the statistical power. This is the case for studies investigating mazindol, which took place more than 20 years ago and had sample sizes that ranged form 17 to 43 participants.
There were also limitations affecting the external validity of the studies. Study duration was short, in contrast with the chronic course of cocaine dependence. Furthermore, the majority of studies used three‐week uninterrupted cocaine abstinence as the definition of sustained abstinence. This definition is arguable because three weeks of cocaine abstinence has little clinical significance.
We deemed the quality of the evidence to be very low for the efficacy of psychostimulants on 'cocaine use across the study' and 'sustained cocaine abstinence' mainly because treatment dropout was high, there was a possibility of attrition bias, and the pooled effects calculated were rather imprecise. Conversely, the quality of the evidence for the effect of psychostimulants on 'retention in treatment' was moderate because this outcome is not influenced by attrition bias, and the pooled effect calculated was reasonably precise.
Potential biases in the review process
Reporting bias can jeopardise the validity of any meta‐analysis. We have tried to limit the influence of reporting bias by screening several data sets and requesting unpublished results from the corresponding authors. This process resulted in a substantial increase in the available data. We created funnel plots to determine whether reporting bias occurred, and none were suggestive of biased results.
A limitation of this review is that the findings of the subgroup analysis may yield confounded results as a consequence of its bivariate nature. For instance, we found that the achievement of sustained cocaine abstinence was associated with the type of studied psychostimulant (bupropion and dexamphetamine were the only psychostimulants with statistically significant results on this outcome) and with the presence of a comorbid opioid dependence (psychostimulants were efficacious in dual opioid‐cocaine dependent participants but not in participants without comorbid opioid dependence). Nevertheless, the clinical trials with dual opioid‐cocaine dependent participants used bupropion and dexamphetamine as psychostimulants. Thus, we cannot disentangle the effect of a comorbid opioid dependence from that of the studied psychostimulant without more clinical trials allowing for multiple subgroup analyses.
Agreements and disagreements with other studies or reviews
Several reviews using a narrative methodology are available (Grabowski 2004a; Karila 2008; Moeller 2008). Two systematic reviews and meta‐analyses are also available, including the first version of this updated review (Castells 2007; Castells 2010). Our review agrees with these previously published studies in that psychostimulants appear efficacious for achieving sustained cocaine abstinence, but our results are statistically more consistent. As in the previous version of this review, we found that bupropion and dexamphetamine are the most promising stimulants and that the patients who would most benefit from psychostimulant replacement might be those with a comorbid opioid dependence treated with methadone.
One disagreement exists between this and a previously published meta‐analysis regarding adverse event‐induced dropouts (Castells 2007). That report found that adverse event‐induced dropouts were more prevalent amongst participants treated with psychostimulants than in those taking a placebo, while the present review does not support this finding. Differences regarding the number of included studies (the previous review included 9 RCTs and this one has 26) together with methodological differences (the previous review used a Fisher test while the present review employed meta‐analytical procedures to calculate the effects of the intervention on adverse event induced dropouts) may explain the discrepancy found on this outcome.
Study flow diagram.

Methodological quality graph: review authors' judgements about each methodological quality item presented as percentages across all included studies.

Methodological quality summary: review authors' judgements about each methodological quality item for each included study.

Forest plot of comparison: 1 Psychostimulants vs placebo: primary analysis, outcome: 1.1 Cocaine use assessed by the mean (SD) proportion of cocaine‐free urinalyses across the study per patient.

Forest plot of comparison: 1 Psychostimulants vs placebo: primary analysis, outcome: 1.2 Sustained cocaine abstinence.

Forest plot of comparison: 1 Psychostimulants vs placebo: primary analysis, outcome: 1.3 Number of patients who finished the study.

Funnel plot of comparison: 1 Psychostimulants vs placebo: primary analysis, outcome: 1.1 Cocaine use by means of urine screen.
Funnel plot of comparison: 1 Psychostimulants vs placebo: primary analysis, outcome: 1.2 Sustained cocaine abstinence.
Funnel plot of comparison: 1 Psychostimulants vs placebo: primary analysis, outcome: 1.3 Number of patients who finished the study (retention).

Comparison 1 Psychostimulants vs placebo: primary analysis, Outcome 1 Cocaine use assessed by the mean (SD) proportion of cocaine‐free urinalyses across the study per patient.

Comparison 1 Psychostimulants vs placebo: primary analysis, Outcome 2 Sustained cocaine abstinence.

Comparison 1 Psychostimulants vs placebo: primary analysis, Outcome 3 Number of patients who finished the study.

Comparison 1 Psychostimulants vs placebo: primary analysis, Outcome 4 Self‐reported cocaine use.

Comparison 1 Psychostimulants vs placebo: primary analysis, Outcome 5 Cocaine craving.

Comparison 1 Psychostimulants vs placebo: primary analysis, Outcome 6 Patient‐rated CGI severity scale.
Comparison 1 Psychostimulants vs placebo: primary analysis, Outcome 7 Investigator‐rated CGI severity scale.

Comparison 1 Psychostimulants vs placebo: primary analysis, Outcome 8 Patient‐rated CGI improvement scale.

Comparison 1 Psychostimulants vs placebo: primary analysis, Outcome 9 CGI investigator change.

Comparison 1 Psychostimulants vs placebo: primary analysis, Outcome 10 CGI investigator improvement: 1 or 2.
Comparison 1 Psychostimulants vs placebo: primary analysis, Outcome 11 Depression symptoms severity.
Comparison 1 Psychostimulants vs placebo: primary analysis, Outcome 12 Heroin use assessed by the mean (SD) proportion of heroin‐free urinalyses across the study per patient.

Comparison 1 Psychostimulants vs placebo: primary analysis, Outcome 13 Sustained heroin abstinence.

Comparison 1 Psychostimulants vs placebo: primary analysis, Outcome 14 ADHD severity.
Comparison 1 Psychostimulants vs placebo: primary analysis, Outcome 15 Dropouts due to any adverse events.
Comparison 1 Psychostimulants vs placebo: primary analysis, Outcome 16 Dropouts due to cardiovascular adverse events.
Comparison 1 Psychostimulants vs placebo: primary analysis, Outcome 17 Serious adverse events.

Comparison 2 Subgroup analysis: type of drug, Outcome 1 Cocaine use assessed by the mean (SD) proportion of cocaine‐free urinalyses across the study per patient.

Comparison 2 Subgroup analysis: type of drug, Outcome 2 Sustained cocaine abstinence.

Comparison 2 Subgroup analysis: type of drug, Outcome 3 Number of patients who finished the study.

Comparison 2 Subgroup analysis: type of drug, Outcome 4 Cocaine craving.

Comparison 2 Subgroup analysis: type of drug, Outcome 5 Depression symptoms severity.

Comparison 2 Subgroup analysis: type of drug, Outcome 6 Heroin use assessed by the mean (SD) proportion of heroin‐free urinalyses across the study per patient.

Comparison 2 Subgroup analysis: type of drug, Outcome 7 Sustained heroin abstinence.
Comparison 2 Subgroup analysis: type of drug, Outcome 8 ADHD severity.

Comparison 2 Subgroup analysis: type of drug, Outcome 9 Dropouts due to any adverse events.
Comparison 2 Subgroup analysis: type of drug, Outcome 10 Dropouts due to cardiovascular adverse events.
Comparison 2 Subgroup analysis: type of drug, Outcome 11 Serious adverse events.

Comparison 3 Subgroup analysis: definition of cocaine use disorder, Outcome 1 Cocaine use assessed by the mean (SD) proportion of cocaine‐free urinalyses across the study per patient.
Comparison 3 Subgroup analysis: definition of cocaine use disorder, Outcome 2 Sustained cocaine abstinence.
Comparison 3 Subgroup analysis: definition of cocaine use disorder, Outcome 3 Number of patients who finished the study.
Comparison 3 Subgroup analysis: definition of cocaine use disorder, Outcome 4 Cocaine craving.
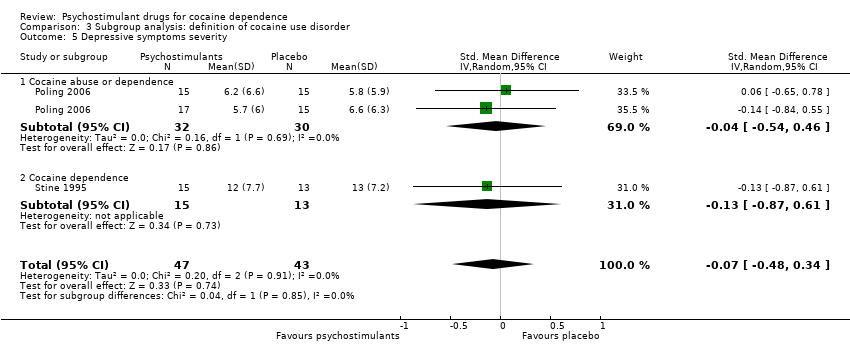
Comparison 3 Subgroup analysis: definition of cocaine use disorder, Outcome 5 Depressive symptoms severity.

Comparison 3 Subgroup analysis: definition of cocaine use disorder, Outcome 6 Heroin use assessed by the mean (SD) proportion of heroin‐free urinalyses across the study per patient.

Comparison 3 Subgroup analysis: definition of cocaine use disorder, Outcome 7 Sustained heroin abstinence.
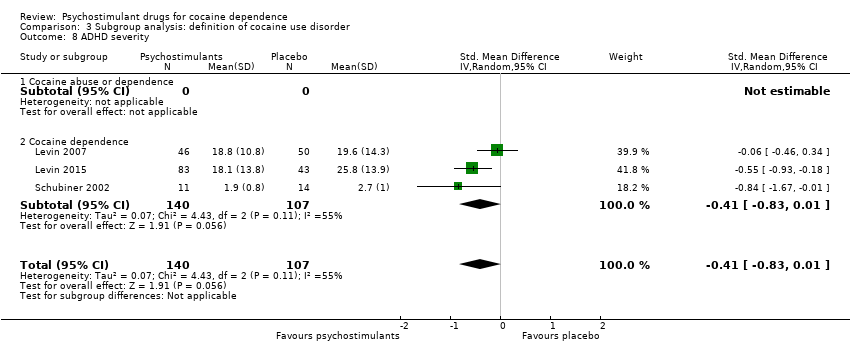
Comparison 3 Subgroup analysis: definition of cocaine use disorder, Outcome 8 ADHD severity.

Comparison 3 Subgroup analysis: definition of cocaine use disorder, Outcome 9 Dropouts due to any adverse events.

Comparison 3 Subgroup analysis: definition of cocaine use disorder, Outcome 10 Dropouts due to cardiovascular adverse events.

Comparison 3 Subgroup analysis: definition of cocaine use disorder, Outcome 11 Serious adverse events.
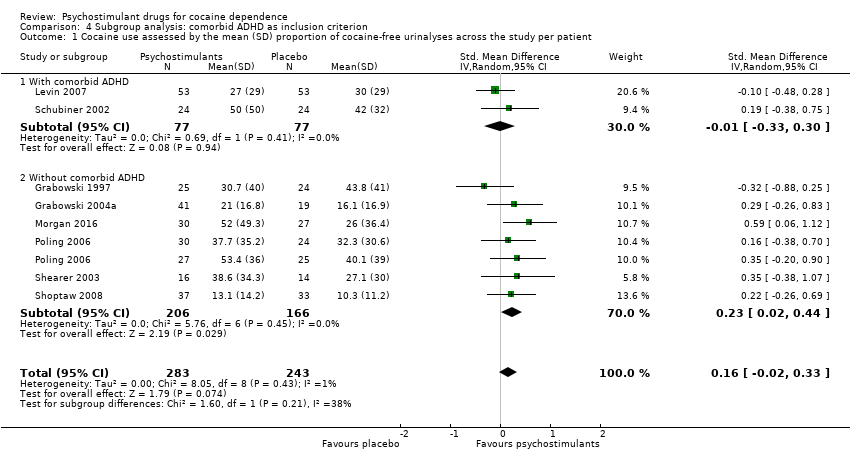
Comparison 4 Subgroup analysis: comorbid ADHD as inclusion criterion, Outcome 1 Cocaine use assessed by the mean (SD) proportion of cocaine‐free urinalyses across the study per patient.

Comparison 4 Subgroup analysis: comorbid ADHD as inclusion criterion, Outcome 2 Sustained cocaine abstinence.

Comparison 4 Subgroup analysis: comorbid ADHD as inclusion criterion, Outcome 3 Number of patients who finished the study.

Comparison 4 Subgroup analysis: comorbid ADHD as inclusion criterion, Outcome 4 Cocaine craving.

Comparison 4 Subgroup analysis: comorbid ADHD as inclusion criterion, Outcome 5 Depressive symptoms severity.

Comparison 4 Subgroup analysis: comorbid ADHD as inclusion criterion, Outcome 6 Heroin use assessed by the mean (SD) proportion of heroin‐free urinalyses across the study per patient.

Comparison 4 Subgroup analysis: comorbid ADHD as inclusion criterion, Outcome 7 Sustained heroin abstinence.
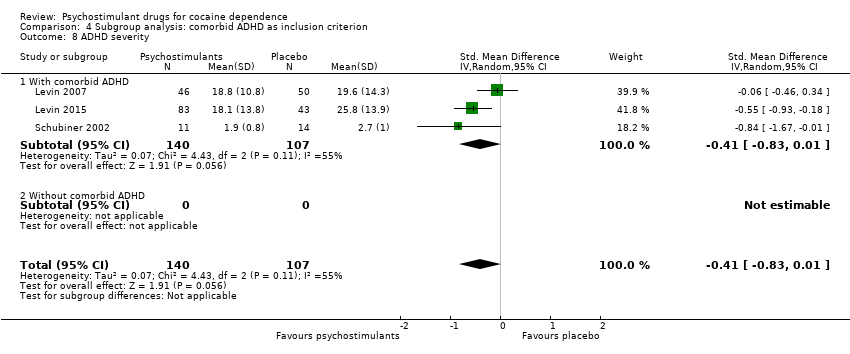
Comparison 4 Subgroup analysis: comorbid ADHD as inclusion criterion, Outcome 8 ADHD severity.

Comparison 4 Subgroup analysis: comorbid ADHD as inclusion criterion, Outcome 9 Dropouts due to any adverse events.

Comparison 4 Subgroup analysis: comorbid ADHD as inclusion criterion, Outcome 10 Dropouts due to cardiovascular adverse events.
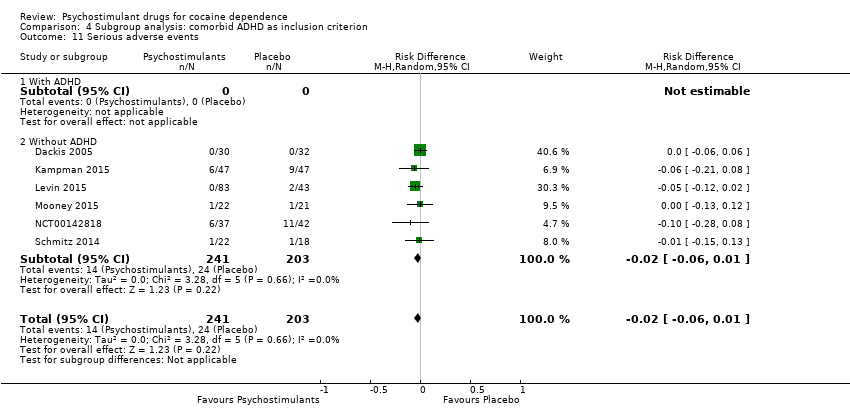
Comparison 4 Subgroup analysis: comorbid ADHD as inclusion criterion, Outcome 11 Serious adverse events.

Comparison 5 Subgroup analysis: Comorbid opioid dependence as inclusion criterion, Outcome 1 Cocaine use assessed by the mean (SD) proportion of cocaine‐free urinalyses across the study per patient.

Comparison 5 Subgroup analysis: Comorbid opioid dependence as inclusion criterion, Outcome 2 Sustained cocaine abstinence.

Comparison 5 Subgroup analysis: Comorbid opioid dependence as inclusion criterion, Outcome 3 Number of patients who finished the study.

Comparison 5 Subgroup analysis: Comorbid opioid dependence as inclusion criterion, Outcome 4 Cocaine craving.

Comparison 5 Subgroup analysis: Comorbid opioid dependence as inclusion criterion, Outcome 5 Depression symptoms severity.

Comparison 5 Subgroup analysis: Comorbid opioid dependence as inclusion criterion, Outcome 6 Heroin use assessed by the mean (SD) proportion of heroin‐free urinalyses across the study per patient.
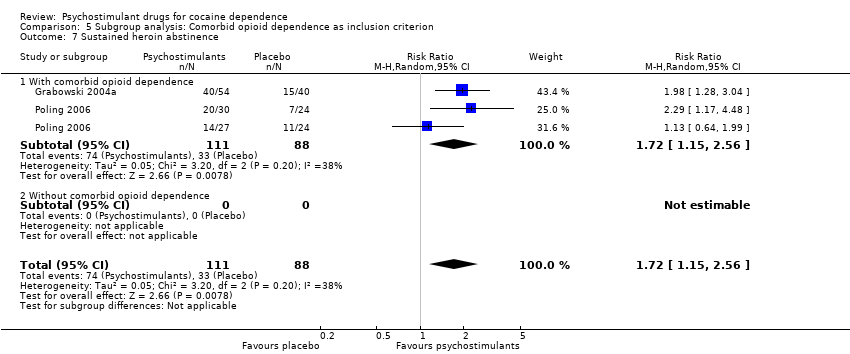
Comparison 5 Subgroup analysis: Comorbid opioid dependence as inclusion criterion, Outcome 7 Sustained heroin abstinence.

Comparison 5 Subgroup analysis: Comorbid opioid dependence as inclusion criterion, Outcome 8 ADHD severity.
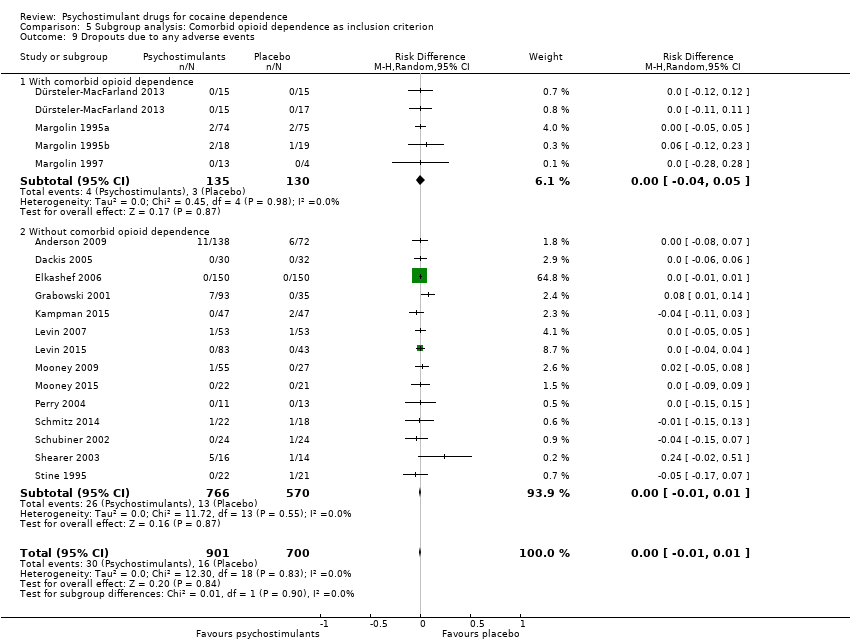
Comparison 5 Subgroup analysis: Comorbid opioid dependence as inclusion criterion, Outcome 9 Dropouts due to any adverse events.

Comparison 5 Subgroup analysis: Comorbid opioid dependence as inclusion criterion, Outcome 10 Dropouts due to cardiovascular adverse events.

Comparison 5 Subgroup analysis: Comorbid opioid dependence as inclusion criterion, Outcome 11 Serious adverse events.

Comparison 6 Psychostimulants vs placebo: sensitivity analyses of the safety measures, Outcome 1 Dropouts due to any adverse events.

Comparison 6 Psychostimulants vs placebo: sensitivity analyses of the safety measures, Outcome 2 Dropouts due to cardiovascular adverse events.
| Psychostimulants for cocaine dependence | ||||||
| Patient or population: people with cocaine dependence Comparison: placebo | ||||||
| Outcomes | Illustrative comparative risks* (95% CI) | Relative effect | No of participants | Quality of the evidence | Comments | |
| Assumed risk | Corresponding risk | |||||
| Control | Psychostimulants | |||||
| Cocaine use assessed by the mean (SD) proportion of cocaine‐free urinalysis across the study per participant | — | The mean cocaine use assessed by the mean (SD) of the proportion of cocaine‐free urinalysis across the study per participant in the intervention groups was | — | 526 | ⊕⊝⊝⊝ | SMD 0.16 (−0.02 to 0.33) |
| Sustained cocaine abstinence | Study population | RR 1.36 | 1549 | ⊕⊝⊝⊝ | — | |
| 164 per 1000 | 224 per 1000 | |||||
| Moderate | ||||||
| 147 per 1000 | 200 per 1000 | |||||
| Number of participants who finished the study | Study population | RR 1.00 | 2205 | ⊕⊕⊕⊝ | — | |
| 566 per 1000 | 566 per 1000 | |||||
| Moderate | ||||||
| 542 per 1000 | 542 per 1000 | |||||
| *The basis for the assumed risk (e.g. the median control group risk across studies) is provided in footnotes. The corresponding risk (and its 95% confidence interval) is based on the assumed risk in the comparison group and the relative effect of the intervention (and its 95% CI). | ||||||
| GRADE Working Group grades of evidence | ||||||
| aAttrition bias was unclear or high for all the included studies. | ||||||
| Item | Judgment | Description |
| 1. Random sequence generation (selection bias) | Low risk | The investigators describe a random component in the sequence generation process such as: random number table; computerised random number generator; coin tossing; shuffling cards or envelopes; throwing dice; drawing of lots; minimisation. |
| High risk | The investigators describe a non‐random component in the sequence generation process such as: odd or even date of birth; date (or day) of admission; hospital or clinic record number; alternation; judgement of the clinician; results of a laboratory test or a series of tests; availability of the intervention. | |
| Unclear risk | Insufficient information about the sequence generation process to permit judgement of low or high risk | |
| 2. Allocation concealment (selection bias) | Low risk | Investigators enrolling participants could not foresee assignment because 1 of the following, or an equivalent method, was used to conceal allocation: central allocation (including telephone, web‐based, and pharmacy‐controlled, randomisation); sequentially numbered drug containers of identical appearance; sequentially numbered, opaque, sealed envelopes. |
| High risk | Investigators enrolling participants could possibly foresee assignments because 1 of the following methods was used: open random allocation schedule (e.g. a list of random numbers); assignment envelopes without appropriate safeguards (e.g. if envelopes were unsealed or nonopaque or not sequentially numbered); alternation or rotation; date of birth; case record number; any other explicitly unconcealed procedure. | |
| Unclear risk | Insufficient information to permit judgement of low or high risk. This is usually the case if the method of concealment is not described or not described in sufficient detail to allow a definite judgement. | |
| 3. Blinding of participants and providers (performance bias) Objective outcomes | Low risk | No blinding or incomplete blinding, but the review authors judge that the outcome is not likely to be influenced by lack of blinding; Blinding of participants and key study personnel ensured, and unlikely that the blinding could have been broken. |
| High risk | No blinding or incomplete blinding, and the outcome is likely to be influenced by lack of blinding; Blinding of key study participants and personnel attempted, but likely that the blinding could have been broken, and the outcome is likely to be influenced by lack of blinding | |
| Unclear risk | Insufficient information to permit judgement of low or high risk | |
| 4. Blinding of participants and providers (performance bias) Subjective outcomes | Low risk | Blinding of participants and providers ensured and unlikely that the blinding could have been broken |
| High risk | No blinding or incomplete blinding, and the outcome is likely to be influenced by lack of blinding; Blinding of key study participants and personnel attempted, but likely that the blinding could have been broken, and the outcome is likely to be influenced by lack of blinding | |
| Unclear risk | Insufficient information to permit judgement of low or high risk | |
| 5. Blinding of outcome assessor (detection bias) Objective outcomes | Low risk | No blinding of outcome assessment, but the review authors judge that the outcome measurement is not likely to be influenced by lack of blinding Blinding of outcome assessment ensured, and unlikely that the blinding could have been broken |
| High risk | No blinding of outcome assessment, and the outcome measurement is likely to be influenced by lack of blinding; Blinding of outcome assessment, but likely that the blinding could have been broken, and the outcome measurement is likely to be influenced by lack of blinding | |
| Unclear risk | Insufficient information to permit judgement of low or high risk | |
| 6.Blinding of outcome assessor (detection bias) Subjective outcomes | Low risk | Blinding of outcome assessment ensured, and unlikely that the blinding could have been broken |
| High risk | No blinding of outcome assessment, and the outcome measurement is likely to be influenced by lack of blinding; Blinding of outcome assessment, but likely that the blinding could have been broken, and the outcome measurement is likely to be influenced by lack of blinding | |
| Unclear risk | Insufficient information to permit judgement of low or high risk | |
| 7. Incomplete outcome data (attrition bias) For all outcomes except retention in treatment | Low risk | No missing outcome data; Reasons for missing outcome data unlikely to be related to true outcome (for survival data, censoring unlikely to introduce bias); Missing outcome data balanced in numbers across intervention groups, with similar reasons for missing data across groups; For dichotomous outcome data, the proportion of missing outcomes compared with observed event risk not enough to have a clinically relevant impact on the intervention effect estimate; For continuous outcome data, plausible effect size (difference in means or standardised difference in means) among missing outcomes not enough to have a clinically relevant impact on observed effect size; Missing data have been imputed using appropriate methods; All randomised participants are reported/analysed in the group they were allocated to by randomisation irrespective of non‐adherence and co‐interventions (intention‐to‐treat) |
| High risk | Reason for missing outcome data likely to be related to true outcome, with either imbalance in numbers or reasons for missing data across intervention groups; For dichotomous outcome data, the proportion of missing outcomes compared with observed event risk enough to induce clinically relevant bias in intervention effect estimate; For continuous outcome data, plausible effect size (difference in means or standardised difference in means) among missing outcomes enough to induce clinically relevant bias in observed effect size; 'As‐treated' analysis done with substantial departure of the intervention received from that assigned at randomisation. | |
| Unclear risk | Insufficient information to permit judgement of low or high risk (e.g. number randomised not stated, no reasons for missing data provided; number of dropouts not reported for each group) | |
| 8. Selective reporting (reporting bias) | Low risk | The study protocol is available and all of the study's pre‐specified (primary and secondary) outcomes that are of interest in the review have been reported in the pre‐specified way; The study protocol is not available but it is clear that the published reports include all expected outcomes, including those that were pre‐specified (convincing text of this nature may be uncommon). |
| High risk | Not all of the study’s pre‐specified primary outcomes have been reported; 1 or more primary outcomes is reported using measurements, analysis methods or subsets of the data (e.g. subscales) that were not pre‐specified; 1 or more reported primary outcomes were not pre‐specified (unless clear justification for their reporting is provided, such as an unexpected adverse effect); 1 or more outcomes of interest in the review are reported incompletely so that they cannot be entered in a meta‐analysis; The study report fails to include results for a key outcome that would be expected to have been reported for such a study. | |
| Unclear risk | Insufficient information to permit judgement of low or high risk | |
| 9. Other bias | Low risk | The study appears to be free from other sources of bias. |
| High risk | There is at least 1 important risk of bias. For example, the study: Had a potential source of bias related to the specific study design used; Stopped early due to some data‐dependent process (including a formal‐stopping rule); Had extreme baseline imbalance; Has been claimed to have been fraudulent; or Had some other problem. | |
| Unclear risk | There may be a risk of bias, but there is either: Insufficient information to assess whether an important risk of bias exists; or Insufficient rationale or evidence that an identified problem will introduce bias. |
| Sample size (N) | 2366 |
| Sex % female | 25.3 |
| Age Mean age (years) | 39.6 |
| Ethnicity % white % black % other | 39.3 47.6 13.1 |
| Employment status % currently employed | 39.3 |
| Days of cocaine use/month Range | 10.6‐17.8 |
| Length of cocaine use Range of mean lifetime cocaine use (years) | 7.7‐22.4 |
| Route of cocaine use % intranasal % intrapulmonary % intravenous | 23.8 60.8 14.7 |
| Comorbidities % opioid dependence % alcohol dependence | 21.4 10.4 |
| aBaseline patient characteristics are presented for trials reporting this information. Sex was available for all studies; age for all studies but one; ethnicity, for 22 studies; the presence of opioid and alcohol dependence, for 24 and 19, respectively; lifetime cocaine use, for 17; days of cocaine use in a month, for 15; employment, for 9; and route of cocaine use, for 13. | |
| Outcome or subgroup title | No. of studies | No. of participants | Statistical method | Effect size |
| 1 Cocaine use assessed by the mean (SD) proportion of cocaine‐free urinalyses across the study per patient Show forest plot | 8 | 526 | Std. Mean Difference (IV, Random, 95% CI) | 0.16 [‐0.02, 0.33] |
| 2 Sustained cocaine abstinence Show forest plot | 14 | 1549 | Risk Ratio (M‐H, Random, 95% CI) | 1.36 [1.05, 1.77] |
| 3 Number of patients who finished the study Show forest plot | 24 | 2205 | Risk Ratio (M‐H, Random, 95% CI) | 1.00 [0.93, 1.06] |
| 4 Self‐reported cocaine use Show forest plot | 1 | 28 | Std. Mean Difference (IV, Random, 95% CI) | 0.0 [‐0.74, 0.74] |
| 5 Cocaine craving Show forest plot | 6 | 532 | Std. Mean Difference (IV, Random, 95% CI) | ‐0.12 [‐0.40, 0.17] |
| 6 Patient‐rated CGI severity scale Show forest plot | 1 | 300 | Std. Mean Difference (IV, Random, 95% CI) | 0.28 [0.05, 0.50] |
| 7 Investigator‐rated CGI severity scale Show forest plot | 1 | 300 | Std. Mean Difference (IV, Random, 95% CI) | 0.07 [‐0.15, 0.30] |
| 8 Patient‐rated CGI improvement scale Show forest plot | 1 | 300 | Std. Mean Difference (IV, Random, 95% CI) | 0.27 [0.04, 0.50] |
| 9 CGI investigator change Show forest plot | 1 | 300 | Std. Mean Difference (IV, Random, 95% CI) | 0.0 [‐0.23, 0.23] |
| 10 CGI investigator improvement: 1 or 2 Show forest plot | 1 | 106 | Risk Ratio (IV, Random, 95% CI) | 0.81 [0.57, 1.15] |
| 11 Depression symptoms severity Show forest plot | 2 | 90 | Std. Mean Difference (IV, Random, 95% CI) | ‐0.07 [‐0.48, 0.34] |
| 12 Heroin use assessed by the mean (SD) proportion of heroin‐free urinalyses across the study per patient Show forest plot | 2 | 167 | Std. Mean Difference (IV, Random, 95% CI) | 0.29 [‐0.02, 0.61] |
| 13 Sustained heroin abstinence Show forest plot | 2 | 199 | Risk Ratio (M‐H, Random, 95% CI) | 1.72 [1.15, 2.56] |
| 14 ADHD severity Show forest plot | 3 | 247 | Std. Mean Difference (IV, Random, 95% CI) | ‐0.41 [‐0.83, 0.01] |
| 15 Dropouts due to any adverse events Show forest plot | 18 | 1601 | Risk Difference (M‐H, Random, 95% CI) | 0.00 [‐0.01, 0.01] |
| 16 Dropouts due to cardiovascular adverse events Show forest plot | 11 | 688 | Risk Difference (M‐H, Random, 95% CI) | ‐0.00 [‐0.02, 0.01] |
| 17 Serious adverse events Show forest plot | 6 | 444 | Risk Difference (M‐H, Random, 95% CI) | ‐0.02 [‐0.06, 0.01] |
| Outcome or subgroup title | No. of studies | No. of participants | Statistical method | Effect size |
| 1 Cocaine use assessed by the mean (SD) proportion of cocaine‐free urinalyses across the study per patient Show forest plot | 8 | 526 | Std. Mean Difference (IV, Random, 95% CI) | 0.16 [‐0.02, 0.33] |
| 1.1 Bupropion | 2 | 176 | Std. Mean Difference (IV, Random, 95% CI) | 0.24 [‐0.06, 0.54] |
| 1.2 Dexamphetamine | 2 | 90 | Std. Mean Difference (IV, Random, 95% CI) | 0.31 [‐0.13, 0.74] |
| 1.3 Methylphenidate | 3 | 203 | Std. Mean Difference (IV, Random, 95% CI) | ‐0.09 [‐0.36, 0.19] |
| 1.4 Modafinil | 1 | 57 | Std. Mean Difference (IV, Random, 95% CI) | 0.59 [0.06, 1.12] |
| 2 Sustained cocaine abstinence Show forest plot | 14 | 1549 | Risk Ratio (M‐H, Random, 95% CI) | 1.36 [1.05, 1.77] |
| 2.1 Bupropion | 2 | 176 | Risk Ratio (M‐H, Random, 95% CI) | 1.63 [1.03, 2.59] |
| 2.2 Dexamphetamine | 3 | 154 | Risk Ratio (M‐H, Random, 95% CI) | 1.98 [1.12, 3.52] |
| 2.3 Mazindol | 1 | 43 | Risk Ratio (M‐H, Random, 95% CI) | 0.80 [0.29, 2.22] |
| 2.4 Methylphenidate | 1 | 106 | Risk Ratio (M‐H, Random, 95% CI) | 0.89 [0.37, 2.13] |
| 2.5 Mixed amphetamine salts | 1 | 126 | Risk Ratio (M‐H, Random, 95% CI) | 3.63 [1.15, 11.48] |
| 2.6 Modafinil | 6 | 644 | Risk Ratio (M‐H, Random, 95% CI) | 1.32 [0.85, 2.04] |
| 2.7 Selegiline | 1 | 300 | Risk Ratio (M‐H, Random, 95% CI) | 0.58 [0.24, 1.44] |
| 3 Number of patients who finished the study Show forest plot | 24 | 2205 | Risk Ratio (M‐H, Random, 95% CI) | 1.00 [0.93, 1.06] |
| 3.1 Bupropion | 3 | 325 | Risk Ratio (M‐H, Random, 95% CI) | 1.01 [0.89, 1.15] |
| 3.2 Dexamphetamine | 4 | 282 | Risk Ratio (M‐H, Random, 95% CI) | 1.37 [0.91, 2.05] |
| 3.3 Mazindol | 4 | 121 | Risk Ratio (M‐H, Random, 95% CI) | 0.96 [0.76, 1.21] |
| 3.4 Methamphetamine | 1 | 82 | Risk Ratio (M‐H, Random, 95% CI) | 1.04 [0.52, 2.11] |
| 3.5 Methylphenidate | 3 | 203 | Risk Ratio (M‐H, Random, 95% CI) | 0.91 [0.68, 1.21] |
| 3.6 Mixed amphetamine salts | 1 | 126 | Risk Ratio (M‐H, Random, 95% CI) | 1.14 [0.90, 1.45] |
| 3.7 Modafinil | 7 | 723 | Risk Ratio (M‐H, Random, 95% CI) | 1.04 [0.89, 1.21] |
| 3.8 Selegiline | 1 | 300 | Risk Ratio (M‐H, Random, 95% CI) | 0.88 [0.76, 1.03] |
| 3.9 Lisdexamfetamine | 1 | 43 | Risk Ratio (M‐H, Random, 95% CI) | 0.76 [0.48, 1.22] |
| 4 Cocaine craving Show forest plot | 6 | 532 | Std. Mean Difference (IV, Random, 95% CI) | ‐0.12 [‐0.40, 0.17] |
| 4.1 Bupropion | 2 | 137 | Std. Mean Difference (IV, Random, 95% CI) | 0.07 [‐0.30, 0.44] |
| 4.2 Mazindol | 2 | 52 | Std. Mean Difference (IV, Random, 95% CI) | ‐0.25 [‐0.81, 0.30] |
| 4.3 Selegiline | 1 | 300 | Std. Mean Difference (IV, Random, 95% CI) | 0.09 [‐0.14, 0.31] |
| 4.4 Lisdexamfetamine | 1 | 43 | Std. Mean Difference (IV, Random, 95% CI) | ‐0.73 [‐1.35, ‐0.11] |
| 5 Depression symptoms severity Show forest plot | 2 | 90 | Std. Mean Difference (IV, Random, 95% CI) | ‐0.07 [‐0.48, 0.34] |
| 5.1 Bupropion | 1 | 62 | Std. Mean Difference (IV, Random, 95% CI) | ‐0.04 [‐0.54, 0.46] |
| 5.2 Mazindol | 1 | 28 | Std. Mean Difference (IV, Random, 95% CI) | ‐0.13 [‐0.87, 0.61] |
| 6 Heroin use assessed by the mean (SD) proportion of heroin‐free urinalyses across the study per patient Show forest plot | 2 | 167 | Std. Mean Difference (IV, Random, 95% CI) | 0.29 [‐0.02, 0.61] |
| 6.1 Bupropion | 1 | 105 | Std. Mean Difference (IV, Random, 95% CI) | 0.29 [‐0.13, 0.71] |
| 6.2 Dexamphetamine | 1 | 62 | Std. Mean Difference (IV, Random, 95% CI) | 0.31 [‐0.24, 0.85] |
| 7 Sustained heroin abstinence Show forest plot | 2 | 199 | Risk Ratio (M‐H, Random, 95% CI) | 1.72 [1.15, 2.56] |
| 7.1 Bupropion | 1 | 105 | Risk Ratio (M‐H, Random, 95% CI) | 1.57 [0.78, 3.15] |
| 7.2 Dexamphetamine | 1 | 94 | Risk Ratio (M‐H, Random, 95% CI) | 1.98 [1.28, 3.04] |
| 8 ADHD severity Show forest plot | 3 | 247 | Std. Mean Difference (IV, Random, 95% CI) | ‐0.41 [‐0.83, 0.01] |
| 8.1 Methylphenidate | 2 | 121 | Std. Mean Difference (IV, Random, 95% CI) | ‐0.36 [‐1.11, 0.38] |
| 8.2 Mixed amphetamine salts | 1 | 126 | Std. Mean Difference (IV, Random, 95% CI) | ‐0.55 [‐0.93, ‐0.18] |
| 9 Dropouts due to any adverse events Show forest plot | 18 | 1601 | Risk Difference (M‐H, Random, 95% CI) | 0.00 [‐0.01, 0.01] |
| 9.1 Bupropion | 1 | 149 | Risk Difference (M‐H, Random, 95% CI) | 0.00 [‐0.05, 0.05] |
| 9.2 Dexamphetamine | 2 | 158 | Risk Difference (M‐H, Random, 95% CI) | 0.12 [‐0.06, 0.30] |
| 9.3 Mazindol | 4 | 121 | Risk Difference (M‐H, Random, 95% CI) | ‐0.01 [‐0.09, 0.07] |
| 9.4 Methamphetamine | 1 | 82 | Risk Difference (M‐H, Random, 95% CI) | 0.02 [‐0.05, 0.08] |
| 9.5 Methylphenidate | 3 | 216 | Risk Difference (M‐H, Random, 95% CI) | ‐0.01 [‐0.05, 0.03] |
| 9.6 Selegiline | 1 | 300 | Risk Difference (M‐H, Random, 95% CI) | 0.0 [‐0.01, 0.01] |
| 9.7 Modafinil | 4 | 406 | Risk Difference (M‐H, Random, 95% CI) | ‐0.01 [‐0.05, 0.02] |
| 9.8 Mixed amphetamine salts | 1 | 126 | Risk Difference (M‐H, Random, 95% CI) | 0.0 [‐0.04, 0.04] |
| 9.9 Lisdexamfetamine | 1 | 43 | Risk Difference (M‐H, Random, 95% CI) | 0.0 [‐0.09, 0.09] |
| 10 Dropouts due to cardiovascular adverse events Show forest plot | 11 | 688 | Risk Difference (M‐H, Random, 95% CI) | ‐0.00 [‐0.02, 0.01] |
| 10.1 Bupropion | 1 | 149 | Risk Difference (M‐H, Random, 95% CI) | 0.0 [‐0.03, 0.03] |
| 10.2 Dexamphetamine | 1 | 30 | Risk Difference (M‐H, Random, 95% CI) | 0.0 [‐0.12, 0.12] |
| 10.3 Mazindol | 3 | 84 | Risk Difference (M‐H, Random, 95% CI) | 0.0 [‐0.07, 0.07] |
| 10.4 Methylphenidate | 3 | 216 | Risk Difference (M‐H, Random, 95% CI) | ‐0.01 [‐0.05, 0.03] |
| 10.5 Modafinil | 1 | 40 | Risk Difference (M‐H, Random, 95% CI) | ‐0.06 [‐0.19, 0.08] |
| 10.6 Mixed amphetamine salts | 1 | 126 | Risk Difference (M‐H, Random, 95% CI) | 0.0 [‐0.04, 0.04] |
| 10.7 Lisdexamfetamine | 1 | 43 | Risk Difference (M‐H, Random, 95% CI) | 0.0 [‐0.09, 0.09] |
| 11 Serious adverse events Show forest plot | 6 | 444 | Risk Difference (M‐H, Random, 95% CI) | ‐0.02 [‐0.06, 0.01] |
| 11.1 Mixed amfetamine salts | 1 | 126 | Risk Difference (M‐H, Random, 95% CI) | ‐0.05 [‐0.12, 0.02] |
| 11.2 Modafinil | 4 | 275 | Risk Difference (M‐H, Random, 95% CI) | ‐0.02 [‐0.08, 0.04] |
| 11.3 Lisdexamfetamine | 1 | 43 | Risk Difference (M‐H, Random, 95% CI) | ‐0.00 [‐0.13, 0.12] |
| Outcome or subgroup title | No. of studies | No. of participants | Statistical method | Effect size |
| 1 Cocaine use assessed by the mean (SD) proportion of cocaine‐free urinalyses across the study per patient Show forest plot | 8 | 526 | Std. Mean Difference (IV, Random, 95% CI) | 0.16 [‐0.02, 0.33] |
| 1.1 Cocaine abuse or dependence | 2 | 176 | Std. Mean Difference (IV, Random, 95% CI) | 0.24 [‐0.06, 0.54] |
| 1.2 Cocaine dependence | 6 | 350 | Std. Mean Difference (IV, Random, 95% CI) | 0.14 [‐0.13, 0.40] |
| 2 Sustained cocaine abstinence Show forest plot | 14 | 1549 | Risk Ratio (M‐H, Random, 95% CI) | 1.36 [1.05, 1.77] |
| 2.1 Cocaine abuse or dependence | 2 | 176 | Risk Ratio (M‐H, Random, 95% CI) | 1.63 [1.03, 2.59] |
| 2.2 Cocaine dependence | 12 | 1373 | Risk Ratio (M‐H, Random, 95% CI) | 1.31 [0.95, 1.81] |
| 3 Number of patients who finished the study Show forest plot | 24 | 2205 | Risk Ratio (M‐H, Random, 95% CI) | 1.00 [0.93, 1.06] |
| 3.1 Cocaine abuse or dependence | 3 | 200 | Risk Ratio (M‐H, Random, 95% CI) | 0.92 [0.69, 1.24] |
| 3.2 Cocaine dependence | 21 | 2005 | Risk Ratio (M‐H, Random, 95% CI) | 1.00 [0.93, 1.07] |
| 4 Cocaine craving Show forest plot | 6 | 532 | Std. Mean Difference (IV, Random, 95% CI) | ‐0.12 [‐0.40, 0.17] |
| 4.1 Cocaine abuse or dependence | 2 | 36 | Std. Mean Difference (IV, Random, 95% CI) | ‐0.53 [‐1.21, 0.14] |
| 4.2 Cocaine dependence | 4 | 496 | Std. Mean Difference (IV, Random, 95% CI) | ‐0.05 [‐0.36, 0.26] |
| 5 Depressive symptoms severity Show forest plot | 2 | 90 | Std. Mean Difference (IV, Random, 95% CI) | ‐0.07 [‐0.48, 0.34] |
| 5.1 Cocaine abuse or dependence | 1 | 62 | Std. Mean Difference (IV, Random, 95% CI) | ‐0.04 [‐0.54, 0.46] |
| 5.2 Cocaine dependence | 1 | 28 | Std. Mean Difference (IV, Random, 95% CI) | ‐0.13 [‐0.87, 0.61] |
| 6 Heroin use assessed by the mean (SD) proportion of heroin‐free urinalyses across the study per patient Show forest plot | 2 | 167 | Std. Mean Difference (IV, Random, 95% CI) | 0.29 [‐0.02, 0.61] |
| 6.1 Cocaine abuse or dependence | 1 | 105 | Std. Mean Difference (IV, Random, 95% CI) | 0.29 [‐0.13, 0.71] |
| 6.2 Cocaine dependence | 1 | 62 | Std. Mean Difference (IV, Random, 95% CI) | 0.31 [‐0.24, 0.85] |
| 7 Sustained heroin abstinence Show forest plot | 2 | 199 | Risk Ratio (M‐H, Random, 95% CI) | 1.72 [1.15, 2.56] |
| 7.1 Cocaine abuse or dependence | 2 | 199 | Risk Ratio (M‐H, Random, 95% CI) | 1.72 [1.15, 2.56] |
| 7.2 Cocaine dependence | 0 | 0 | Risk Ratio (M‐H, Random, 95% CI) | 0.0 [0.0, 0.0] |
| 8 ADHD severity Show forest plot | 3 | 247 | Std. Mean Difference (IV, Random, 95% CI) | ‐0.41 [‐0.83, 0.01] |
| 8.1 Cocaine abuse or dependence | 0 | 0 | Std. Mean Difference (IV, Random, 95% CI) | 0.0 [0.0, 0.0] |
| 8.2 Cocaine dependence | 3 | 247 | Std. Mean Difference (IV, Random, 95% CI) | ‐0.41 [‐0.83, 0.01] |
| 9 Dropouts due to any adverse events Show forest plot | 18 | 1601 | Risk Difference (M‐H, Random, 95% CI) | 0.00 [‐0.01, 0.01] |
| 9.1 Cocaine abuse or dependence | 1 | 24 | Risk Difference (M‐H, Random, 95% CI) | 0.0 [‐0.15, 0.15] |
| 9.2 Cocaine dependence | 17 | 1577 | Risk Difference (M‐H, Random, 95% CI) | 0.00 [‐0.01, 0.01] |
| 10 Dropouts due to cardiovascular adverse events Show forest plot | 10 | 645 | Risk Difference (M‐H, Random, 95% CI) | ‐0.00 [‐0.02, 0.01] |
| 10.1 Cocaine abuse or dependence | 1 | 24 | Risk Difference (M‐H, Random, 95% CI) | 0.0 [‐0.15, 0.15] |
| 10.2 Cocaine dependence | 9 | 621 | Risk Difference (M‐H, Random, 95% CI) | ‐0.00 [‐0.02, 0.01] |
| 11 Serious adverse events Show forest plot | 6 | 444 | Risk Difference (M‐H, Random, 95% CI) | ‐0.02 [‐0.06, 0.01] |
| 11.1 Cocaine abuse and dependence | 0 | 0 | Risk Difference (M‐H, Random, 95% CI) | 0.0 [0.0, 0.0] |
| 11.2 Cocaine dependence | 6 | 444 | Risk Difference (M‐H, Random, 95% CI) | ‐0.02 [‐0.06, 0.01] |
| Outcome or subgroup title | No. of studies | No. of participants | Statistical method | Effect size |
| 1 Cocaine use assessed by the mean (SD) proportion of cocaine‐free urinalyses across the study per patient Show forest plot | 8 | 526 | Std. Mean Difference (IV, Random, 95% CI) | 0.16 [‐0.02, 0.33] |
| 1.1 With comorbid ADHD | 2 | 154 | Std. Mean Difference (IV, Random, 95% CI) | ‐0.01 [‐0.33, 0.30] |
| 1.2 Without comorbid ADHD | 6 | 372 | Std. Mean Difference (IV, Random, 95% CI) | 0.23 [0.02, 0.44] |
| 2 Sustained cocaine abstinence Show forest plot | 14 | 1549 | Risk Ratio (M‐H, Random, 95% CI) | 1.36 [1.05, 1.77] |
| 2.1 With comorbid ADHD | 2 | 232 | Risk Ratio (M‐H, Random, 95% CI) | 1.71 [0.42, 6.98] |
| 2.2 Without comorbid ADHD | 12 | 1317 | Risk Ratio (M‐H, Random, 95% CI) | 1.34 [1.03, 1.74] |
| 3 Number of patients who finished the study Show forest plot | 24 | 2205 | Risk Ratio (M‐H, Random, 95% CI) | 1.00 [0.93, 1.06] |
| 3.1 With comorbid ADHD | 3 | 280 | Risk Ratio (M‐H, Random, 95% CI) | 1.05 [0.87, 1.28] |
| 3.2 Without comorbid ADHD | 21 | 1925 | Risk Ratio (M‐H, Random, 95% CI) | 0.99 [0.92, 1.06] |
| 4 Cocaine craving Show forest plot | 6 | 532 | Std. Mean Difference (IV, Random, 95% CI) | ‐0.12 [‐0.40, 0.17] |
| 4.1 With comorbid ADHD | 0 | 0 | Std. Mean Difference (IV, Random, 95% CI) | 0.0 [0.0, 0.0] |
| 4.2 Without comorbid ADHD | 6 | 532 | Std. Mean Difference (IV, Random, 95% CI) | ‐0.12 [‐0.40, 0.17] |
| 5 Depressive symptoms severity Show forest plot | 2 | 90 | Std. Mean Difference (IV, Random, 95% CI) | ‐0.07 [‐0.48, 0.34] |
| 5.1 With comorbid ADHD | 0 | 0 | Std. Mean Difference (IV, Random, 95% CI) | 0.0 [0.0, 0.0] |
| 5.2 Without comorbid ADHD | 2 | 90 | Std. Mean Difference (IV, Random, 95% CI) | ‐0.07 [‐0.48, 0.34] |
| 6 Heroin use assessed by the mean (SD) proportion of heroin‐free urinalyses across the study per patient Show forest plot | 2 | 167 | Std. Mean Difference (IV, Random, 95% CI) | 0.29 [‐0.02, 0.61] |
| 6.1 With comorbid ADHD | 0 | 0 | Std. Mean Difference (IV, Random, 95% CI) | 0.0 [0.0, 0.0] |
| 6.2 Without comorbid ADHD | 2 | 167 | Std. Mean Difference (IV, Random, 95% CI) | 0.29 [‐0.02, 0.61] |
| 7 Sustained heroin abstinence Show forest plot | 2 | 199 | Risk Ratio (M‐H, Random, 95% CI) | 1.72 [1.15, 2.56] |
| 7.1 With comorbid ADHD | 0 | 0 | Risk Ratio (M‐H, Random, 95% CI) | 0.0 [0.0, 0.0] |
| 7.2 Withou comorbid ADHD | 2 | 199 | Risk Ratio (M‐H, Random, 95% CI) | 1.72 [1.15, 2.56] |
| 8 ADHD severity Show forest plot | 3 | 247 | Std. Mean Difference (IV, Random, 95% CI) | ‐0.41 [‐0.83, 0.01] |
| 8.1 With comorbid ADHD | 3 | 247 | Std. Mean Difference (IV, Random, 95% CI) | ‐0.41 [‐0.83, 0.01] |
| 8.2 Without comorbid ADHD | 0 | 0 | Std. Mean Difference (IV, Random, 95% CI) | 0.0 [0.0, 0.0] |
| 9 Dropouts due to any adverse events Show forest plot | 18 | 1601 | Risk Difference (M‐H, Random, 95% CI) | 0.00 [‐0.01, 0.01] |
| 9.1 With comorbid ADHD | 3 | 280 | Risk Difference (M‐H, Random, 95% CI) | ‐0.00 [‐0.03, 0.03] |
| 9.2 Without comorbid ADHD | 15 | 1321 | Risk Difference (M‐H, Random, 95% CI) | 0.00 [‐0.01, 0.01] |
| 10 Dropouts due to cardiovascular adverse events Show forest plot | 11 | 688 | Risk Difference (M‐H, Random, 95% CI) | ‐0.00 [‐0.02, 0.01] |
| 10.1 With comorbid ADHD | 3 | 280 | Risk Difference (M‐H, Random, 95% CI) | ‐0.01 [‐0.03, 0.02] |
| 10.2 Without comorbid ADHD | 8 | 408 | Risk Difference (M‐H, Random, 95% CI) | ‐0.00 [‐0.02, 0.02] |
| 11 Serious adverse events Show forest plot | 6 | 444 | Risk Difference (M‐H, Random, 95% CI) | ‐0.02 [‐0.06, 0.01] |
| 11.1 With ADHD | 0 | 0 | Risk Difference (M‐H, Random, 95% CI) | 0.0 [0.0, 0.0] |
| 11.2 Without ADHD | 6 | 444 | Risk Difference (M‐H, Random, 95% CI) | ‐0.02 [‐0.06, 0.01] |
| Outcome or subgroup title | No. of studies | No. of participants | Statistical method | Effect size |
| 1 Cocaine use assessed by the mean (SD) proportion of cocaine‐free urinalyses across the study per patient Show forest plot | 8 | 526 | Std. Mean Difference (IV, Random, 95% CI) | 0.16 [‐0.02, 0.33] |
| 1.1 With comorbid opioid dependence | 2 | 166 | Std. Mean Difference (IV, Random, 95% CI) | 0.26 [‐0.05, 0.58] |
| 1.2 Without comorbid opioid dependence | 6 | 360 | Std. Mean Difference (IV, Random, 95% CI) | 0.13 [‐0.13, 0.38] |
| 2 Sustained cocaine abstinence Show forest plot | 14 | 1549 | Risk Ratio (M‐H, Random, 95% CI) | 1.36 [1.05, 1.77] |
| 2.1 With comorbid opioid dependence | 2 | 200 | Risk Ratio (M‐H, Random, 95% CI) | 1.85 [1.23, 2.79] |
| 2.2 Without comorbid opioid dependence | 12 | 1349 | Risk Ratio (M‐H, Random, 95% CI) | 1.22 [0.91, 1.66] |
| 3 Number of patients who finished the study Show forest plot | 24 | 2205 | Risk Ratio (M‐H, Random, 95% CI) | 1.00 [0.93, 1.06] |
| 3.1 With comorbid opioid dependence | 5 | 403 | Risk Ratio (M‐H, Random, 95% CI) | 1.02 [0.91, 1.14] |
| 3.2 Without comorbid opioid dependence | 19 | 1802 | Risk Ratio (M‐H, Random, 95% CI) | 0.98 [0.91, 1.07] |
| 4 Cocaine craving Show forest plot | 6 | 532 | Std. Mean Difference (IV, Random, 95% CI) | ‐0.12 [‐0.40, 0.17] |
| 4.1 With comorbid opioid dependence | 1 | 125 | Std. Mean Difference (IV, Random, 95% CI) | 0.13 [‐0.22, 0.48] |
| 4.2 Without comorbid opioid dependence | 5 | 407 | Std. Mean Difference (IV, Random, 95% CI) | ‐0.25 [‐0.65, 0.14] |
| 5 Depression symptoms severity Show forest plot | 2 | 90 | Std. Mean Difference (IV, Random, 95% CI) | ‐0.07 [‐0.48, 0.34] |
| 5.1 With comorbid opioid dependence | 1 | 62 | Std. Mean Difference (IV, Random, 95% CI) | ‐0.04 [‐0.54, 0.46] |
| 5.2 Without comorbid opioid dependence | 1 | 28 | Std. Mean Difference (IV, Random, 95% CI) | ‐0.13 [‐0.87, 0.61] |
| 6 Heroin use assessed by the mean (SD) proportion of heroin‐free urinalyses across the study per patient Show forest plot | 2 | 167 | Std. Mean Difference (IV, Random, 95% CI) | 0.29 [‐0.02, 0.61] |
| 6.1 With comorbid opioid dependence | 2 | 167 | Std. Mean Difference (IV, Random, 95% CI) | 0.29 [‐0.02, 0.61] |
| 6.2 Without comorbid opioid dependence | 0 | 0 | Std. Mean Difference (IV, Random, 95% CI) | 0.0 [0.0, 0.0] |
| 7 Sustained heroin abstinence Show forest plot | 2 | 199 | Risk Ratio (M‐H, Random, 95% CI) | 1.72 [1.15, 2.56] |
| 7.1 With comorbid opioid dependence | 2 | 199 | Risk Ratio (M‐H, Random, 95% CI) | 1.72 [1.15, 2.56] |
| 7.2 Without comorbid opioid dependence | 0 | 0 | Risk Ratio (M‐H, Random, 95% CI) | 0.0 [0.0, 0.0] |
| 8 ADHD severity Show forest plot | 3 | 247 | Std. Mean Difference (IV, Random, 95% CI) | ‐0.41 [‐0.83, 0.01] |
| 8.1 With comorbid opioid dependence | 0 | 0 | Std. Mean Difference (IV, Random, 95% CI) | 0.0 [0.0, 0.0] |
| 8.2 Without comorbid opioid dependence | 3 | 247 | Std. Mean Difference (IV, Random, 95% CI) | ‐0.41 [‐0.83, 0.01] |
| 9 Dropouts due to any adverse events Show forest plot | 18 | 1601 | Risk Difference (M‐H, Random, 95% CI) | 0.00 [‐0.01, 0.01] |
| 9.1 With comorbid opioid dependence | 4 | 265 | Risk Difference (M‐H, Random, 95% CI) | 0.00 [‐0.04, 0.05] |
| 9.2 Without comorbid opioid dependence | 14 | 1336 | Risk Difference (M‐H, Random, 95% CI) | 0.00 [‐0.01, 0.01] |
| 10 Dropouts due to cardiovascular adverse events Show forest plot | 11 | 688 | Risk Difference (M‐H, Random, 95% CI) | ‐0.00 [‐0.02, 0.01] |
| 10.1 With comorbid opioid dependence | 3 | 228 | Risk Difference (M‐H, Random, 95% CI) | 0.0 [‐0.02, 0.02] |
| 10.2 Without comorbid opioid dependence | 8 | 460 | Risk Difference (M‐H, Random, 95% CI) | ‐0.01 [‐0.03, 0.02] |
| 11 Serious adverse events Show forest plot | 6 | 444 | Risk Difference (M‐H, Random, 95% CI) | ‐0.02 [‐0.06, 0.01] |
| 11.1 With comorbid opioid dependence | 0 | 0 | Risk Difference (M‐H, Random, 95% CI) | 0.0 [0.0, 0.0] |
| 11.2 Without comorbid opioid dependence | 6 | 444 | Risk Difference (M‐H, Random, 95% CI) | ‐0.02 [‐0.06, 0.01] |
| Outcome or subgroup title | No. of studies | No. of participants | Statistical method | Effect size |
| 1 Dropouts due to any adverse events Show forest plot | 18 | 1601 | Risk Ratio (M‐H, Random, 95% CI) | 1.11 [0.60, 2.02] |
| 2 Dropouts due to cardiovascular adverse events Show forest plot | 11 | 688 | Risk Ratio (M‐H, Random, 95% CI) | 0.48 [0.09, 2.70] |