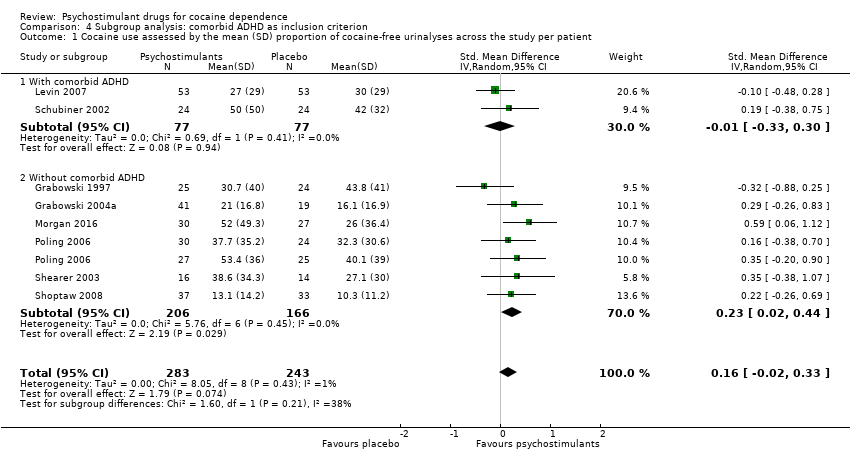
| 1 Cocaine use assessed by the mean (SD) proportion of cocaine‐free urinalyses across the study per patient Show forest plot | 8 | 526 | Std. Mean Difference (IV, Random, 95% CI) | 0.16 [‐0.02, 0.33] |
|
| 1.1 Bupropion | 2 | 176 | Std. Mean Difference (IV, Random, 95% CI) | 0.24 [‐0.06, 0.54] |
| 1.2 Dexamphetamine | 2 | 90 | Std. Mean Difference (IV, Random, 95% CI) | 0.31 [‐0.13, 0.74] |
| 1.3 Methylphenidate | 3 | 203 | Std. Mean Difference (IV, Random, 95% CI) | ‐0.09 [‐0.36, 0.19] |
| 1.4 Modafinil | 1 | 57 | Std. Mean Difference (IV, Random, 95% CI) | 0.59 [0.06, 1.12] |
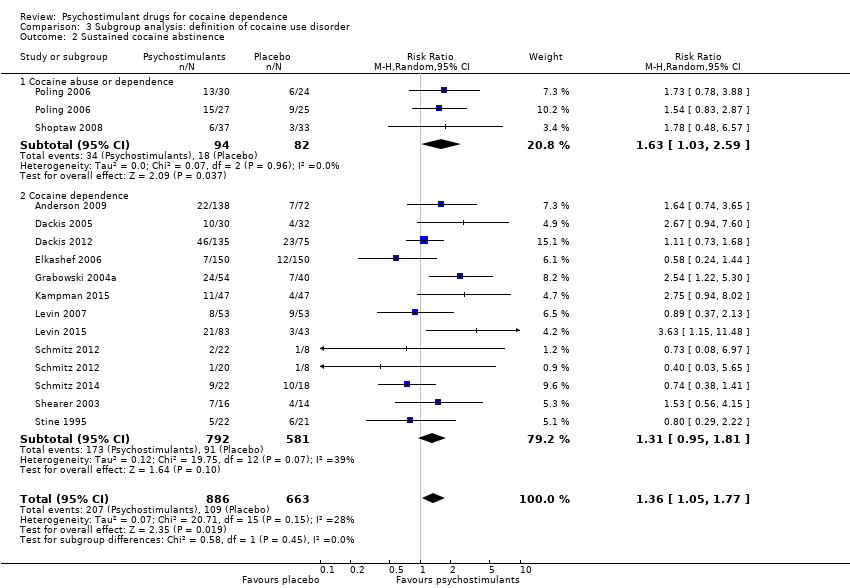
| 2 Sustained cocaine abstinence Show forest plot | 14 | 1549 | Risk Ratio (M‐H, Random, 95% CI) | 1.36 [1.05, 1.77] |
|
| 2.1 Bupropion | 2 | 176 | Risk Ratio (M‐H, Random, 95% CI) | 1.63 [1.03, 2.59] |
| 2.2 Dexamphetamine | 3 | 154 | Risk Ratio (M‐H, Random, 95% CI) | 1.98 [1.12, 3.52] |
| 2.3 Mazindol | 1 | 43 | Risk Ratio (M‐H, Random, 95% CI) | 0.80 [0.29, 2.22] |
| 2.4 Methylphenidate | 1 | 106 | Risk Ratio (M‐H, Random, 95% CI) | 0.89 [0.37, 2.13] |
| 2.5 Mixed amphetamine salts | 1 | 126 | Risk Ratio (M‐H, Random, 95% CI) | 3.63 [1.15, 11.48] |
| 2.6 Modafinil | 6 | 644 | Risk Ratio (M‐H, Random, 95% CI) | 1.32 [0.85, 2.04] |
| 2.7 Selegiline | 1 | 300 | Risk Ratio (M‐H, Random, 95% CI) | 0.58 [0.24, 1.44] |
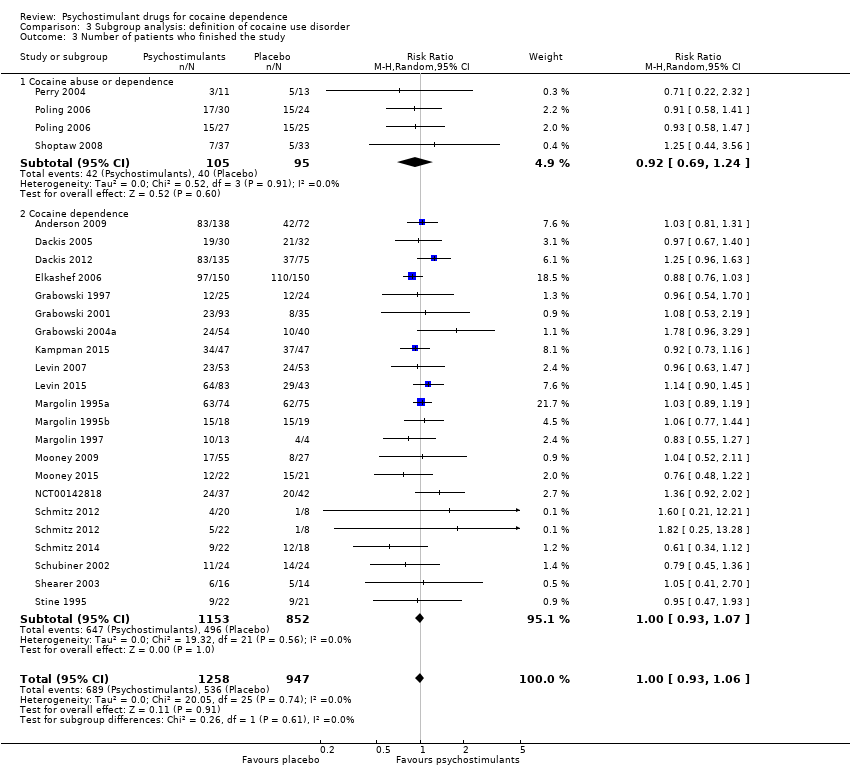
| 3 Number of patients who finished the study Show forest plot | 24 | 2205 | Risk Ratio (M‐H, Random, 95% CI) | 1.00 [0.93, 1.06] |
|
| 3.1 Bupropion | 3 | 325 | Risk Ratio (M‐H, Random, 95% CI) | 1.01 [0.89, 1.15] |
| 3.2 Dexamphetamine | 4 | 282 | Risk Ratio (M‐H, Random, 95% CI) | 1.37 [0.91, 2.05] |
| 3.3 Mazindol | 4 | 121 | Risk Ratio (M‐H, Random, 95% CI) | 0.96 [0.76, 1.21] |
| 3.4 Methamphetamine | 1 | 82 | Risk Ratio (M‐H, Random, 95% CI) | 1.04 [0.52, 2.11] |
| 3.5 Methylphenidate | 3 | 203 | Risk Ratio (M‐H, Random, 95% CI) | 0.91 [0.68, 1.21] |
| 3.6 Mixed amphetamine salts | 1 | 126 | Risk Ratio (M‐H, Random, 95% CI) | 1.14 [0.90, 1.45] |
| 3.7 Modafinil | 7 | 723 | Risk Ratio (M‐H, Random, 95% CI) | 1.04 [0.89, 1.21] |
| 3.8 Selegiline | 1 | 300 | Risk Ratio (M‐H, Random, 95% CI) | 0.88 [0.76, 1.03] |
| 3.9 Lisdexamfetamine | 1 | 43 | Risk Ratio (M‐H, Random, 95% CI) | 0.76 [0.48, 1.22] |
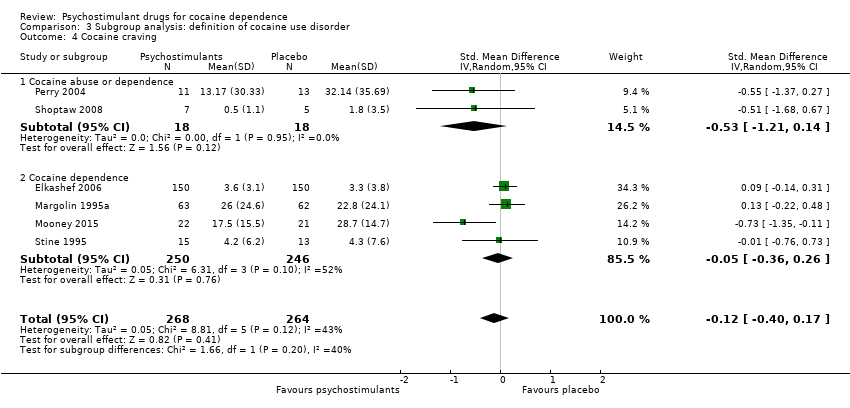
| 4 Cocaine craving Show forest plot | 6 | 532 | Std. Mean Difference (IV, Random, 95% CI) | ‐0.12 [‐0.40, 0.17] |
|
| 4.1 Bupropion | 2 | 137 | Std. Mean Difference (IV, Random, 95% CI) | 0.07 [‐0.30, 0.44] |
| 4.2 Mazindol | 2 | 52 | Std. Mean Difference (IV, Random, 95% CI) | ‐0.25 [‐0.81, 0.30] |
| 4.3 Selegiline | 1 | 300 | Std. Mean Difference (IV, Random, 95% CI) | 0.09 [‐0.14, 0.31] |
| 4.4 Lisdexamfetamine | 1 | 43 | Std. Mean Difference (IV, Random, 95% CI) | ‐0.73 [‐1.35, ‐0.11] |
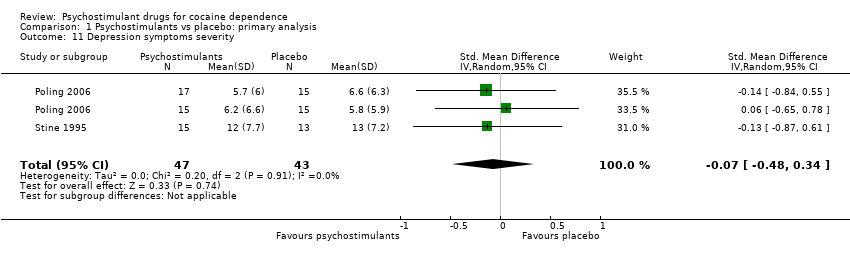
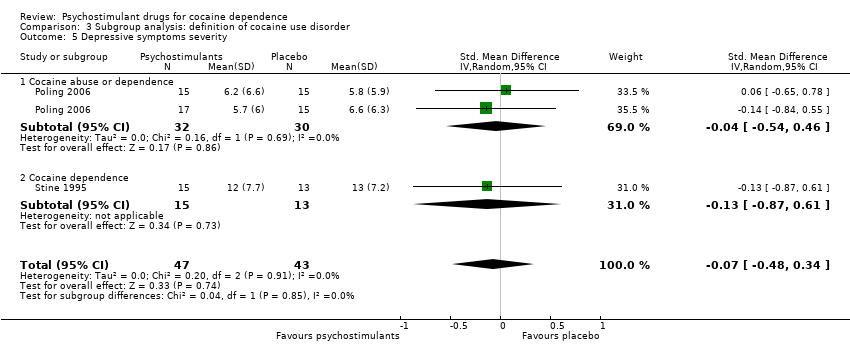
| 5 Depression symptoms severity Show forest plot | 2 | 90 | Std. Mean Difference (IV, Random, 95% CI) | ‐0.07 [‐0.48, 0.34] |
|
| 5.1 Bupropion | 1 | 62 | Std. Mean Difference (IV, Random, 95% CI) | ‐0.04 [‐0.54, 0.46] |
| 5.2 Mazindol | 1 | 28 | Std. Mean Difference (IV, Random, 95% CI) | ‐0.13 [‐0.87, 0.61] |
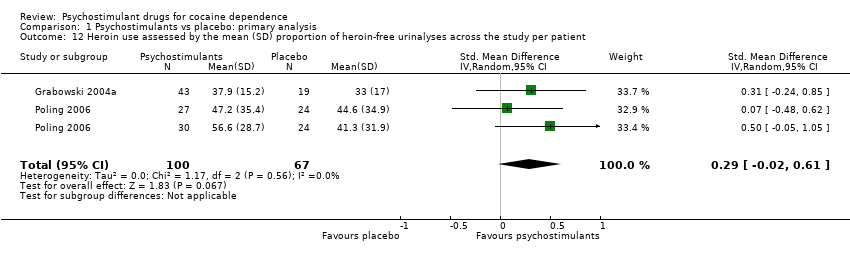
| 6 Heroin use assessed by the mean (SD) proportion of heroin‐free urinalyses across the study per patient Show forest plot | 2 | 167 | Std. Mean Difference (IV, Random, 95% CI) | 0.29 [‐0.02, 0.61] |
|
| 6.1 Bupropion | 1 | 105 | Std. Mean Difference (IV, Random, 95% CI) | 0.29 [‐0.13, 0.71] |
| 6.2 Dexamphetamine | 1 | 62 | Std. Mean Difference (IV, Random, 95% CI) | 0.31 [‐0.24, 0.85] |
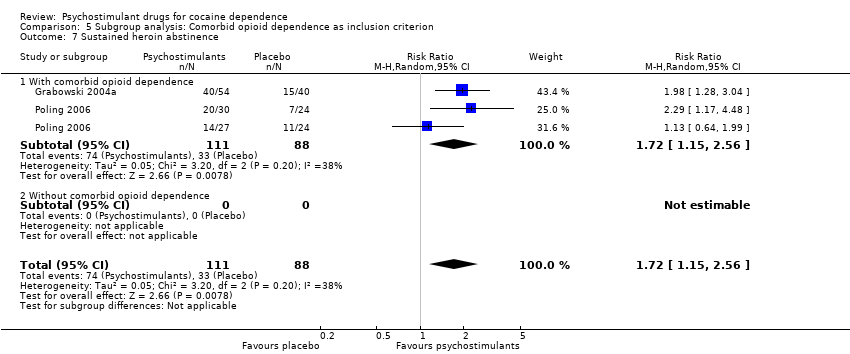
| 7 Sustained heroin abstinence Show forest plot | 2 | 199 | Risk Ratio (M‐H, Random, 95% CI) | 1.72 [1.15, 2.56] |
|
| 7.1 Bupropion | 1 | 105 | Risk Ratio (M‐H, Random, 95% CI) | 1.57 [0.78, 3.15] |
| 7.2 Dexamphetamine | 1 | 94 | Risk Ratio (M‐H, Random, 95% CI) | 1.98 [1.28, 3.04] |
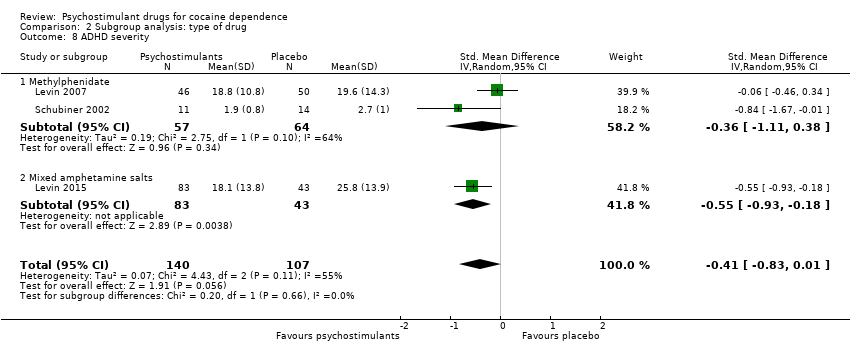
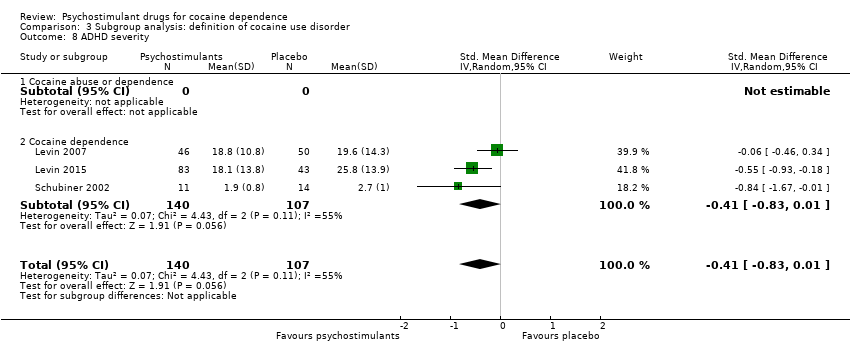
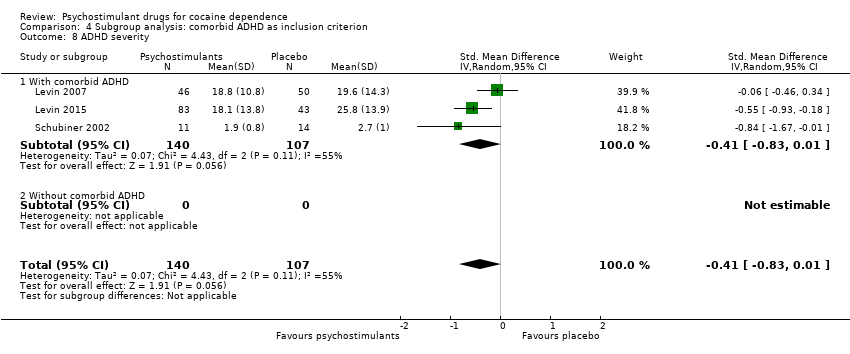
| 8 ADHD severity Show forest plot | 3 | 247 | Std. Mean Difference (IV, Random, 95% CI) | ‐0.41 [‐0.83, 0.01] |
|
| 8.1 Methylphenidate | 2 | 121 | Std. Mean Difference (IV, Random, 95% CI) | ‐0.36 [‐1.11, 0.38] |
| 8.2 Mixed amphetamine salts | 1 | 126 | Std. Mean Difference (IV, Random, 95% CI) | ‐0.55 [‐0.93, ‐0.18] |
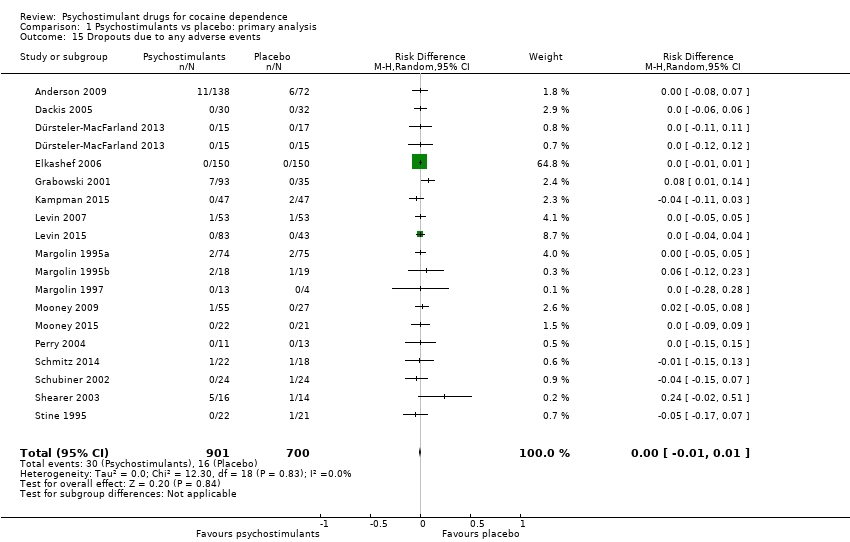
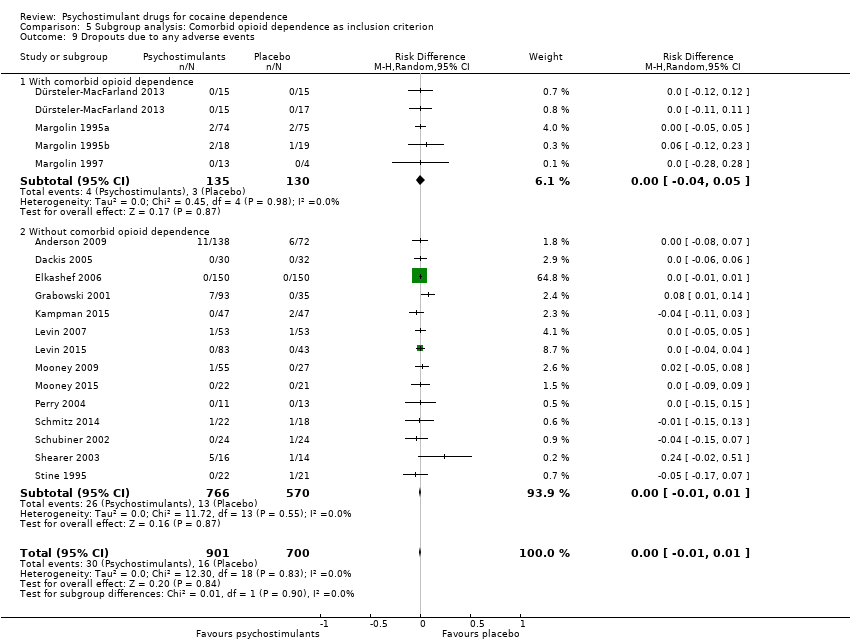
| 9 Dropouts due to any adverse events Show forest plot | 18 | 1601 | Risk Difference (M‐H, Random, 95% CI) | 0.00 [‐0.01, 0.01] |
|
| 9.1 Bupropion | 1 | 149 | Risk Difference (M‐H, Random, 95% CI) | 0.00 [‐0.05, 0.05] |
| 9.2 Dexamphetamine | 2 | 158 | Risk Difference (M‐H, Random, 95% CI) | 0.12 [‐0.06, 0.30] |
| 9.3 Mazindol | 4 | 121 | Risk Difference (M‐H, Random, 95% CI) | ‐0.01 [‐0.09, 0.07] |
| 9.4 Methamphetamine | 1 | 82 | Risk Difference (M‐H, Random, 95% CI) | 0.02 [‐0.05, 0.08] |
| 9.5 Methylphenidate | 3 | 216 | Risk Difference (M‐H, Random, 95% CI) | ‐0.01 [‐0.05, 0.03] |
| 9.6 Selegiline | 1 | 300 | Risk Difference (M‐H, Random, 95% CI) | 0.0 [‐0.01, 0.01] |
| 9.7 Modafinil | 4 | 406 | Risk Difference (M‐H, Random, 95% CI) | ‐0.01 [‐0.05, 0.02] |
| 9.8 Mixed amphetamine salts | 1 | 126 | Risk Difference (M‐H, Random, 95% CI) | 0.0 [‐0.04, 0.04] |
| 9.9 Lisdexamfetamine | 1 | 43 | Risk Difference (M‐H, Random, 95% CI) | 0.0 [‐0.09, 0.09] |
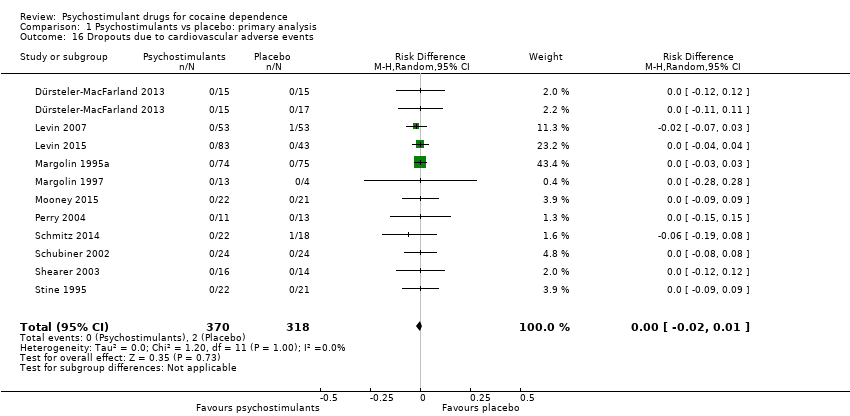
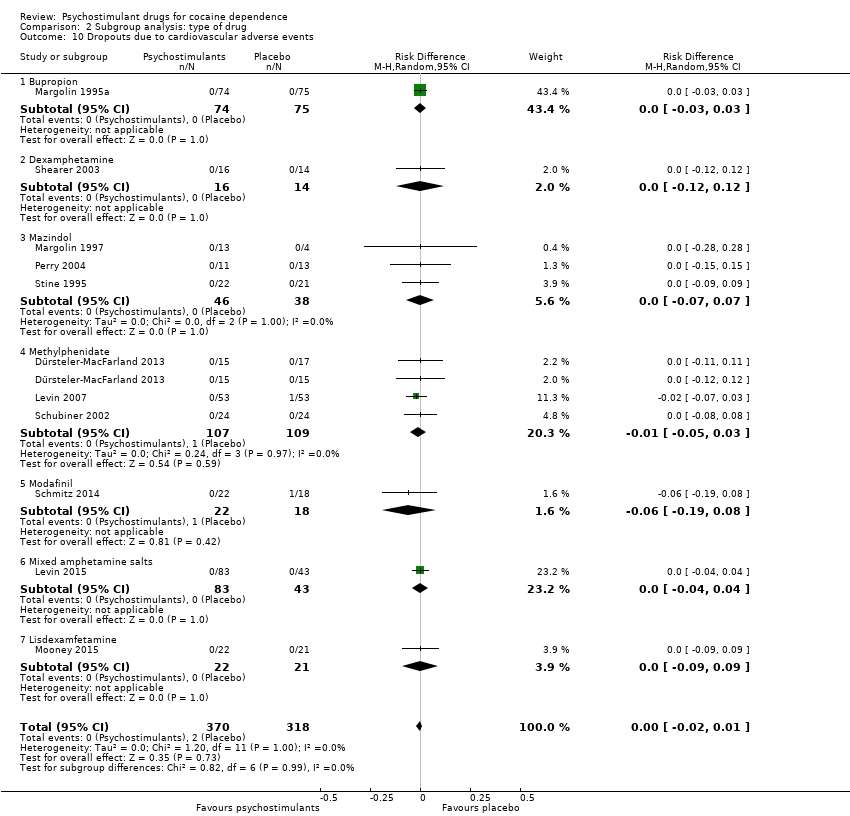
| 10 Dropouts due to cardiovascular adverse events Show forest plot | 11 | 688 | Risk Difference (M‐H, Random, 95% CI) | ‐0.00 [‐0.02, 0.01] |
|
| 10.1 Bupropion | 1 | 149 | Risk Difference (M‐H, Random, 95% CI) | 0.0 [‐0.03, 0.03] |
| 10.2 Dexamphetamine | 1 | 30 | Risk Difference (M‐H, Random, 95% CI) | 0.0 [‐0.12, 0.12] |
| 10.3 Mazindol | 3 | 84 | Risk Difference (M‐H, Random, 95% CI) | 0.0 [‐0.07, 0.07] |
| 10.4 Methylphenidate | 3 | 216 | Risk Difference (M‐H, Random, 95% CI) | ‐0.01 [‐0.05, 0.03] |
| 10.5 Modafinil | 1 | 40 | Risk Difference (M‐H, Random, 95% CI) | ‐0.06 [‐0.19, 0.08] |
| 10.6 Mixed amphetamine salts | 1 | 126 | Risk Difference (M‐H, Random, 95% CI) | 0.0 [‐0.04, 0.04] |
| 10.7 Lisdexamfetamine | 1 | 43 | Risk Difference (M‐H, Random, 95% CI) | 0.0 [‐0.09, 0.09] |
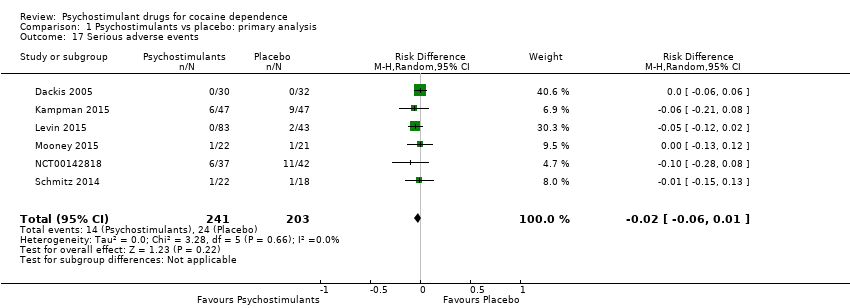
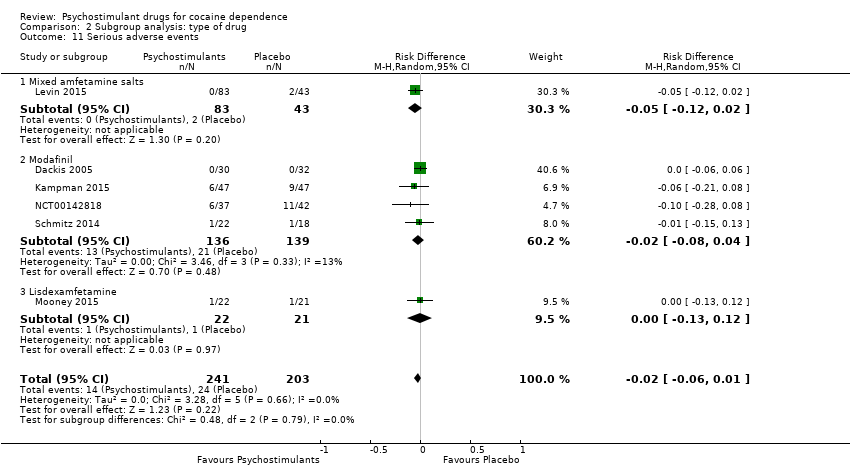
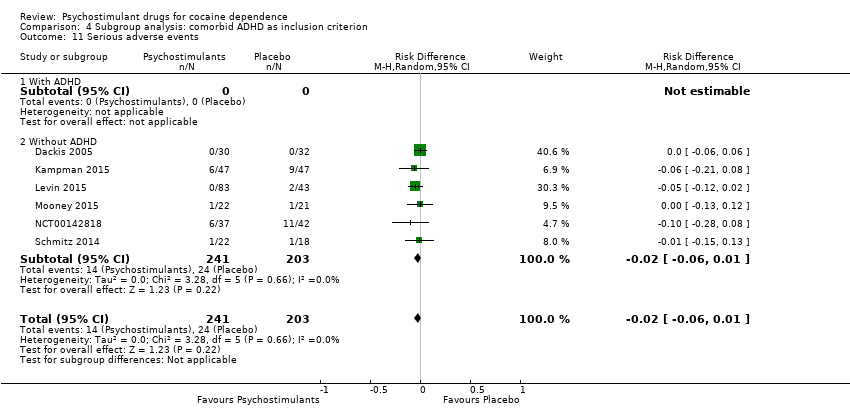
| 11 Serious adverse events Show forest plot | 6 | 444 | Risk Difference (M‐H, Random, 95% CI) | ‐0.02 [‐0.06, 0.01] |
|
| 11.1 Mixed amfetamine salts | 1 | 126 | Risk Difference (M‐H, Random, 95% CI) | ‐0.05 [‐0.12, 0.02] |
| 11.2 Modafinil | 4 | 275 | Risk Difference (M‐H, Random, 95% CI) | ‐0.02 [‐0.08, 0.04] |
| 11.3 Lisdexamfetamine | 1 | 43 | Risk Difference (M‐H, Random, 95% CI) | ‐0.00 [‐0.13, 0.12] |