Pentoxifylline untuk hepatitis alkoholik
Abstract
Background
Alcoholic hepatitis is a life‐threatening disease, with an average mortality of approximately 40%. There is no widely accepted, effective treatment for alcoholic hepatitis. Pentoxifylline is used to treat alcoholic hepatitis, but there has been no systematic review to assess its effects.
Objectives
To assess the benefits and harms of pentoxifylline in alcoholic hepatitis.
Search methods
The Cochrane Hepato‐Biliary Group Controlled Trials Register, The Cochrane Central Register of Controlled Trials (CENTRAL) in The Cochrane Library, MEDLINE, EMBASE, Science Citation Index Expanded, LILACS, clinicaltrials.gov, and full text searches were conducted until August 2009. Manufacturers and authors were contacted.
Selection criteria
All randomised clinical trials of pentoxifylline in participants with alcoholic hepatitis compared to control were selected for inclusion.
Data collection and analysis
Two authors extracted data and evaluated the risk of bias. RevMan Analysis was used for statistical analysis of dichotomous data with risk ratio (RR) and of continuous data with mean difference (MD), both with 95% confidence intervals (CI). Trial sequential analysis (TSA) was also used for statistical analysis of dichotomous and continuous data in order to control for random error. Where data were only available from one trial, we used Fisher's exact test or Student's t‐test.
Main results
Five trials, with a total of 336 randomised participants, were included. A total of 105 participants (31%) died. Of the five included trials, four (80%) had a high risk of bias. Meta‐analysis using all five trials showed that pentoxifylline reduced mortality compared with control (RR 0.64; 95% CI 0.46 to 0.89). However, this result was not supported by trial sequential analysis, which adjusts for multiple testing on accumulating data. Furthermore, four of the five trials were judged to have a high risk of bias, thus risking an overestimated intervention effect. Meta‐analysis showed that pentoxifylline reduced the hepatic‐related mortality due to hepatorenal syndrome (RR 0.40; 95% CI 0.22 to 0.71), but trial sequential analysis did not support this result. Data from one trial suggests that pentoxifylline may increase the occurrence of serious and non‐serious adverse events compared to control.
Authors' conclusions
The current available data may indicate a possible positive intervention effect of pentoxifylline on all‐cause mortality and mortality due to hepatorenal syndrome, and conversely, an increase in serious and non‐serious adverse events. However, the evidence is not firm; no conclusions can be drawn regarding whether pentoxifylline has a positive, negative, or neutral effect on participants with alcoholic hepatitis.
Ringkasan bahasa mudah
Tiada bukti yang cukup untuk menyimpulkan kesan pentoxifylline dalam kalangan pesakit dengan hepatitis alkoholik
Hepatitis adalah kecederaan radang pada hati. Alkohol adalah toksik kepada hati, dan alkohol yang terlampau banyak boleh menyebabkan hepatitis alkoholik. Bentuk hepatitis alkoholik yang teruk mengancam nyawa. Penggunaan pentoxifylline sebagai rawatan untuk hepatitis alkoholik tidak dapat disokong atau ditolak berdasarkan bukti terbaik sedia ada hari ini. Kami mendapati lima kajian rawak, yang bersama‐sama memasukkan 336 peserta; separuh menerima pentoxifylline, dan separuh lagi menerima plasebo atau tanpa intervensi. Kami melakukan ulasan sistematik dan analisis statistik tetapi tidak dapat menunjukkan bukti yang kukuh tentang kesan manfaat pentoxifylline terhadap kematian atau komplikasi penyakit hati dalam kalangan pesakit dengan hepatitis alkoholik. Pentoxifylline dilihat menyebabkan kesan sampingan lebih serius dan tidak serius. Untuk membantu memutuskan sama ada pentoxifylline harus diguna untuk merawat hepatitis alkoholik atau tidak, kami memerlukan kajian klinikal rawak yang direka bentuk dengan baik, dijalankan dengan baik, dan besar, dengan data jangka pendek (kurang dari satu bulan) dan jangka panjang (lebih dari satu bulan) tentang manfaat dan mudarat.
Authors' conclusions
Background
Excessive and chronic ingestion of alcohol can lead to alcoholic hepatitis. Hepatitis is injury to the liver and can be caused by the toxins in alcohol. Severe alcoholic hepatitis has a wide range of clinical symptoms including fever, liver enlargement, gastrointestinal bleeding, and jaundice (Madhotra 2003; Ceccanti 2006). It is frequently quoted that mortality in patients with severe alcoholic hepatitis is up to 60% (Hardison 1966). However, reliable and up‐to‐date information regarding alcoholic hepatitis‐associated mortality is not readily available. Data from a Cochrane review on randomised clinical trials with glucocorticosteroids for alcoholic hepatitis in the last 35 years show that mortality in the non‐intervention or placebo group of participants was approximately 40% (Rambaldi 2009).
Therapeutic agents used for alcoholic hepatitis include glucocorticosteroids and, as a more experimental treatment, tumour necrosis factor inhibitors (Madhotra 2003; Rongey 2006). Currently, glucocorticosteroids are the most common treatment for severe alcoholic hepatitis and are recommended by the American College of Gastroenterology (McCullough 1998). The effectiveness of glucocorticosteroids as a treatment for alcoholic hepatitis is, however, controversial because meta‐analyses of randomised clinical trials have yielded conflicting results (Imperiale 1990; Poynard 1991; Christensen 1995; Gluud 2001; Rambaldi 2009).
Pentoxifylline is a xanthine derivative; one of its effects is to act as a weak inhibitor of the cytokine, tumour necrosis factor. Tumour necrosis factor and other cytokines play an important role in the pathophysiology of alcoholic liver disease (McClain 1989; Levistsky 2004). Some randomised clinical trials have reported that pentoxifylline reduces renal impairment in participants with severe alcoholic hepatitis (McHutchison 1991; Akriviadis 2000; Sidhu 2006). Of these trials two reported improved short‐term survival in participants with severe alcoholic hepatitis (McHutchison 1991; Akriviadis 2000). In contrast, however, a randomised clinical trial of pentoxifylline for advanced liver cirrhosis reported on a subgroup analysis of participants with severe acute alcoholic hepatitis and showed that pentoxifylline had no significant effect on mortality (Lebrec 2007).
We could not identify systematic reviews or meta‐analyses on pentoxifylline for alcoholic hepatitis. We have, therefore, undertaken this Cochrane Hepato‐Biliary Group systematic review.
Objectives
To assess the benefits and harms of pentoxifylline versus placebo or no intervention in participants with alcoholic hepatitis.
Methods
Criteria for considering studies for this review
Types of studies
We considered for inclusion randomised clinical trials irrespective of blinding, language, publication year, or publication status. For assessment of harm we also considered quasi‐randomised studies and observational studies.
Types of participants
We included participants with alcoholic hepatitis, ie, patients with alcoholic hepatitis who satisfied the inclusion criteria of each trial.
Types of interventions
We included trials, which administered pentoxifylline at any dose or duration versus placebo or no intervention. We included one trial, which used standard therapy as a co‐intervention in both groups (Lebrec 2007).
Types of outcome measures
Primary outcome measures
-
All‐cause mortality and hepatic‐related mortality.
Secondary outcome measures
-
Hepatic‐related morbidity (eg, ascites, variceal bleeding, hepatic encephalopathy, hepatorenal syndrome etc).
-
Liver and kidney biochemistry and function (eg, serum (s)‐bilirubin, prothrombin time (PT), s‐albumin, s‐aspartate aminotransferase (AST), s‐alanine aminotransferase (ALT), s‐alkaline phosphatases (AP), s‐gamma‐glutamyl transferase (GGT).
-
Liver histology.
-
Adverse events (as defined by the trialists or by the International Conference on Harmonisation guideline for Good Clinical Practice (ICH‐GCP 1996)).
-
Quality of life.
-
Post‐hoc outcome measures, TNF levels (this was not a pre‐planned analysis).
Search methods for identification of studies
We searched The Cochrane Hepato‐Biliary Group Controlled Trials Register (Gluud 2009), the Cochrane Central Register of Controlled Trials (CENTRAL) in The Cochrane Library, MEDLINE, EMBASE, Science Citation Index Expanded, LILACS, and Clinical Trials.gov (Royle 2003). The search strategies and the time span of the searches are given in Appendix 1. We used the reference lists of the identified studies to identify further clinical trials.
We contacted the authors of the identified trials and the pharmaceutical companies involved in the production of pentoxifylline products to request details regarding additional clinical trials.
Data collection and analysis
We conducted the review according to the Cochrane Handbook for Systematic Reviews of Interventions (Higgins 2008) and the Cochrane Hepato‐Biliary Group Module (Gluud 2009).
Trial identification
Two authors (KW and AR) independently identified trials for inclusion. In the first round of selection, titles and abstracts were assessed and irrelevant articles were excluded. In the second round of selection, full‐text articles were assessed and those which satisfied the inclusion criteria were selected. We have listed the excluded trials with the reasons for their exclusion (Characteristics of excluded studies).
Data extraction
We independently extracted data from the trials (KW and AR), and differences in opinion were resolved by discussion with CG. The following data were extracted:
Publication
-
Year of publication.
-
Year of trial.
-
First author.
-
Language.
-
Country.
-
Number of participants.
Trial design
-
Inclusion/exclusion criteria.
-
Dose of pentoxifylline (route of administration, frequency, duration).
-
Placebo or no intervention.
-
Co‐interventions.
-
Outcome measures (as described above).
-
Period of follow‐up.
-
Methodological quality (as described below).
-
Sample size calculation.
-
Intention‐to‐treat analysis.
Participant characteristics, diagnosis, and interventions
-
Characteristics of trial participants and of those excluded from the trial (mean or median age, sex ratio, duration of alcoholic hepatitis, severity of alcoholic hepatitis (alcoholic hepatitis was considered severe if the patient has a Maddrey's score of at least 32 and/or presence of spontaneous hepatic encephalopathy (Maddrey 1978), alcohol consumption, other baseline characteristics as described by the trialists).
-
Development of clinical features and complications.
-
Liver and kidney biochemistry and function (as described above).
-
Liver histology.
-
Adverse events (as described above).
-
Quality of life.
We contacted the trial authors in order to clarify or obtain any information that was lacking or not clearly described in the published trial. We considered potential confounding variables by examining the participants' baseline characteristics.
Assessment of risk of bias
Due to the risk of overestimation of the intervention effects in randomised trials with a high risk of bias (Schulz 1995; Moher 1998; Kjaergard 2001; Wood 2008), we independently assessed the risk of bias of the trials, without masking the trial names (KW and AR). We followed the instructions detailed in the Cochrane Handbook for Systematic Reviews and Interventions (Higgins 2008) and The Cochrane Hepato‐Biliary Group Module (Gluud 2009).
We assessed the risk of bias of the randomised clinical trials using five components: sequence generation; allocation concealment; blinding; handling of incomplete outcome data, ie, follow‐up; and selective outcome reporting. We also extracted data relating to any other bias, eg, early stopping, baseline imbalance, source of funding. The risk of bias components were assessed according to the definitions below.
If relevant information was not available in the published trial, we contacted the authors in order to assess the trials correctly.
Sequence generation
-
Adequate, sequence generation was achieved using computer random number generation or a random number table. Drawing lots, tossing a coin, shuffling cards and throwing dice are adequate if performed by an independent adjudicator.
-
Unclear, the trial is described as randomised but the method of sequence generation was not specified.
-
Inadequate, the sequence generation method is not, or may not be, random. Quasi‐randomised studies, those using dates, names, or admittance numbers in order to allocate patients are inadequate and was excluded for the assessment of benefits but not for harms.
Allocation concealment
-
Adequate, allocation was controlled by a central and independent randomisation unit, opaque and sealed envelopes or similar, so that intervention allocations could not have been foreseen in advance of, or during, enrolment.
-
Unclear, the trial was described as randomised but the method used to conceal the allocation was not described, so that intervention allocations may have been foreseen in advance of, or during, enrolment.
-
Inadequate, if the allocation sequence was known to the investigators who assigned participants or if the study was quasi‐randomised. Quasi‐randomised studies was excluded for the assessment of benefits but not for harms.
Blinding
-
Adequate, the trial was described as double blind and the method of blinding was described, so that knowledge of allocation was adequately prevented during the trial.
-
Unclear, the trial was described as double blind, but the method of blinding was not described, so that knowledge of allocation was possible during the trail.
-
Not performed, the trial was not double blind, so that the allocation was known during the trial.
Incomplete outcome data
-
Adequate, the numbers and reasons for dropouts and withdrawals in all intervention groups were described or if it was specified that there were no dropouts or withdrawals.
-
Unclear, the report gave the impression that there had been no dropouts or withdrawals, but this was not specifically stated.
-
Inadequate, the number or reasons for dropouts and withdrawals were not described.
Selective outcome reporting
-
Adequate, pre‐defined, or clinically relevant and reasonably expected outcomes are reported on.
-
Unclear, not all pre‐defined, or clinically relevant and reasonably expected outcomes are reported on or are not reported fully, it is unclear whether data on these outcomes were recorded or not.
-
Inadequate, one or more clinically relevant and reasonably expected outcomes were not reported on; data on these outcomes were likely to have been recorded.
Other biases
Early stopping
-
Adequate, if sample size calculation was reported and the trial was not stopped or the trial was not stopped early by formal stopping rule at a point where the likelihood of observing an extreme intervention effect due to chance was low.
-
Unclear, if sample size calculation was not reported and it is not clear whether the trial was stopped early or not.
-
Inadequate, if the trial was stopped early due to an informal stopping rule or the trial was stopped early by a formal stopping rule at a point where the likelihood of observing an extreme intervention effect due to chance was high.
Baseline imbalance
-
Adequate, if there was no baseline imbalance in important characteristics.
-
Unclear, if the baseline characteristics were not reported.
-
Inadequate, if there was a baseline imbalance due to chance or due to imbalanced exclusion after randomisation.
Source of funding
-
No risk of for‐profit bias, if the trial's source of funding did not come from parties that might have a conflicting interest (eg, a pentoxifylline manufacturer).
-
Unclear, if the source of funding was not clear.
-
Risk of for‐profit bias, if the trial was funded by a drug manufacturer.
Trials with adequate sequence generation, adequate allocation concealment, adequate blinding, adequate handling of incomplete outcome data, and adequate selective outcome reporting were considered low‐bias risk trials. Trials with one or more unclear or inadequate quality component were considered high‐bias risk trials (Gluud 2009).
Intention‐to‐treat analysis
We analysed data according to the intention‐to‐treat principle, whereby all of the participants entered (or randomised) in each trial were included in the analysis. Participants who were lost to follow‐up were, initially, considered survivors. Furthermore, sensitivity analyses were subsequently performed whereby those participants lost to follow‐up were analysed according to different possible outcome scenarios. The sensitivity analyses are described below.
Statistical methods
We used the statistical software RevMan 5 provided by The Cochrane Collaboration (RevMan 2008). We calculated risk ratio (RR) with 95% confidence interval (CI) for dichotomous variables, and we used mean differences (MD) with 95% CI for continuous variables, using both the random‐effects model (DerSimonian 1986) and the fixed‐effect model (DeMets 1987) with the significant level less than or equal to P 0.05. When there were discrepancies in the statistical significance of the results between the two models, we reported the results of both models; otherwise we reported the results from only the fixed‐effect model. We explored the presence of statistical heterogeneity by the chi‐squared test with significance less than or equal to P 0.1 and measured the quantity of heterogeneity by I2 (Higgins 2002). Where data were only available from one trial, we used Fisher's exact test (Fisher 1922) for dichotomous data and Student's t‐test (Student 1908) for continuous data.
Trial sequential analysis
In order to control for risk of random error, we performed trial sequential analysis (TSA) for the dichotomous outcomes all‐cause mortality, hepatic‐related morbidity, hepatorenal syndrome as well as for the continuous outcomes tumour necrosis factor, serum bilirubin and serum creatinine (Brok 2008; Brok 2008a; Thorlund 2008; Wetterslev 2008).
Subgroup analyses
We performed subgroup analyses on trials with low risk of bias compared to trials with high risk of bias (as described above). Comparison of intervention effects was conducted with test of interaction (Altman 2003). We intended to perform subgroup analyses on participants with severe alcoholic hepatitis compared to participants with mild alcoholic hepatitis; however, this was not possible as all participants had the severe form of the disease.
Sensitivity analyses
We assessed the effect of missing outcome data on the primary outcome measure all‐cause mortality by applying a number of different scenarios to the intention‐to‐treat analyses. These scenarios are described in The Cochrane Hepato‐Biliary Group Module (Gluud 2009) and are defined as the following:
-
Poor outcome analysis: assumes that all of the participants with missing data (from either group) died.
-
Good outcome analysis: assumes that none of the participants with missing data (from either group) died.
-
Extreme‐case favouring pentoxifylline: assumes that none of the participants with missing data from the pentoxifylline group died, whereas all of those from the control group died.
-
Extreme‐case favouring control: assumes that all of the participants with missing data from the pentoxifylline group died, whereas none from the control group died.
Bias exploration
We intended to use funnel plot graphs in order to inform us of the likelihood of bias in the meta‐analysis. Asymmetry in a funnel plot can indicate, for example, high risk of a number of types of bias, including publication bias (Begg 1994; Egger 1997). However, asymmetry in a funnel plot alone is not a precise indicator for the presence of bias (Rücker 2008). A recently proposed arcsine test is a more precise indicator of the presence or absence of bias (Rücker 2008). If asymmetry in the funnel plot had occurred, then we planned to undertake the arcsine test to determine if bias is present or not. We did not perform a funnel plot or a subsequent arcsine test as we did not have the recommended minimal number of ten or more trials in any meta‐analyses.
Results
Description of studies
Our search strategy identified 149 publications, out of which 35 were duplicates. Of the remaining 114 publications, 100 were excluded in the first round of assessment, either because they were reviews or because they did not relate to alcoholic hepatitis. A further seven publications were excluded in the second round of assessment because they did not describe randomised clinical trials investigating the effect of pentoxifylline on participants with alcoholic hepatitis (Characteristics of excluded studies).
We identified a total of seven publications referring to five randomised clinical trials in our systematic review (Characteristics of included studies). One of the trials was published as an abstract and as a full text (Akriviadis 2000). The remaining four trials were all published as abstracts only (McHutchison 1991; Paladugu 2006; Sidhu 2006; Lebrec 2007). The primary authors were contacted for further information and data relating to the trials. Didier Lebrec responded and kindly provided data on the number of participants in each intervention group and on outcome measures (Lebrec 2007). No other responses have so far been received.
We contacted manufacturers of pentoxifylline and pentoxifylline products and asked for any information about unpublished or on‐going trials using pentoxifylline involving participants with alcoholic hepatitis. ALS Scandinavia AB and Mylan Inc. replied, and stated that they did not know of any further publications nor ongoing trials. Sanofi‐Aventis replied informing us of the Lebrec trial (Lebrec 2007), which we had already identified in our search strategy.
In addition, through a search for ongoing trials in clinicaltrials.gov registry we identified two ongoing trials. These trials have been classified as ongoing studies (NCT00205049; NCT00388323). The trial NCT00205049a has been completed, but there is no publication to date.
Included studies
We identified and included five randomised clinical trials, which assessed the effect of pentoxifylline in a total of 336 participants with alcoholic hepatitis. Four of the five included trails were reported as abstracts only. Four of the five included trials were judged to be at high risk of bias. The trials took place in the USA, France, and India. From the publications which reported sex and age of the participants, more than 90% were male, and the average age was 44 years old. In each trial, all participants had the severe form of alcoholic hepatitis and all trials reported on mortality.
Risk of bias in included studies
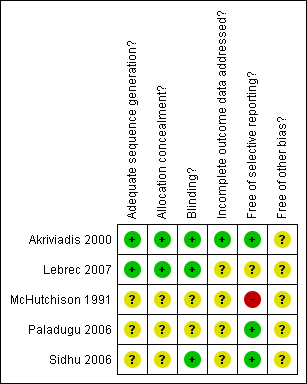
Risk of bias was assessed according to five components: sequence generation; allocation concealment; blinding; handling of incomplete outcome data; and selective outcome reporting. Of the five included trials, one was assessed as having a low risk of bias (Akriviadis 2000) and four were assessed as having a high risk of bias (McHutchison 1991; Paladugu 2006; Sidhu 2006; Lebrec 2007) (Figure 1). Statistical analyses which include all five trials are therefore based primarily on high risk of bias trials (Figure 2).

Risk of bias summary: review authors' judgements about each risk of bias item for each included study.

Risk of bias graph: review authors' judgements about each risk of bias item presented as percentages across all included studies.
Effects of interventions
All‐cause mortality
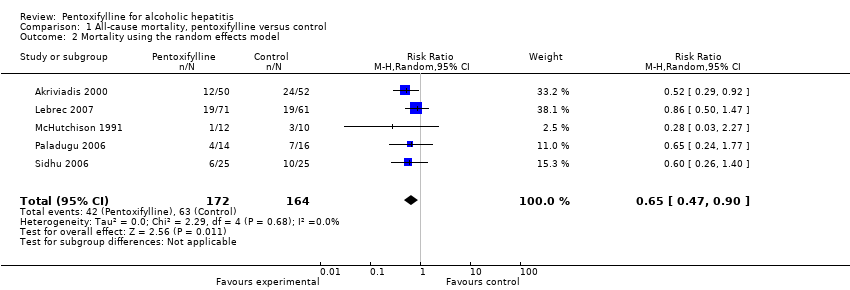
Meta‐analysis on data for all‐cause mortality shows that pentoxifylline significantly reduced mortality in participants with alcoholic hepatitis compared to control (RR 0.64; 95% CI 0.46 to 0.89, fixed‐effect model) (Analysis 1.1). The heterogeneity was measured as having I² equal to 0% (Analysis 1.1). The result from the fixed‐effect model concurred with that from the random‐effects model (Analysis 1.2).
In contrast, trial sequential analysis on data for all‐cause mortality does not support a 20% risk ratio reduction of all‐cause mortality in the pentoxifylline group compared to control (Figure 3). Trial sequential analysis is a statistical method, which controls for random error caused by formal or informal repetitive testing of accumulating data, so this can be considered a more robust result. The result of the trial sequential analysis is shown by the cumulated z‐curve (blue curve), which does not cross the trial sequential monitoring boundary (red curve), thus implying that there is no firm evidence for an intervention effect of 20% risk ratio reduction (RRR) (Figure 3).

Trial sequential analysis of the cumulative meta‐analysis of the effect of pentoxifylline on all‐cause mortality in participants with alcoholic hepatitis. The required information size of 1169 is calculated based on an a priori intervention effect of 20% (APHIS), a risk of type 1 error of 5%, and a power of 80%. The event rate in the control group is 39%, which is based on a meta‐analytic estimate of the control event rate of all the included trials. Although the cumulated z‐curve (blue curve) crosses the traditional boundary of 5% significance (horizontal red line), it does not cross the trial sequential monitoring boundary (red curve), implying that there is no firm evidence for an effect of 20% risk ratio reduction (RRR) when the cumulative meta‐analysis is adjusted for multiple testing on accumulating data.
Hepatic‐related mortality
Three trials reported data on hepatic‐related mortality (Akriviadis 2000; Paladugu 2006; Sidhu 2006). In all cases, hepatic‐related mortality was caused by hepatorenal syndrome. Hepatic‐related mortality occurred in 13/89 (15%) and 34/93 (37%) participants in the pentoxifylline and control groups, respectively (RR 0.40; 95% CI 0.22 to 0.71) (Analysis 2.1). Reduction in hepatic‐related mortality in the pentoxifylline group is statistically significant (Analysis 2.1). The statistical heterogeneity of this meta‐analysis has an I2 of 22%; there was no discrepancy between the fixed‐effect and random‐effects models, so we only report the fixed‐effect model.
In contrast, heterogeneity‐adjusted trial sequential analysis of these data does not support a 20% risk ratio reduction of hepatic‐related mortality in the pentoxifylline group compared to the control group (Figure 4). We consider that the result from the trial sequential analysis is more robust than that from a meta‐analysis because it controls for random error caused by formal or informal repetitive testing on accumulating data. The result is shown by the cumulated z‐curve (blue curve); the z‐curve does not cross the trial sequential monitoring boundary (red curve), thus implying that there is no firm evidence for an intervention effect of 20% risk ratio reduction (RRR) (Figure 4).

Trial sequential analysis of the cumulative meta‐analysis of the effect of pentoxifylline on hepatic‐related mortality in participants with alcoholic hepatitis. The required information size of 1636 is calculated based on an a priori intervention effect of 20% (APHIS), a risk of type 1 error of 5% and a power of 80%. The event rate in the control group is 38%, which is based on a meta‐analytic estimate of the control event rate of all the included trials. Although the cumulated z‐curve (blue curve) crosses the traditional boundary of 5% significance (horizontal red line), it does not cross the trial sequential monitoring boundary (red curve), implying that there is no firm evidence for an effect of 20% risk ratio reduction (RRR) when the cumulative meta‐analysis is adjusted for multiple testing on accumulating data.
Subgroup analysis of all‐cause mortality according to risk of bias
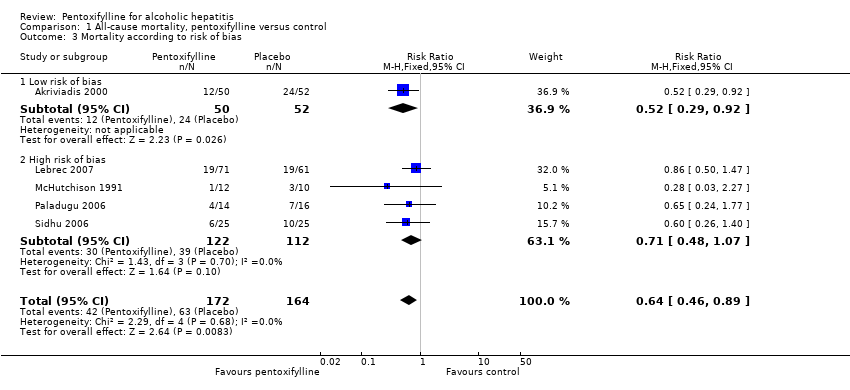
Subgroup analysis was performed in order to compare trials with low risk of bias to those with high risk of bias. One trial was assessed as having a low risk of bias (Akriviadis 2000) and four trials were assessed as having a high risk of bias (McHutchison 1991; Paladugu 2006; Sidhu 2006; Lebrec 2007) (Figure 1). The trial with low risk of bias reports that pentoxifylline decreased mortality; this result is statistically significant (RR 0.52; 95% CI 0.29 to 0.92) (Analysis 1.3). In a meta‐analysis using the four trials with high risk of bias, pentoxifylline decreased mortality but to a lesser extent (RR 0.71; 95% CI 0.48 to 1.07). This result was not statistically significant.
To assess whether the risk ratios from the meta‐analyses of the different subgroups were significantly different from each other, a test of interaction was performed (Altman 2003). The test of interaction gave a z statistic of 0.9 with corresponding P value 0.37, showing that the difference between the intervention effects is not statistically significant.
Subgroup analysis of all‐cause mortality according to severe or not severe alcoholic hepatitis
Alcoholic hepatitis was considered severe in all of the trials and in all of the included participants. As such, a subgroup analysis comparing all‐cause mortality according to severe and non‐severe forms of alcoholic hepatitis was not possible.
Sensitivity analysis according to different possible outcomes experienced by those trial participants with missing data
Only one trial reported the withdrawals and drop‐outs of participants (Akriviadis 2000). In total there were 16 randomised participants who did not contribute a complete set of outcome data. The reasons for withdrawal were reported and mortality data were collected for 15, with all having survived. Therefore, there was only one participant in all five of the included trials whose outcome data on all‐cause mortality is missing. In the sensitivity analysis this single participant was considered to have survived or to have died (Analysis 3.1). In both cases pentoxifylline reduced all‐cause mortality, and the results were statistically significant in both scenarios (presumed to have survived: RR 0.64; 95% CI 0.46 to 0.89 and presumed to have died: RR 0.66; 95% CI 0.48 to 0.91). This sensitivity analysis showed that the results of the meta‐analysis are not affected by the missing outcome data.
Secondary outcome measures
Hepatic‐related morbidity
Three trials reported on hepatic‐related morbidity (Akriviadis 2000; Paladugu 2006; Sidhu 2006). Variceal haemorrhage occurred in 4/64 (6%) and 2/68 (3%) participants in the pentoxifylline and control groups, respectively (RR 2.18; 95% CI 0.42 to 11.3) (Analysis 4.1). Hepatic encephalopathy occurred in 9/50 (18%) and 13/52 (25%) participants in the pentoxifylline and control groups, respectively. Statistical significance was determined using Fisher's exact test (P = 0.133) (Table 1). Neither result for variceal haemorrhage nor hepatic encephalopathy was statistically significant.
| Outcome measure | Type of data | Pentoxifylline group | Control group | Statistical test | P value |
| Hepatic encephalopathy | Dichotomous | 9/50 (18%) | 13/52 (25%) | Fisher’s exact test | 0.133 |
| Withdrawals due to adverse events | Dichotomous | 7/50 (14%) | 1/52 (2%) | Fisher’s exact test | 0.026 |
These three trials also reported on hepatorenal syndrome, all occurrences of which resulted in hepatic‐related mortality, and the results are described above.
Liver and kidney biochemistry and function
Only two trials reported data on liver and kidney biochemistry and function (McHutchison 1991; Akriviadis 2000). Some standard errors were reported as standard error of the mean; therefore, we converted them to standard deviation (Analysis 5.1; Analysis 5.2, Table 2). The results reported in Akriviadis 2000 are depicted graphically in the published article, and we extracted data from the graphs. The data are reported as means, with either standard error of the mean or standard deviations; however, this information has not been described in the figure legend. We have judged whether standard error of the mean or standard deviation is reported based on the magnitude of the error bars and on the standard deviations for laboratory values at randomisation given in a data table in the trial report (Akriviadis 2000).
| Outcome measure | Type of data | Pentoxifylline group | Control group | Statistical test | T value | P value |
| Blood urea nitrogen | Continuous | Mean 23 | Mean 38 | Student’s T test | 2.3426 | 0.021131 |
| Prothrombin time | Continuous | Mean 5 | Mean 5 | Student’s T test | 0 | 1 |
Analysis of the data from Akriviadis 2000 shows blood urea nitrogen (mg/dl) is lower in the pentoxifylline group than the control group; statistical significance was determined using the Student's t‐test; the result was statistically significant (P = 0.021) (Table 2).
Analysis of the data on prothrombin time (seconds) from Akriviadis 2000 shows that there is no difference in prothrombin time in the two groups (Table 2). Statistical significance was determined using the Student's t‐test; the result was not statistically significant (P = 1) (Table 2).
Meta‐analysis shows a decrease in serum creatinine (mg/dl) in the pentoxifylline group; this is statistically significant (MD ‐1.00; 95% CI ‐1.14 to ‐0.87) (Analysis 5.1). Trial sequential analysis of these data supports the finding in the meta‐analysis. The z‐curve (blue curve) crosses the trial sequential monitoring boundary implying that there is firm evidence for a decrease of 0.25 (mg/dl) serum creatinine in the pentoxifylline group (Figure 5).
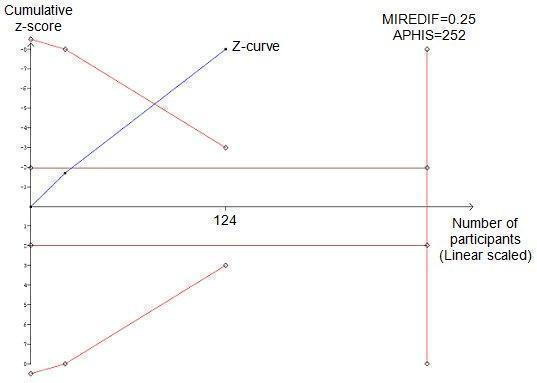
Trial sequential analysis of the cumulative meta‐analysis of the effect of pentoxifylline on serum creatinine in participants with alcoholic hepatitis. The required information size of 252 is calculated based on an intervention effect of 0.25 (mg/dl) (APHIS), a risk of type 1 error of 5% and a power of 80%. The cumulated z‐curve (blue curve) crosses the trial sequential monitoring boundary implying that there is firm evidence for a beneficial effect of 0.25 (mg/dl) decrease in serum creatinine when the cumulative meta‐analysis is adjusted for multiple testing on accumulating data.
Concentration of serum bilirubin (mg/dl) is reduced in the pentoxifylline group compared to the control group (MD ‐1.55; 95% CI ‐5.10 to 2.00); this result is not statistically significant (Analysis 5.2). Trial sequential analysis of the effect of pentoxifylline on serum bilirubin in participants with alcoholic hepatitis was not plausible. The trial sequential monitoring boundary was not calculated because the available information size is too small; less than 1% of the required information size (calculated based on an intervention effect suggested by the Akriviadis 2000 trial with low risk of bias) (Figure 6). To perform trial sequential analysis when there is such a deficit of information would be meaningless, and firm evidence would not be reached.

Trial sequential analysis of the cumulative meta‐analysis of the effect of pentoxifylline on serum bilirubin in participants with alcoholic hepatitis. The trial sequential monitoring boundary is not calculated because the actual information size is less than 1% of the information size required. This is calculated based on an intervention effect of 1.00 (mg/dl) suggested by the one trial with low risk of bias.
Liver histology and quality of life
No trials reported on liver histology nor on quality of life.
Adverse events
Typically, adverse events are less well reported than other outcome measures, so we also considered quasi‐randomised studies and observational studies in the assessment of adverse events. We identified one case‐controlled study (Louvet 2008); however, it did not report on adverse events. Two of the included randomised clinical trials reported on the occurrence of adverse events. McHutchison 1991 reported that the pentoxifylline group experienced significantly less renal impairment and fever, but no data were given. Only one trial gave data on the occurrence of adverse events (Akriviadis 2000).
In Akriviadis 2000 there were a total of 33 occurrences of adverse events in the pentoxifylline group compared with 15 occurrences in the control group; the adverse events reported ranged in their seriousness (Table 3). However, these data are not reported per participant, so some participants may have experienced more than one adverse event. Therefore, these data are count data, not dichotomous data. As such, the planned meta‐analysis of total adverse events was not possible.
| Occurrence of adverse event as reported by Akriviadis et al | Pentoxifylline | Control |
| Transient diarrhoea | 4 | 2 |
| Epigastric discomfort or pain with or without vomiting | 13 | 5 |
| Severe gastrointestinal symptoms and headache | 3 | 0 |
| Diarrhoea | 1 | 0 |
| Epigastric pain | 1 | 0 |
| Severe headache | 1 | 0 |
| Generalised skin rash | 1 | 0 |
| Headache and gastrointestinal symptoms | 0 | 1 |
| Urinary tract infection | 1 | 0 |
| Spontaneous bacterial peritonitis | 3 | 4 |
| Cryptococcal septicaemia | 1 | 0 |
| Bronchopneumonia | 1 | 0 |
| Pneumonia | 0 | 1 |
| Staphylococcal bacteraemia | 0 | 1 |
| Necrotising pancreatitis | 0 | 1 |
| Intracranial bleeding | 1 | 0 |
| Vaginal bleeding | 1 | 0 |
| Posttraumatic epidural haematoma | 1 | 0 |
| Total | 33 | 15 |
Adverse events caused more participants from the pentoxifylline group (7/50, 14%) than from the control group (1/52, 2%) to withdraw from the trial (Table 4). As these data are dichotomous, we decided to perform a post‐hoc statistical analysis on the number of withdrawals due to adverse events (Table 1). Statistical significance was determined using Fisher's exact test; the result was statistically significant (P= 0.026).
| Reason for loss to follow‐up | Pentoxifylline | Control | Data collected |
| Participant dropped out | 1 | 0 | None, participant excluded from analysis. |
| Incomplete regimen and/or incomplete follow‐up appointment | 4 | 3 | No data collected due to missed appointments, but mortality at 2 and 6 months follow‐up was assessed. |
| Treatment withdrawal due to adverse events | 7 | 1 | Adverse events and mortality at 2 and 6 months follow‐up were assessed. |
| Total | 12 | 4 |
Post‐hoc outcome measures, TNF levels
Meta‐analysis of the data from McHutchison 1991 and Akriviadis 2000 shows a statistically significant increase in plasma TNF (tumour necrosis factor) (pg/ml) in the pentoxifylline group (MD 4.04; 95% CI 1.59 to 6.48) (Analysis 6.1). Trial sequential analysis on these data does not support an increase of 4 pg/ml of TNF in the pentoxifylline group compared to control (Figure 7). Eventhough the z‐curve (blue curve) lies in the direction of an increase in TNF in the pentoxifylline group, it does not cross the trial sequential monitoring boundary, therefore firm evidence for a 4 pg/ml increase is not reached.

Trial sequential analysis of the cumulative meta‐analysis of the effect of pentoxifylline on levels of TNF in participants with alcoholic hepatitis. The required information size of 318 is calculated based on an intervention effect of 4.00 pg/ml, suggested by the one trial with low risk of bias (LBHIS) (Akriviadis 2000), a risk of type 1 error of 5% and a power of 80%. The cumulated z‐curve (blue curve) does not cross the trial sequential monitoring boundary implying that there is no firm evidence for a potentially harmful effect of 4.00 pg/ml when the cumulative meta‐analysis is adjusted for multiple testing on accumulating data.
Discussion
There is a lack of effective treatment for alcoholic hepatitis. This systematic review examined the evidence from randomised clinical trials for the use of pentoxifylline for alcoholic hepatitis.
All‐cause mortality
The data from all five included trials were analysed by meta‐analysis as well as by trial sequential analysis. The meta‐analysis showed that pentoxifylline reduced mortality in participants with alcoholic hepatitis; this result was statistically significant (Analysis 1.1). However, the results of the trial sequential analysis did not support the traditional meta‐analysis (Figure 3). Trial sequential analysis showed that the intervention effect (z‐curve, blue line) did not cross the trial sequential monitoring boundary (red curve) indicating lack of information to detect or reject a statistically significant intervention effect of 20% risk ratio reduction (RRR) (Figure 3). Trial sequential analysis is a statistical analysis that is adjusted for multiple testing on accumulating data and, therefore, is a more robust analysis than cumulative meta‐analysis. As such, we lack firm evidence on the intervention effect of pentoxifylline and cannot conclude that pentoxifylline has a positive intervention effect on mortality in participants with alcoholic hepatitis. The trial sequential analysis result also indicates that in order to detect or reject with firm evidence an intervention effect of 20% risk ratio reduction, an information size of 1169 may be needed (Figure 3).
Risk of bias is known to impact on the estimated intervention effect, with trials of a high risk of bias tending to overestimate the intervention effect (Schulz 1995; Moher 1998; Kjaergard 2001; Wood 2008). To assess the effect of risk of bias on the analysis of all‐cause mortality, the included trials were categorised as having either a high or a low risk of bias. Four of the five included trials were judged to be of high risk of bias (Figure 1). Therefore, the estimated intervention effect calculated using data from all five trials is at high risk of bias and is not a robust result.
Separate meta‐analyses were conducted on the trial with a high risk of bias and on those with a low risk of bias. The meta‐analysis on the high risk of bias trials showed that pentoxifylline had a non‐statistically significant positive intervention effect on all‐cause mortality (Analysis 1.3). Interestingly, the meta‐analysis on the single trial with a low risk of bias (Akriviadis 2000) showed greatest intervention effect, a risk ratio of 0.52, and hence, the result is statistically significant (Analysis 1.3).
The trials with a high risk of bias also have very small information sizes, so their results could also be affected by random error. It is also worth noting that the control event rate in the Akriviadis 2000 trial is 48%, whereas the weighted average control event rate in all trials is 39%. A control event rate, which is close to 50%, makes it easier to detect an intervention effect. This may contribute to the explanation that the low risk of bias trial and not the high risk of bias trial estimates a greater intervention effect.
A test of interaction between high risk and low risk of bias trials did not show a significant effect between these two groups, suggesting that risk of bias did not impact on the estimated intervention effect for all‐cause mortality. However, this result is limited because of the small sample sizes in each group (Altman 2003).
Basing recommendations on data from only one trial is not advisable, so the analysis of one trial with 102 participants and a low risk of bias is not sufficient evidence on which to draw conclusions (Akriviadis 2000). This is in part because the information size is too small, which means that there is a risk of random error, ie, that the result is actually a false positive (type I error) or a false negative (type II error). As such we need at least one other trial with a low risk of bias demonstrating benefit, before any positive intervention effect can be determined.
Hepatic‐related mortality
Meta‐analysis showed that hepatic‐related mortality (caused by hepatorenal syndrome) was reduced in the pentoxifylline group compared to the control group, and this result was statistically significant (Analysis 2.1). The result can be expressed as a reduction in the risk of hepatic‐related mortality estimated to be 60%. Although the statistical heterogeneity of the analysis was high, I2 = 22%, there was no discrepancy in the results using either the fixed‐effect or random‐effects model (Analysis 2.2). A fourth included trial reported on hepatorenal syndrome, but did not give any data; therefore, this trial has not been included in the meta‐analysis (McHutchison 1991). The trial reports a statistically significant decrease in hepatorenal syndrome in the pentoxifylline group compared to control (McHutchison 1991), agreeing with the meta‐analysis here.
The biochemical parameters, which indicate kidney function (blood urea nitrogen and serum creatinine), are both reduced in the pentoxifylline group compared to the control group (Table 2 and Analysis 5.1) and both results are statistically significant. The trial sequential analysis of the data on serum creatinine shows firm evidence of a decrease in serum creatinine in the pentoxifylline group compared to control. Although the prognostic role of serum creatinine for hepatorenal syndrome is widely accepted, the data presented in our review are not sufficient firm evidence to support that pentoxifylline reduces hepatorenal syndrome. The data can, however, generate the hypothesis for a randomised clinical trial to investigate the effect of pentoxifylline on hepatorenal syndrome and examine the validity of serum creatinine as a surrogate marker for the potential effect of pentoxifylline on hepatorenal syndrome.
Trial sequential analysis was also performed on the data for hepatic‐related mortality (all occurrences caused by hepatorenal syndrome) (Figure 4). The trial sequential analysis showed that the z‐curve (blue curve) does not cross the trial sequential monitoring boundary (red curve), implying that there is no firm evidence for an effect of 20% risk ratio reduction (RRR). The results of the trial sequential analysis does not support that there is firm evidence for the intervention effect suggested by the meta‐analysis; however, it is a more robust result because it is adjusted for multiple testing on accumulating data, so reduces the risk of random error.
The trial sequential analysis was adjusted for heterogeneity, resulting in a larger required information size than currently accrued. The total number of participants contributing to these analyses is only 182, whereas the required information size is 1636 participants. This highlights the risk of random error in the results from the meta‐analysis, which only includes data from 182 participants. There is no firm evidence that pentoxifylline reduces hepatorenal syndrome in participants with alcoholic hepatitis (Figure 4).
Adverse events
Only one trial provided data on adverse events (Akriviadis 2000); there were a total of 33 occurrences of adverse events in the pentoxifylline group compared to 15 occurrences in the control group. The adverse events ranged in their seriousness (Table 3). No pre‐planned analysis could be performed on these data as they are count data. However, we did perform post‐hoc analysis on the number of participants who withdrew from the trial due to adverse events as these data are dichotomous (Table 1). The data show a statistically significant increase in the number of withdrawals due to adverse events in the pentoxifylline group than in the control group (Table 1). Post‐hoc analyses can be biased, as they may be driven by the statistical significance of the results. The reason for our post‐hoc analysis was that the data in the Akriviadis 2000 trial were dichotomous, related to adverse events, and lent themselves to our statistical analysis.
There were 13 reports of epigastric discomfort or pain with or without vomiting in the pentoxifylline group and five reports in the control group (Table 3). These data may suggest that pentoxifylline causes increased epigastric discomfort or pain without vomiting in participants with alcoholic hepatitis. This is in agreement with what is known regarding xanthine derivatives (of which pentoxifylline is one), ie, that they cause adverse effects such as epigastric pain and other gastric problems (Patient 2008).
The total number of occurrences of adverse events, the number of withdrawals due to adverse events, and the reports of epigastric pain, all indicate an increase of serious and non‐serious adverse events in the pentoxifylline group compared to the control group. The main caveat to be entered with respect to these adverse event data is that only one trial reported on adverse events. Only a trend in increased adverse events in the pentoxifylline group can be noted. Data on adverse events from the other trials are necessary to evaluate any possible harmful effect of pentoxifylline in participants with alcoholic hepatitis.
Tumour necrosis factor
A caveat should be entered here, as these analyses were not predefined in the protocol, ie, it was a post‐hoc analysis. We feel that analysing TNF levels is a valid outcome measure as pentoxifylline is proposed to be an inhibitor of TNF ligand gene transcription (Strieter 1988), although this is currently under debate (Lucey 2009).
Meta‐analysis of the data from McHutchison 1991 and Akriviadis 2000 shows a statistically significant increase in plasma TNF (tumour necrosis factor) concentration in the pentoxifylline group (Analysis 6.1). Trial sequential analysis on these data also indicates that TNF concentration is higher in the pentoxifylline group compared to control, but the trial sequential monitoring boundary is not crossed, so the evidence is not firm (Figure 6). The direction of these results seems to be in contrast to the proposed TNF‐inhibitory properties of pentoxifylline. An increase of 4 pg/ml of TNF indicates the activation of a stress response, but this may not be clinically significant and cannot be used as a clear surrogate outcome for either benefit nor harm. Furthermore, two caveats should be entered here, firstly, the data from the Akriviadis 2000 trial are not clearly reported. Neither the raw data, nor the unit of standard error were reported. Secondly, in the McHutchison 1991 trial report, there was a baseline imbalance in TNF levels, with a higher baseline level in the pentoxifylline group. No other laboratory parameters had a baseline imbalance, suggesting that randomisation had been successfully performed and that TNF levels may have been unequal due to chance alone. The difference in the TNF levels before and after the pentoxifylline regimen showed a greater increase in TNF levels in the control group than the pentoxifylline group which suggests that pentoxifylline actually suppressed an increase in TNF levels. In light of such inaccuracies, we do not make conclusions about the effect of pentoxifylline on TNF levels.
Limitations of this review
The limitations of this review include the high proportion of trials with a high risk of bias. Of the five included trials, four were assessed as having a high risk of bias (Figure 1). As such, the statistical analyses on these data are based primarily on high risk of bias trials (Figure 2). Assigning a risk of bias to a randomised clinical trial follows a judgement based on the information available from the publication. The four high risk of bias trials were published as abstracts only; therefore, the judgement is primarily on how well the trial was reported rather than a judgement of the design and conduct of the trial itself. A more detailed description of these trials (possibly a full text publication) may lead to future re‐classification of their risk of bias.
Another limitation of this review is that all five included trials had a small sample size, with an average of 67 participants with alcoholic hepatitis. Small trials have less power, meaning that there is less chance of detecting a small but true effect as statistically significant (Kjaergard 2001). Small trials are also prone to increased risk of random error, and meta‐analysis, which combines data from small trials may yield false results (Brok 2008). This is one reason that we also analysed the data using trial sequential analysis.
Trial sequential analysis
Random error is the probability of observing a result by chance. Type I error is the risk of observing false positive results and type II error is the risk of observing false negative results. Random error can lead to false conclusions about the intervention effect. Random error can occur in data from individual trials and in data from meta‐analysis. The risk of random error is higher when data come from small information sizes (or 'sample sizes' for individual trials), so information sizes need to be sufficiently large in order to reduce the risk of random error and increase the chance of observing a true intervention effect (Brok 2008; Wetterslev 2008).
The risk of random error in meta‐analysis is potentially further exacerbated when one performs, formally or informally, statistical analyses repeatedly as new trials provide additional data; this occurs whenever new trial data become available and when meta‐analyses are updated. The benefit of using trial sequential analysis is that it controls for such an exacerbation of random error, which a traditional cumulative meta‐analysis does not (Brok 2008a).
Elements of a trial sequential analysis include an information size, trial sequential monitoring boundaries (red curves), and a cumulative z‐curve (blue curve). The information size is the number of participants needed in the analysis to detect or reject a certain intervention effect and is calculated based on an a priori, realistic intervention effect (here 20% risk ratio reduction) and a risk of type I error of 5% and a power of 80%. The trial sequential monitoring boundaries are based on the required information size and on the a priori intervention effect (Thorlund 2008). The cumulative z‐curve (blue curve) represents the estimated intervention effect generated from the data from the trials. If the cumulative z‐curve (blue curve) crosses the trial sequential monitoring boundary (red curve), then a sufficient level of evidence is reached and no further trials are needed. However, if the z‐curve does not cross the boundary, then there is insufficient evidence to reach a conclusion, which is what we see in this review for the outcome measures all‐cause mortality and hepatorenal syndrome (Brok 2008a). Additionally, trial sequential analysis provides us with important information regarding the need for additional trials and the required information size.
In this Cochrane review we used trial sequential analysis to analyse data on all‐cause mortality and on hepatorenal syndrome. We applied trial sequential monitoring boundaries according to an information size suggested by an a priori risk ratio reduction (RRR) of 20% (Thorlund 2008). The current information size is 336 participants from all five trials, with 102 participants coming from the single low risk of bias trial. At least 800 participants may be needed in order to detect or reject a risk ratio reduction (RRR) of 20% in the analyses. Therefore, our current analyses, being mere interim‐analyses in this perspective, cannot reach firm conclusions.
The main findings of this Cochrane systematic review are that there is a trend in reduction of all‐cause mortality, reduction of hepatorenal syndrome, and an increase in adverse events in participants who received pentoxifylline; but firm evidence for this is still absent. Data from low risk of bias trials, providing a large information size, are needed in order to draw firm conclusions from the data. Such data can then be added to the trial sequential analyses. Trial sequential analysis controls for the worst case scenario of increased risk of random error whenever you add new trial data to the existing data for an updated analysis.
One trial that was identified in our search of clinicaltrials.gov is classified in this review as an ongoing study (NCT00205049). The final collection of primary outcome measures was July 2008; our search strategy was performed in August 2009 and did not identify a corresponding publication. We await the publication of these results in order to update our analysis.
Risk of bias summary: review authors' judgements about each risk of bias item for each included study.

Risk of bias graph: review authors' judgements about each risk of bias item presented as percentages across all included studies.

Trial sequential analysis of the cumulative meta‐analysis of the effect of pentoxifylline on all‐cause mortality in participants with alcoholic hepatitis. The required information size of 1169 is calculated based on an a priori intervention effect of 20% (APHIS), a risk of type 1 error of 5%, and a power of 80%. The event rate in the control group is 39%, which is based on a meta‐analytic estimate of the control event rate of all the included trials. Although the cumulated z‐curve (blue curve) crosses the traditional boundary of 5% significance (horizontal red line), it does not cross the trial sequential monitoring boundary (red curve), implying that there is no firm evidence for an effect of 20% risk ratio reduction (RRR) when the cumulative meta‐analysis is adjusted for multiple testing on accumulating data.

Trial sequential analysis of the cumulative meta‐analysis of the effect of pentoxifylline on hepatic‐related mortality in participants with alcoholic hepatitis. The required information size of 1636 is calculated based on an a priori intervention effect of 20% (APHIS), a risk of type 1 error of 5% and a power of 80%. The event rate in the control group is 38%, which is based on a meta‐analytic estimate of the control event rate of all the included trials. Although the cumulated z‐curve (blue curve) crosses the traditional boundary of 5% significance (horizontal red line), it does not cross the trial sequential monitoring boundary (red curve), implying that there is no firm evidence for an effect of 20% risk ratio reduction (RRR) when the cumulative meta‐analysis is adjusted for multiple testing on accumulating data.

Trial sequential analysis of the cumulative meta‐analysis of the effect of pentoxifylline on serum creatinine in participants with alcoholic hepatitis. The required information size of 252 is calculated based on an intervention effect of 0.25 (mg/dl) (APHIS), a risk of type 1 error of 5% and a power of 80%. The cumulated z‐curve (blue curve) crosses the trial sequential monitoring boundary implying that there is firm evidence for a beneficial effect of 0.25 (mg/dl) decrease in serum creatinine when the cumulative meta‐analysis is adjusted for multiple testing on accumulating data.

Trial sequential analysis of the cumulative meta‐analysis of the effect of pentoxifylline on serum bilirubin in participants with alcoholic hepatitis. The trial sequential monitoring boundary is not calculated because the actual information size is less than 1% of the information size required. This is calculated based on an intervention effect of 1.00 (mg/dl) suggested by the one trial with low risk of bias.

Trial sequential analysis of the cumulative meta‐analysis of the effect of pentoxifylline on levels of TNF in participants with alcoholic hepatitis. The required information size of 318 is calculated based on an intervention effect of 4.00 pg/ml, suggested by the one trial with low risk of bias (LBHIS) (Akriviadis 2000), a risk of type 1 error of 5% and a power of 80%. The cumulated z‐curve (blue curve) does not cross the trial sequential monitoring boundary implying that there is no firm evidence for a potentially harmful effect of 4.00 pg/ml when the cumulative meta‐analysis is adjusted for multiple testing on accumulating data.

Comparison 1 All‐cause mortality, pentoxifylline versus control, Outcome 1 Mortality using the fixed effect model.
Comparison 1 All‐cause mortality, pentoxifylline versus control, Outcome 2 Mortality using the random effects model.
Comparison 1 All‐cause mortality, pentoxifylline versus control, Outcome 3 Mortality according to risk of bias.
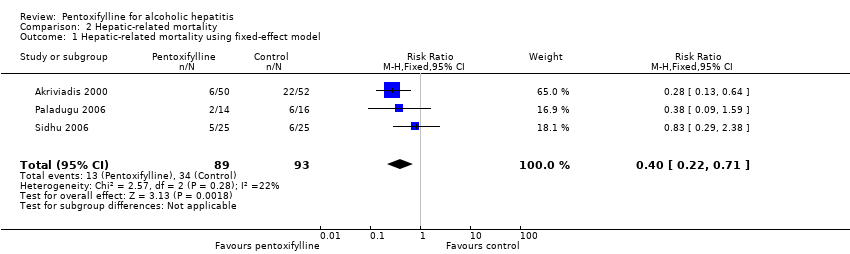
Comparison 2 Hepatic‐related mortality, Outcome 1 Hepatic‐related mortality using fixed‐effect model.

Comparison 2 Hepatic‐related mortality, Outcome 2 Hepatic‐related mortality using the random‐effects model.

Comparison 3 Sensitivity analysis, all‐cause mortality, Outcome 1 Mortality.

Comparison 4 Hepatic‐related morbidity, pentoxifylline versus control, Outcome 1 Variceal bleeding.

Comparison 5 Biochemical parameters, pentoxifylline versus control, Outcome 1 Serum creatinine.

Comparison 5 Biochemical parameters, pentoxifylline versus control, Outcome 2 Serum bilirubin.
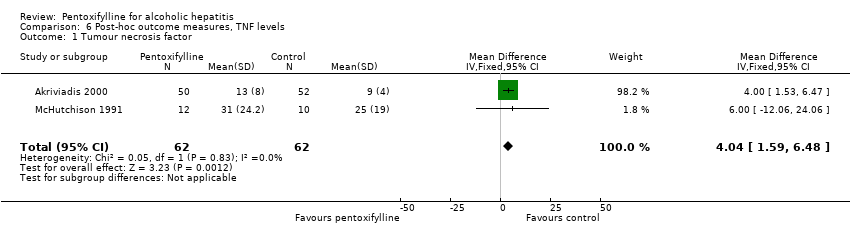
Comparison 6 Post‐hoc outcome measures, TNF levels, Outcome 1 Tumour necrosis factor.
| Outcome measure | Type of data | Pentoxifylline group | Control group | Statistical test | P value |
| Hepatic encephalopathy | Dichotomous | 9/50 (18%) | 13/52 (25%) | Fisher’s exact test | 0.133 |
| Withdrawals due to adverse events | Dichotomous | 7/50 (14%) | 1/52 (2%) | Fisher’s exact test | 0.026 |
| Outcome measure | Type of data | Pentoxifylline group | Control group | Statistical test | T value | P value |
| Blood urea nitrogen | Continuous | Mean 23 | Mean 38 | Student’s T test | 2.3426 | 0.021131 |
| Prothrombin time | Continuous | Mean 5 | Mean 5 | Student’s T test | 0 | 1 |
| Occurrence of adverse event as reported by Akriviadis et al | Pentoxifylline | Control |
| Transient diarrhoea | 4 | 2 |
| Epigastric discomfort or pain with or without vomiting | 13 | 5 |
| Severe gastrointestinal symptoms and headache | 3 | 0 |
| Diarrhoea | 1 | 0 |
| Epigastric pain | 1 | 0 |
| Severe headache | 1 | 0 |
| Generalised skin rash | 1 | 0 |
| Headache and gastrointestinal symptoms | 0 | 1 |
| Urinary tract infection | 1 | 0 |
| Spontaneous bacterial peritonitis | 3 | 4 |
| Cryptococcal septicaemia | 1 | 0 |
| Bronchopneumonia | 1 | 0 |
| Pneumonia | 0 | 1 |
| Staphylococcal bacteraemia | 0 | 1 |
| Necrotising pancreatitis | 0 | 1 |
| Intracranial bleeding | 1 | 0 |
| Vaginal bleeding | 1 | 0 |
| Posttraumatic epidural haematoma | 1 | 0 |
| Total | 33 | 15 |
| Reason for loss to follow‐up | Pentoxifylline | Control | Data collected |
| Participant dropped out | 1 | 0 | None, participant excluded from analysis. |
| Incomplete regimen and/or incomplete follow‐up appointment | 4 | 3 | No data collected due to missed appointments, but mortality at 2 and 6 months follow‐up was assessed. |
| Treatment withdrawal due to adverse events | 7 | 1 | Adverse events and mortality at 2 and 6 months follow‐up were assessed. |
| Total | 12 | 4 |
| Outcome or subgroup title | No. of studies | No. of participants | Statistical method | Effect size |
| 1 Mortality using the fixed effect model Show forest plot | 5 | 336 | Risk Ratio (M‐H, Fixed, 95% CI) | 0.64 [0.46, 0.89] |
| 2 Mortality using the random effects model Show forest plot | 5 | 336 | Risk Ratio (M‐H, Random, 95% CI) | 0.65 [0.47, 0.90] |
| 3 Mortality according to risk of bias Show forest plot | 5 | 336 | Risk Ratio (M‐H, Fixed, 95% CI) | 0.64 [0.46, 0.89] |
| 3.1 Low risk of bias | 1 | 102 | Risk Ratio (M‐H, Fixed, 95% CI) | 0.52 [0.29, 0.92] |
| 3.2 High risk of bias | 4 | 234 | Risk Ratio (M‐H, Fixed, 95% CI) | 0.71 [0.48, 1.07] |
| Outcome or subgroup title | No. of studies | No. of participants | Statistical method | Effect size |
| 1 Hepatic‐related mortality using fixed‐effect model Show forest plot | 3 | 182 | Risk Ratio (M‐H, Fixed, 95% CI) | 0.40 [0.22, 0.71] |
| 2 Hepatic‐related mortality using the random‐effects model Show forest plot | 3 | 182 | Risk Ratio (M‐H, Random, 95% CI) | 0.43 [0.22, 0.85] |
| Outcome or subgroup title | No. of studies | No. of participants | Statistical method | Effect size |
| 1 Mortality Show forest plot | 5 | 672 | Risk Ratio (M‐H, Fixed, 95% CI) | 0.65 [0.52, 0.82] |
| 1.1 Mortality, sensitivity analysis with all missing mortality data survived | 5 | 336 | Risk Ratio (M‐H, Fixed, 95% CI) | 0.64 [0.46, 0.89] |
| 1.2 Mortality, sensitivity analysis with all missing mortality data died | 5 | 336 | Risk Ratio (M‐H, Fixed, 95% CI) | 0.66 [0.48, 0.91] |
| Outcome or subgroup title | No. of studies | No. of participants | Statistical method | Effect size |
| 1 Variceal bleeding Show forest plot | 2 | 132 | Risk Ratio (M‐H, Fixed, 95% CI) | 2.18 [0.42, 11.32] |
| Outcome or subgroup title | No. of studies | No. of participants | Statistical method | Effect size |
| 1 Serum creatinine Show forest plot | 2 | 124 | Mean Difference (IV, Fixed, 95% CI) | ‐1.00 [‐1.14, ‐0.87] |
| 2 Serum bilirubin Show forest plot | 2 | 124 | Mean Difference (IV, Fixed, 95% CI) | ‐1.55 [‐5.10, 2.00] |
| Outcome or subgroup title | No. of studies | No. of participants | Statistical method | Effect size |
| 1 Tumour necrosis factor Show forest plot | 2 | 124 | Mean Difference (IV, Fixed, 95% CI) | 4.04 [1.59, 6.48] |