Cardiopulmonary interventions to decrease blood loss and blood transfusion requirements for liver resection
Abstract
Background
Blood loss during liver resection is one of the most important factors affecting the peri‐operative outcomes of patients undergoing liver resection.
Objectives
To determine the benefits and harms of cardiopulmonary interventions to decrease blood loss and to decrease allogeneic blood transfusion requirements in patients undergoing liver resections.
Search methods
We searched The Cochrane Hepato‐Biliary Group Controlled Trials Register, the Cochrane Central Register of Controlled Trials (CENTRAL) in The Cochrane Library, MEDLINE, EMBASE, and Science Citation Index Expanded until November 2008 for identifying the randomised trials.
Selection criteria
We included all randomised clinical trials comparing various cardiopulmonary interventions aimed at decreasing blood loss and allogeneic blood transfusion requirements in liver resection. Trials were included irrespective of whether they included major or minor liver resections, normal or cirrhotic livers, vascular occlusion was used or not, and irrespective of the reason for liver resection.
Data collection and analysis
Two authors independently identified trials for inclusion and independently extracted data. We analysed the data with both the fixed‐effect and the random‐effects models using RevMan Analysis. For each outcome we calculated the risk ratio (RR), mean difference (MD), or standardised mean difference (SMD) with 95% confidence intervals (CI) based on intention‐to‐treat analysis or available case‐analysis. For dichotomous outcomes with only one trial included under the outcome, we performed the Fisher's exact test.
Main results
Nine trials involving 587 patients satisfied the inclusion criteria. The interventions included low central venous pressure (CVP), autologous blood donation, haemodilution, haemodilution with controlled hypotension, and hypoventilation. Only one or two trials were included under most comparisons. All trials had a high risk of bias. There was no significant difference in the peri‐operative mortality or other peri‐operative morbidity. None of the trials reported long‐term survival or liver failure.The risk ratio of requiring allogeneic blood transfusion was significantly lower in the haemodilution and haemodilution with controlled hypotension groups than the respective control groups. Other interventions did not show significant decreases of allogeneic transfusion requirements.
Authors' conclusions
None of the interventions seem to decrease peri‐operative morbidity or offer any long‐term survival benefit. Haemodilution shows promise in the reduction of blood transfusion requirements in liver resection surgery. However, there is a high risk of type I (erroneously concluding that an intervention is beneficial when it is actually not beneficial) and type II errors (erroneously concluding that an intervention is not beneficial when it is actually beneficial) because of the few trials included, the small sample size in each trial, and the high risk of bias. Further randomised clinical trials with low risk of bias and random errors assessing clinically important outcomes such as peri‐operative mortality are necessary to assess any cardiopulmonary interventions aimed at decreasing blood loss and blood transfusion requirements in liver resections. Trials need to be designed to assess the effect of a combination of different interventions in liver resections.
Plain language summary
Haemodilution may show promise in decreasing blood loss and blood transfusion requirements
Blood loss during liver resection (partial removal of liver) is one of the important factors affecting the post‐operative complications of patients. Allogeneic blood transfusion (using blood donated by a different individual) is associated with increased morbidity and lower survival in patients with liver cancer. This systematic review was aimed at determining whether any cardiopulmonary (interventions that change the circulation or breathing during surgery) intervention decreased blood loss or decreased allogeneic blood transfusion requirements in patients undergoing liver resections. This review included nine trials with 587 patients. All trials had high risk of bias ('systematic error') as well of play of chance ('random error'). The interventions included low central venous pressure (CVP; pressure in the major neck veins), autologous blood donation (using the patient's own blood obtained prior to liver resection), haemodilution (replacing blood with other fluids), haemodilution with controlled hypotension (lowering the blood pressure in addition to diluting the blood), and hypoventilation (decrease the rate of artificial breathing), and were compared with controls not receiving the interventions. There was no difference in the death or complications due to surgery in any of the comparisons. Long‐term survival was not reported in any of the trials. Fewer patients required transfusion of blood donated by others when haemodilution or haemodilution with controlled hypotension were compared to controls. The other comparisons did not decrease the transfusion requirements. However, there is a high risk of type I errors (erroneously concluding that an intervention is beneficial when it is actually not beneficial) and type II errors (erroneously concluding that an intervention is not beneficial when it is actually beneficial) because of the few trials included and the small sample size in each trial as well as the inherent risk of bias (systematic errors). Haemodilution shows promise in the reduction of blood transfusion requirements in liver resections. Further randomised clinical trials with low risk of bias (systematic errors) and low risk of play of chance (random errors) which assess clinically important outcomes (such as death and complications due to operation) are necessary to assess any cardiopulmonary interventions aimed at decreasing blood loss in liver resections. Trials need to be designed to assess the effect of a combination of different interventions in liver resections.
Authors' conclusions
Background
Elective liver resection is performed mainly for benign and malignant liver tumours (Belghiti 1993). The malignant tumours may arise primarily within the liver (hepatocellular carcinoma and cholangiocarcinoma) or may be metastases from malignancies of other organs (Belghiti 1993; Chouker 2004). More than 1000 elective liver resections are performed annually in the United Kingdom alone (HES 2005).
The liver is subdivided into eight Couinaud segments (Strasberg 2000), which can be removed individually or by right hemi‐hepatectomy (Couinaud segments 5‐8), left hemi‐hepatectomy (segments 2‐4), right trisectionectomy (segments 4‐8), or left trisectionectomy (segments 2‐5 and 8 ±1) (Strasberg 2000). Although every liver resection is considered major surgery, only resection of three or more segments is considered a major liver resection (Belghiti 1993).
Blood loss during liver resection is one of the important factors affecting the peri‐operative outcomes of patients (Shimada 1998; Yoshimura 2004; Ibrahim 2006). Blood loss and peri‐operative blood transfusion requirements also affect the long‐term survival after liver resection for cancers (Poon 2001; Gomez 2008). Various methods have been attempted to reduce the blood loss during liver resection. These include lowering the central venous pressure (Wang 2006), hypoventilation (Hasegawa 2002), and topical haemostatic agents (Frilling 2005), occluding the blood flow to the liver (Gurusamy 2009a).
Allogeneic blood transfusion (transfusion of blood donated by a blood donor) is associated with increased morbidity (Shinozuka 2000) and lower survival in patients with primary liver cancer (Kitagawa 2001) than the autologous blood transfusion (patient's own blood is collected and re‐infused) because of the possible immunosuppressive effect of donor blood (Shinozuka 2000). Various methods of autologous blood transfusion that have been attempted in liver resection include pre‐operative autologous blood donation or peri‐operative autologous blood donation (PABD) (Shinozuka 2000; Kitagawa 2001), intra‐operative blood salvage (Hashimoto 2007), and normovolemic haemodilution (Matot 2002).
We have addressed the role of vascular occlusion in liver resections in a Cochrane review (Gurusamy 2009a), and the role of topical haemostatic agents is being addressed in another Cochrane review (Gurusamy 2009b). We have addressed the role of pharmacological interventions in another Cochrane review (Gurusamy 2009c). We did not find any systematic review or meta‐analysis addressing the role of cardiopulmonary interventions in decreasing blood loss or decreasing allogeneic blood transfusion requirements during liver resections.
Objectives
To determine the benefits and harms of cardiopulmonary interventions to decrease blood loss and to decrease allogeneic blood transfusion requirements in patients undergoing liver resections.
Methods
Criteria for considering studies for this review
Types of studies
We considered all randomised clinical trials irrespective of language, blinding, publication status, or sample size for inclusion.
Quasi‐randomised trials (where the method of allocating participants to a treatment are not strictly random, for example, date of birth, hospital record number, alternation) were not included regarding assessment of benefit, but were to be considered for inclusion regarding assessment of harms. This is because the trials with poor methodological quality overestimate the beneficial intervention effects (Schulz 1995; Moher 1998; Kjaergard 2001; Wood 2008).
Types of participants
Patients undergoing liver resection irrespective of aetiology, of major or minor liver resections, of normal or cirrhotic liver, of method of vascular occlusion, and use of topical haemostatic agents.
Types of interventions
We included any cardiopulmonary intervention aimed at reducing operative blood loss or peri‐operative allogeneic blood transfusion requirements during liver resection compared with no intervention, placebo, or compared with another intervention aimed at reducing blood loss during liver resection or at decreasing allogeneic blood transfusion requirements during liver resections. This included interventions such as lowering the central venous pressure (Wang 2006), hypoventilation (Hasegawa 2002).
Co‐interventions were allowed if carried out equally in the trial groups.
Types of outcome measures
Primary outcomes
-
Peri‐operative mortality.
-
Survival.
-
Proportion survived at 1, 3, and 5 years (in primary liver cancers and in secondary liver cancers).
-
Mean or median survival in months (in primary liver cancers and in secondary liver cancers).
-
Hazard ratio for survival.
-
-
Liver failure (however defined by authors).
-
Peri‐operative morbidity (other than mortality and liver failure such as sepsis, cardiovascular complications, respiratory complications, bile leak, wound complications).
-
Transfusion requirements.
-
Whole blood or red cell allogeneic transfusion (ie, transfusion of blood donated by others to the patient).
-
Number of patients requiring whole blood or red cell allogenic transfusion.
-
Overall mean number of units or volume of allogenic whole blood or red cell transfused.
-
-
Fresh frozen plasma.
-
Platelets.
-
Secondary outcomes
-
Operating time.
-
Hospital stay.
-
Intensive therapy unit (ITU) stay.
-
Blood loss (transection blood loss, operative blood loss) and within 24 hours.
-
Markers of liver function (bilirubin, prothrombin time).
-
Biochemical markers of liver injury (aspartate aminotransferase (AST), alanine aminotransferase (ALT)).
Search methods for identification of studies
We searched The Cochrane Hepato‐Biliary Group Controlled Trials Register (Gluud 2009), the Cochrane Central Register of Controlled Trials (CENTRAL) in The Cochrane Library, MEDLINE, EMBASE, and Science Citation Index Expanded (Royle 2003). We have given the search strategies in Appendix 1 with the time span of the searches until November 2008. We also searched the references of the identified trials to identify further relevant trials.
Data collection and analysis
Trial selection and extraction of data
Two authors (KG and BO or JL), independently of each other, identified the trials for inclusion. We have also listed the excluded studies with the reasons for the exclusion.
Two authors (KG and BO or JL) independently extracted the following data.
-
Year and language of publication.
-
Country in which the trial was conducted.
-
Year of conduct of trial.
-
Inclusion and exclusion criteria.
-
Number of major and minor liver resections.
-
Number of cirrhotic patients.
-
Method of vascular occlusion.
-
Use of topical haemostatic agents.
-
Outcomes (mentioned above).
-
Methodological quality (described below).
Any unclear or missing information was sought by contacting the authors of the individual trials. If there was any doubt whether the trial reports shared the same participants ‐ completely or partially (by identifying common authors and centres) ‐ the authors of the trials were contacted to clarify whether the trial report had been duplicated.
We resolved any differences in opinion through discussion or arbitration of the third author (BRD).
Assessment of risk of bias
Two authors (KG and BO or JL) assessed the risk of bias of the trials independently, without masking of the trial names. We followed the instructions given in the Cochrane Handbook for Systematic Reviews of Interventions (Higgins 2008) and the Cochrane Hepato‐Biliary Group Module (Gluud 2009). According to empirical evidence (Schulz 1995; Moher 1998; Kjaergard 2001; Wood 2008), the following risk of bias components were extracted from each trial.
Sequence generation
-
Low risk of bias (the methods used is either adequate (eg, computer generated random numbers, table of random numbers) or unlikely to introduce confounding).
-
Uncertain risk of bias ( there is insufficient information to assess whether the method used is likely to introduce confounding).
-
High risk of bias (the method used (eg, quasi‐randomised trials) is improper and likely to introduce confounding).
Allocation concealment
-
Low risk of bias (the method used (eg, central allocation) is unlikely to induce bias on the final observed effect).
-
Uncertain risk of bias (there is insufficient information to assess whether the method used is likely to induce bias on the estimate of effect).
-
High risk of bias (the method used (eg, open random allocation schedule) is likely to induce bias on the final observed effect).
Blinding of participants, personnel, and outcome assessors
It is difficult to blind the personnel to the groups for cardiopulmonary interventions. However, it is possible to blind the patients and outcome assessors. Thus only blinding of patients and outcomes assessors was considered for assessing the risk of bias in trials.
-
Low risk of bias (blinding was performed adequately, or the outcome measurement is not likely to be influenced by lack of blinding).
-
Uncertain risk of bias (there is insufficient information to assess whether the type of blinding used is likely to induce bias on the estimate of effect).
-
High risk of bias (no blinding or incomplete blinding, and the outcome or the outcome measurement is likely to be influenced by lack of blinding).
Incomplete outcome data
-
Low risk of bias (the underlying reasons for missingness are unlikely to make treatment effects departure from plausible values, or proper methods have been employed to handle missing data).
-
Uncertain risk of bias (there is insufficient information to assess whether the missing data mechanism in combination with the method used to handle missing data is likely to induce bias on the estimate of effect).
-
High risk of bias (the crude estimate of effects (eg, complete case estimate) will clearly be biased due to the underlying reasons for missingness, and the methods used to handle missing data are unsatisfactory).
Selective outcome reporting
-
Low risk of bias (the trial protocol is available and all of the trial's pre‐specified outcomes that are of interest in the review have been reported or similar or all of the primary outcomes in this review have been reported).
-
Uncertain risk of bias (there is insufficient information to assess whether the magnitude and direction of the observed effect is related to selective outcome reporting).
-
High risk of bias (not all of the primary outcomes in this review have been reported and not all of the trial's pre‐specified outcomes that are of interest in the review have been reported).
Other bias
Baseline imbalance
-
Low risk of bias (there was no baseline imbalance in important characteristics).
-
Uncertain risk of bias (the baseline characteristics were not reported).
-
High risk of bias (there was a baseline imbalance due to chance or due to imbalanced exclusion after randomisation).
Early stopping
-
Low risk of bias (sample size calculation was reported and the trial was not stopped or the trial was stopped early by a formal stopping rule at a point where the likelihood of observing an extreme intervention effect due to chance was low).
-
Uncertain risk of bias (sample size calculations were not reported and it is not clear whether the trial was stopped early or not).
-
High risk of bias (the trial was stopped early due to an informal stopping rule or the trial was stopped early by a formal stopping rule at a point where the likelihood of observing an extreme intervention effect due to chance was high).
Academic bias
-
Low risk of bias (the author of the trial has not conducted previous trials addressing the same interventions).
-
Uncertain risk of bias (It is not clear if the author has conducted previous trials addressing the same interventions).
-
High risk of bias (the author of the trial has conducted previous trials addressing the same interventions).
Source of funding bias
-
Low risk of bias (the trial's source(s) of funding did not come from any parties that might have conflicting interest (eg, drug manufacturer).
-
Uncertain risk of bias (the source of funding was not clear).
-
High risk of bias (the trial was funded by a drug manufacturer).
We considered trials classified as low risk of bias in sequence generation, allocation concealment, blinding, incomplete data, and selective outcome reporting as trials with low risk of bias.
Statistical methods
We performed the meta‐analyses according to the Cochrane Handbook for Systematic Reviews of Interventions (Higgins 2008) and the Cochrane Hepato‐Biliary Group Module (Gluud 2009). We used the software package RevMan 5 (RevMan 2008). For dichotomous variables, we calculated the risk ratio (RR) with 95% confidence interval (CI) if there were two or more trials for an outcome. If there was only trial included under the comparison, we performed Fisher's exact test using StatsDirect 2.7; and we have reported the proportion of patients with the outcome in each group and the P value for the comparison between the groups. For continuous variables, we calculated the mean difference (MD) or standardised mean difference (SMD) (for outcomes such as transfusion requirements where the requirements may be reported as units or as volume in millilitres) with 95% confidence interval. For both dichotomous and continuous outcomes including only one trial, a P value of less than 0.05 was considered statistically significant. We used a random‐effects model (DerSimonian 1986) and a fixed‐effect model (DeMets 1987) for meta‐analysis in the presence of two or more trials included under the outcomes. In case of discrepancy between the two models, we have reported both results; otherwise we have reported the results of the fixed‐effect model. Heterogeneity was explored by chi‐squared test with significance set at P value 0.10, and the quantity of heterogeneity was measured by I2 (Higgins 2002) set at 30% (Higgins 2008). We have highlighted the primary outcomes where the heterogeneity was more than 30%.
The analysis was performed on an intention‐to‐treat basis (Newell 1992) whenever possible using the good outcome and poor outcome scenarios. Otherwise, we adopted the 'available‐case analysis' (Higgins 2008). We did not impute any data for the post‐randomisation drop‐outs for any of the continuous outcomes. We had planned to perform a sensitivity analysis with and without empirical continuity correction factors (Sweeting 2004) using StatsDirect 2.7 in case there were 'zero‐event' trials in statistically significant outcomes. We also reported the results of risk difference if they were different from the results of risk ratio.
Imputation
We imputed the standard deviation from P values according to the instructions given in the Cochrane Handbook for Systematic Reviews of Intervention (Higgins 2008) and used the median for the meta‐analysis when mean was not available. If it was not possible to calculate the standard deviation from the P value or confidence intervals, we imputed the standard deviation as the highest standard deviation noted for that group under that outcome. If the mean and standard deviation for blood transfusion was given only for patients who required transfusion, we calculated the mean and standard deviation for the entire group by using the methods for combining groups suggested in the Cochrane Handbook for Systematic Reviews of Intervention (Higgins 2008). While this decision was made a priori, we have stated this to clarify this.
Subgroup analysis
We intended to perform the following subgroup analyses:
-
trials with low risk of bias (adequate generation of allocation sequence, allocation concealment, blinding, incomplete data outcomes, and selective reporting) compared to trials with high risk of bias (one or more of the five components inadequate or unclear).
-
major or minor liver resection.
-
cirrhotic or non‐cirrhotic liver.
-
different methods of autologous blood transfusion.
As all the trials were of high bias‐risk and few trials were included under each outcome, we were not able to perform any subgroup analysis.
Bias exploration
We planned to use a funnel plot to explore bias (Egger 1997; Macaskill 2001) and to use asymmetry in funnel plot of trial size against treatment effect to assess this bias. We also planned to perform linear regression approach described by Egger 1997 to determine the funnel plot asymmetry. However, we performed neither of these because of the few trials included under each outcome.
Results
Description of studies
We identified a total of 1116 references through electronic searches of The Cochrane Hepato‐Biliary Group Controlled Trials Register and The Cochrane Central Register of Controlled Trials in The Cochrane Library (n = 126), MEDLINE (n = 569), EMBASE (n = 207), and Science Citation Index Expanded (n = 214). We excluded 318 duplicates and 787 clearly irrelevant references through reading abstracts. Eleven references were retrieved for further assessment. No reference was identified through scanning reference lists of the identified randomised trials. We excluded one reference for the reason listed under the table 'Characteristics of excluded studies'. Nine randomised trials described in 10 publications fulfilled the inclusion criteria. All the nine trials were completed trials and could provide data for the review. Another trial had three arms and provided data for two comparisons (Yao 2006) (see section on haemodilution versus control). The reference flow is shown in Figure 1. Details about the patients, interventions, reasons for post‐randomisation drop‐outs, and the methodological quality of the trials are shown in the table 'Characteristics of included studies'.

Reference flow chart
Low central venous pressure (CVP) versus control
A total of 177 patients who underwent liver resection were randomised in three trials (El‐Kharboutly 2004; Wang 2006; Kato 2008) to low CVP (n = 88) versus control (n = 89). The number of participants in each trial was 40 (El‐Kharboutly 2004), 52 (Wang 2006), and 85 (Kato 2008). Two patients were excluded after randomisation in one trial (Wang 2006). The proportion of females and the mean age of participants in the trials that reported this were 30% (El‐Kharboutly 2004; Wang 2006) and 56.8 years (El‐Kharboutly 2004; Wang 2006; Kato 2008) respectively. The proportion of major liver resections in the two trials that stated this (El‐Kharboutly 2004; Wang 2006) was 37.8%. The proportion of cirrhotic livers in the two trials that stated this (El‐Kharboutly 2004; Wang 2006) was 60%.
Autologous blood donation versus control
A total of 80 adult living liver donors were randomised in one trial (Hashimoto 2007) to autologous blood donation (n = 40) versus control (n = 40). One patient from the control group who did not undergo surgery because of asthmatic attack was excluded post‐randomisation from analysis. Data were available for the remaining 79 patients. In the remaining patients, 38% were females. The median age in the two groups were 30 years and 37 years respectively. Seventy seven patients (97.5%) underwent major resection. All the patients had normal livers.
Haemodilution versus control
A total of 208 patients undergoing elective liver resection were randomised in two trials (Matot 2002; Jarnagin 2008) to haemodilution (n = 102) or control (n = 106). The number of participants in each trial was 78 (Matot 2002) and 130 (Jarnagin 2008). Five other patients were excluded post‐randomisation in one trial (Jarnagin 2008). The proportion of females was 51.9%. The mean age of the patients was 54.6 years. In one trial, all patients (n = 78) in both groups underwent major liver resection (Matot 2002). In the other trial 85.4% of the 130 patients underwent major liver resection. The two groups were evenly matched for the number of major liver resections. Neither trial stated the proportion of cirrhotic livers.
A total of 30 patients undergoing liver resection were randomised to haemodilution with controlled hypotension (n =10), haemodilution (n =10), and to control (n = 10) (Yao 2006). The proportion of females was 46.7%. The mean age, proportion of major liver resections, and the proportion of cirrhotic livers were not stated in this trial.
We included 20 patients (haemodilution group and control group) for this comparison and considered haemodilution with controlled hypotension group as a separate intervention. So, we performed another comparison of haemodilution with controlled hypotension versus control.
Haemodilution with controlled hypotension versus control
The details of this group are stated in the previous comparison.
Haemodilution with bovine haemoglobin (HBOC‐201) versus hydroxy ethyl starch (HES)
A total of 12 patients who underwent elective liver resections were randomised in one trial (Standl 1998) to HBOC‐201 (n = 6) versus control (n = 6). The proportion of females and the mean age of participants in the trials were 50% and 59 years respectively. The proportion of major liver resections was 41.7%. All the patients had normal livers.
Hypoventilation versus control
A total of 80 patients who underwent liver resections for removal of tumours were randomised in one trial (Hasegawa 2002) to hypoventilation (n = 40) versus control (n = 40). One patient from intervention group who did not undergo liver resection was excluded from analysis after randomisation. The sex ratio was not stated. In the patients who underwent liver resection, the mean age was 65 years. The proportion of major liver resections was 32.9%. The proportion of cirrhotic livers was 44.3%.
Risk of bias in included studies
The sequence generation was adequate in four (44.4%) trials (Matot 2002; Hashimoto 2007; Jarnagin 2008; Kato 2008). The allocation concealment was adequate in two trials (22.2%) (Hashimoto 2007; Kato 2008). None of the trials achieved patient and outcome assessor blinding. Three trials were free from incomplete data outcome bias (33.3%) (Hasegawa 2002; Hashimoto 2007; Kato 2008). None of the trials were free from selective outcome reporting. One trial was free from other bias (11.1%) (Hashimoto 2007).
All the trials were considered to be of high risk of bias.
The risk of bias is summarised in Figure 2 and Figure 3.

Methodological quality graph: review authors' judgements about each methodological quality item presented as percentages across all included studies.

Methodological quality summary: review authors' judgements about each methodological quality item for each included study.
Effects of interventions
The summary measures used were risk ratio (RR), mean difference (MD), or standardised mean difference (SMD). The 95% confidence intervals (95% CI) are also stated.
Primary outcomes
Peri‐operative mortality
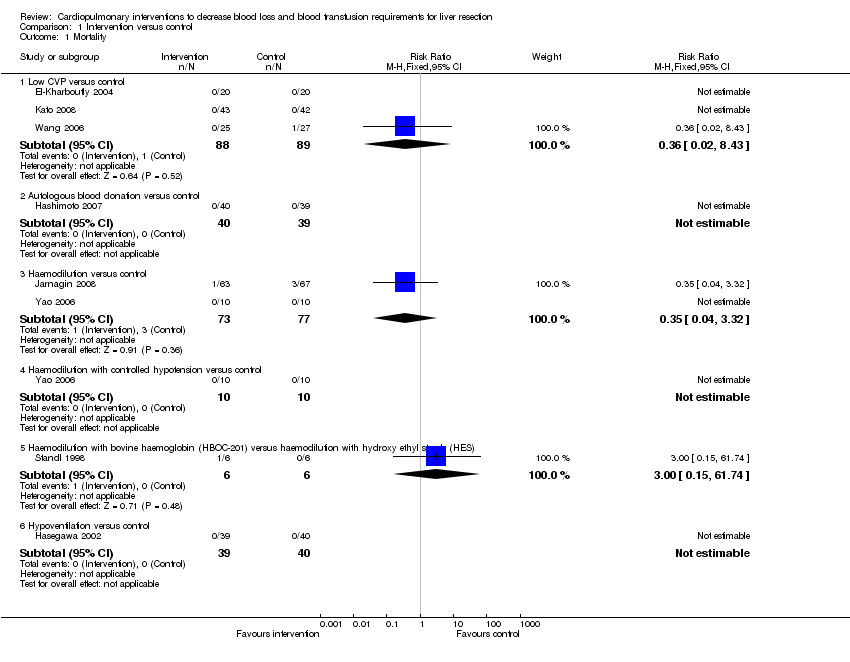
There was no significant difference in the peri‐operative mortality in any of the comparisons (Analysis 1.1).
Survival
None of the trials reported long‐term survival.
Liver failure
None of the trials reported liver failure.
Peri‐operative morbidity
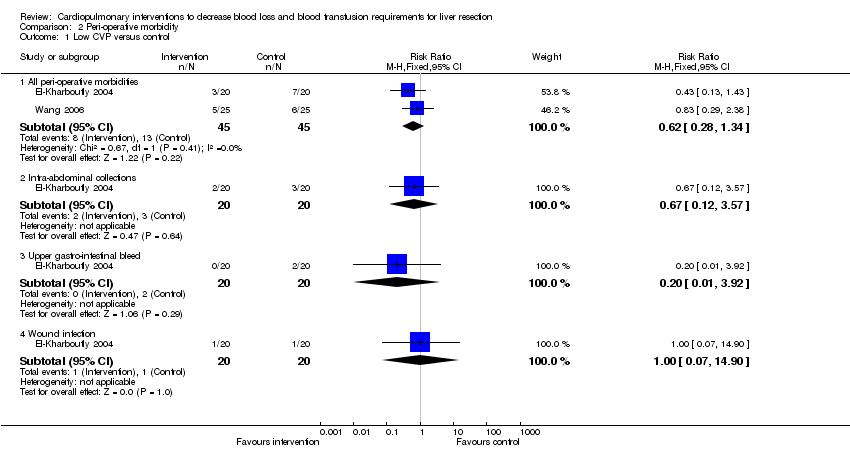
There was no significant difference in the peri‐operative morbidity in any of the comparisons. This was reported in seven trials (Standl 1998; Hasegawa 2002; Matot 2002; El‐Kharboutly 2004; Wang 2006; Hashimoto 2007; Jarnagin 2008) (Analysis 2.1 to Analysis 2.5).
Transfusion requirements
See (Analysis 1.3; Analysis 1.4; Analysis 1.5). Fresh frozen plasm requirements were reported only in the comparison of low CVP with control. None of the trials reported platelet transfusion in sufficient detail to be included in this review.
Low CVP versus control
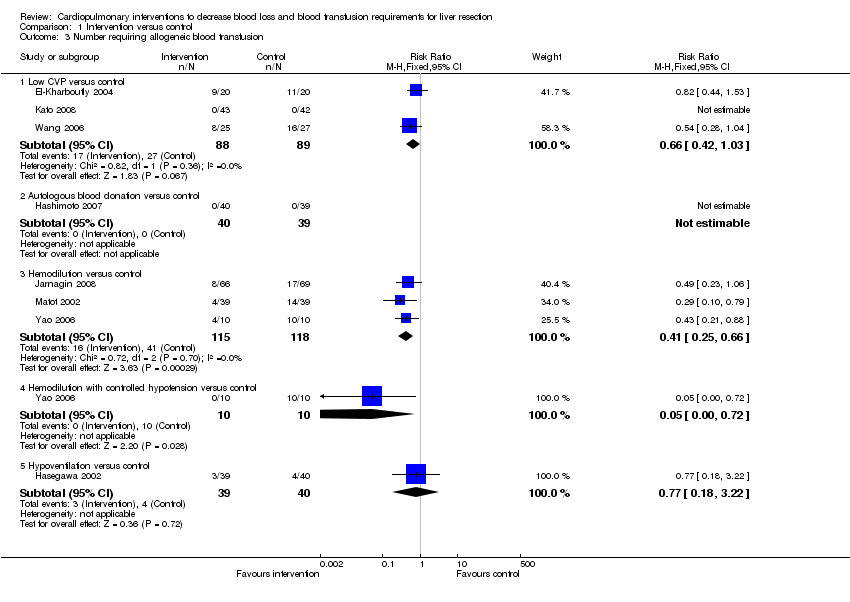
Three trials were included (El‐Kharboutly 2004; Wang 2006; Kato 2008). There was no significant difference in the proportion of patients requiring allogeneic blood transfusion between the groups (RR 0.72; 95% CI 0.45 to 1.14) (19.3% low CVP versus 28.1% control). In one of the trials, two patients were excluded from the control group because of per‐operative death and procedure being abandoned because of unclear tumour demarcation. There was no significant differences in the results by adopting a good outcome intention‐to‐treat analysis, poor outcome intention‐to‐treat analysis, best‐case scenario analysis, or worst‐case scenario analysis (Gluud 2009; Higgins 2008). There was no significant differences in the red cell transfusion between the groups in the two trials that reported this outcome (Wang 2006; Kato 2008) (SMD ‐0.31; 95% CI ‐0.65 to 0.03). The I2 measure of heterogeneity was 83%.The need for fresh frozen plasma (FFP containing clotting factors) was lower in the low CVP group than in the control group (SMD ‐1.22; 95% CI ‐1.83 to ‐0.62) in the only trial that reported this outcome (Wang 2006).
Autologous blood donation versus control
One trial was included (Hashimoto 2007). None of the patients required allogeneic blood transfusion in this trial.
Haemodilution versus control
Three trials were included (Matot 2002; Yao 2006; Jarnagin 2008). The number of patients requiring allogeneic blood transfusion was significantly lower in the haemodilution group than the control group (RR 0.41; 95% CI 0.25 to 0.66) (14.3% haemodilution versus 35.3% control). There was no significant change in the results by adopting the good outcome intention‐to‐treat analysis, poor outcome intention‐to‐treat analysis, best‐case scenario analysis, or worst‐case scenario analysis (Gluud 2009; Higgins 2008). There was no significant difference in the amount of allogenic red cell transfusion between the groups in the two trials that reported this outcome (SMD ‐0.25; 95% CI ‐0.58 to 0.08) (Yao 2006; Jarnagin 2008). The I2 measure of heterogeneity was 91%.
Haemodilution with controlled hypotension versus control
One trial was included (Yao 2006). The number of patients requiring allogeneic blood transfusion was lower in the intervention group than in the control group (0% haemodilution with controlled hypotension versus 100% control; Fisher's exact test: P < 0.0001). The mean allogenic red cell transfusion was also lower in the intervention group than in the control group (MD ‐665.00 ml; 95% CI ‐818.71 to ‐511.29).
Haemodilution with bovine haemoglobin (HBOC‐201) versus hydroxy ethyl starch (HES)
One trial was included under (Standl 1998). The number of patients requiring transfusion was not stated in the trial. There was no significant difference in the amount of allogenic red cell transfusion between the groups (MD 167.00 ml; 95% CI ‐606.55 to 940.55).
Hypoventilation versus control
One trial was included (Hasegawa 2002). There was no significant difference in the number of patients requiring allogeneic blood transfusion (7.7% hypoventilation versus 10% control; Fisher's exact test: P > 0.9999) or amount of blood transfused between the groups (MD ‐58.00 ml; 95% CI ‐155.73 to 39.73).
Secondary outcomes
Operating time
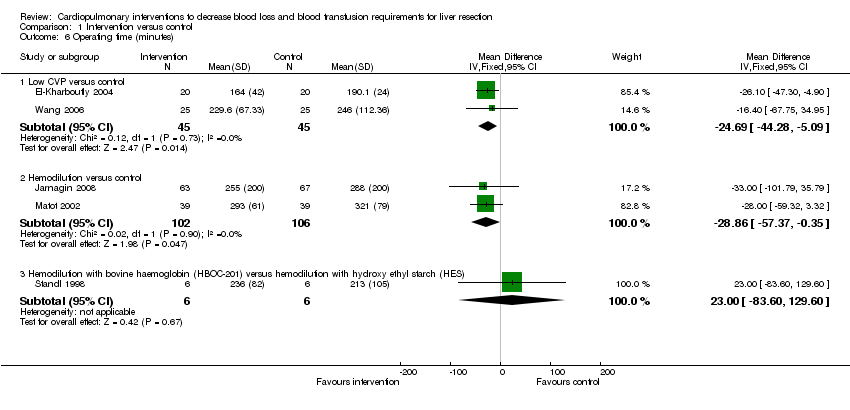
The operating time was significantly lower in the intervention group than control in the following comparisons: low CVP versus control (El‐Kharboutly 2004; Wang 2006) (MD ‐24.69 minutes; 95% CI ‐44.28 to ‐5.09) and haemodilution versus control (Matot 2002; Jarnagin 2008) (MD ‐28.86 minutes; 95% CI ‐57.37 to ‐0.35). There was no significant difference in the operating time between the intervention and control groups in the comparison of haemodilution with bovine haemoglobin (HBOC‐201) versus hydroxy ethyl starch (HES). The operating time was not reported in the following comparisons: autologous blood donation versus control and hypoventilation versus control (Analysis 1.6).
Hospital stay
The hospital stay was significantly lower in the intervention group than control in one comparison (low CVP versus control) (Wang 2006; Kato 2008) (MD ‐4.53 days; 95% CI ‐7.38 to ‐1.68). There was no significant difference in the hospital stay between the intervention and control groups in the following comparisons: haemodilution versus control and haemodilution with bovine haemoglobin (HBOC‐201) versus hydroxy ethyl starch (HES). The hospital stay was not reported in the remaining comparisons (Analysis 1.7).
Intensive therapy unit (ITU) stay
None of the trials reported ITU stay.
Blood loss
See (Analysis 1.8; Analysis 1.9).
Low CVP versus control
Three trials were included (El‐Kharboutly 2004; Wang 2006; Kato 2008). There was no significant difference in the transection blood loss between the two groups (MD ‐81.71 ml; 95% CI ‐219.79 to 56.37). The operative blood loss was statistically significantly lower in the low CVP group than in the control group (MD ‐419.35 ml; 95% CI ‐575.06 to ‐263.63). The transection blood loss was reported in two trials (Wang 2006; Kato 2008) and the operative blood loss was reported in all the three trials included under this category (El‐Kharboutly 2004; Wang 2006; Kato 2008).
Autologous blood donation versus control
One trial was included (Hashimoto 2007). The transection blood loss was lower in the haemodilution than control (MD ‐90.00 ml; 95% CI ‐171.60 to ‐8.40). However, there was no significant difference in the operative blood loss between the groups (MD ‐37.00 ml; 95% CI ‐100.51 to 26.51).
Haemodilution versus control
Three trials were included (Matot 2002; Yao 2006; Jarnagin 2008). None of the trials reported transection blood loss. There was no significant difference in the operative blood loss between the groups (MD 1.53 ml; 95% CI ‐102.37 to 105.44) in the two trials that reported this outcome (Matot 2002; Yao 2006).
Haemodilution with controlled hypotension versus control
One trial was included (Yao 2006). This trial did not report transection blood loss. The operative blood loss was significantly lower in the intervention group than in the control group (MD ‐247.00 ml; 95% CI ‐357.80 to ‐136.20).
Haemodilution with bovine haemoglobin (HBOC‐201) versus hydroxy ethyl starch (HES)
One trial was included (Standl 1998). This trial did not report transection blood loss. There was no significant difference in the operative blood loss between the groups (MD 370.00 ml; 95% CI ‐1103.59 to 1843.59).
Hypoventilation versus control
One trial was included (Hasegawa 2002). There was no significant difference in the transection blood loss between the groups (MD 95.00 ml; 95% CI ‐186.40 to 376.40). This trial did not report the operative blood loss.
Markers of liver function (bilirubin, prothrombin time)
These were reported in three trials (Standl 1998; El‐Kharboutly 2004; Wang 2006). There was no significant difference in the markers of liver function in any of the comparisons (Analysis 3.1; Analysis 4.1; Analysis 4.2).
Biochemical markers of liver injury (aspartate aminotransferase (AST), alanine aminotransferase (ALT))
These were reported in three trials (Hasegawa 2002; El‐Kharboutly 2004; Wang 2006).There was no significant difference in the markers of liver injury in any of the comparisons (Analysis 5.1; Analysis 5.2; Analysis 6.1).
Variations in statistical analysis
There were no changes in results by adopting the random‐effects model in any of the comparisons with more than one trial. There was no change in results by calculating the risk difference for any of the dichotomous outcomes.
Subgroup analysis
We did not perform any subgroup analysis because of the few trials included under each category in this review.
Exploration of bias
We did not perform the funnel plot or the linear regression approach described by Egger 1997 to determine the funnel plot asymmetry because of the few trials included under each outcome.
Discussion
In this review, the safety and efficacy of cardiopulmonary interventions in reducing blood loss and allogeneic blood transfusion requirements have been evaluated. There was no significant difference in the mortality or morbidity between the intervention groups and controls. However, none of the trials were powered to identify differences in mortality or morbidity. The choice of which morbidity to report and which morbidity not to report varies from one report to another. Thus, it is not possible to make conclusions on the safety of these interventions from these trials.
Low CVP reduces blood loss and fresh frozen plasma requirements but not red cell transfusion requirements. Although the CVP is reduced by venodilation, reduction of perfusion to important organs due to hypotension is avoided by using dopamine. There was no evidence for any complications resulting because of reduced CVP and prolonged hypotension, but as stated above, the trials were not designed to detect this. A reduced CVP may decrease the hepatic venous pressure resulting in a decrease in the blood loss. However, this has not translated into a reduction in the red cell transfusion requirement.
Autologous blood donation does not decrease operative blood loss. The main advantage of autologous blood donation is avoiding allogeneic blood transfusion. The only trial, which assessed autologous blood transfusion (Hashimoto 2007) reported that none of the patients in either group required allogeneic blood transfusion. Thus the benefit of autologous blood transfusion in decreasing allogeneic blood transfusion is not clear.
Haemodilution does not significantly decrease the operative blood loss. However, it has the potential to decrease the allogeneic blood transfusion as blood withdrawn as a part of haemodilution (ie, autologous blood donation used in conjunction with haemodilution) can be used first if necessary. Another reason is the loss of diluted blood rather than blood with high haematocrit resulting in loss of fewer red blood cells although the volume lost is the same. The benefit appears to be better if haemodilution is combined with controlled hypotension.
Hypoventilation was assessed as a method of decreasing blood loss because of its role in decreasing the CVP. In the only trial that assessed this intervention, hypoventilation was carried out only during the clamping phase of the intermittent portal triad clamping (PTC). While the mean CVP was lower during the clamping phase, the mean CVP during the entire operative procedure was the same between the hypoventilation group and the control group. The hepatic venous pressure increases to normal levels during the unclamping phase (Hasegawa 2002). This might be the reason for the apparent lack of benefit in hypoventilation.
The decreased operating time in some of the interventions, ie, low CVP versus control (El‐Kharboutly 2004; Wang 2006) and haemodilution versus control (Matot 2002; Jarnagin 2008) may be due to the quicker haemostasis achieved as the groups were matched for major and minor liver resections in the majority of cases. This may benefit the patient and also decrease the costs.
Most of the trials employed intermittent vascular occlusion. It is not clear whether the beneficial effects of the interventions will be increased or decreased in situations where vascular occlusion is not employed. Furthermore, the effect of a combination of interventions has to be assessed using adequately powered factorial trials.
However, there is a high risk of type I (erroneously concluding that an intervention is beneficial when it is actually not beneficial) and type II errors (erroneously concluding that an intervention is not beneficial when it is actually beneficial) because of the few trials included and the small sample size in each trial. Furthermore, the risks of type I errors are increased due to the many risks of bias (Wood 2008).
Methodological quality graph: review authors' judgements about each methodological quality item presented as percentages across all included studies.
Methodological quality summary: review authors' judgements about each methodological quality item for each included study.
Comparison 1 Intervention versus control, Outcome 1 Mortality.
Comparison 1 Intervention versus control, Outcome 3 Number requiring allogeneic blood transfusion.

Comparison 1 Intervention versus control, Outcome 4 Red cell transfusion.

Comparison 1 Intervention versus control, Outcome 5 Fresh frozen plasma.
Comparison 1 Intervention versus control, Outcome 6 Operating time (minutes).

Comparison 1 Intervention versus control, Outcome 7 Hospital stay (days).

Comparison 1 Intervention versus control, Outcome 8 Transection blood loss (ml).

Comparison 1 Intervention versus control, Outcome 9 Operative blood loss (ml).
Comparison 2 Peri‐operative morbidity, Outcome 1 Low CVP versus control.
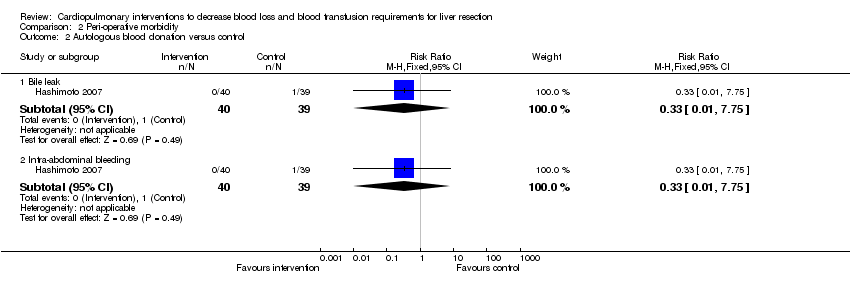
Comparison 2 Peri‐operative morbidity, Outcome 2 Autologous blood donation versus control.
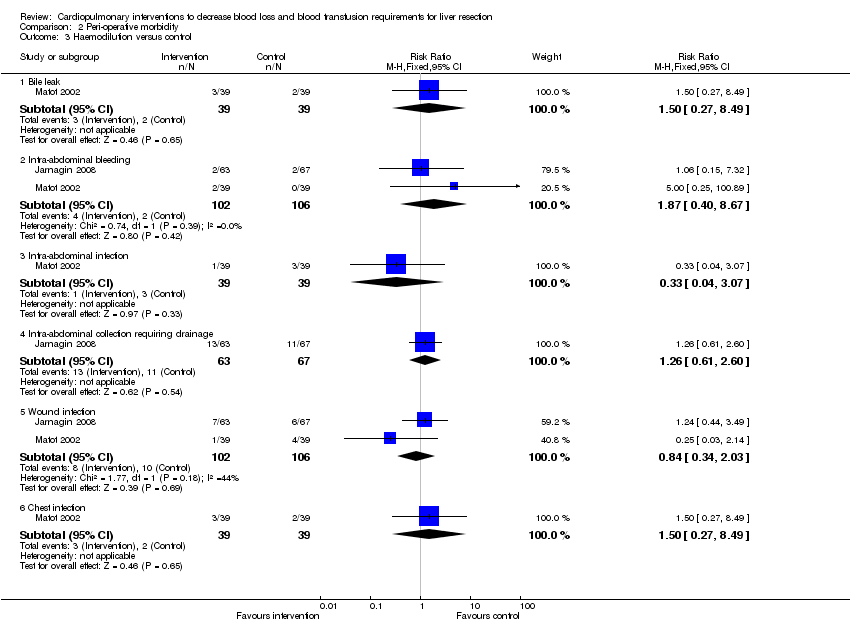
Comparison 2 Peri‐operative morbidity, Outcome 3 Haemodilution versus control.
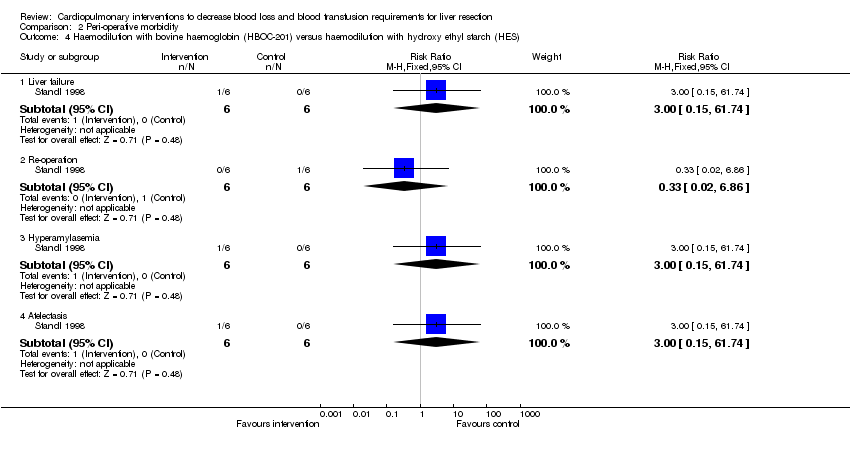
Comparison 2 Peri‐operative morbidity, Outcome 4 Haemodilution with bovine haemoglobin (HBOC‐201) versus haemodilution with hydroxy ethyl starch (HES).
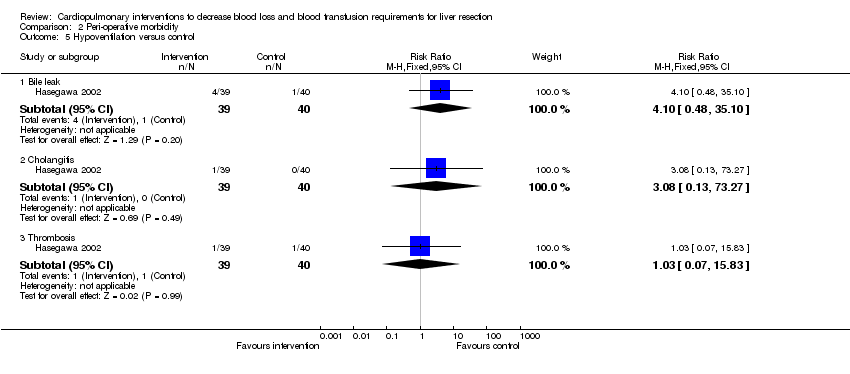
Comparison 2 Peri‐operative morbidity, Outcome 5 Hypoventilation versus control.

Comparison 3 Bilirubin (micromol/litre), Outcome 1 Low CVP versus control.

Comparison 4 Prothrombin activity, Outcome 1 Low CVP versus control.
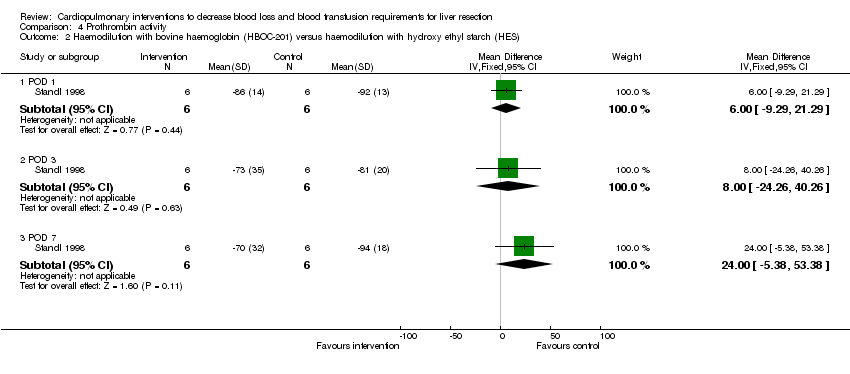
Comparison 4 Prothrombin activity, Outcome 2 Haemodilution with bovine haemoglobin (HBOC‐201) versus haemodilution with hydroxy ethyl starch (HES).

Comparison 5 Aspartate transaminase (international units/litre), Outcome 1 Low CVP versus control.

Comparison 5 Aspartate transaminase (international units/litre), Outcome 2 Hypoventilation versus control.
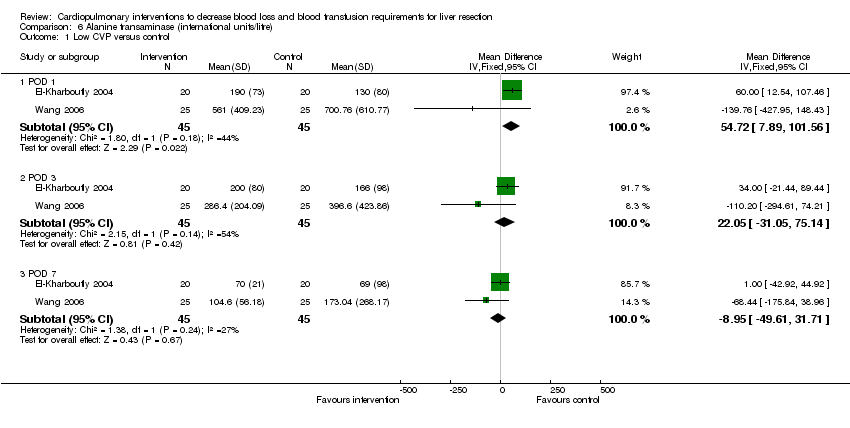
Comparison 6 Alanine transaminase (international units/litre), Outcome 1 Low CVP versus control.
| Outcome or subgroup title | No. of studies | No. of participants | Statistical method | Effect size |
| 1 Mortality Show forest plot | 8 | Risk Ratio (M‐H, Fixed, 95% CI) | Subtotals only | |
| 1.1 Low CVP versus control | 3 | 177 | Risk Ratio (M‐H, Fixed, 95% CI) | 0.36 [0.02, 8.43] |
| 1.2 Autologous blood donation versus control | 1 | 79 | Risk Ratio (M‐H, Fixed, 95% CI) | 0.0 [0.0, 0.0] |
| 1.3 Haemodilution versus control | 2 | 150 | Risk Ratio (M‐H, Fixed, 95% CI) | 0.35 [0.04, 3.32] |
| 1.4 Haemodilution with controlled hypotension versus control | 1 | 20 | Risk Ratio (M‐H, Fixed, 95% CI) | 0.0 [0.0, 0.0] |
| 1.5 Haemodilution with bovine haemoglobin (HBOC‐201) versus haemodilution with hydroxy ethyl starch (HES) | 1 | 12 | Risk Ratio (M‐H, Fixed, 95% CI) | 3.0 [0.15, 61.74] |
| 1.6 Hypoventilation versus control | 1 | 79 | Risk Ratio (M‐H, Fixed, 95% CI) | 0.0 [0.0, 0.0] |
| 2 Peri‐operative morbidity | Other data | No numeric data | ||
| 2.1 See analysis 2 | Other data | No numeric data | ||
| 3 Number requiring allogeneic blood transfusion Show forest plot | 8 | Risk Ratio (M‐H, Fixed, 95% CI) | Subtotals only | |
| 3.1 Low CVP versus control | 3 | 177 | Risk Ratio (M‐H, Fixed, 95% CI) | 0.66 [0.42, 1.03] |
| 3.2 Autologous blood donation versus control | 1 | 79 | Risk Ratio (M‐H, Fixed, 95% CI) | 0.0 [0.0, 0.0] |
| 3.3 Hemodilution versus control | 3 | 233 | Risk Ratio (M‐H, Fixed, 95% CI) | 0.41 [0.25, 0.66] |
| 3.4 Hemodilution with controlled hypotension versus control | 1 | 20 | Risk Ratio (M‐H, Fixed, 95% CI) | 0.05 [0.00, 0.72] |
| 3.5 Hypoventilation versus control | 1 | 79 | Risk Ratio (M‐H, Fixed, 95% CI) | 0.77 [0.18, 3.22] |
| 4 Red cell transfusion Show forest plot | 6 | Mean Difference (IV, Fixed, 95% CI) | Subtotals only | |
| 4.1 Low CVP versus control | 2 | 135 | Mean Difference (IV, Fixed, 95% CI) | ‐0.00 [‐0.00, 0.00] |
| 4.2 Haemodilution versus control | 2 | 150 | Mean Difference (IV, Fixed, 95% CI) | ‐0.09 [‐0.48, 0.29] |
| 4.3 Haemodilution with controlled hypotension versus control | 1 | 20 | Mean Difference (IV, Fixed, 95% CI) | ‐665.0 [‐818.71, ‐511.29] |
| 4.4 Haemodilution with bovine haemoglobin (HBOC‐201) versus haemodilution with hydroxy ethyl starch (HES) | 1 | 12 | Mean Difference (IV, Fixed, 95% CI) | 167.0 [‐606.55, 940.55] |
| 4.5 Hypoventilation versus control | 1 | 79 | Mean Difference (IV, Fixed, 95% CI) | ‐56.00 [‐155.73, 39.73] |
| 5 Fresh frozen plasma Show forest plot | 1 | Std. Mean Difference (IV, Fixed, 95% CI) | Subtotals only | |
| 5.1 Low CVP versus control | 1 | 50 | Std. Mean Difference (IV, Fixed, 95% CI) | ‐1.22 [‐1.83, ‐0.62] |
| 6 Operating time (minutes) Show forest plot | 5 | Mean Difference (IV, Fixed, 95% CI) | Subtotals only | |
| 6.1 Low CVP versus control | 2 | 90 | Mean Difference (IV, Fixed, 95% CI) | ‐24.69 [‐44.28, ‐5.09] |
| 6.2 Hemodilution versus control | 2 | 208 | Mean Difference (IV, Fixed, 95% CI) | ‐28.86 [‐57.37, ‐0.35] |
| 6.3 Hemodilution with bovine haemoglobin (HBOC‐201) versus hemodilution with hydroxy ethyl starch (HES) | 1 | 12 | Mean Difference (IV, Fixed, 95% CI) | 23.0 [‐83.60, 129.60] |
| 7 Hospital stay (days) Show forest plot | 4 | Mean Difference (IV, Fixed, 95% CI) | Subtotals only | |
| 7.1 Low CVP versus control | 2 | 135 | Mean Difference (IV, Fixed, 95% CI) | ‐4.53 [‐7.38, ‐1.68] |
| 7.2 Hemodilution versus control | 1 | 130 | Mean Difference (IV, Fixed, 95% CI) | 0.0 [‐2.66, 2.66] |
| 7.3 Haemodilution with bovine haemoglobin (HBOC‐201) versus hemodilution with hydroxy ethyl starch (HES) | 1 | 12 | Mean Difference (IV, Fixed, 95% CI) | 2.30 [‐7.52, 12.12] |
| 8 Transection blood loss (ml) Show forest plot | 4 | Mean Difference (IV, Fixed, 95% CI) | Subtotals only | |
| 8.1 Low CVP versus control | 2 | 135 | Mean Difference (IV, Fixed, 95% CI) | ‐81.71 [‐219.79, 56.37] |
| 8.2 Autologous blood donation versus control | 1 | 79 | Mean Difference (IV, Fixed, 95% CI) | ‐90.0 [‐171.60, ‐8.40] |
| 8.3 Hypoventilation versus control | 1 | 79 | Mean Difference (IV, Fixed, 95% CI) | 95.0 [‐186.40, 376.40] |
| 9 Operative blood loss (ml) Show forest plot | 7 | Mean Difference (IV, Fixed, 95% CI) | Subtotals only | |
| 9.1 Low CVP versus control | 3 | 175 | Mean Difference (IV, Fixed, 95% CI) | ‐419.35 [‐575.06, ‐263.63] |
| 9.2 Autologous blood donation versus control | 1 | 79 | Mean Difference (IV, Fixed, 95% CI) | ‐37.0 [‐100.51, 26.51] |
| 9.3 Hemodilution versus control | 2 | 98 | Mean Difference (IV, Fixed, 95% CI) | 1.53 [‐102.37, 105.44] |
| 9.4 Hemodilution with controlled hypotension versus control | 1 | 20 | Mean Difference (IV, Fixed, 95% CI) | ‐245.00 [‐357.80, ‐136.20] |
| 9.5 Hemodilution with bovine haemoglobin (HBOC‐201) versus haemodilution with hydroxy ethyl starch (HES) | 1 | 12 | Mean Difference (IV, Fixed, 95% CI) | 370.0 [‐1103.59, 1843.59] |
| 10 Bilirubin (micromol/litre) | Other data | No numeric data | ||
| 10.1 See analysis 3 | Other data | No numeric data | ||
| 11 Prothrombin activity | Other data | No numeric data | ||
| 11.1 See analysis 4 | Other data | No numeric data | ||
| 12 AST (IU/L) | Other data | No numeric data | ||
| 12.1 See analysis 5 | Other data | No numeric data | ||
| 13 ALT (IU/L) | Other data | No numeric data | ||
| 13.1 See analysis 6 | Other data | No numeric data | ||
| Outcome or subgroup title | No. of studies | No. of participants | Statistical method | Effect size |
| 1 Low CVP versus control Show forest plot | 2 | Risk Ratio (M‐H, Fixed, 95% CI) | Subtotals only | |
| 1.1 All peri‐operative morbidities | 2 | 90 | Risk Ratio (M‐H, Fixed, 95% CI) | 0.62 [0.28, 1.34] |
| 1.2 Intra‐abdominal collections | 1 | 40 | Risk Ratio (M‐H, Fixed, 95% CI) | 0.67 [0.12, 3.57] |
| 1.3 Upper gastro‐intestinal bleed | 1 | 40 | Risk Ratio (M‐H, Fixed, 95% CI) | 0.2 [0.01, 3.92] |
| 1.4 Wound infection | 1 | 40 | Risk Ratio (M‐H, Fixed, 95% CI) | 1.0 [0.07, 14.90] |
| 2 Autologous blood donation versus control Show forest plot | 1 | Risk Ratio (M‐H, Fixed, 95% CI) | Subtotals only | |
| 2.1 Bile leak | 1 | 79 | Risk Ratio (M‐H, Fixed, 95% CI) | 0.33 [0.01, 7.75] |
| 2.2 Intra‐abdominal bleeding | 1 | 79 | Risk Ratio (M‐H, Fixed, 95% CI) | 0.33 [0.01, 7.75] |
| 3 Haemodilution versus control Show forest plot | 2 | Risk Ratio (M‐H, Fixed, 95% CI) | Subtotals only | |
| 3.1 Bile leak | 1 | 78 | Risk Ratio (M‐H, Fixed, 95% CI) | 1.5 [0.27, 8.49] |
| 3.2 Intra‐abdominal bleeding | 2 | 208 | Risk Ratio (M‐H, Fixed, 95% CI) | 1.87 [0.40, 8.67] |
| 3.3 Intra‐abdominal infection | 1 | 78 | Risk Ratio (M‐H, Fixed, 95% CI) | 0.33 [0.04, 3.07] |
| 3.4 Intra‐abdominal collection requiring drainage | 1 | 130 | Risk Ratio (M‐H, Fixed, 95% CI) | 1.26 [0.61, 2.60] |
| 3.5 Wound infection | 2 | 208 | Risk Ratio (M‐H, Fixed, 95% CI) | 0.84 [0.34, 2.03] |
| 3.6 Chest infection | 1 | 78 | Risk Ratio (M‐H, Fixed, 95% CI) | 1.5 [0.27, 8.49] |
| 4 Haemodilution with bovine haemoglobin (HBOC‐201) versus haemodilution with hydroxy ethyl starch (HES) Show forest plot | 1 | Risk Ratio (M‐H, Fixed, 95% CI) | Subtotals only | |
| 4.1 Liver failure | 1 | 12 | Risk Ratio (M‐H, Fixed, 95% CI) | 3.0 [0.15, 61.74] |
| 4.2 Re‐operation | 1 | 12 | Risk Ratio (M‐H, Fixed, 95% CI) | 0.33 [0.02, 6.86] |
| 4.3 Hyperamylasemia | 1 | 12 | Risk Ratio (M‐H, Fixed, 95% CI) | 3.0 [0.15, 61.74] |
| 4.4 Atelectasis | 1 | 12 | Risk Ratio (M‐H, Fixed, 95% CI) | 3.0 [0.15, 61.74] |
| 5 Hypoventilation versus control Show forest plot | 1 | Risk Ratio (M‐H, Fixed, 95% CI) | Subtotals only | |
| 5.1 Bile leak | 1 | 79 | Risk Ratio (M‐H, Fixed, 95% CI) | 4.10 [0.48, 35.10] |
| 5.2 Cholangitis | 1 | 79 | Risk Ratio (M‐H, Fixed, 95% CI) | 3.08 [0.13, 73.27] |
| 5.3 Thrombosis | 1 | 79 | Risk Ratio (M‐H, Fixed, 95% CI) | 1.03 [0.07, 15.83] |
| Outcome or subgroup title | No. of studies | No. of participants | Statistical method | Effect size |
| 1 Low CVP versus control Show forest plot | 2 | Mean Difference (IV, Fixed, 95% CI) | Subtotals only | |
| 1.1 POD 1 | 2 | 90 | Mean Difference (IV, Fixed, 95% CI) | 0.22 [‐10.31, 10.75] |
| 1.2 POD 3 | 2 | 90 | Mean Difference (IV, Fixed, 95% CI) | 2.02 [‐9.90, 13.94] |
| 1.3 POD 7 | 2 | 90 | Mean Difference (IV, Fixed, 95% CI) | 5.02 [‐5.05, 15.09] |
| Outcome or subgroup title | No. of studies | No. of participants | Statistical method | Effect size |
| 1 Low CVP versus control Show forest plot | 1 | Mean Difference (IV, Fixed, 95% CI) | Subtotals only | |
| 1.1 POD 1 | 1 | 40 | Mean Difference (IV, Fixed, 95% CI) | ‐2.0 [‐10.00, 6.00] |
| 1.2 POD 3 | 1 | 40 | Mean Difference (IV, Fixed, 95% CI) | 2.0 [‐5.17, 9.17] |
| 1.3 POD 7 | 1 | 40 | Mean Difference (IV, Fixed, 95% CI) | ‐9.0 [‐33.48, 15.48] |
| 2 Haemodilution with bovine haemoglobin (HBOC‐201) versus haemodilution with hydroxy ethyl starch (HES) Show forest plot | 1 | Mean Difference (IV, Fixed, 95% CI) | Subtotals only | |
| 2.1 POD 1 | 1 | 12 | Mean Difference (IV, Fixed, 95% CI) | 6.0 [‐9.29, 21.29] |
| 2.2 POD 3 | 1 | 12 | Mean Difference (IV, Fixed, 95% CI) | 8.0 [‐24.26, 40.26] |
| 2.3 POD 7 | 1 | 12 | Mean Difference (IV, Fixed, 95% CI) | 24.0 [‐5.38, 53.38] |
| Outcome or subgroup title | No. of studies | No. of participants | Statistical method | Effect size |
| 1 Low CVP versus control Show forest plot | 1 | Mean Difference (IV, Fixed, 95% CI) | Subtotals only | |
| 1.1 POD 1 | 1 | 40 | Mean Difference (IV, Fixed, 95% CI) | 50.0 [‐18.40, 118.40] |
| 1.2 POD 3 | 1 | 40 | Mean Difference (IV, Fixed, 95% CI) | 14.0 [‐47.39, 75.39] |
| 1.3 POD 7 | 1 | 40 | Mean Difference (IV, Fixed, 95% CI) | 9.0 [‐15.48, 33.48] |
| 2 Hypoventilation versus control Show forest plot | 1 | Mean Difference (IV, Fixed, 95% CI) | Subtotals only | |
| 2.1 POD 1 | 1 | 79 | Mean Difference (IV, Fixed, 95% CI) | ‐5.00 [‐31.26, 17.26] |
| Outcome or subgroup title | No. of studies | No. of participants | Statistical method | Effect size |
| 1 Low CVP versus control Show forest plot | 2 | Mean Difference (IV, Fixed, 95% CI) | Subtotals only | |
| 1.1 POD 1 | 2 | 90 | Mean Difference (IV, Fixed, 95% CI) | 54.72 [7.89, 101.56] |
| 1.2 POD 3 | 2 | 90 | Mean Difference (IV, Fixed, 95% CI) | 22.05 [‐31.05, 75.14] |
| 1.3 POD 7 | 2 | 90 | Mean Difference (IV, Fixed, 95% CI) | ‐8.95 [‐49.61, 31.71] |