Cardiopulmonary interventions to decrease blood loss and blood transfusion requirements for liver resection
References
References to studies included in this review
Jump to:
References to studies excluded from this review
Jump to:
Additional references
Jump to:
Characteristics of studies
Characteristics of included studies [ordered by study ID]
Jump to:
| Methods | Randomised clinical trial Sequence generation: unclear. | |
| Participants | Country: Egypt. Inclusion criteria: Exclusion criteria:
| |
| Interventions | Participants were randomly assigned to two groups. Group 1: low CVP (n = 20). Further details of intervention: Other details: | |
| Outcomes | The outcome measures were mortality, transfusion requirements, peri‐operative morbidity, operating time, blood loss, and liver function tests. | |
| Notes | Attempts to contact the authors in November 2008 were unsuccessful. | |
| Risk of bias | ||
| Bias | Authors' judgement | Support for judgement |
| Adequate sequence generation? | Unclear risk | Unclear. |
| Allocation concealment? | Unclear risk | Quote: "Patients were randomly (closed envelop method) divided into two groups...." Comment: It is not clear whether the authors used opaque envelopes. |
| Blinding? | High risk | No. |
| Incomplete outcome data addressed? | Unclear risk | Unclear. |
| Free of selective reporting? | High risk | Comment: Important outcomes such as liver failure were not reported. |
| Free of baseline imbalance? | Low risk | Comment: The patients were well matched for important baseline characteristics. |
| Free of early stopping bias? | Low risk | Comment: The trialists recruited the intended number of patients. |
| Free of academic bias? | Low risk | Comment: There were no previously published trials of same comparisons by the author. |
| Free of sponsor bias? | Unclear risk | Unclear. |
| Methods | Randomised clinical trial Sequence generation: unclear. | |
| Participants | Country: Japan. Inclusion criteria: Exclusion criteria: | |
| Interventions | Participants were randomly assigned to two groups. Group 1: hypoventilation (n = 40) (see notes). Further details of intervention and control: Other details | |
| Outcomes | The outcome measures were mortality, transfusion requirements, peri‐operative morbidity, hospital stay, blood loss, and liver function tests. | |
| Notes | One patient from intervention group who did not undergo liver resection was excluded from analysis. Attempts to contact the authors in November 2008 were unsuccessful. | |
| Risk of bias | ||
| Bias | Authors' judgement | Support for judgement |
| Adequate sequence generation? | Unclear risk | Unclear. |
| Allocation concealment? | Unclear risk | Unclear. |
| Blinding? | High risk | No. |
| Incomplete outcome data addressed? | Low risk | Comment: There was one post‐randomisation drop‐out. This patient did not undergo liver resection. This was not due to the treatment effect. |
| Free of selective reporting? | High risk | Comment: Important outcomes such as liver failure were not reported. |
| Free of baseline imbalance? | Low risk | Comment: The patients were well matched for important baseline characteristics. |
| Free of early stopping bias? | Unclear risk | Unclear. |
| Free of academic bias? | Low risk | Comment: There were no previously published trials of same comparisons by the author. |
| Free of sponsor bias? | Unclear risk | Unclear. |
| Methods | Randomised clinical trial Sequence generation: adequate. | |
| Participants | Country: Japan. Inclusion criteria:
Exclusion criteria
| |
| Interventions | Participants were randomly assigned to two groups. Group 1: autologous blood donation (n = 40). Further details of intervention: Other details: | |
| Outcomes | The outcome measures were mortality, transfusion requirements, peri‐operative morbidity, hospital stay, blood loss and liver function tests. | |
| Notes | One patient from control group in whom the surgery was cancelled because of asthmatic attack was excluded from analysis. Authors replied to questions related to mortality and transfusion requirements in November 2008. | |
| Risk of bias | ||
| Bias | Authors' judgement | Support for judgement |
| Adequate sequence generation? | Low risk | Quote: "The participants were randomly assigned in the operating room to either the blood salvage group (BS group) or a control group using a minimization method with 3 stratifying factors: age....." |
| Allocation concealment? | Low risk | Quote: "The participants were randomly assigned in the operating room to either the blood salvage group (BS group) or a control group using a minimization method with 3 stratifying factors: age....." |
| Blinding? | High risk | Quote: "the surgical team and participants were blinded to the data throughout the study period." Comment: The anaesthetists were not blinded to the groups. This could have resulted in different managements for the two groups. |
| Incomplete outcome data addressed? | Low risk | Comment: There was one post‐randomisation drop‐out. This patient did not undergo surgery and none of the outcomes could be measured or reported. This was not due to the treatment effect. |
| Free of selective reporting? | High risk | Comment: Important outcomes such as liver failure were not reported. |
| Free of baseline imbalance? | Low risk | Comment: The patients were well matched for important baseline characteristics. |
| Free of early stopping bias? | Low risk | Comment: The trialists recruited the intended number of patients. |
| Free of academic bias? | Low risk | Comment: There were no previously published trials of same comparisons by the author. |
| Free of sponsor bias? | Low risk | Quote: "Supported by a grant from the Kanae Foundation for Life & Socio‐medical Science, a grant from the Public Trust Surgery Research Fund, a grant from the Japanese Clinical Oncology Fund, a grant from the Public Trust Haraguchi Memorial Cancer Research Fund in Japan, and a Grant‐in‐Aid for Scientific Research from the Ministry of Education, Culture, Sports, Science and Technology of Japan (No. 18790955)." |
| Methods | Randomised clinical trial Sequence generation: adequate. | |
| Participants | Country: USA. Inclusion criteria:
Exclusion criteria:
| |
| Interventions | Participants were randomly assigned to two groups. Group 1: haemodilution (n = 63). Further details of intervention: Other details: | |
| Outcomes | The outcomes reported were mortality, transfusion requirements, peri‐operative morbidity, operating time, and hospital stay. | |
| Notes | There were 3 dropouts in ANH group and 2 in standard. The reason for dropouts were resection not performed in 2, resection smaller than required by the study in 2 and inability to accurately determine blood loss in 1 (author replies). Authors replied to questions related to methodological quality in November 2008. | |
| Risk of bias | ||
| Bias | Authors' judgement | Support for judgement |
| Adequate sequence generation? | Low risk | Quote: "The random sequence was computer generated" (author replies). |
| Allocation concealment? | Unclear risk | Quote: "Allocation was concealed by sealed envelopes" (author replies). Comment: It is not clear whether the authors used opaque envelopes. |
| Blinding? | High risk | No. |
| Incomplete outcome data addressed? | High risk | Comment: There were 5 post‐randomisation drop‐outs. |
| Free of selective reporting? | High risk | Comment: Important outcomes such as liver failure were not reported. |
| Free of baseline imbalance? | Unclear risk | Unclear. |
| Free of early stopping bias? | Low risk | Comment: The trialists recruited the intended number of patients. |
| Free of academic bias? | Low risk | Comment: There were no previously published trials of same comparisons by the author. |
| Free of sponsor bias? | Low risk | Quote: "The authors thank ... Robert Wittes, MD, Physician‐in‐Chief, Memorial Hospital, for providing financial support." |
| Methods | Randomised clinical trial Sequence generation: adequate. | |
| Participants | Country: Japan. Inclusion criteria: | |
| Interventions | Participants were randomly assigned to two groups. Group 1: low CVP (n = 20). Further details of intervention: Other details: | |
| Outcomes | The outcomes reported were mortality, transfusion requirements, and hospital stay. | |
| Notes | Attempts to contact the authors in November 2008 were unsuccessful. | |
| Risk of bias | ||
| Bias | Authors' judgement | Support for judgement |
| Adequate sequence generation? | Low risk | Quote: "Eighty‐five patients who underwent hepatic resection....randomly assigned to an IVC clamping or an IVC non‐clamping group by the minimization method with stratified factors of age, .." |
| Allocation concealment? | Low risk | Quote: "Eighty‐five patients who underwent hepatic resection....randomly assigned to an IVC clamping or an IVC non‐clamping group by the minimization method with stratified factors of age, .." |
| Blinding? | High risk | No. |
| Incomplete outcome data addressed? | Low risk | Comment: There were no post‐randomisation drop‐outs. |
| Free of selective reporting? | High risk | Comment: Important outcomes such as liver failure were not reported. |
| Free of baseline imbalance? | Unclear risk | Unclear. |
| Free of early stopping bias? | Low risk | Comment: The trialists recruited the intended number of patients. |
| Free of academic bias? | Low risk | Comment: There were no previously published trials of same comparisons by the author. |
| Free of sponsor bias? | Unclear risk | Unclear. |
| Methods | Randomised clinical trial Sequence generation: adequate. | |
| Participants | Country: Israel. Inclusion criteria:
Exclusion criteria: | |
| Interventions | Participants were randomly assigned to two groups. Group 1: haemodilution (n = 39). Further details of intervention: Other details: | |
| Outcomes | The outcome measures were transfusion requirements, peri‐operative morbidity, operating time, blood loss, and liver function tests. | |
| Notes | Attempts to contact the authors in November 2008 were unsuccessful. | |
| Risk of bias | ||
| Bias | Authors' judgement | Support for judgement |
| Adequate sequence generation? | Low risk | Quote: "On admission to the operating room, patients who met inclusion criteria were randomly assigned (random numbers) to one of two groups..." |
| Allocation concealment? | Unclear risk | Unclear. |
| Blinding? | High risk | Quote: "The anaesthesiologist making decisions regarding transfusion was not blinded to patient group assignment." |
| Incomplete outcome data addressed? | Unclear risk | Unclear. |
| Free of selective reporting? | High risk | Comment: Important outcomes such as liver failure were not reported. |
| Free of baseline imbalance? | Unclear risk | Unclear. |
| Free of early stopping bias? | Low risk | Comment: The trialists recruited the intended number of patients. |
| Free of academic bias? | Low risk | Comment: There were no previously published trials of same comparisons by the author. |
| Free of sponsor bias? | Unclear risk | Unclear. |
| Methods | Randomised clinical trial Sequence generation: unclear. | |
| Participants | Country: Germany. Inclusion criteria: Exclusion criteria
| |
| Interventions | Participants were randomly assigned to two groups. Group 1: HBOC‐201 (n = 6). Further details of intervention and control: Other details: | |
| Outcomes | The outcome measures were mortality, transfusion requirements, peri‐operative morbidity, operating time, hospital stay, blood loss, and liver function tests. | |
| Notes | Attempts to contact the authors in November 2008 were unsuccessful. | |
| Risk of bias | ||
| Bias | Authors' judgement | Support for judgement |
| Adequate sequence generation? | Unclear risk | Unclear. |
| Allocation concealment? | Unclear risk | Unclear. |
| Blinding? | High risk | No. |
| Incomplete outcome data addressed? | Unclear risk | Unclear. |
| Free of selective reporting? | High risk | Comment: Important outcomes such as liver failure were not reported. |
| Free of baseline imbalance? | Low risk | Yes. |
| Free of early stopping bias? | Unclear risk | Unclear. |
| Free of academic bias? | Low risk | Comment: There were no previously published trials of same comparisons by the author. |
| Free of sponsor bias? | Unclear risk | Unclear. |
| Methods | Randomised clinical trial Sequence generation: unclear. | |
| Participants | Country: China. Inclusion criteria: | |
| Interventions | Participants were randomly assigned to two groups. Group 1: low CVP (n = 25). Further details of intervention: Other details: | |
| Outcomes | The outcome measures were mortality, transfusion requirements, peri‐operative morbidity, operating time, hospital stay, blood loss, and liver function tests. | |
| Notes | Two patients from control group in whom per‐operative death occurred (n = 1) and in whom the procedure was abandoned because of unclear tumour demarcation (n = 1) were excluded from analysis. Attempts to contact the authors in November 2008 were unsuccessful. | |
| Risk of bias | ||
| Bias | Authors' judgement | Support for judgement |
| Adequate sequence generation? | Unclear risk | Unclear. |
| Allocation concealment? | Unclear risk | Quote: "By the sealed envelope method, the patients were blindly randomised into LCVP group....". Comment: It is not clear whether the authors used opaque envelopes. |
| Blinding? | High risk | No. |
| Incomplete outcome data addressed? | High risk | Comment: 2 patients were excluded post‐randomisation. This could be related to the treatment effect. |
| Free of selective reporting? | High risk | Comment: Important outcomes such as liver failure were not reported. |
| Free of baseline imbalance? | Low risk | Yes. |
| Free of early stopping bias? | Unclear risk | Unclear. |
| Free of academic bias? | Low risk | Comment: There were no previously published trials of same comparisons by the author. |
| Free of sponsor bias? | Unclear risk | Unclear. |
| Methods | Randomised clinical trial Sequence generation: unclear. | |
| Participants | Country: China. Inclusion criteria:
| |
| Interventions | Participants were randomly assigned to three groups. Group 1: acute normovolemic haemodilution with hypotension (n = 10). Further details of intervention: Group 1: dilution with crystalloid solution (10ml/kg), autologous blood donation (replaced with 6% HES), and reduced the MAP to 70% with 0.01% sodium nitroprusside (1 mcg/kg/min). Other details: | |
| Outcomes | The outcomes reported were mortality, transfusion requirements, and operative blood loss. | |
| Notes | Attempts to contact the authors in December 2008 were unsuccessful. | |
| Risk of bias | ||
| Bias | Authors' judgement | Support for judgement |
| Adequate sequence generation? | Unclear risk | Unclear. |
| Allocation concealment? | Unclear risk | Unclear. |
| Blinding? | High risk | No. |
| Incomplete outcome data addressed? | Unclear risk | Unclear. |
| Free of selective reporting? | High risk | Comment: Important outcomes such as liver failure were not reported. |
| Free of baseline imbalance? | Unclear risk | Unclear. |
| Free of early stopping bias? | Unclear risk | Unclear. |
| Free of academic bias? | Low risk | Comment: There were no previously published trials of same comparisons by the author. |
| Free of sponsor bias? | Unclear risk | Unclear. |
CUSA = cavitron ultrasonic surgical aspirator
CVP = central venous pressure
MAP = mean arterial pressure
PTC = portal triad clamping
Characteristics of excluded studies [ordered by study ID]
Jump to:
| Study | Reason for exclusion |
| This trial compared plasma fibronectin levels in patients who underwent pre‐operative autologous blood donation and controls. Patients who required allogenic blood transfusion and who did not require any transfusion were excluded from analysis. As we consider the allogenic blood transfusion requirements and the morbidity directly or indirectly related to this as the important outcomes in this comparison, we have excluded this trial. |
Data and analyses
| Outcome or subgroup title | No. of studies | No. of participants | Statistical method | Effect size |
| 1 Mortality Show forest plot | 8 | Risk Ratio (M‐H, Fixed, 95% CI) | Subtotals only | |
| Analysis 1.1 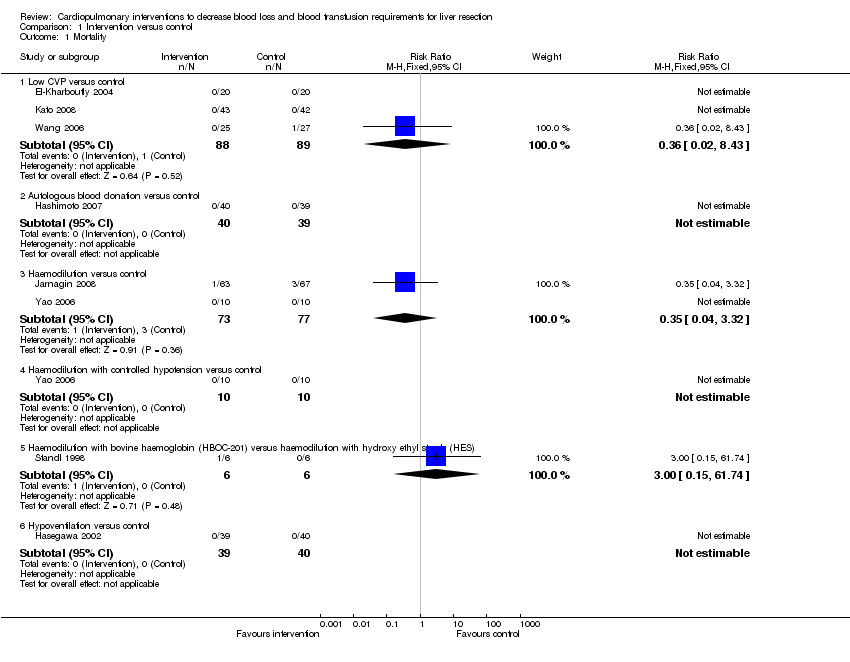 Comparison 1 Intervention versus control, Outcome 1 Mortality. | ||||
| 1.1 Low CVP versus control | 3 | 177 | Risk Ratio (M‐H, Fixed, 95% CI) | 0.36 [0.02, 8.43] |
| 1.2 Autologous blood donation versus control | 1 | 79 | Risk Ratio (M‐H, Fixed, 95% CI) | 0.0 [0.0, 0.0] |
| 1.3 Haemodilution versus control | 2 | 150 | Risk Ratio (M‐H, Fixed, 95% CI) | 0.35 [0.04, 3.32] |
| 1.4 Haemodilution with controlled hypotension versus control | 1 | 20 | Risk Ratio (M‐H, Fixed, 95% CI) | 0.0 [0.0, 0.0] |
| 1.5 Haemodilution with bovine haemoglobin (HBOC‐201) versus haemodilution with hydroxy ethyl starch (HES) | 1 | 12 | Risk Ratio (M‐H, Fixed, 95% CI) | 3.0 [0.15, 61.74] |
| 1.6 Hypoventilation versus control | 1 | 79 | Risk Ratio (M‐H, Fixed, 95% CI) | 0.0 [0.0, 0.0] |
| 2 Peri‐operative morbidity | Other data | No numeric data | ||
| 2.1 See analysis 2 | Other data | No numeric data | ||
| 3 Number requiring allogeneic blood transfusion Show forest plot | 8 | Risk Ratio (M‐H, Fixed, 95% CI) | Subtotals only | |
| Analysis 1.3 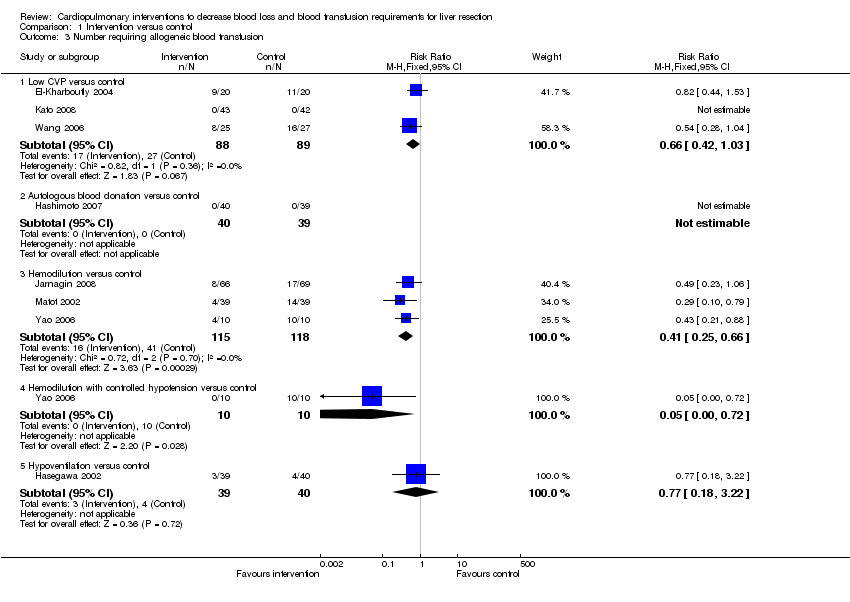 Comparison 1 Intervention versus control, Outcome 3 Number requiring allogeneic blood transfusion. | ||||
| 3.1 Low CVP versus control | 3 | 177 | Risk Ratio (M‐H, Fixed, 95% CI) | 0.66 [0.42, 1.03] |
| 3.2 Autologous blood donation versus control | 1 | 79 | Risk Ratio (M‐H, Fixed, 95% CI) | 0.0 [0.0, 0.0] |
| 3.3 Hemodilution versus control | 3 | 233 | Risk Ratio (M‐H, Fixed, 95% CI) | 0.41 [0.25, 0.66] |
| 3.4 Hemodilution with controlled hypotension versus control | 1 | 20 | Risk Ratio (M‐H, Fixed, 95% CI) | 0.05 [0.00, 0.72] |
| 3.5 Hypoventilation versus control | 1 | 79 | Risk Ratio (M‐H, Fixed, 95% CI) | 0.77 [0.18, 3.22] |
| 4 Red cell transfusion Show forest plot | 6 | Mean Difference (IV, Fixed, 95% CI) | Subtotals only | |
| Analysis 1.4  Comparison 1 Intervention versus control, Outcome 4 Red cell transfusion. | ||||
| 4.1 Low CVP versus control | 2 | 135 | Mean Difference (IV, Fixed, 95% CI) | ‐0.00 [‐0.00, 0.00] |
| 4.2 Haemodilution versus control | 2 | 150 | Mean Difference (IV, Fixed, 95% CI) | ‐0.09 [‐0.48, 0.29] |
| 4.3 Haemodilution with controlled hypotension versus control | 1 | 20 | Mean Difference (IV, Fixed, 95% CI) | ‐665.0 [‐818.71, ‐511.29] |
| 4.4 Haemodilution with bovine haemoglobin (HBOC‐201) versus haemodilution with hydroxy ethyl starch (HES) | 1 | 12 | Mean Difference (IV, Fixed, 95% CI) | 167.0 [‐606.55, 940.55] |
| 4.5 Hypoventilation versus control | 1 | 79 | Mean Difference (IV, Fixed, 95% CI) | ‐56.00 [‐155.73, 39.73] |
| 5 Fresh frozen plasma Show forest plot | 1 | Std. Mean Difference (IV, Fixed, 95% CI) | Subtotals only | |
| Analysis 1.5  Comparison 1 Intervention versus control, Outcome 5 Fresh frozen plasma. | ||||
| 5.1 Low CVP versus control | 1 | 50 | Std. Mean Difference (IV, Fixed, 95% CI) | ‐1.22 [‐1.83, ‐0.62] |
| 6 Operating time (minutes) Show forest plot | 5 | Mean Difference (IV, Fixed, 95% CI) | Subtotals only | |
| Analysis 1.6 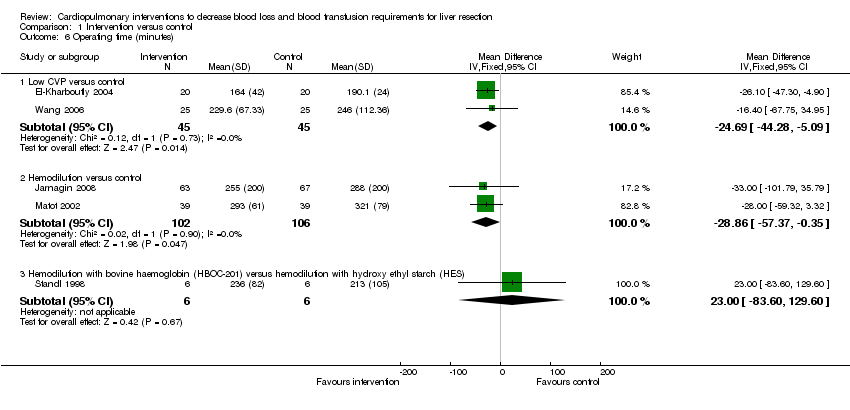 Comparison 1 Intervention versus control, Outcome 6 Operating time (minutes). | ||||
| 6.1 Low CVP versus control | 2 | 90 | Mean Difference (IV, Fixed, 95% CI) | ‐24.69 [‐44.28, ‐5.09] |
| 6.2 Hemodilution versus control | 2 | 208 | Mean Difference (IV, Fixed, 95% CI) | ‐28.86 [‐57.37, ‐0.35] |
| 6.3 Hemodilution with bovine haemoglobin (HBOC‐201) versus hemodilution with hydroxy ethyl starch (HES) | 1 | 12 | Mean Difference (IV, Fixed, 95% CI) | 23.0 [‐83.60, 129.60] |
| 7 Hospital stay (days) Show forest plot | 4 | Mean Difference (IV, Fixed, 95% CI) | Subtotals only | |
| Analysis 1.7  Comparison 1 Intervention versus control, Outcome 7 Hospital stay (days). | ||||
| 7.1 Low CVP versus control | 2 | 135 | Mean Difference (IV, Fixed, 95% CI) | ‐4.53 [‐7.38, ‐1.68] |
| 7.2 Hemodilution versus control | 1 | 130 | Mean Difference (IV, Fixed, 95% CI) | 0.0 [‐2.66, 2.66] |
| 7.3 Haemodilution with bovine haemoglobin (HBOC‐201) versus hemodilution with hydroxy ethyl starch (HES) | 1 | 12 | Mean Difference (IV, Fixed, 95% CI) | 2.30 [‐7.52, 12.12] |
| 8 Transection blood loss (ml) Show forest plot | 4 | Mean Difference (IV, Fixed, 95% CI) | Subtotals only | |
| Analysis 1.8  Comparison 1 Intervention versus control, Outcome 8 Transection blood loss (ml). | ||||
| 8.1 Low CVP versus control | 2 | 135 | Mean Difference (IV, Fixed, 95% CI) | ‐81.71 [‐219.79, 56.37] |
| 8.2 Autologous blood donation versus control | 1 | 79 | Mean Difference (IV, Fixed, 95% CI) | ‐90.0 [‐171.60, ‐8.40] |
| 8.3 Hypoventilation versus control | 1 | 79 | Mean Difference (IV, Fixed, 95% CI) | 95.0 [‐186.40, 376.40] |
| 9 Operative blood loss (ml) Show forest plot | 7 | Mean Difference (IV, Fixed, 95% CI) | Subtotals only | |
| Analysis 1.9  Comparison 1 Intervention versus control, Outcome 9 Operative blood loss (ml). | ||||
| 9.1 Low CVP versus control | 3 | 175 | Mean Difference (IV, Fixed, 95% CI) | ‐419.35 [‐575.06, ‐263.63] |
| 9.2 Autologous blood donation versus control | 1 | 79 | Mean Difference (IV, Fixed, 95% CI) | ‐37.0 [‐100.51, 26.51] |
| 9.3 Hemodilution versus control | 2 | 98 | Mean Difference (IV, Fixed, 95% CI) | 1.53 [‐102.37, 105.44] |
| 9.4 Hemodilution with controlled hypotension versus control | 1 | 20 | Mean Difference (IV, Fixed, 95% CI) | ‐245.00 [‐357.80, ‐136.20] |
| 9.5 Hemodilution with bovine haemoglobin (HBOC‐201) versus haemodilution with hydroxy ethyl starch (HES) | 1 | 12 | Mean Difference (IV, Fixed, 95% CI) | 370.0 [‐1103.59, 1843.59] |
| 10 Bilirubin (micromol/litre) | Other data | No numeric data | ||
| 10.1 See analysis 3 | Other data | No numeric data | ||
| 11 Prothrombin activity | Other data | No numeric data | ||
| 11.1 See analysis 4 | Other data | No numeric data | ||
| 12 AST (IU/L) | Other data | No numeric data | ||
| 12.1 See analysis 5 | Other data | No numeric data | ||
| 13 ALT (IU/L) | Other data | No numeric data | ||
| 13.1 See analysis 6 | Other data | No numeric data | ||
| Outcome or subgroup title | No. of studies | No. of participants | Statistical method | Effect size |
| 1 Low CVP versus control Show forest plot | 2 | Risk Ratio (M‐H, Fixed, 95% CI) | Subtotals only | |
| Analysis 2.1 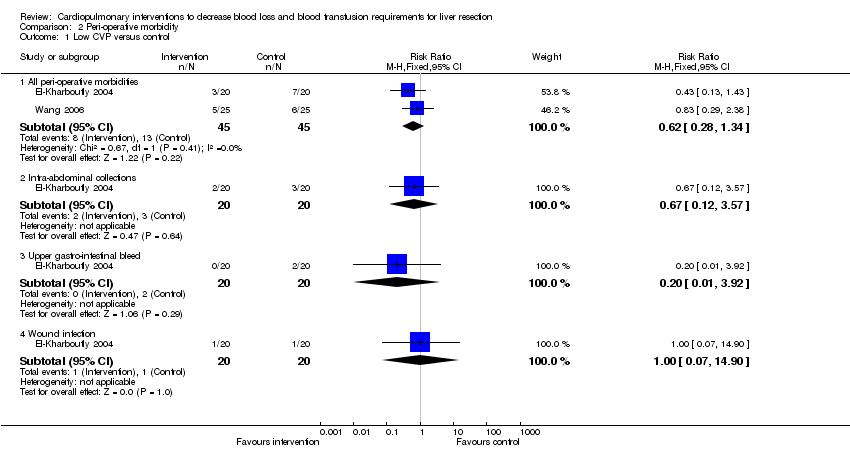 Comparison 2 Peri‐operative morbidity, Outcome 1 Low CVP versus control. | ||||
| 1.1 All peri‐operative morbidities | 2 | 90 | Risk Ratio (M‐H, Fixed, 95% CI) | 0.62 [0.28, 1.34] |
| 1.2 Intra‐abdominal collections | 1 | 40 | Risk Ratio (M‐H, Fixed, 95% CI) | 0.67 [0.12, 3.57] |
| 1.3 Upper gastro‐intestinal bleed | 1 | 40 | Risk Ratio (M‐H, Fixed, 95% CI) | 0.2 [0.01, 3.92] |
| 1.4 Wound infection | 1 | 40 | Risk Ratio (M‐H, Fixed, 95% CI) | 1.0 [0.07, 14.90] |
| 2 Autologous blood donation versus control Show forest plot | 1 | Risk Ratio (M‐H, Fixed, 95% CI) | Subtotals only | |
| Analysis 2.2 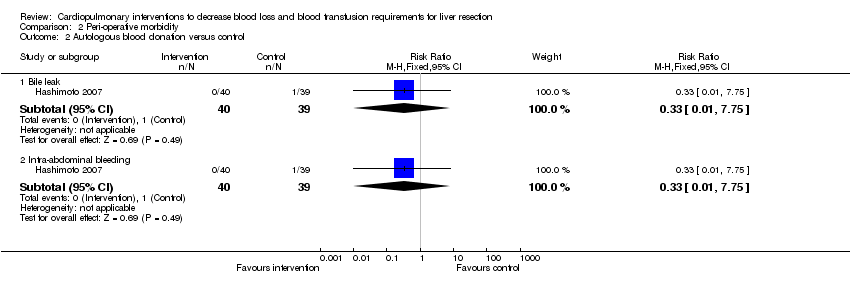 Comparison 2 Peri‐operative morbidity, Outcome 2 Autologous blood donation versus control. | ||||
| 2.1 Bile leak | 1 | 79 | Risk Ratio (M‐H, Fixed, 95% CI) | 0.33 [0.01, 7.75] |
| 2.2 Intra‐abdominal bleeding | 1 | 79 | Risk Ratio (M‐H, Fixed, 95% CI) | 0.33 [0.01, 7.75] |
| 3 Haemodilution versus control Show forest plot | 2 | Risk Ratio (M‐H, Fixed, 95% CI) | Subtotals only | |
| Analysis 2.3 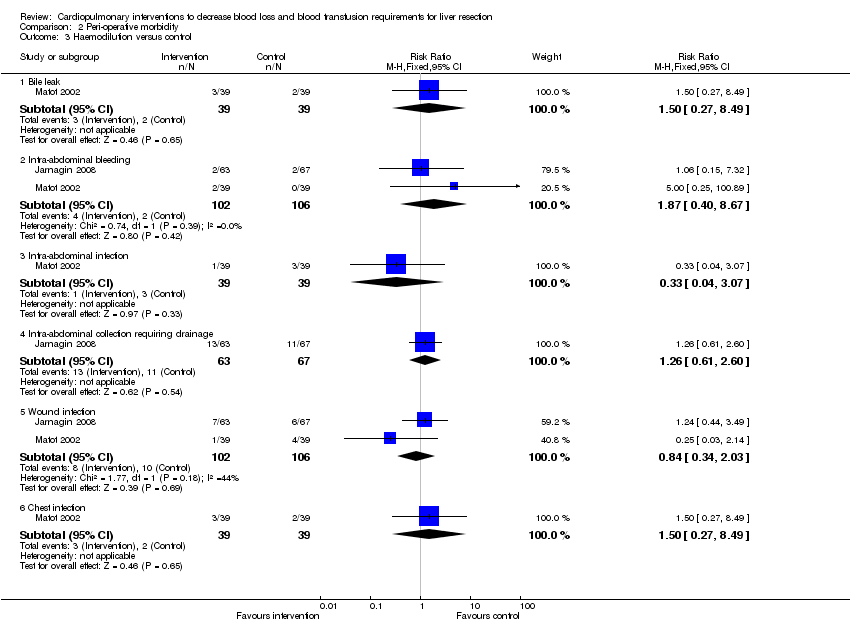 Comparison 2 Peri‐operative morbidity, Outcome 3 Haemodilution versus control. | ||||
| 3.1 Bile leak | 1 | 78 | Risk Ratio (M‐H, Fixed, 95% CI) | 1.5 [0.27, 8.49] |
| 3.2 Intra‐abdominal bleeding | 2 | 208 | Risk Ratio (M‐H, Fixed, 95% CI) | 1.87 [0.40, 8.67] |
| 3.3 Intra‐abdominal infection | 1 | 78 | Risk Ratio (M‐H, Fixed, 95% CI) | 0.33 [0.04, 3.07] |
| 3.4 Intra‐abdominal collection requiring drainage | 1 | 130 | Risk Ratio (M‐H, Fixed, 95% CI) | 1.26 [0.61, 2.60] |
| 3.5 Wound infection | 2 | 208 | Risk Ratio (M‐H, Fixed, 95% CI) | 0.84 [0.34, 2.03] |
| 3.6 Chest infection | 1 | 78 | Risk Ratio (M‐H, Fixed, 95% CI) | 1.5 [0.27, 8.49] |
| 4 Haemodilution with bovine haemoglobin (HBOC‐201) versus haemodilution with hydroxy ethyl starch (HES) Show forest plot | 1 | Risk Ratio (M‐H, Fixed, 95% CI) | Subtotals only | |
| Analysis 2.4 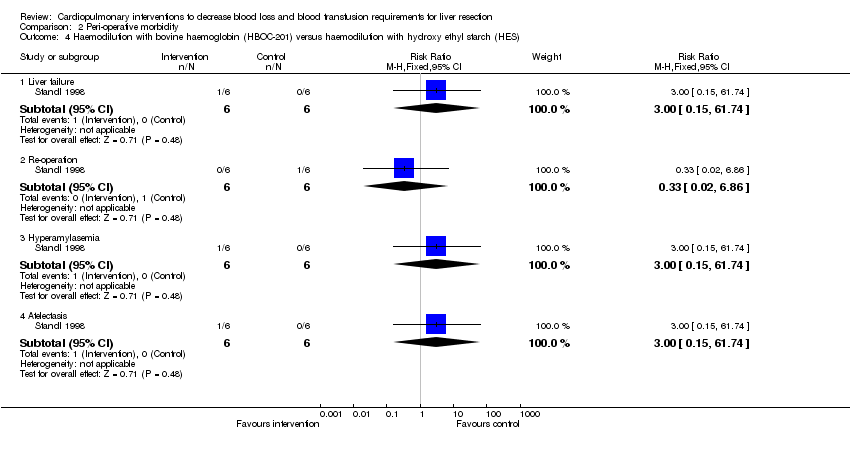 Comparison 2 Peri‐operative morbidity, Outcome 4 Haemodilution with bovine haemoglobin (HBOC‐201) versus haemodilution with hydroxy ethyl starch (HES). | ||||
| 4.1 Liver failure | 1 | 12 | Risk Ratio (M‐H, Fixed, 95% CI) | 3.0 [0.15, 61.74] |
| 4.2 Re‐operation | 1 | 12 | Risk Ratio (M‐H, Fixed, 95% CI) | 0.33 [0.02, 6.86] |
| 4.3 Hyperamylasemia | 1 | 12 | Risk Ratio (M‐H, Fixed, 95% CI) | 3.0 [0.15, 61.74] |
| 4.4 Atelectasis | 1 | 12 | Risk Ratio (M‐H, Fixed, 95% CI) | 3.0 [0.15, 61.74] |
| 5 Hypoventilation versus control Show forest plot | 1 | Risk Ratio (M‐H, Fixed, 95% CI) | Subtotals only | |
| Analysis 2.5 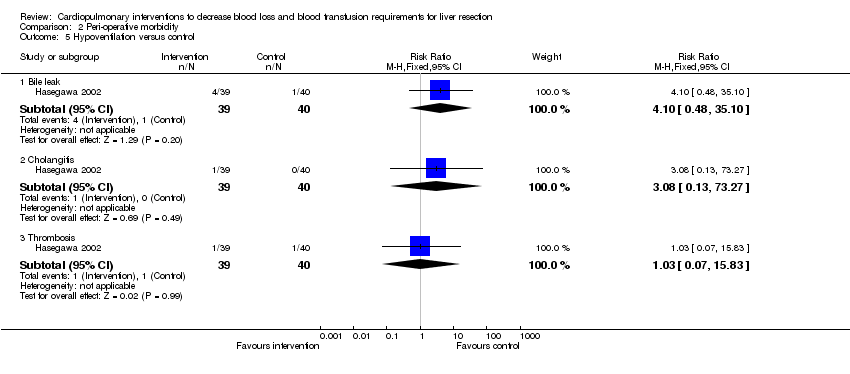 Comparison 2 Peri‐operative morbidity, Outcome 5 Hypoventilation versus control. | ||||
| 5.1 Bile leak | 1 | 79 | Risk Ratio (M‐H, Fixed, 95% CI) | 4.10 [0.48, 35.10] |
| 5.2 Cholangitis | 1 | 79 | Risk Ratio (M‐H, Fixed, 95% CI) | 3.08 [0.13, 73.27] |
| 5.3 Thrombosis | 1 | 79 | Risk Ratio (M‐H, Fixed, 95% CI) | 1.03 [0.07, 15.83] |
| Outcome or subgroup title | No. of studies | No. of participants | Statistical method | Effect size |
| 1 Low CVP versus control Show forest plot | 2 | Mean Difference (IV, Fixed, 95% CI) | Subtotals only | |
| Analysis 3.1  Comparison 3 Bilirubin (micromol/litre), Outcome 1 Low CVP versus control. | ||||
| 1.1 POD 1 | 2 | 90 | Mean Difference (IV, Fixed, 95% CI) | 0.22 [‐10.31, 10.75] |
| 1.2 POD 3 | 2 | 90 | Mean Difference (IV, Fixed, 95% CI) | 2.02 [‐9.90, 13.94] |
| 1.3 POD 7 | 2 | 90 | Mean Difference (IV, Fixed, 95% CI) | 5.02 [‐5.05, 15.09] |
| Outcome or subgroup title | No. of studies | No. of participants | Statistical method | Effect size |
| 1 Low CVP versus control Show forest plot | 1 | Mean Difference (IV, Fixed, 95% CI) | Subtotals only | |
| Analysis 4.1  Comparison 4 Prothrombin activity, Outcome 1 Low CVP versus control. | ||||
| 1.1 POD 1 | 1 | 40 | Mean Difference (IV, Fixed, 95% CI) | ‐2.0 [‐10.00, 6.00] |
| 1.2 POD 3 | 1 | 40 | Mean Difference (IV, Fixed, 95% CI) | 2.0 [‐5.17, 9.17] |
| 1.3 POD 7 | 1 | 40 | Mean Difference (IV, Fixed, 95% CI) | ‐9.0 [‐33.48, 15.48] |
| 2 Haemodilution with bovine haemoglobin (HBOC‐201) versus haemodilution with hydroxy ethyl starch (HES) Show forest plot | 1 | Mean Difference (IV, Fixed, 95% CI) | Subtotals only | |
| Analysis 4.2 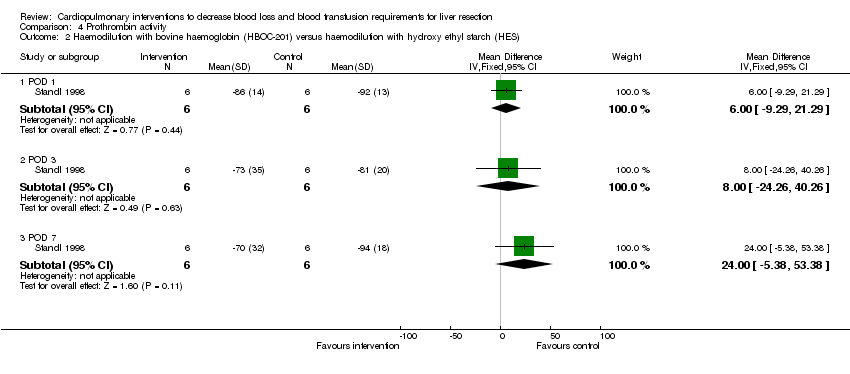 Comparison 4 Prothrombin activity, Outcome 2 Haemodilution with bovine haemoglobin (HBOC‐201) versus haemodilution with hydroxy ethyl starch (HES). | ||||
| 2.1 POD 1 | 1 | 12 | Mean Difference (IV, Fixed, 95% CI) | 6.0 [‐9.29, 21.29] |
| 2.2 POD 3 | 1 | 12 | Mean Difference (IV, Fixed, 95% CI) | 8.0 [‐24.26, 40.26] |
| 2.3 POD 7 | 1 | 12 | Mean Difference (IV, Fixed, 95% CI) | 24.0 [‐5.38, 53.38] |
| Outcome or subgroup title | No. of studies | No. of participants | Statistical method | Effect size |
| 1 Low CVP versus control Show forest plot | 1 | Mean Difference (IV, Fixed, 95% CI) | Subtotals only | |
| Analysis 5.1  Comparison 5 Aspartate transaminase (international units/litre), Outcome 1 Low CVP versus control. | ||||
| 1.1 POD 1 | 1 | 40 | Mean Difference (IV, Fixed, 95% CI) | 50.0 [‐18.40, 118.40] |
| 1.2 POD 3 | 1 | 40 | Mean Difference (IV, Fixed, 95% CI) | 14.0 [‐47.39, 75.39] |
| 1.3 POD 7 | 1 | 40 | Mean Difference (IV, Fixed, 95% CI) | 9.0 [‐15.48, 33.48] |
| 2 Hypoventilation versus control Show forest plot | 1 | Mean Difference (IV, Fixed, 95% CI) | Subtotals only | |
| Analysis 5.2  Comparison 5 Aspartate transaminase (international units/litre), Outcome 2 Hypoventilation versus control. | ||||
| 2.1 POD 1 | 1 | 79 | Mean Difference (IV, Fixed, 95% CI) | ‐5.00 [‐31.26, 17.26] |
| Outcome or subgroup title | No. of studies | No. of participants | Statistical method | Effect size |
| 1 Low CVP versus control Show forest plot | 2 | Mean Difference (IV, Fixed, 95% CI) | Subtotals only | |
| Analysis 6.1 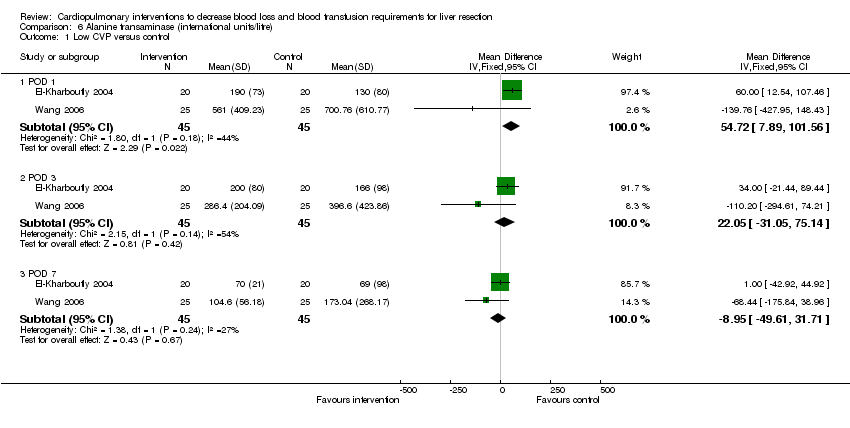 Comparison 6 Alanine transaminase (international units/litre), Outcome 1 Low CVP versus control. | ||||
| 1.1 POD 1 | 2 | 90 | Mean Difference (IV, Fixed, 95% CI) | 54.72 [7.89, 101.56] |
| 1.2 POD 3 | 2 | 90 | Mean Difference (IV, Fixed, 95% CI) | 22.05 [‐31.05, 75.14] |
| 1.3 POD 7 | 2 | 90 | Mean Difference (IV, Fixed, 95% CI) | ‐8.95 [‐49.61, 31.71] |


Methodological quality graph: review authors' judgements about each methodological quality item presented as percentages across all included studies.

Methodological quality summary: review authors' judgements about each methodological quality item for each included study.
Comparison 1 Intervention versus control, Outcome 1 Mortality.
Comparison 1 Intervention versus control, Outcome 3 Number requiring allogeneic blood transfusion.
Comparison 1 Intervention versus control, Outcome 4 Red cell transfusion.
Comparison 1 Intervention versus control, Outcome 5 Fresh frozen plasma.
Comparison 1 Intervention versus control, Outcome 6 Operating time (minutes).
Comparison 1 Intervention versus control, Outcome 7 Hospital stay (days).
Comparison 1 Intervention versus control, Outcome 8 Transection blood loss (ml).
Comparison 1 Intervention versus control, Outcome 9 Operative blood loss (ml).
Comparison 2 Peri‐operative morbidity, Outcome 1 Low CVP versus control.
Comparison 2 Peri‐operative morbidity, Outcome 2 Autologous blood donation versus control.
Comparison 2 Peri‐operative morbidity, Outcome 3 Haemodilution versus control.
Comparison 2 Peri‐operative morbidity, Outcome 4 Haemodilution with bovine haemoglobin (HBOC‐201) versus haemodilution with hydroxy ethyl starch (HES).
Comparison 2 Peri‐operative morbidity, Outcome 5 Hypoventilation versus control.
Comparison 3 Bilirubin (micromol/litre), Outcome 1 Low CVP versus control.
Comparison 4 Prothrombin activity, Outcome 1 Low CVP versus control.
Comparison 4 Prothrombin activity, Outcome 2 Haemodilution with bovine haemoglobin (HBOC‐201) versus haemodilution with hydroxy ethyl starch (HES).
Comparison 5 Aspartate transaminase (international units/litre), Outcome 1 Low CVP versus control.
Comparison 5 Aspartate transaminase (international units/litre), Outcome 2 Hypoventilation versus control.
Comparison 6 Alanine transaminase (international units/litre), Outcome 1 Low CVP versus control.
| Outcome or subgroup title | No. of studies | No. of participants | Statistical method | Effect size |
| 1 Mortality Show forest plot | 8 | Risk Ratio (M‐H, Fixed, 95% CI) | Subtotals only | |
| 1.1 Low CVP versus control | 3 | 177 | Risk Ratio (M‐H, Fixed, 95% CI) | 0.36 [0.02, 8.43] |
| 1.2 Autologous blood donation versus control | 1 | 79 | Risk Ratio (M‐H, Fixed, 95% CI) | 0.0 [0.0, 0.0] |
| 1.3 Haemodilution versus control | 2 | 150 | Risk Ratio (M‐H, Fixed, 95% CI) | 0.35 [0.04, 3.32] |
| 1.4 Haemodilution with controlled hypotension versus control | 1 | 20 | Risk Ratio (M‐H, Fixed, 95% CI) | 0.0 [0.0, 0.0] |
| 1.5 Haemodilution with bovine haemoglobin (HBOC‐201) versus haemodilution with hydroxy ethyl starch (HES) | 1 | 12 | Risk Ratio (M‐H, Fixed, 95% CI) | 3.0 [0.15, 61.74] |
| 1.6 Hypoventilation versus control | 1 | 79 | Risk Ratio (M‐H, Fixed, 95% CI) | 0.0 [0.0, 0.0] |
| 2 Peri‐operative morbidity | Other data | No numeric data | ||
| 2.1 See analysis 2 | Other data | No numeric data | ||
| 3 Number requiring allogeneic blood transfusion Show forest plot | 8 | Risk Ratio (M‐H, Fixed, 95% CI) | Subtotals only | |
| 3.1 Low CVP versus control | 3 | 177 | Risk Ratio (M‐H, Fixed, 95% CI) | 0.66 [0.42, 1.03] |
| 3.2 Autologous blood donation versus control | 1 | 79 | Risk Ratio (M‐H, Fixed, 95% CI) | 0.0 [0.0, 0.0] |
| 3.3 Hemodilution versus control | 3 | 233 | Risk Ratio (M‐H, Fixed, 95% CI) | 0.41 [0.25, 0.66] |
| 3.4 Hemodilution with controlled hypotension versus control | 1 | 20 | Risk Ratio (M‐H, Fixed, 95% CI) | 0.05 [0.00, 0.72] |
| 3.5 Hypoventilation versus control | 1 | 79 | Risk Ratio (M‐H, Fixed, 95% CI) | 0.77 [0.18, 3.22] |
| 4 Red cell transfusion Show forest plot | 6 | Mean Difference (IV, Fixed, 95% CI) | Subtotals only | |
| 4.1 Low CVP versus control | 2 | 135 | Mean Difference (IV, Fixed, 95% CI) | ‐0.00 [‐0.00, 0.00] |
| 4.2 Haemodilution versus control | 2 | 150 | Mean Difference (IV, Fixed, 95% CI) | ‐0.09 [‐0.48, 0.29] |
| 4.3 Haemodilution with controlled hypotension versus control | 1 | 20 | Mean Difference (IV, Fixed, 95% CI) | ‐665.0 [‐818.71, ‐511.29] |
| 4.4 Haemodilution with bovine haemoglobin (HBOC‐201) versus haemodilution with hydroxy ethyl starch (HES) | 1 | 12 | Mean Difference (IV, Fixed, 95% CI) | 167.0 [‐606.55, 940.55] |
| 4.5 Hypoventilation versus control | 1 | 79 | Mean Difference (IV, Fixed, 95% CI) | ‐56.00 [‐155.73, 39.73] |
| 5 Fresh frozen plasma Show forest plot | 1 | Std. Mean Difference (IV, Fixed, 95% CI) | Subtotals only | |
| 5.1 Low CVP versus control | 1 | 50 | Std. Mean Difference (IV, Fixed, 95% CI) | ‐1.22 [‐1.83, ‐0.62] |
| 6 Operating time (minutes) Show forest plot | 5 | Mean Difference (IV, Fixed, 95% CI) | Subtotals only | |
| 6.1 Low CVP versus control | 2 | 90 | Mean Difference (IV, Fixed, 95% CI) | ‐24.69 [‐44.28, ‐5.09] |
| 6.2 Hemodilution versus control | 2 | 208 | Mean Difference (IV, Fixed, 95% CI) | ‐28.86 [‐57.37, ‐0.35] |
| 6.3 Hemodilution with bovine haemoglobin (HBOC‐201) versus hemodilution with hydroxy ethyl starch (HES) | 1 | 12 | Mean Difference (IV, Fixed, 95% CI) | 23.0 [‐83.60, 129.60] |
| 7 Hospital stay (days) Show forest plot | 4 | Mean Difference (IV, Fixed, 95% CI) | Subtotals only | |
| 7.1 Low CVP versus control | 2 | 135 | Mean Difference (IV, Fixed, 95% CI) | ‐4.53 [‐7.38, ‐1.68] |
| 7.2 Hemodilution versus control | 1 | 130 | Mean Difference (IV, Fixed, 95% CI) | 0.0 [‐2.66, 2.66] |
| 7.3 Haemodilution with bovine haemoglobin (HBOC‐201) versus hemodilution with hydroxy ethyl starch (HES) | 1 | 12 | Mean Difference (IV, Fixed, 95% CI) | 2.30 [‐7.52, 12.12] |
| 8 Transection blood loss (ml) Show forest plot | 4 | Mean Difference (IV, Fixed, 95% CI) | Subtotals only | |
| 8.1 Low CVP versus control | 2 | 135 | Mean Difference (IV, Fixed, 95% CI) | ‐81.71 [‐219.79, 56.37] |
| 8.2 Autologous blood donation versus control | 1 | 79 | Mean Difference (IV, Fixed, 95% CI) | ‐90.0 [‐171.60, ‐8.40] |
| 8.3 Hypoventilation versus control | 1 | 79 | Mean Difference (IV, Fixed, 95% CI) | 95.0 [‐186.40, 376.40] |
| 9 Operative blood loss (ml) Show forest plot | 7 | Mean Difference (IV, Fixed, 95% CI) | Subtotals only | |
| 9.1 Low CVP versus control | 3 | 175 | Mean Difference (IV, Fixed, 95% CI) | ‐419.35 [‐575.06, ‐263.63] |
| 9.2 Autologous blood donation versus control | 1 | 79 | Mean Difference (IV, Fixed, 95% CI) | ‐37.0 [‐100.51, 26.51] |
| 9.3 Hemodilution versus control | 2 | 98 | Mean Difference (IV, Fixed, 95% CI) | 1.53 [‐102.37, 105.44] |
| 9.4 Hemodilution with controlled hypotension versus control | 1 | 20 | Mean Difference (IV, Fixed, 95% CI) | ‐245.00 [‐357.80, ‐136.20] |
| 9.5 Hemodilution with bovine haemoglobin (HBOC‐201) versus haemodilution with hydroxy ethyl starch (HES) | 1 | 12 | Mean Difference (IV, Fixed, 95% CI) | 370.0 [‐1103.59, 1843.59] |
| 10 Bilirubin (micromol/litre) | Other data | No numeric data | ||
| 10.1 See analysis 3 | Other data | No numeric data | ||
| 11 Prothrombin activity | Other data | No numeric data | ||
| 11.1 See analysis 4 | Other data | No numeric data | ||
| 12 AST (IU/L) | Other data | No numeric data | ||
| 12.1 See analysis 5 | Other data | No numeric data | ||
| 13 ALT (IU/L) | Other data | No numeric data | ||
| 13.1 See analysis 6 | Other data | No numeric data | ||
| Outcome or subgroup title | No. of studies | No. of participants | Statistical method | Effect size |
| 1 Low CVP versus control Show forest plot | 2 | Risk Ratio (M‐H, Fixed, 95% CI) | Subtotals only | |
| 1.1 All peri‐operative morbidities | 2 | 90 | Risk Ratio (M‐H, Fixed, 95% CI) | 0.62 [0.28, 1.34] |
| 1.2 Intra‐abdominal collections | 1 | 40 | Risk Ratio (M‐H, Fixed, 95% CI) | 0.67 [0.12, 3.57] |
| 1.3 Upper gastro‐intestinal bleed | 1 | 40 | Risk Ratio (M‐H, Fixed, 95% CI) | 0.2 [0.01, 3.92] |
| 1.4 Wound infection | 1 | 40 | Risk Ratio (M‐H, Fixed, 95% CI) | 1.0 [0.07, 14.90] |
| 2 Autologous blood donation versus control Show forest plot | 1 | Risk Ratio (M‐H, Fixed, 95% CI) | Subtotals only | |
| 2.1 Bile leak | 1 | 79 | Risk Ratio (M‐H, Fixed, 95% CI) | 0.33 [0.01, 7.75] |
| 2.2 Intra‐abdominal bleeding | 1 | 79 | Risk Ratio (M‐H, Fixed, 95% CI) | 0.33 [0.01, 7.75] |
| 3 Haemodilution versus control Show forest plot | 2 | Risk Ratio (M‐H, Fixed, 95% CI) | Subtotals only | |
| 3.1 Bile leak | 1 | 78 | Risk Ratio (M‐H, Fixed, 95% CI) | 1.5 [0.27, 8.49] |
| 3.2 Intra‐abdominal bleeding | 2 | 208 | Risk Ratio (M‐H, Fixed, 95% CI) | 1.87 [0.40, 8.67] |
| 3.3 Intra‐abdominal infection | 1 | 78 | Risk Ratio (M‐H, Fixed, 95% CI) | 0.33 [0.04, 3.07] |
| 3.4 Intra‐abdominal collection requiring drainage | 1 | 130 | Risk Ratio (M‐H, Fixed, 95% CI) | 1.26 [0.61, 2.60] |
| 3.5 Wound infection | 2 | 208 | Risk Ratio (M‐H, Fixed, 95% CI) | 0.84 [0.34, 2.03] |
| 3.6 Chest infection | 1 | 78 | Risk Ratio (M‐H, Fixed, 95% CI) | 1.5 [0.27, 8.49] |
| 4 Haemodilution with bovine haemoglobin (HBOC‐201) versus haemodilution with hydroxy ethyl starch (HES) Show forest plot | 1 | Risk Ratio (M‐H, Fixed, 95% CI) | Subtotals only | |
| 4.1 Liver failure | 1 | 12 | Risk Ratio (M‐H, Fixed, 95% CI) | 3.0 [0.15, 61.74] |
| 4.2 Re‐operation | 1 | 12 | Risk Ratio (M‐H, Fixed, 95% CI) | 0.33 [0.02, 6.86] |
| 4.3 Hyperamylasemia | 1 | 12 | Risk Ratio (M‐H, Fixed, 95% CI) | 3.0 [0.15, 61.74] |
| 4.4 Atelectasis | 1 | 12 | Risk Ratio (M‐H, Fixed, 95% CI) | 3.0 [0.15, 61.74] |
| 5 Hypoventilation versus control Show forest plot | 1 | Risk Ratio (M‐H, Fixed, 95% CI) | Subtotals only | |
| 5.1 Bile leak | 1 | 79 | Risk Ratio (M‐H, Fixed, 95% CI) | 4.10 [0.48, 35.10] |
| 5.2 Cholangitis | 1 | 79 | Risk Ratio (M‐H, Fixed, 95% CI) | 3.08 [0.13, 73.27] |
| 5.3 Thrombosis | 1 | 79 | Risk Ratio (M‐H, Fixed, 95% CI) | 1.03 [0.07, 15.83] |
| Outcome or subgroup title | No. of studies | No. of participants | Statistical method | Effect size |
| 1 Low CVP versus control Show forest plot | 2 | Mean Difference (IV, Fixed, 95% CI) | Subtotals only | |
| 1.1 POD 1 | 2 | 90 | Mean Difference (IV, Fixed, 95% CI) | 0.22 [‐10.31, 10.75] |
| 1.2 POD 3 | 2 | 90 | Mean Difference (IV, Fixed, 95% CI) | 2.02 [‐9.90, 13.94] |
| 1.3 POD 7 | 2 | 90 | Mean Difference (IV, Fixed, 95% CI) | 5.02 [‐5.05, 15.09] |
| Outcome or subgroup title | No. of studies | No. of participants | Statistical method | Effect size |
| 1 Low CVP versus control Show forest plot | 1 | Mean Difference (IV, Fixed, 95% CI) | Subtotals only | |
| 1.1 POD 1 | 1 | 40 | Mean Difference (IV, Fixed, 95% CI) | ‐2.0 [‐10.00, 6.00] |
| 1.2 POD 3 | 1 | 40 | Mean Difference (IV, Fixed, 95% CI) | 2.0 [‐5.17, 9.17] |
| 1.3 POD 7 | 1 | 40 | Mean Difference (IV, Fixed, 95% CI) | ‐9.0 [‐33.48, 15.48] |
| 2 Haemodilution with bovine haemoglobin (HBOC‐201) versus haemodilution with hydroxy ethyl starch (HES) Show forest plot | 1 | Mean Difference (IV, Fixed, 95% CI) | Subtotals only | |
| 2.1 POD 1 | 1 | 12 | Mean Difference (IV, Fixed, 95% CI) | 6.0 [‐9.29, 21.29] |
| 2.2 POD 3 | 1 | 12 | Mean Difference (IV, Fixed, 95% CI) | 8.0 [‐24.26, 40.26] |
| 2.3 POD 7 | 1 | 12 | Mean Difference (IV, Fixed, 95% CI) | 24.0 [‐5.38, 53.38] |
| Outcome or subgroup title | No. of studies | No. of participants | Statistical method | Effect size |
| 1 Low CVP versus control Show forest plot | 1 | Mean Difference (IV, Fixed, 95% CI) | Subtotals only | |
| 1.1 POD 1 | 1 | 40 | Mean Difference (IV, Fixed, 95% CI) | 50.0 [‐18.40, 118.40] |
| 1.2 POD 3 | 1 | 40 | Mean Difference (IV, Fixed, 95% CI) | 14.0 [‐47.39, 75.39] |
| 1.3 POD 7 | 1 | 40 | Mean Difference (IV, Fixed, 95% CI) | 9.0 [‐15.48, 33.48] |
| 2 Hypoventilation versus control Show forest plot | 1 | Mean Difference (IV, Fixed, 95% CI) | Subtotals only | |
| 2.1 POD 1 | 1 | 79 | Mean Difference (IV, Fixed, 95% CI) | ‐5.00 [‐31.26, 17.26] |
| Outcome or subgroup title | No. of studies | No. of participants | Statistical method | Effect size |
| 1 Low CVP versus control Show forest plot | 2 | Mean Difference (IV, Fixed, 95% CI) | Subtotals only | |
| 1.1 POD 1 | 2 | 90 | Mean Difference (IV, Fixed, 95% CI) | 54.72 [7.89, 101.56] |
| 1.2 POD 3 | 2 | 90 | Mean Difference (IV, Fixed, 95% CI) | 22.05 [‐31.05, 75.14] |
| 1.3 POD 7 | 2 | 90 | Mean Difference (IV, Fixed, 95% CI) | ‐8.95 [‐49.61, 31.71] |