Vitamin D supplementation for cystic fibrosis
Referencias
References to studies included in this review
References to studies excluded from this review
References to studies awaiting assessment
Additional references
Characteristics of studies
Characteristics of included studies [ordered by study ID]
| Methods | Randomised, parallel, double‐blind, placebo‐controlled trial. | |
| Participants | 54 (31 male, 23 female) pancreatic insufficient children and young adults with CF. Age range 8 ‐18 years (mean age 12.1 (SD 3.1) years), mean (SD) BMI 18.1 (2.9) kg/m2, mean (SD) FEV1 80 (20) % predicted, range 36 ‐ 129%. Numbers in intervention and control groups not stated. 31 (18 male, 13 female) healthy sibling or community controls mean age 11.7 (2.9) years were recruited to assess BMD normative data. | |
| Interventions | Participants randomised to 2 years supplementation with oral calcitriol (1,25 (OH)2D 0.25 mcg daily if under 45 kg, 0.5 mcg daily if weight was 45 kg or above) or placebo. All participants continued their usual calcium (500 mg daily) and vitamin D (dose and preparation not specified). | |
| Outcomes | Data only published for baseline/pre‐intervention characteristics and some adverse events. BMD (whole body, lumbar spine, hip and radius; method not specified) measured at baseline, 6, 12 and 24 months. Serum and urine chemistry (including calcium and phosphate), vitamin D and bone markers (not otherwise specified) measured at baseline, 3, 6, 12‐18 and 24 months. Frequency of supplementation related complications. Bone age at baseline, pubertal status and dietary intake recorded. | |
| Funding source | National Institutes for Health, University of North Carolina General Clinical Research Centre, Cystic Fibrosis Foundation. | |
| Exclusions | Corticosteroid use over 5 mg/day for 3 months, organ transplantation, nephrolithiasis or severe liver disease. | |
| Study withdrawals and adverse events | 32/54 completed the 2 years of the study period. 2 withdrawals due to persistent hypercalciuria, one each from placebo and intervention group. Nephrolithiasis in 2 (1 on calcitriol, 1 on placebo) presumed to be withdrawn as this is a specific exclusion in study protocol. In calcitriol group: 1 asymptomatic mild hypercalcaemia. In placebo group: 1 asymptomatic hyperphosphataemia. | |
| Notes | Abstract of poster presented at 19th Annual North American CF Conference 2005. No reply to email requesting further data. No reference to season, latitude or compliance. | |
| Risk of bias | ||
| Bias | Authors' judgement | Support for judgement |
| Random sequence generation (selection bias) | Unclear risk | Randomisation method not reported but states that participants were randomised by gender and age (8‐10, 11‐14,15‐18 yrs) to stratify for pubertal status. Healthy siblings and community subjects recruited to assess normative BMD data. |
| Allocation concealment (selection bias) | Unclear risk | No method reported. |
| Blinding (performance bias and detection bias) | Unclear risk | No method reported. |
| Incomplete outcome data (attrition bias) | Unclear risk | Baseline/pre‐intervention data only. Numbers in each group not reported. 32/54 reported to complete study; only 4 withdrawals accounted for. |
| Selective reporting (reporting bias) | Low risk | All outcomes are recorded. |
| Other bias | Unclear risk | Follow up data not published. No description of CF diagnosis method. No reports of compliance with enzyme replacement or study medications. No season or latitude specified. |
| Methods | Parallel, randomised, double‐blind, placebo‐controlled study over 12 months. Single centre (Manchester adult CF unit). | |
| Participants | 31 pancreatic‐insufficient and osteopenic adults (over 18 years) with CF (confirmation of CF diagnosis by genetic testing). 16 in intervention group (9 female, 7 males). Mean age 29.4 years; mean FEV1 66.1% predicted; mean BMI 23.0kg/m2). 15 in control group (7 females, 8 males) Mean age 25.9 years; mean FEV1 60.9% ; mean BMI 21.1kg/m2. | |
| Interventions | Supplementation with 1g calcium and 800 IU vitamin D daily (Calichew D3 forte 1 tablet twice daily) or placebo for 12 months. All participants continued standard daily vitamin D supplements (900 IU). | |
| Outcomes | Outcomes measured at baseline and after 12 months. BMD (DXA lumbar spine and total hip, peripheral CT distal forearm) | |
| Funding source | UK Cystic Fibrosis Trust. | |
| Exclusions | No exclusion criteria reported. | |
| Study withdrawals and adverse events | 1 withdrawal (female) from vitamin D supplementation group due to pregnancy. No adverse events reported. | |
| Notes | 8 participants in each intervention had corticosteroids during study period, but dose not reported. Compliance ‐ treatment group 3.1 days/week, controls 3.7 days/week. Prof Howarth was contacted and replied but was unable to provide any unpublished data | |
| Risk of bias | ||
| Bias | Authors' judgement | Support for judgement |
| Random sequence generation (selection bias) | Unclear risk | No details of randomisation. |
| Allocation concealment (selection bias) | Unclear risk | No description of allocation concealment. |
| Blinding (performance bias and detection bias) | Unclear risk | Method notes double blinding although no details of blinding or method used. |
| Incomplete outcome data (attrition bias) | Low risk | 1 study withdrawal due to pregnancy in intervention group, although this wasn't a specified exclusion criteria. Thus good follow‐up rate (97%). All others enrolled completed study period. |
| Selective reporting (reporting bias) | Low risk | All defined outcomes are reported. |
| Other bias | Unclear risk | All subjects were participants of a longitudinal BMD study preceding this study. Only 31/55 eligible participants enrolled, no specifics given for those who declined to participate. |
| Methods | Double‐blind, randomised, cross‐over study. | |
| Participants | 22 children with CF (mean 9.3 years, range 6.1 ‐ 12.2 years). No disease status indicators reported ‐ authors comment that all were "mildly affected". | |
| Interventions | Supplementation with 1g calcium, 1600 IU vitamin D, 1g calcium and 1600 IU vitamin D and placebo each for 6 months with a 3‐month washout period between interventions. | |
| Outcomes | Outcomes reported at baseline and at 9 months (after 6 months of intervention and 3 month washout period): BMD (lumbar spine, femoral neck, distal radius and whole body; method not described). Outcomes reported at baseline and at 6 months of supplementation: serum and urine chemistry, 25‐OHD, 1,25‐(OH)2D, PTH, bone turnover markers (osteocalcin, bone specific alkaline phosphatase). | |
| Funding source | None declared. | |
| Exclusions | None reported. | |
| Study withdrawals and adverse events | No withdrawals and no adverse events reported. | |
| Notes | Abstract of poster presented at 12th annual North American CF conference. No inclusion criteria, no numbers of eligible participants stated. No reporting of method of CF diagnosis, rates of pancreatic insufficiency, nutrition or growth parameters. Abstract was more than 10 years ago and a search using authors' name did not reveal full publication. We could not find authors and hence not contacted. | |
| Risk of bias | ||
| Bias | Authors' judgement | Support for judgement |
| Random sequence generation (selection bias) | Unclear risk | No description given. |
| Allocation concealment (selection bias) | Unclear risk | No description given. |
| Blinding (performance bias and detection bias) | Unclear risk | No information given. |
| Incomplete outcome data (attrition bias) | Unclear risk | All data in methods are reported; no reporting of number of children enrolled or eligible. |
| Selective reporting (reporting bias) | High risk | Data after only 9 months of a 36‐month study. |
| Other bias | Unclear risk | No funding source identified. No reporting of disease severity or respiratory/other confounding illnesses or nutritional status. |
BMD: bone mineral density
BMI: body mass index
CF: cystic fibrosis
CT: computerised tomography
DXA: dual energy X‐ray absorptiometry
FEV1: forced expiratory volume at one second
g: gram
IU: international units
PTH: parathyroid hormone
SD: standard deviation
25 (OH) D: 25‐hydroxyvitamin D
1,25(OH)2D: 1,25‐dihydroxyvitamin D
Characteristics of excluded studies [ordered by study ID]
| Study | Reason for exclusion |
| Intervention (pamidronate, a bisphosphonate) does not meet review inclusion criteria | |
| Intervention (Ultraviolet B radiation) does not meet review inclusion criteria |
Characteristics of studies awaiting assessment [ordered by study ID]
| Methods | Double‐blinded randomized cross‐over trial with 4 arms. Single centre in USA. |
| Participants | 15 children aged 7 to 13, remained on standard medication (including pancreatic enzymes and ADEK vitamins). Children on oral or glucocorticoids were excluded. |
| Interventions | 4x 6 month treatments (including placebo) with 3‐month washout period between each. Placebo vs calcium (1g) vs vitamin D (1,600 IU) vs calcium (1g) plus vitamin D (1,600 IU) |
| Outcomes | Blood and urine collected at beginning and end of each treatment. DXA performed at baseline, the beginning of each period and at 36 months (9 months between DXA ‐ 6 month treatment plus washout). Calcium absorption at end of each period. Also, serum calcium, phosphorus, magnesium, parathyroid hormone, 25‐hydroxyvitamin D, 1,25‐dihydroxyvitamin D, osteocalcin, bone alkaline phosphatase, tartrate resistant acid phosphatase, urine calcium/creatinine ratio. |
| Notes |
| Methods | Randomized (in blocks of 6) cross‐over trial with 3 arms. Single centre in USA |
| Participants | 30 adults (16 ‐ 70 years old) with CF and with screening 25‐hydroxyvitamin D levels between 10 nd 40 ng/ml randomized; 18 completed trial. Exclusion criteria: renal or hepatic disease, history of skin cancer, treatment with more than 2000 IU of vitamin D or prednisone or a history of more than 6 hospitalizations in past year. |
| Interventions | Treatment 1: cholecalciferol 50,000 IU once a week for 12 weeks Treatment 2: ergocalciferol 50,000 IU once a week for 12 weeks Treatment 3: UV light therapy given for 3 ‐ 10 mins 5 times per week for 12 weeks |
| Outcomes | |
| Notes |
| Methods | Randomised (in blocks of 6) to intervention or placebo |
| Participants | 30 adults (age over 18 years old) with CF and hospitalised with acute respiratory exacerbation |
| Interventions | 250,000 IU vitamin D3 or placebo as single dose within 48 hours of hospital admission Exclusion criteria: current therapy with high dose vitamin D (over 2000 IU daily) or admission for serious terminal illness |
| Outcomes | Blood collected for 25‐hydroxyvitamin D level at randomization and hospital discharge, results reported for the first 12 of 30 enrolled participants |
| Notes | Abstract only. Trial completed, paper submitted for editorial review and consideration of publication |
CF: cystic fibrosis
IU: international units
UV: ultra‐violet
vs: versus
Data and analyses
| Outcome or subgroup title | No. of studies | No. of participants | Statistical method | Effect size |
| 1 Serum calcium change (mmol/L) Show forest plot | 1 | Mean Difference (Fixed, 95% CI) | Totals not selected | |
| Analysis 1.1  Comparison 1 Vitamin D versus placebo, Outcome 1 Serum calcium change (mmol/L). | ||||
| 2 Vitamin D level (25‐OHD) pg/ml Show forest plot | 2 | Mean Difference (IV, Fixed, 95% CI) | Subtotals only | |
| Analysis 1.2  Comparison 1 Vitamin D versus placebo, Outcome 2 Vitamin D level (25‐OHD) pg/ml. | ||||
| 2.1 Up to 12 months | 2 | 41 | Mean Difference (IV, Fixed, 95% CI) | ‐2.79 [‐7.25, 1.67] |
| 3 Vitamin D level (1, 25 (OH)2 D) pg/ml Show forest plot | 1 | Mean Difference (IV, Fixed, 95% CI) | Totals not selected | |
| Analysis 1.3  Comparison 1 Vitamin D versus placebo, Outcome 3 Vitamin D level (1, 25 (OH)2 D) pg/ml. | ||||
| 3.1 Up to 12 months | 1 | Mean Difference (IV, Fixed, 95% CI) | 0.0 [0.0, 0.0] | |
| 4 Parathyroid hormone levels (change from baseline) Show forest plot | 1 | Mean Difference (Fixed, 95% CI) | Totals not selected | |
| Analysis 1.4  Comparison 1 Vitamin D versus placebo, Outcome 4 Parathyroid hormone levels (change from baseline). | ||||
| 5 Parathyroid hormone levels (pg/ml) (absolute) Show forest plot | 1 | Mean Difference (IV, Fixed, 95% CI) | Totals not selected | |
| Analysis 1.5  Comparison 1 Vitamin D versus placebo, Outcome 5 Parathyroid hormone levels (pg/ml) (absolute). | ||||
| 5.1 Up to 12 months | 1 | Mean Difference (IV, Fixed, 95% CI) | 0.0 [0.0, 0.0] | |
| Outcome or subgroup title | No. of studies | No. of participants | Statistical method | Effect size |
| 1 Whole body bone mineral content (% change) Show forest plot | 1 | Mean Difference (IV, Fixed, 95% CI) | Totals not selected | |
| Analysis 2.1  Comparison 2 Post‐hoc analysis: Bone mineral density, Outcome 1 Whole body bone mineral content (% change). | ||||
| 1.1 Up to 12 months | 1 | Mean Difference (IV, Fixed, 95% CI) | 0.0 [0.0, 0.0] | |
| 2 Lumbar spine z score Show forest plot | 1 | Mean Difference (IV, Fixed, 95% CI) | Totals not selected | |
| Analysis 2.2  Comparison 2 Post‐hoc analysis: Bone mineral density, Outcome 2 Lumbar spine z score. | ||||
| 2.1 Up to 12 months | 1 | Mean Difference (IV, Fixed, 95% CI) | 0.0 [0.0, 0.0] | |
| 3 Lumbar spine bone mineral density (% change) Show forest plot | 1 | Mean Difference (Fixed, 95% CI) | Totals not selected | |
| Analysis 2.3  Comparison 2 Post‐hoc analysis: Bone mineral density, Outcome 3 Lumbar spine bone mineral density (% change). | ||||
| 3.1 Up to 12 months | 1 | Mean Difference (Fixed, 95% CI) | 0.0 [0.0, 0.0] | |
| 4 Hip bone mineral density (% change) Show forest plot | 1 | Mean Difference (Fixed, 95% CI) | Totals not selected | |
| Analysis 2.4  Comparison 2 Post‐hoc analysis: Bone mineral density, Outcome 4 Hip bone mineral density (% change). | ||||
| 5 Distal forearm bone mineral density (% change) Show forest plot | 1 | Mean Difference (Fixed, 95% CI) | Totals not selected | |
| Analysis 2.5  Comparison 2 Post‐hoc analysis: Bone mineral density, Outcome 5 Distal forearm bone mineral density (% change). | ||||

Comparison 1 Vitamin D versus placebo, Outcome 1 Serum calcium change (mmol/L).

Comparison 1 Vitamin D versus placebo, Outcome 2 Vitamin D level (25‐OHD) pg/ml.
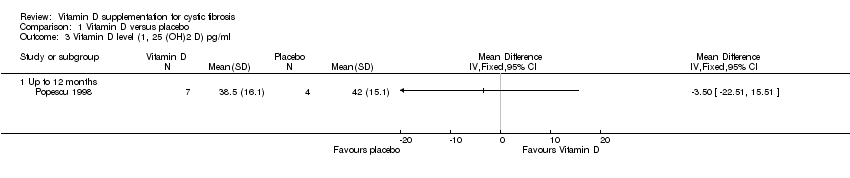
Comparison 1 Vitamin D versus placebo, Outcome 3 Vitamin D level (1, 25 (OH)2 D) pg/ml.
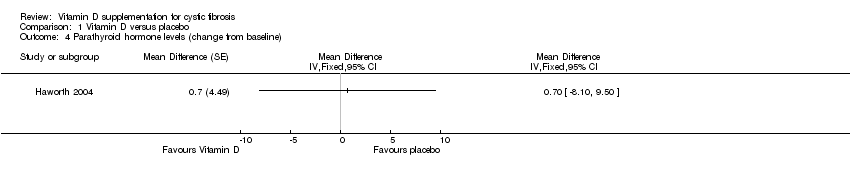
Comparison 1 Vitamin D versus placebo, Outcome 4 Parathyroid hormone levels (change from baseline).
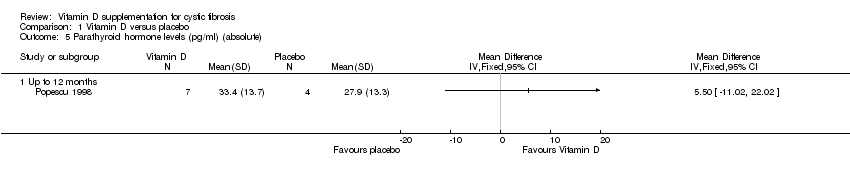
Comparison 1 Vitamin D versus placebo, Outcome 5 Parathyroid hormone levels (pg/ml) (absolute).
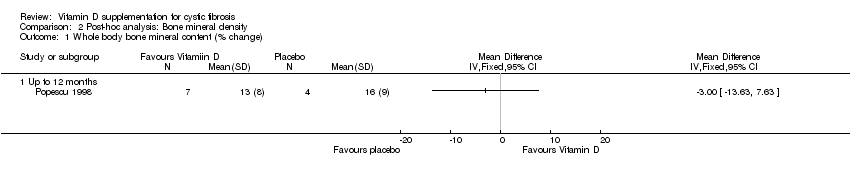
Comparison 2 Post‐hoc analysis: Bone mineral density, Outcome 1 Whole body bone mineral content (% change).

Comparison 2 Post‐hoc analysis: Bone mineral density, Outcome 2 Lumbar spine z score.

Comparison 2 Post‐hoc analysis: Bone mineral density, Outcome 3 Lumbar spine bone mineral density (% change).

Comparison 2 Post‐hoc analysis: Bone mineral density, Outcome 4 Hip bone mineral density (% change).
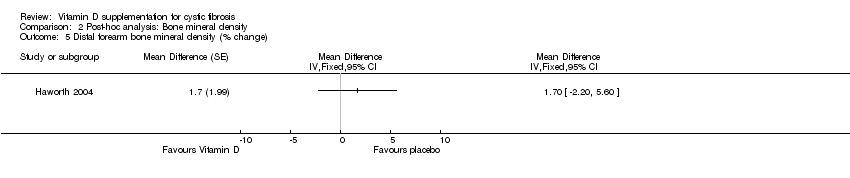
Comparison 2 Post‐hoc analysis: Bone mineral density, Outcome 5 Distal forearm bone mineral density (% change).
| Outcome or subgroup title | No. of studies | No. of participants | Statistical method | Effect size |
| 1 Serum calcium change (mmol/L) Show forest plot | 1 | Mean Difference (Fixed, 95% CI) | Totals not selected | |
| 2 Vitamin D level (25‐OHD) pg/ml Show forest plot | 2 | Mean Difference (IV, Fixed, 95% CI) | Subtotals only | |
| 2.1 Up to 12 months | 2 | 41 | Mean Difference (IV, Fixed, 95% CI) | ‐2.79 [‐7.25, 1.67] |
| 3 Vitamin D level (1, 25 (OH)2 D) pg/ml Show forest plot | 1 | Mean Difference (IV, Fixed, 95% CI) | Totals not selected | |
| 3.1 Up to 12 months | 1 | Mean Difference (IV, Fixed, 95% CI) | 0.0 [0.0, 0.0] | |
| 4 Parathyroid hormone levels (change from baseline) Show forest plot | 1 | Mean Difference (Fixed, 95% CI) | Totals not selected | |
| 5 Parathyroid hormone levels (pg/ml) (absolute) Show forest plot | 1 | Mean Difference (IV, Fixed, 95% CI) | Totals not selected | |
| 5.1 Up to 12 months | 1 | Mean Difference (IV, Fixed, 95% CI) | 0.0 [0.0, 0.0] | |
| Outcome or subgroup title | No. of studies | No. of participants | Statistical method | Effect size |
| 1 Whole body bone mineral content (% change) Show forest plot | 1 | Mean Difference (IV, Fixed, 95% CI) | Totals not selected | |
| 1.1 Up to 12 months | 1 | Mean Difference (IV, Fixed, 95% CI) | 0.0 [0.0, 0.0] | |
| 2 Lumbar spine z score Show forest plot | 1 | Mean Difference (IV, Fixed, 95% CI) | Totals not selected | |
| 2.1 Up to 12 months | 1 | Mean Difference (IV, Fixed, 95% CI) | 0.0 [0.0, 0.0] | |
| 3 Lumbar spine bone mineral density (% change) Show forest plot | 1 | Mean Difference (Fixed, 95% CI) | Totals not selected | |
| 3.1 Up to 12 months | 1 | Mean Difference (Fixed, 95% CI) | 0.0 [0.0, 0.0] | |
| 4 Hip bone mineral density (% change) Show forest plot | 1 | Mean Difference (Fixed, 95% CI) | Totals not selected | |
| 5 Distal forearm bone mineral density (% change) Show forest plot | 1 | Mean Difference (Fixed, 95% CI) | Totals not selected | |