Quimioterapia profiláctica para la mola hidatidiforme para la prevención de la neoplasia trofoblástica gestacional
Resumen
Antecedentes
Ésta es una actualización de la revisión original Cochrane publicada en The Cochrane Library, Número 10, 2012.
La mola hidatidiforme (MH), también llamada embarazo molar, se caracteriza por un crecimiento exagerado del tejido coriónico fetal dentro del útero. Las MH pueden ser parciales (MP) o completas (MC) según su apariencia a simple vista, la histopatología y el cariotipo. Generalmente las MP tienen un cariotipo triploide con un origen materno y paterno, mientras que las MC son diploides y su origen es solo paterno. La mayoría de las pacientes con MH se pueden curar mediante la evacuación de los productos de la concepción retenidos (EPCR), sin que se afecte la fertilidad. Sin embargo, en algunas embarazadas el crecimiento persiste y se convierte en neoplasia trofoblástica gestacional (NTG), una forma maligna de la enfermedad que requiere tratamiento con quimioterapia. Las MC tienen una tasa mayor de transformación maligna que las MP. Puede ser posible reducir el riesgo de NTG en las pacientes con MH mediante la administración de quimioterapia profiláctica (QP). Sin embargo, la QP administrada antes o después de la evacuación de la MH para prevenir las secuelas malignas aún es polémica, ya que los riesgos y los efectos beneficiosos de esta práctica son inciertos.
Objetivos
Evaluar la efectividad y la seguridad de la QP para prevenir la NTG en pacientes con un embarazo molar. Investigar si algún subgrupo de pacientes con MH puede obtener más efectos beneficiosos con la QP en comparación con otros.
Métodos de búsqueda
Se realizaron búsquedas electrónicas en el Registro especializado del Grupo Cochrane de Cáncer Ginecológico, el Registro Cochrane Central de Ensayos Controlados (CENTRAL, número 2, 2012), MEDLINE (1946 hasta febrero 2012, semana 4) y EMBASE (1980 hasta 2012, semana 9). La estrategia de búsqueda se desarrolló mediante texto libre y MeSH. Para esta actualización se realizaron búsquedas en el Registro Cochrane Central de Ensayos Controlados (CENTRAL, número 5, 2017), MEDLINE (febrero 2012 hasta junio, semana 1, 2017) y Embase (febrero 2012 hasta 2017, semana 23). También se realizaron búsquedas manuales en las listas de referencias de la literatura pertinente para identificar estudios adicionales y se realizaron búsquedas en los registros de ensayos.
Criterios de selección
Se incluyeron ensayos controlados aleatorizados (ECA) de QP para la MH.
Obtención y análisis de los datos
Dos autores de la revisión de forma independiente evaluaron los estudios para su inclusión en la revisión y extrajeron los datos mediante un formulario de obtención de datos específicamente diseñado. Los metanálisis se realizaron mediante el agrupamiento de los datos de los ensayos individuales con el programa informático Review Manager 5 (RevMan 5), según los procedimientos metodológicos estándar esperados por la metodología Cochrane.
Resultados principales
Las búsquedas identificaron 161 registros; después de eliminar los duplicados y examinar los títulos y resúmenes se recuperaron 90 artículos de texto completo. De éstos, se incluyeron tres ECA con un total combinado de 613 participantes. Un estudio comparó dactinomicina profiláctica con ninguna profilaxis (60 participantes); los otros dos estudios compararon metotrexato profiláctico con ninguna profilaxis (420 y 133 participantes). A todas las participantes se les había diagnosticado MC. Los dos últimos estudios se consideraron de calidad metodológica baja.
La QP redujo el riesgo de NTG en las pacientes después de una MC (tres estudios, 550 participantes; riesgo relativo [RR] 0,37; intervalo de confianza [IC] del 95%: 0,24 a 0,57; I² = 0%; p < 0,00001; evidencia de calidad baja). Sin embargo, debido a la calidad deficiente (riesgo de sesgo alto) de dos de los estudios incluidos, se realizaron análisis de sensibilidad con la exclusión de estos dos estudios. Lo anterior dejó solo un estudio pequeño de pacientes de riesgo alto para aportar datos a este resultado primario (59 participantes; RR 0,28; IC del 95%: 0,10 a 0,73; p = 0,01); por lo que la evidencia se consideró de calidad baja.
El tiempo hasta el diagnóstico fue mayor en el grupo de QP que en el grupo control (dos estudios, 33 participantes; diferencia de medias [DM] 28,72; IC del 95%: 13,19 a 44,24; p = 0,0003; evidencia de calidad baja); y el grupo de QP requirió más ciclos para curar la NTG posterior (un estudio de calidad baja, 14 participantes; DM 1,10; IC del 95%: 0,52 a 1,68; p = 0,0002; evidencia de calidad muy baja).
No hubo datos suficientes para realizar metanálisis para la toxicidad, la supervivencia general, la farmacorresistencia y los resultados reproductivos.
Conclusiones de los autores
La QP puede reducir el riesgo de progresión a NTG en las mujeres con MC que presentan un riesgo alto de transformación maligna; sin embargo, la evidencia actual a favor de la QP está limitada por la calidad metodológica deficiente y el tamaño pequeño de los estudios incluidos. Como la QP puede aumentar la farmacorresistencia, retrasar el tratamiento de la NTG y exponer innecesariamente a las pacientes a los efectos secundarios tóxicos, no es posible recomendar esta práctica en la actualidad.
PICO
Resumen en términos sencillos
Quimioterapia profiláctica (preventiva) para la mola hidatidiforme (embarazo molar) para prevenir el crecimiento canceroso posterior
Antecedentes
Un embarazo molar (mola hidatidiforme) se desarrolla después de un proceso anormal de la concepción mediante el cual el tejido placentario crece exageradamente dentro de la matriz (útero). Los embarazos molares se clasifican como completos (MC) o parciales (MP) según su apariencia (a simple vista y microscópica), y su patrón cromosómico. Cuando aparecen, en general se sospechan durante la exploración temprana del embarazo, y las pacientes a menudo consultan por un sangrado similar a un aborto espontáneo. El tejido molar se extrae mediante la evacuación de los productos de la concepción retenidos (EPCR), también conocida como dilatación y curetaje (D&C), y generalmente las pacientes se recuperan completamente. Sin embargo, algunas mujeres desarrollan cáncer en la matriz (cerca de una de cada cinco mujeres con una MC y una en 200 con una MP). Generalmente las pacientes tienen un riesgo mayor de presentar este cáncer, que se conoce como neoplasia trofoblástica gestacional (NTG), si tienen más de 40 años de edad, presentan un gran aumento del tamaño de la matriz, tienen quistes grandes en los ovarios o tienen niveles iniciales altos de β‐gonadotrofina coriónica humana (hCG) (la hormona del embarazo) en la sangre. Aunque el tratamiento del cáncer con quimioterapia (fármacos anticancerosos) casi siempre es efectivo, se ha indicado que la administración habitual de fármacos anticancerosos (QP) a las pacientes antes o después de la extracción el tejido molar puede reducir el riesgo de desarrollar tejido canceroso.
Objetivo de la revisión
Con esta revisión, se intentó evaluar los efectos beneficiosos y los riesgos de administrar fármacos anticancerosos (quimioterapéuticos, QP) a las pacientes con embarazos molares, antes o después de la EPCR.
¿Cuáles son los principales hallazgos?
Se encontraron tres estudios aleatorizados (ensayos controlados aleatorizados [ECA] en los que las personas se asignan de manera aleatorizada, es decir, solo por azar), con un total de 613 mujeres. Dos estudios probaron metotrexato en todas las pacientes con MC y un estudio probó dactinomicina en pacientes con una MC con alto riesgo de desarrollar una NTG. Los dos estudios de metotrexato son estudios más antiguos que utilizaron métodos de investigación relativamente deficientes, por lo que no es posible confiar en sus resultados. En general, los resultados de la revisión indican que la QP reduce el número de mujeres que desarrollan cáncer después del embarazo molar; sin embargo, este hecho quizás solo sea cierto para las pacientes con molas de alto riesgo (es decir, MC). Además, la QP podría prolongar el tiempo hasta el diagnóstico del cáncer y aumentar el número de tratamientos necesarios para curar la enfermedad. No fue posible evaluar los efectos secundarios a corto y largo plazo de QP en esta revisión porque no se dispuso de datos suficientes; sin embargo, preocupa que los ciclos de cinco y ocho días de QP utilizados por los investigadores en estos estudios sean demasiado tóxicos para ser administrados a las pacientes de forma sistemática.
Calidad de la evidencia
Esta evidencia se considera de calidad baja a muy baja. Esta conclusión se basa en la evaluación de que dos de los estudios incluidos fueron de calidad metodológica deficiente y con un riesgo de sesgo alto; el tercer estudio fue de buena calidad pero solo incluyó 60 participantes.
¿Cuáles son las conclusiones?
Actualmente no hay evidencia suficiente para apoyar la administración de fármacos anticancerosos a las pacientes con embarazos molares. Sin embargo, la NTG casi siempre se cura con la atención moderna y la QP para el embarazo molar solamente reduciría el riesgo de necesitar quimioterapia a gran escala, pero no eliminaría dicho riesgo. Además, no cambiaría la necesidad de monitorización y seguimiento cuidadosos de las pacientes con molas hidatidiformes.
Authors' conclusions
Summary of findings
| Prophylactic chemotherapy compared with no prophylactic chemotherapy for hydatidiform mole | ||||||
| Patient or population: women with a molar pregnancy Settings: inpatient Intervention: methotrexate or dactinomycin Comparison: placebo or no prophylaxis | ||||||
| Outcomes | Illustrative comparative risks* (95% CI) | Relative effect | No of participants | Quality of the evidence | Comments | |
| Assumed risk | Corresponding risk | |||||
| No prophylaxis | P‐Chem | |||||
| Incidence of GTN (including low‐quality studies) | Mixed‐risk population | RR 0.37 (0.24 to 0.57) | 550 women | ⊕⊕⊝⊝ | The NNTB to prevent 1 woman developing GTN after evacuation of HM was 6 (95% CI 5 to 10). We downgraded this evidence because this meta‐analysis included 2 studies that we considered to be of poor methodological quality. | |
| 254 per 1000 | 94 per 1000 (61 to 145) | |||||
| High‐risk population | RR 0.29 (0.14 to 0.60) | 99 women (2 studies) | ⊕⊕⊝⊝ | The NNTB for women with high‐risk HM was 3 (95% CI 2 to 5). We downgraded this evidence because the meta‐analysis included 2 small studies, 1 of which was of a poor methodological quality. | ||
| 490 per 1000 | 142 per 1000 (69 to 294) | |||||
| Incidence of GTN (excluding low‐quality studies) | High‐risk population | RR 0.28 (0.10 to 0.73) | 59 women (1 study) | ⊕⊕⊝⊝ | The NNTB to prevent 1 woman developing GTN after evacuation of high‐risk HM was 3 (95% CI 2 to 20). We downgraded this evidence because only 1 small study (Limpongsanurak 2001) contributed data, giving an imprecise result. | |
| 500 per 1000 | 140 per 1000 (50 to 365) | |||||
| Time to GTN diagnosis (days) | The mean time to GTN diagnosis ranged across control groups from 35.7 days to 59.5 days. | The mean time to GTN diagnosis in the intervention groups was 65.5 days to 81.8 days (higher). | MD 28.72 (13.19 to 44.24) | 33 women | ⊕⊕⊝⊝ | We downgraded this evidence because the meta‐analysis included 1 study of poor methodological quality (Kim 1986). When this study was excluded, the results of the remaining study (Limpongsanurak 2001; 19 women) were: MD 22.30; 95% CI −9.05 to 53.65. |
| Number of courses of chemotherapy to cure | The mean number of courses of chemotherapy required to cure subsequent GTN was 1.4 courses (10 women). | The mean number of courses of chemotherapy required to cure subsequent GTN was 2.5 courses (4 women). | MD 1.10 (0.52 to 1.68) | 14 women | ⊕⊝⊝⊝ | This analysis only included 1 study, and we considered to be of a poor methodological quality (Kim 1986). |
| *The basis for the assumed risk (e.g. the median control group risk across studies) is provided in footnotes. The corresponding risk (and its 95% confidence interval) is based on the assumed risk in the comparison group and the relative effect of the intervention (and its 95% CI). | ||||||
| GRADE Working Group grades of evidence | ||||||
| The assumed risk for the mixed‐risk population was calculated by using the weighted mean risk across the control group for this outcome. The assumed risk for the high‐risk population was based on the control group of Limpongsanurak 2001, which was the only study to evaluate a high‐risk population only. | ||||||
Background
Description of the condition
Gestational trophoblastic disease (GTD) is a spectrum of disease characterised by an autonomous overgrowth of foetal chorionic tissue or trophoblast. Hydatidiform mole (HM) is the most common and benign form of the disease. The prevalence of HM is highest in Asia, with rates ranging from 1 to 2 per 1000 pregnancies in Japan and China (Palmer 1994; Song 1987; Takeuchi 1987), to 12 per 1000 pregnancies in Indonesia, India and Turkey (Aziz 1984; Gül 1997; Steigrad 2003). In North America and Europe the incidence is reported to be lower, at 0.5 to 1 per 1000 pregnancies (Lee 2009; Steigrad 2003). The incidence has been reported to vary with race (Tham 2003), maternal age (Parazzini 1986), parity (Bagshawe 1986), and diet (Berkowitz 1985; Coullin 2015; Parazzini 1988). Variations in prevalence may be because of differences in reporting between hospital‐based and population‐based data or in the availability of central pathology review (Seckl 2010; Smith 2003).
HMs are categorised as partial (PM) or complete moles (CM) based on their gross morphology, histopathology and karyotype. CMs usually occur when a duplicated haploid sperm fertilises an anucleate or 'empty' ovum; the ensuing diploid product (usually 46 XX) is therefore paternally derived (Fisher 2009). PMs are usually triploid (69XXX, 69XXY or 69XYY), with two sets of paternal haploid genes and one set of maternal haploid genes, and occur when two sperm fertilise one ovum (Fisher 2009). With CMs there is no evidence of foetal tissue; however, with PM an embryo or foetus frequently dies in early pregnancy and foetal tissue and blood cells may be identified in 20% and 50% of PM specimens, respectively (Sebire 2009).
HMs usually present with vaginal bleeding. Associated features (including excessive uterine enlargement, theca lutein ovarian cysts, hyperemesis, pre‐eclampsia and hyperthyroidism) are more common in CMs; however, they occur less frequently as the routine use of ultrasound has led to earlier diagnosis (Seckl 2010). The management of PMs and CMs is similar (Berkowitz 2009a; Berkowitz 2009b). For women who want to preserve their fertility, an evacuation of the retained products of conception (ERPC) is performed, ideally by suction curettage, to remove all trophoblastic tissue completely (Seckl 2010). After suction curettage, around 85% of CMs and more than 98% of PMs will resolve without the need for further treatment (Ngan 2012). Most women are cured in this way; however, in some women HM persists and becomes malignant (gestational trophoblastic neoplasia (GTN)), requiring treatment with chemotherapy. In Japan, second ERPCs are performed routinely for HMs within one week of the initial ERPC, to ensure that there is no residual molar tissue in the uterus (Sasaki 2009). Second ERPCs may reduce the risk of GTN; however, to our knowledge, there is currently insufficient evidence to support this routine practice. Hysterectomy may reduce the risk of GTN by up to 10% (Bahar 1989; Curry 1975) and is an option for women who do not wish to retain their fertility or who experience life‐threatening bleeding at the time of evacuation; however, it does not avoid the need for subsequent monitoring or chemotherapy (Tidy 2009).
Transformation to GTN is considered to have occurred when trophoblastic activity remains following evacuation, as shown by a plateau or rise in serial β‐human chorionic gonadotrophin (hCG) levels, raised hCG levels six months after evacuation or if the histopathological examination indicates choriocarcinoma (Kohorn 2009). However, the presence of raised but falling hCG levels six months after evacuation of a molar pregnancy is no longer an absolute indication for chemotherapy: it appears to be safe to continue with active monitoring without detrimental effect (Taylor 2016). The risk of developing GTN is reported to be 16% to 20% in women with CM (Berkowitz 1995; Curry 1975; Felemban 1998; Seckl 2009); and 0.5% to 1% in women with PM (Bagshawe 1990; Seckl 2009). In the UK, this translates to a GTN transformation rate of approximately 8% of all molar pregnancies (Seckl 2009). Thresholds for treating persistent GTD differ by region with, for example, more than twice as many women in the USA (20%) receiving chemotherapy for persistent GTD than in the UK (Hancock 2009).
HMs may be categorised as being at a low or high risk of malignant transformation based on criteria first introduced by Bagshawe 1976 (Table 1; Berkowitz 1987). Women with high‐risk HMs have more than one of the following characteristics: an initial serum β‐hCG more than 100,000 mIU/mL; uterine size larger than gestational age; theca lutein cysts more than 6 cm in diameter; maternal age over 40 years; and other associated medical and epidemiological factors, including previous GTD, hyperthyroidism and trophoblastic embolisation (Berkowitz 1995). Approximately 30% to 50% of high‐risk HMs will progress to GTN (Goldstein 1981; Limpongsanurak 2001; Uberti 2009).
| Prognostic factor | Score | |||
| 0 | 1 | 2 | 3 | |
| U/S diagnosis | Partial | Complete | Recurrent | |
| Uterine size for GA (months) | not more than 1 | > 1 | > 2 | > 3 |
| hCG level (mIU/mL) | < 50,000 | > 50,000 to < 100,000 | > 100,000 to < 1,000,000 | > 1,000,000 |
| Diameter of theca lutein cysts (cm) | ‐ | < 6 | < 6 to < 10 | > 10 |
| Patient age (years) | ‐ | < 20 | ≥ 40 | > 50 |
| Medical complications** | ‐ | ≥ 1 | ‐ | ‐ |
*From Berkowitz 1987
Low risk is defined as a score of < 4; high risk is defined as a score ≥ 4
U/S: ultrasound; GA: gestational age, hCG: β‐human chorionic gonadotrophin.
** hyperemesis, hyperthyroidism, pre‐eclampsia, trophoblastic embolisation, disseminated intravascular coagulation.
GTN, which may also follow a 'normal' pregnancy, an ectopic pregnancy or a miscarriage, is classified as low or high risk using a modified World Health Organization (WHO) scoring system adapted by the International Federation of Gynecology and Obstetrics (FIGO 2009). Low‐risk GTN accounts for 95% of cases in the UK and has a cure rate of almost 100% (Seckl 2010). High‐risk GTN has a cure rate of between 80% and 90%; these lesions require combination chemotherapy regimens and frequently develop drug resistance (Goldstein 2012).
Description of the intervention
Methotrexate was first reported to be active against trophoblastic tissue in the mid‐1950s (Hertz 1956). Since then, GTN has been shown to be a highly chemosensitive disease, with various chemotherapeutic agents achieving good rates of cure. All women with 'low‐risk' GTN and approximately 80% to 90% of women with 'high‐risk' GTN will be cured following treatment with one or more chemotherapy regimens (Seckl 2010; Goldstein 2012). Since chemotherapy drugs are associated with various toxic effects, most commonly myelotoxicity, gastrointestinal toxicity, stomatitis and alopecia, the chemotherapeutic aim when treating GTN is to provide the most effective treatment with the least toxicity. Methotrexate and dactinomycin are considered to be relatively safe agents that are commonly administered as first‐line chemotherapy for GTN, alone or in combination with other agents (Alazzam 2012). They have not been shown to be associated with adverse reproductive outcomes, ovarian failure or second tumours (Goldstein 1995).
The use of prophylactic chemotherapy (P‐Chem) in women with molar pregnancy was first described in 1966 (Lewis 1966). Since then, studies of dactinomycin and methotrexate administered before, during or after evacuation of a molar pregnancy have reported encouraging results (see Table 2). Several studies have found a significant reduction in GTN for high‐risk HMs only (Kim 1986; Fasoli 1982; Park 1996). Various dosing schedules have been described including five‐day dactinomycin (Goldstein 1974; Goldstein 1981; Limpongsanurak 2001; Park 1996), eight‐day methotrexate‐folinic acid (Goldstein 1971; Kim 1986; Park 1996) and single‐dose dactinomycin (Uberti 2006; Uberti 2009).
| Study | Design | Participants (P‐Chem) | Participants (control/no P‐Chem) | Intervention | Rate of GTN (P‐Chem) | Rate of GTN (control) | Comments |
| Case‐control | 107 women (HM) | 42 women (HM) | Methotrexate 10 mg/day PO × 7 days given within 3 weeks of ERPC. | 2/107 (2%) | 4/42 (10%) | No choriocarcinoma observed in the P‐Chem group vs 3/42 in the control group. Toxic side effects occurred in 84/107 women, including stomatitis (34/107) and myelosuppression (22/107). | |
| Prospective case‐control | 73 women (CM) | 116 women (CM) | 3 intervention arms: methotrexate 0.3 mg/kg/day × 5 days (20 women); or dactinomycin 9 to 12 μg/kg/day × 5 days (53 women); ERPC on day 3. | 6/73 (8%) | 23/116 (20%) | No metastatic disease observed in the P‐Chem groups. P‐Chem well tolerated with minor side effects. | |
| Prospective case‐control | 100 women (HM) | 100 women (HM) | Dactinomycin 12 μg/kg/day × 5 days. ERPC on day 3. | 2/100 (2%) | 16/100 (16%) | No metastatic disease observed in the P‐Chem group vs 4/100 in the control group (4%). Reversible alopecia occurred in 32% of the P‐Chem group. No serious toxic reactions. | |
| Prospective case‐control | 174 women (CM) | 858 women (CM) | Dactinomycin 12 μg/kg/day × 5 days. ERPC on day 3. | 10/247 (4%) | 160/858 (19%) | No metastatic disease observed in the P‐Chem group vs 34/858 (4%) in the control group. This report includes data from Goldstein 1974. | |
| Retrospective case‐control | 104 women (92% CM) | 250 women (CM) | Methotrexate 10 mg/day PO × 5 days every 3 weeks for 3 cycles. | 3/104 (3%) | 23/250 (9%) | Significantly fewer high‐risk women in the P‐Chem group (1/47) vs the control group (18/126) developed GTN (2% vs 14%; P < 0.05). 2 women had severe myelosuppression and 1 had severe alopecia. | |
| RCT (?) | 293 women (CM) | 127 women (CM) | Methotrexate 10 mg/day (IM or PO) for 7 days, within 3 weeks of evacuation. | 22/293 (7%) | 23/127 (18%) | There were 5 cases of metastatic disease in each group (1.7% vs 3.9%, respectively) 27.3% of the P‐Chem group experienced drug‐related side effects including stomatitis (10.3%), nausea/vomiting (6.8%) and leukopenia (4.4%). However none were reported to be severe. | |
| RCT | 39/71 women (CM; 18/31 low‐risk and 21/40 high‐risk women) | 32 women (CM) | Methotrexate 1.0 mg/kg/day IM (days 1, 3, 5, 7) and citrovorum factor rescue 0.1 mg/kg/day IM (days 2, 4, 6, 8). ERPC on day 3. | 4/39 (10%) | 10/32 (31%) | Significantly fewer high‐risk women in the P‐Chem group (14%) vs the control group (47%) developed GTN. There was no significant difference in the GTN rates of low‐risk women between groups. | |
| Retrospective case‐control | 52 women (14 low‐risk, 21 medium‐risk and 17 high‐risk HM) | 88 women (38 low‐risk, 25 medium‐risk and 25 high‐risk HM) | Methotrexate 1 mg/kg (days 1, 3, 5, 7) and citrovorum factor (0.1 mg/kg (days 2, 4, 6, 8); or dactinomycin 12 μg/kg/day × 5 days started at the time of ERPC. | 8/52 (15.4%) | 28/88 (31.8%) | Significantly fewer high‐risk women in the P‐Chem group (7/17) vs the control group (22/25) developed GTN (41% vs 88%; P < 0.01). There was no significant difference in the GTN rates in low‐ and medium‐risk women between groups. The time to achieve normal hCG levels was shorter in high‐risk women in the P‐Chem group. | |
| Double‐blind RCT | 30 women (high‐risk CM) | 30 women (high risk CM) | Dactinomycin 10 µg/kg for 5 days, within 1 week after ERPC and histology. | 4/29 (15.4%) | 15/30 (50%) | Mild, reversible side effects reported including stomatitis (10%), nausea/vomiting (10%), oral ulcers (3.3%) and hair loss (13.3%) ‒ all grade 1 except for 2 women with grade 2 patchy alopecia. | |
| Retrospective case‐control | 29 adolescents (high‐risk CM) | 31 adolescents (high‐risk CM) | Dactinomycin 1.25 mg/m² IV given 1 hour before ERPC. | 2/29 (6.9%) | 9/31 (29%) | Mean risk scores and hCG levels were significantly higher and gestational age was significantly lower in the P‐Chem group than the control group. Mild and transient side effects included hepatotoxicity (10%) and mild alopecia (6.8%). | |
| Retrospective case‐control | 163 women (high risk, > 90% CM) | 102 women (high risk, > 90% CM) | Dactinomycin 1.25 mg/m² IV given 1 hour before ERPC. | 30/163 (18.4%) | 35/102 (34.3%) | Mild and transient side effects including nausea (8%), raised liver enzymes (3.7%), stomatitis (3.1%), rash (2.4%) diarrhoea (2.4%), alopecia (1.2%) and neutropenia (0.6%) were seen in 21% of the P‐Chem group. Time to GTN diagnosis, subsequent drug resistance and the number of chemotherapy course to cure was similar in the 2 groups. |
* Three studies administered P‐Chem after ERPC including Koga 1968, Kashimura 1986 and Limpongsanurak 2001.
CM; complete mole; ERPC: evacuation of retained products of conception; GTN: gestational trophoblastic neoplasia; HM: hydatidiform mole; IM: intramuscular; IV: intravenous; P‐Chem; prophylactic chemotherapy; PO: per os; RCT: randomised controlled trial.
How the intervention might work
As GTN is a highly chemosensitive disease, prophylaxis with chemotherapy agents that have known activity against trophoblast tumour cells may prevent progression to GTN. The use of P‐Chem has been based on an assumption that the development of GTN is pre‐determined, that metastatic GTN spreads via the bloodstream and that high serum levels of cytotoxic agents around the time of evacuation should reduce the ability of the trophoblast cells to invade or metastasise (Goldstein 1995).
P‐Chem may be particularly useful in women with high‐risk CMs who have poor access to health care, for whom hormonal follow‐up is not available, or where poor compliance may be an issue (Berkowitz 2009a; Limpongsanurak 2001; Uberti 2006). In Latin America, loss to follow‐up may be as high as 44% in some areas; hence numerous referral centres in this region are reported to use P‐Chem (Charry 2009). However, the use of P‐Chem may expose women to toxic side effects (Kaye 2002 and Ratnam 1971 have reported toxicity‐related deaths with methotrexate prophylaxis), may lead to inadequate follow‐up, and incompletely protects women against persistent tumour (Goldstein 1995; Hancock 2009). Furthermore, P‐Chem may favour the development of drug resistance (Kim 1986) and delay the time to effective treatment, thereby having adverse effects on survival.
Why it is important to do this review
P‐Chem for high‐risk HM appears to be routine clinical practice in some regions of the world (Charry 2009). Although several studies have been reported, it remains unclear whether P‐Chem, which may be associated with substantial toxicity, will prevent malignant transformation of HM. Furthermore, if P‐Chem benefits exist, it is not clear which drug regimen might have the best effectiveness‐to‐toxicity ratio. We undertook this review in an attempt to clarify the benefits and risks associated with P‐Chem for HM.
Objectives
To evaluate the effectiveness and safety of P‐Chem for the prevention of GTN in women with molar pregnancy.
To investigate whether any subgroup of women with HM may benefit more from P‐Chem than others.
Methods
Criteria for considering studies for this review
Types of studies
Randomised controlled trials (RCTs).
Types of participants
Inclusions
All women diagnosed with HM.
Exclusions
Women who were diagnosed with other types of GTD such as invasive moles, choriocarcinoma and placental site trophoblastic tumour (PSTT).
Types of interventions
P‐Chem compared with no or other treatments (e.g. placebo or analgesic drugs).
Types of outcome measures
Primary outcomes
-
Incidence of GTN (invasive mole, choriocarcinoma, PSTT and epithelioid trophoblastic tumour (ETT).
Secondary outcomes
-
Drug toxicity, including myelotoxicity, gastrointestinal toxicity, stomatitis and alopecia.
-
Overall survival (more than 5 years).
-
Time to negative conversion of serum or urine β‐hCG.
-
Time to GTN diagnosis.
-
Incidence and nature of subsequent pregnancies.
-
Quality of life (QoL).
Search methods for identification of studies
Electronic searches
For the original review we searched the Cochrane Gynaecological Cancer Specialised Register, the Cochrane Central Register of Controlled Trials (CENTRAL, Issue 2, 2012), MEDLINE (1946 to February week 4, 2012) and Embase (1980 to 2012, week 9). For this review update we searched the Cochrane Central Register of Controlled Trials (CENTRAL, Issue 5, 2017) in the Cochrane Library (Appendix 1), MEDLINE (February 2012 to June week 1, 2017) (Appendix 2) and Embase (February 2012 to 2017, week 23) (Appendix 3). No language restriction was applied.
Searching other resources
All relevant articles were identified in PubMed; and, using the 'related articles' feature, a further search was carried out for newly published articles. The reference lists from identified published trials were handsearched for further clinical trials. Papers in all languages were sought and translated as necessary. We searched the metaRegister of Controlled Trials (mRCT) and the National Research Register (NRR) archive for ongoing trials.
Data collection and analysis
Selection of studies
We downloaded all titles and abstracts retrieved by electronic searching to a reference management database, removed duplicates and two review authors (JF, FH) independently examined the remaining references. We excluded those studies that clearly did not meet the inclusion criteria and obtained copies of the full text of potentially relevant references. Three review authors (JF, LX, TL) independently assessed the eligibility of retrieved papers. We documented the reasons for exclusion.
Data extraction and management
For included studies, three review authors (JF, HC, TL) independently extracted data on the following parameters: patient characteristics; number recruited to each arm; number excluded from analysis; type of intervention; proportion of participants who received all, part or none of the intended treatment; methods of randomisation, blinding and allocation concealment; length of follow‐up; and outcome. Review authors resolved disagreements by discussion or by appeal to a fourth review author (one of LH, FF or TW) if necessary.
Assessment of risk of bias in included studies
We used Cochrane's tool for assessing risk of bias (Higgins 2011). Three review authors (JF, LX, TL) independently assessed the risk of bias within each included study based on the following six domains, with review authors' judgements presented as answers of 'yes' (low risk of bias); 'no' (high risk of bias), or 'unclear' (uncertain risk of bias).
-
Selection bias: random sequence generation and allocation concealment.
-
Performance bias: blinding of participants and personnel (women and treatment providers).
-
Detection bias: blinding of outcome assessment.
-
Attrition bias: incomplete outcome data. We considered studies to be at a high risk of bias if more than 20% of women were lost to follow‐up or reasons for loss to follow‐up differed between treatment arms.
-
Reporting bias: selective reporting of outcomes.
-
Other possible sources of bias.
Assessment of heterogeneity
We used random‐effects models for all meta‐analyses (DerSimonian 1986). We assessed heterogeneity between studies by visual inspection of forest plots; by estimation of the I² statistic, which summarises the percentage heterogeneity between trials that cannot be ascribed to sampling variation; and by a formal statistical test of the significance of the heterogeneity (Deeks 2001). I² less than 25% was considered as low‐level heterogeneity, 25% to 50% as a moderate level, and higher than 50% as substantial heterogeneity (Higgins 2003). If there was evidence of substantial heterogeneity, the possible reasons for this were investigated and reported.
Data synthesis
Meta‐analysis was carried out using Review Manager 5 software (Review Manager 2014). We used random‐effects models for all meta‐analyses (DerSimonian 1986). For dichotomous outcomes, we calculated risk ratios (RR) and associated 95% confidence intervals (CIs). For continuous outcomes we pooled the mean differences (MD) between the treatment arms where trials measured the outcome on the same scale.
Subgroup analysis and investigation of heterogeneity
We subgrouped women by the type of chemotherapy agent (i.e. methotrexate and dactinomycin). We had planned to perform other subgroup analyses, including subgroups of women at a low and high risk of GTN, and according to drug regimens; however, this was not possible since these data were not reported in the included trials.
Sensitivity analysis
We performed sensitivity analysis to assess the robustness of the meta‐analyses by comparing the results using all trials and then excluding trials of lower methodological quality or those considered to be at a higher risk of bias.
Results
Description of studies
Results of the search
From the search, we identified and screened 161 records. After de‐duplication, and title and abstract screening, we retrieved the full text of 90 citations that we considered potentially eligible for inclusion in this review. We excluded 81 out of these 90 papers. Of the remaining nine reports, we excluded four on the basis that they were not RCTs (Geng 2011; Uberti 2006; Uberti 2009 ‒ two papers); and two RCTs which enrolled gestational trophoblastic neoplasia (Fariba 2016; Mousavi 2012). We included the remaining three studies (Kashimura 1986; Kim 1986; Limpongsanurak 2001). The selection‐of‐study process is represented in a PRISMA Flow Diagram (Figure 1).

Study flow diagram.
Included studies
We included three studies with a total of 613 participants (Kashimura 1986; Kim 1986; Limpongsanurak 2001). Two studies used prophylactic methotrexate and one trial used prophylactic dactinomycin. The number of evaluable participants in the three studies was 550. See Characteristics of included studies.
Kashimura 1986 'randomly selected' 420 women with low‐ or high‐risk CM to receive one course of prophylactic methotrexate (10 mg daily for seven days) within three weeks of ERPC, or no prophylaxis, and evaluated subsequent rates of GTN in the two groups.
Kim 1986 randomised 133 women with low‐ or high‐risk CM to prophylactic methotrexate or no prophylaxis. Only 71 out of 133 women completed this trial and were included in the analyses (39 in the treatment group and 32 in the untreated group). The intervention group (18 out of 31 low‐risk women and 21 out of 40 high‐risk women) received one course of methotrexate with citrovorum rescue factor (methotrexate 1.0 mg/kg/day intramuscular (IM) on days 1, 3, 5 and 7; citrovorum rescue factor 0.1 mg/kg/day IM on days 2, 4, 6 and 8); the control group received no treatment. The ERPC in the intervention group was done on the third or fourth day of P‐Chem.
Limpongsanurak 2001 randomised 60 women with high‐risk CM to dactinomycin prophylaxis (10 μg/kg body weight daily for 5 days; 30 women) or no prophylaxis (30 women) within one week after ERPC. One woman was lost to follow‐up.
Excluded studies
We excluded three retrospective studies (Geng 2011; Uberti 2006; Uberti 2009), and two RCTs that enrolled participants with gestational trophoblastic neoplasia (Fariba 2016; Mousavi 2012); see Characteristics of excluded studies.
Risk of bias in included studies
We assessed the risk of bias of the three included RCTs using the Cochrane's 'Risk of bias' tool; see Figure 2. Overall, we consider the older studies of Kashimura 1986 and Kim 1986 to be at a high risk of bias and Limpongsanurak 2001 to be at a low risk of bias. Dr. Limpongsanurak provided us with additional methodological details for Limpongsanurak 2001 via e‐mail. Although we attempted to contact the other authors by e‐mail for more details, we were unsuccessful as we had no contact details for the authors of Kim 1986, and received no reply to our queries from Dr. Kashimura (Kashimura 1986).
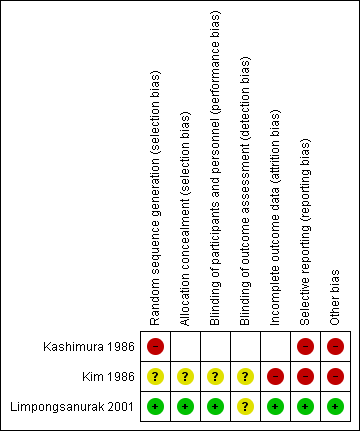
'Risk of bias' summary: review authors' judgements about each 'Risk of bias' item for each included study.
Allocation
Limpongsanurak 2001 used lot‐drawing to randomise women and sealed opaque envelopes to conceal random group allocations; we assessed these methods to be at a low risk of bias. We assessed the randomisation and allocation methods used in Kim 1986 to be of unclear risk of bias and assessed the random sequence generation in Kashimura 1986 to be at a high risk of bias. In the latter report, participants were "selected at random", which suggests that participant selection in this study may not have been a truly random process. Furthermore, no randomisation ratio was described and yet the intervention and control groups were very different sizes (293 women versus 127 women).
Blinding
The only trial that reported blinding was Limpongsanurak 2001. Although precise details were not reported, this trial was described as 'double‐blind' as control participants received a similar‐looking intravenous (IV) solution with analgesic drugs for five days, and neither the participant nor the attending doctor knew to which group the participant had been allocated. It is unclear whether outcome assessment was also blind.
Incomplete outcome data
We assessed Kim 1986 as being at a high risk of attrition bias as 62 out of 133 women were excluded from the analyses owing to loss to follow‐up (36 women), insufficient length of follow‐up (7 women) and hysterectomy (19 women). Of the 60 women in Limpongsanurak 2001, one woman in the P‐Chem group was lost to follow‐up one month after treatment and was not included in the main analyses. Kashimura 1986 reported complete data sets for the main outcomes.
Selective reporting
All pre‐specified outcomes were reported for Kim 1986 and Limpongsanurak 2001. Kashimura 1986 failed to report baseline characteristics of the two study groups that could represent reporting bias, especially since there were proportionally more women aged 40 years and over in the control group.
Other potential sources of bias
In Kashimura 1986, more women in the control group were 40 years old and over (22% in control group versus 11% in P‐Chem group). The older women were more likely to progress to GTN (39% versus 12%). This may have biased the results in favour of the P‐Chem group.
Limpongsanurak 2001 included women with high‐risk CM only, whereas Kim 1986 and Kashimura 1986 included women with low‐ and high‐risk CM. Since Kim 1986 showed that P‐Chem was not beneficial to women with low‐risk CM, by including these women the meta‐analysis results may be biased in the direction of the control arm.
Limpongsanurak 2001 and Kashimura 1986 gave P‐Chem after ERPC whereas Kim 1986 started P‐Chem before the ERPC. If treatment was commenced before ERPC, this trial may have included women with PM and hydropic abortion that would otherwise have been excluded following histological diagnosis of evacuation products. It is unclear whether women with PM or hydropic abortion were present in the same numbers within the allocated groups.
Kashimura 1986 and Kim 1986 were older studies that took place before rigorous RCT guidelines were in place and therefore are lacking in methodological quality. It is not possible to determine whether these were true RCTs so we have assumed that they were but considered them to be at a high risk of bias overall; therefore we have performed sensitivity analysis and downgraded the results accordingly.
Effects of interventions
See: Summary of findings for the main comparison
Incidence of GTN
Incidence of GTN (overall)
P‐Chem was associated with a significant reduction in the incidence of GTN compared with the control group (3 studies; 550 participants; 30 out of 361 versus 48 out of 189; RR 0.37, 95% CI 0.24 to 0.57; I² = 0%; P < 0.00001; low‐quality evidence) with no significant difference between methotrexate and dactinomycin prophylaxis subgroups (Analysis 1.1).
We performed sensitivity analysis for this outcome as two of the included studies were at a high risk of bias. When these two studies (both in the methotrexate subgroup) were excluded, only one trial remained (59 participants; 4 out of 29 versus 15 out of 30; RR 0.28, 95% CI 0.10 to 0.73; P = 0.01); therefore we consider this evidence to be of low quality.
Incidence of GTN (high‐risk HM only)
When only high‐risk women were included, P‐Chem was similarly associated with a significant reduction in the incidence of GTN compared with the control group (2 studies; 99 participants; 7 out of 50 versus 24 out of 49; RR 0.29, 95% CI 0.14 to 0.60; I² = 0%; P = 0.001; low‐quality evidence) (Analysis 1.2). Sensitivity analysis gave the same results as above when the only well‐conducted trial was included (59 participants; 4 out of 29 versus 15 out of 30; RR 0.28, 95% CI 0.10 to 0.73; P = 0.01; low‐quality evidence).
Invasive mole and choriocarcinoma
There were insufficient data from these trials to analyse the rates of invasive mole and choriocarcinoma in the study groups. Limpongsanurak 2001 utilised a prognostic scoring system to diagnose GTN (not histology) and secondary histology was known in only three participants, two of whom underwent hysterectomy for excessive bleeding. Kashimura 1986 diagnosed 27 out of 45 cases of GTN histologically and 18 out of 45 by a Japanese prognostic scoring system. Four of these participants had choriocarcinoma (two in each study group) and 41 were considered to have invasive mole. Kim 1986 diagnosed most cases of GTN based on persistent or rising hCG levels, persistent or recurrent uterine haemorrhage, or clinical/histological evidence of metastases, and did not distinguish between invasive mole and choriocarcinoma.
Time to GTN diagnosis
Two studies reported this outcome for 33 participants who developed GTN (Kim 1986; Limpongsanurak 2001). The time to GTN diagnosis was significantly longer in the P‐Chem group compared with the control group (MD 28.72 days, 95% CI 13.19 to 44.24; I² = 0%; P = 0.0003; low‐quality evidence) (Analysis 1.3). When we excluded Kim 1986 from the sensitivity analysis, results for the one remaining study were similar but not significant (19 participants; MD 22.30 days, 95% CI 9.05 to 53.65; P = 0.16).
Toxicity
None of the studies reported adverse effects in the control groups and we have not imputed these data. Limpongsanurak 2001 (five‐day dactinomycin) only reported side effects as percentages, including stomatitis (10%), nausea or vomiting (10%), oral ulcers (3.3%) and hair loss (13.3%). All adverse effects in this study were grade 1 except for two women with patchy alopecia (grade 2). The other two studies reported the following.
-
Kashimura 1986 (239 women): stomatitis (10.3%), nausea or vomiting (6.8%) and leukopenia (4.4%).
-
Kim 1986 (39 women): epithelial (5.1%), hepatic (7.7%), haematological (7.7%) and neuromuscular (2.6%) toxicity.
In these two studies, grades of toxicity were not reported. Both reports state that there were no severe complications or drug‐related deaths.
Courses of chemotherapy
Only one poor‐quality study reported this outcome. Women in the methotrexate prophylaxis group needed more subsequent chemotherapy courses for GTN treatment than the control group (14 women; MD 1.10, 95% CI 0.52 to 1.68; P = 0.0002; very low quality evidence).
Survival
There were no deaths during the follow‐up periods in Kim 1986 and Limpongsanurak 2001; however, Kashimura 1986 reported three deaths from metastatic disease that occurred two to 12 years after ERPC, including two women in the P‐Chem group and one in the control group.
Subsequent pregnancies
Limpongsanurak 2001 did not report subsequent pregnancy rates. Women in Kim 1986 were given contraception for one year after ERPC and subsequent pregnancy rates were assessed. Out of 51 women who attempted to become pregnant, 40 had 44 pregnancies including 24 out of 29 in the P‐Chem group and 16 out of 22 in the control group. The rates of full‐term pregnancies were reported as being similar in the two groups (25 out of 27 (93%) in the P‐Chem group versus 16 out of 17 (94%) in the control group).
Kashimura 1986 obtained these data for 101 out of 420 participants only (24%): 74 out of 112 (67%) subsequent pregnancies were normal full‐term pregnancies in the P‐Chem group compared with 19 out of 31 (61%) in the control group. The induced abortion rate was 22% of pregnancies in the P‐Chem group and 13% in the control group.
It was not possible to perform a meta‐analysis of these very limited data.
Discussion
Summary of main results
In a limited meta‐analysis of three studies that included low‐ and high‐risk molar pregnancies, P‐Chem reduced the incidence of subsequent GTN by approximately two‐thirds overall. On sensitivity analysis, where the only satisfactory study (high‐risk women only) contributed data, the results showed a similar effect but with a wider CI; (see summary of findings Table for the main comparison). The interpretation of these results was influenced by the poor methodological quality of the two older included studies, and the small number of participants in the only other study. We therefore consider this evidence to be of low quality.
The diagnosis of GTN occurred approximately one month later in the P‐Chem group compared with the control group in the meta‐analysis of two studies that reported this outcome. The P‐Chem group needed approximately one extra course of chemotherapy than the control group to achieve a cure in the participants whose disease progressed to GTN. We consider this evidence to be of very low quality for similar reasons to those given above.
Data on toxicity were insufficient for meta‐analysis; however, it was reported that no participants in any of the studies experienced severe drug‐related complications or deaths.
Overall completeness and applicability of evidence
We consider this evidence to be incomplete and not widely applicable.
Incidence of GTN
This limited evidence in favour of P‐Chem may apply to women with high‐risk CM only. Kim 1986 found that P‐Chem did not benefit women with low‐risk HM and some non‐randomised studies have drawn similar conclusions (Fasoli 1982; Park 1996). This is probably why the more recent studies have excluded low‐risk women (e.g. Limpongsanurak 2001; Uberti 2009). Furthermore, the incidence of GTN in the high‐risk control groups of included studies was high, at 47% and 50% for Kim 1986 and Limpongsanurak 2001, respectively. This may reflect regional differences in the rates of CM transformation or the selection/diagnostic criteria applied, and needs further clarification.
Only two chemotherapeutic agents, namely methotrexate and actinomycin D, were investigated. None of the included studies evaluated the less toxic single‐dose regimens of these agents that have been shown to be useful to treat low‐risk GTN (Alazzam 2012). One RCT of single‐dose dactinomycin for P‐Chem was proposed by Goldstein 1995, but has never been conducted. Uberti 2006 and Uberti 2009 report the results of two retrospective studies of single‐dose dactinomycin administered before evacuation of high‐risk molar pregnancies, showing a reduction in post‐molar GTN of 76% and 46%, respectively, with minimal adverse effects. Since this low‐dose dactinomycin regimen appears to be in practice (personal communication with Dr Uberti) it should be evaluated in an RCT.
Toxicity
Toxicity was not rigorously reported in the included studies and meta‐analyses of these data were not possible. When used to treat low‐risk GTN, five‐day dactinomycin and five‐ and eight‐day methotrexate regimens have been associated with severe adverse effects including myelosuppression, hepatotoxicity and alopecia (dactinomycin); hence there is a move towards less toxic chemotherapy regimens for the treatment of low‐risk GTN (Alazzam 2012). For this reason, the more toxic five‐ and eight‐day regimens that have historically been used in studies of P‐Chem (Table 2) are unlikely to be favoured as prophylaxis for HM.
Survival
Only one study reported long‐term follow‐up (Kashimura 1986), with three deaths occurring from metastatic disease between 2 and 12 years after ERPC (2 in the P‐Chem group and 1 in the control group); neither Kim 1986 nor Limpongsanurak 2001 assessed the impact of P‐Chem on long‐term overall survival, hence the evidence for this outcome is incomplete. Longer follow‐up of participants is needed in any future studies of P‐Chem interventions for HM.
Subsequent pregnancy and quality of life (QoL)
Although subsequent pregnancies were reported by Kashimura 1986 and Kim 1986, these data were incomplete (owing to high attrition) and it was not possible to draw any conclusions. Kim 1986 reported that 78.4% of their participants experienced at least one pregnancy after one year of contraception during the follow‐up period and the frequency of full‐term delivery was 92.6% and 94.1%, for the treatment and control groups respectively. In Kashimura 1986, comparable rates of secondary infertility and a similar time to first menstruation after ERPC were reported in the P‐Chem and control groups. Neither Kim 1986 nor Limpongsanurak 2001 assessed the impact of P‐Chem on long‐term ovarian function or QoL. However, these chemotherapy agents have been used extensively to treat GTN over several decades and have not been shown to adversely affect reproductive outcomes or ovarian function, or to be associated with second tumours (Garner 2002; Garrett 2008; Goldstein 1995; Uberti 2006; Uberti 2009).
Uberti 2009 has suggested that P‐Chem reduces the emotional complications associated with HM but we were unable to corroborate this owing to a lack of QoL data.
Drug resistance
Drug resistance may occur following P‐Chem, as the agents used for P‐Chem are also used as first‐line treatment for GTN. Only one included study compared the number of courses of chemotherapy required to treat subsequent GTN (Kim 1986). These investigators found that women in the P‐Chem group (4 women) required more courses than women in the control group (10 women), suggesting that P‐Chem may increase resistance to subsequent chemotherapy. Owing to the poor methodological quality of the Kim 1986 study and the small number of participants concerned, we are very uncertain of this estimate of effect (summary of findings Table for the main comparison). To prevent resistance to treatment it has been suggested that an alternative agent be used for the treatment of persistent disease (Goldstein 1995). Drug resistance could not be adequately evaluated in this review and warrants further investigation.
Time to GTN diagnosis
The time interval from the index pregnancy to the diagnosis of GTN is considered to be a risk factor for the development of GTN and is included in the Modified WHO Prognostic Scoring System (FIGO 2009). Again, extremely limited evidence from Kim 1986 suggests that P‐Chem may delay the time to diagnosis of GTN. It is unclear whether such a delay might potentially lead to up‐scoring of GTN lesions from low to high risk. Investigators of some retrospective studies of single‐dose dactinomycin found no difference in the time to GTN diagnosis among their participants (Uberti 2006; Uberti 2009). Thus further research is needed to clarify the impact of low‐dose P‐Chem on the time to diagnosis and subsequent GTN risk scores.
Timing of ERPC
Studies of P‐Chem to date have administered P‐Chem before performing the ERPC, with the exception of Limpongsanurak 2001, Kashimura 1986 and Koga 1968, where participants received their P‐Chem within 1 week and 3 weeks of the ERPC. Only Limpongsanurak 2001 included participants based on a histological diagnosis. Goldstein 1971 was the first to describe performing the ERPC on P‐Chem day 3 (see Table 2) and this practice was included in several subsequent studies, including Kim 1986. Administering P‐Chem before ERPC may theoretically be more effective in preventing haematogenous spread of the molar tissue during the procedure. Since the incidence of GTN in the high‐risk groups of Kim 1986 and Limpongsanurak 2001 were similar, it would appear that administering P‐Chem before ERPC may not confer any additional benefit. Treating women with P‐Chem before evacuation carries the inherent risk of over‐treating women, as 10% of cases that are thought to be molar on ultrasound may turn out to be non‐molar hydropic abortions (Fowler 2006). Thus we propose that in any future studies of P‐Chem, the intervention is administered after ERPC, and following a histological diagnosis of CM.
Quality of the evidence
We consider this evidence to be of low to very low quality. This conclusion is based on our assessment that two of the included studies were of poor methodological quality and at a high risk of bias (See Risk of bias in included studies); the third study was of good quality but consisted of only 60 participants. Kashimura 1986 and Kim 1986 are older studies that took place before rigorous RCT guidelines were in place.
With reference to the evidence for high‐risk CMs only, we calculated that the number needed to treat for an additional beneficial outcome (NNTB) to prevent one woman with high‐risk CM developing GTN was 3, with a 95% CI of 2 to 20 women; this wide CI illustrates the uncertainty concerning this evidence. Therefore, we believe that further research is very likely to have an important impact on our confidence in the estimate of effects, and is likely to change the estimates.
With regard to the number of courses of chemotherapy required to cure post‐molar GTN, we are very uncertain about this estimate of effect (see summary of findings Table for the main comparison).
Potential biases in the review process
We included all identified RCTs in this review, including two older studies of poor methodological quality. We rigorously debated the merits of including these weaker studies as, in so doing, we might have biased the results in favour of P‐Chem. In particular, Kashimura 1986 describes the study design as "prospective", with participants "selected at random". While some authors have interpreted this study design as an RCT (Limpongsanurak 2001), it has also been referred to as a retrospective study (Goldstein 1995). We were unsuccessful in making contact with the investigators of either Kim 1986 or Kashimura 1986 and therefore it was not possible to determine whether these were true RCTs. We decided to include them in our meta‐analyses. This may seem controversial; however, we performed sensitivity analyses and downgraded the meta‐analyses results accordingly. Sensitivity analysis of the main outcome produced similar findings when these studies were excluded. Furthermore, these weaker studies included low‐ and high‐risk women in their sample, which may have biased the results in the direction of the control group, as P‐Chem was found in these studies to have little benefit for women with a low risk of developing GTN.
Agreements and disagreements with other studies or reviews
Most recent studies of P‐Chem have been conducted in Asia and South America. This may be indicative of higher prevalence of GTD, limited health resources or lower rates of follow‐up experienced by women in these regions. However, concerns regarding the exposure of women to unnecessary side effects may have played a role in the lack of contributing data from centres in North America and Europe (Goldstein 1995).
Most recently, investigators in Brazil conducted two retrospective case‐control studies and reported a significant reduction in the rate of GTN transformation with the use of a single bolus dose of dactinomycin before evacuation for high‐risk HM, with minimal side effects (see Table 2; Uberti 2006; Uberti 2009). Baseline risk scores and hCG levels were significantly greater in the P‐Chem arm of the latter study, yet the incidence of GTN was significantly lower in the P‐Chem group compared with the control group. These studies suggest that low‐dose dactinomycin may have an improved effectiveness‐to‐toxicity ratio, and hence greater general acceptability as a P‐Chem regimen.
It has been argued that because of the excellent primary cure rates among women with GTN, most doctors prefer to monitor hCG levels in women following HM, rather than administer P‐Chem (Hurteau 2003). In addition, even if prophylaxis reduces the risk of GTN, women who are given prophylaxis would still require the same monitoring and follow‐up as those who are not. However, P‐Chem may reduce emotional costs for affected women, as well as operating costs for institutions (Uberti 2009). In Uberti 2009, the number of women with high‐risk HM who needed to be treated (NNTB) to prevent one case of GTN was seven; at this rate, P‐Chem would apparently result in substantial cost savings to their GTD centre. Following a personal communication with Dr Uberti, we understand that this regimen is already in clinical practice in this GTD Centre in Brazil. The emotional (QoL) and cost implications of P‐Chem versus no P‐Chem could not be evaluated in this review,
P‐Chem may not be the only method of reducing the incidence of GTN. In Japan, second ERPCs are performed within one week of the first ERPC following histological confirmation of HM (Sasaki 2009); and in Indonesia, women with HM are given vitamin A supplementation (personal communication; Andrijono 2010). In one double‐blind RCT conducted in Indonesia, vitamin A prophylaxis was compared with an identical placebo in women with CMs (Andrijono 2010). The theoretical basis for this intervention was that vitamin A has been shown to cause trophoblastic cells to undergo apoptosis (Andrijono 2010). Investigators reported that only 2 out of 30 women (6.7%) with CM who received 200,000 IU of vitamin A per day progressed to GTN compared with 10 out of 35 in the placebo group (28.6%) (P = 0.029). Side effects appeared to have been minimal. The proportion of high‐risk CMs and the median duration of prophylaxis were not reported; however, these results are encouraging and warrant further research into vitamin A supplementation in women with HM.

Study flow diagram.

'Risk of bias' summary: review authors' judgements about each 'Risk of bias' item for each included study.

Comparison 1 Prophylactic chemotherapy versus no prophylactic chemotherapy, Outcome 1 Incidence of GTN (overall).

Comparison 1 Prophylactic chemotherapy versus no prophylactic chemotherapy, Outcome 2 Incidence of GTN (high‐risk HM only).

Comparison 1 Prophylactic chemotherapy versus no prophylactic chemotherapy, Outcome 3 Time to GTN diagnosis.

Comparison 1 Prophylactic chemotherapy versus no prophylactic chemotherapy, Outcome 4 Number of courses of chemotherapy to cure.

Comparison 1 Prophylactic chemotherapy versus no prophylactic chemotherapy, Outcome 5 Mortality rate.
| Prophylactic chemotherapy compared with no prophylactic chemotherapy for hydatidiform mole | ||||||
| Patient or population: women with a molar pregnancy Settings: inpatient Intervention: methotrexate or dactinomycin Comparison: placebo or no prophylaxis | ||||||
| Outcomes | Illustrative comparative risks* (95% CI) | Relative effect | No of participants | Quality of the evidence | Comments | |
| Assumed risk | Corresponding risk | |||||
| No prophylaxis | P‐Chem | |||||
| Incidence of GTN (including low‐quality studies) | Mixed‐risk population | RR 0.37 (0.24 to 0.57) | 550 women | ⊕⊕⊝⊝ | The NNTB to prevent 1 woman developing GTN after evacuation of HM was 6 (95% CI 5 to 10). We downgraded this evidence because this meta‐analysis included 2 studies that we considered to be of poor methodological quality. | |
| 254 per 1000 | 94 per 1000 (61 to 145) | |||||
| High‐risk population | RR 0.29 (0.14 to 0.60) | 99 women (2 studies) | ⊕⊕⊝⊝ | The NNTB for women with high‐risk HM was 3 (95% CI 2 to 5). We downgraded this evidence because the meta‐analysis included 2 small studies, 1 of which was of a poor methodological quality. | ||
| 490 per 1000 | 142 per 1000 (69 to 294) | |||||
| Incidence of GTN (excluding low‐quality studies) | High‐risk population | RR 0.28 (0.10 to 0.73) | 59 women (1 study) | ⊕⊕⊝⊝ | The NNTB to prevent 1 woman developing GTN after evacuation of high‐risk HM was 3 (95% CI 2 to 20). We downgraded this evidence because only 1 small study (Limpongsanurak 2001) contributed data, giving an imprecise result. | |
| 500 per 1000 | 140 per 1000 (50 to 365) | |||||
| Time to GTN diagnosis (days) | The mean time to GTN diagnosis ranged across control groups from 35.7 days to 59.5 days. | The mean time to GTN diagnosis in the intervention groups was 65.5 days to 81.8 days (higher). | MD 28.72 (13.19 to 44.24) | 33 women | ⊕⊕⊝⊝ | We downgraded this evidence because the meta‐analysis included 1 study of poor methodological quality (Kim 1986). When this study was excluded, the results of the remaining study (Limpongsanurak 2001; 19 women) were: MD 22.30; 95% CI −9.05 to 53.65. |
| Number of courses of chemotherapy to cure | The mean number of courses of chemotherapy required to cure subsequent GTN was 1.4 courses (10 women). | The mean number of courses of chemotherapy required to cure subsequent GTN was 2.5 courses (4 women). | MD 1.10 (0.52 to 1.68) | 14 women | ⊕⊝⊝⊝ | This analysis only included 1 study, and we considered to be of a poor methodological quality (Kim 1986). |
| *The basis for the assumed risk (e.g. the median control group risk across studies) is provided in footnotes. The corresponding risk (and its 95% confidence interval) is based on the assumed risk in the comparison group and the relative effect of the intervention (and its 95% CI). | ||||||
| GRADE Working Group grades of evidence | ||||||
| The assumed risk for the mixed‐risk population was calculated by using the weighted mean risk across the control group for this outcome. The assumed risk for the high‐risk population was based on the control group of Limpongsanurak 2001, which was the only study to evaluate a high‐risk population only. | ||||||
| Prognostic factor | Score | |||
| 0 | 1 | 2 | 3 | |
| U/S diagnosis | Partial | Complete | Recurrent | |
| Uterine size for GA (months) | not more than 1 | > 1 | > 2 | > 3 |
| hCG level (mIU/mL) | < 50,000 | > 50,000 to < 100,000 | > 100,000 to < 1,000,000 | > 1,000,000 |
| Diameter of theca lutein cysts (cm) | ‐ | < 6 | < 6 to < 10 | > 10 |
| Patient age (years) | ‐ | < 20 | ≥ 40 | > 50 |
| Medical complications** | ‐ | ≥ 1 | ‐ | ‐ |
| *From Berkowitz 1987 Low risk is defined as a score of < 4; high risk is defined as a score ≥ 4 U/S: ultrasound; GA: gestational age, hCG: β‐human chorionic gonadotrophin. ** hyperemesis, hyperthyroidism, pre‐eclampsia, trophoblastic embolisation, disseminated intravascular coagulation. | ||||
| Study | Design | Participants (P‐Chem) | Participants (control/no P‐Chem) | Intervention | Rate of GTN (P‐Chem) | Rate of GTN (control) | Comments |
| Case‐control | 107 women (HM) | 42 women (HM) | Methotrexate 10 mg/day PO × 7 days given within 3 weeks of ERPC. | 2/107 (2%) | 4/42 (10%) | No choriocarcinoma observed in the P‐Chem group vs 3/42 in the control group. Toxic side effects occurred in 84/107 women, including stomatitis (34/107) and myelosuppression (22/107). | |
| Prospective case‐control | 73 women (CM) | 116 women (CM) | 3 intervention arms: methotrexate 0.3 mg/kg/day × 5 days (20 women); or dactinomycin 9 to 12 μg/kg/day × 5 days (53 women); ERPC on day 3. | 6/73 (8%) | 23/116 (20%) | No metastatic disease observed in the P‐Chem groups. P‐Chem well tolerated with minor side effects. | |
| Prospective case‐control | 100 women (HM) | 100 women (HM) | Dactinomycin 12 μg/kg/day × 5 days. ERPC on day 3. | 2/100 (2%) | 16/100 (16%) | No metastatic disease observed in the P‐Chem group vs 4/100 in the control group (4%). Reversible alopecia occurred in 32% of the P‐Chem group. No serious toxic reactions. | |
| Prospective case‐control | 174 women (CM) | 858 women (CM) | Dactinomycin 12 μg/kg/day × 5 days. ERPC on day 3. | 10/247 (4%) | 160/858 (19%) | No metastatic disease observed in the P‐Chem group vs 34/858 (4%) in the control group. This report includes data from Goldstein 1974. | |
| Retrospective case‐control | 104 women (92% CM) | 250 women (CM) | Methotrexate 10 mg/day PO × 5 days every 3 weeks for 3 cycles. | 3/104 (3%) | 23/250 (9%) | Significantly fewer high‐risk women in the P‐Chem group (1/47) vs the control group (18/126) developed GTN (2% vs 14%; P < 0.05). 2 women had severe myelosuppression and 1 had severe alopecia. | |
| RCT (?) | 293 women (CM) | 127 women (CM) | Methotrexate 10 mg/day (IM or PO) for 7 days, within 3 weeks of evacuation. | 22/293 (7%) | 23/127 (18%) | There were 5 cases of metastatic disease in each group (1.7% vs 3.9%, respectively) 27.3% of the P‐Chem group experienced drug‐related side effects including stomatitis (10.3%), nausea/vomiting (6.8%) and leukopenia (4.4%). However none were reported to be severe. | |
| RCT | 39/71 women (CM; 18/31 low‐risk and 21/40 high‐risk women) | 32 women (CM) | Methotrexate 1.0 mg/kg/day IM (days 1, 3, 5, 7) and citrovorum factor rescue 0.1 mg/kg/day IM (days 2, 4, 6, 8). ERPC on day 3. | 4/39 (10%) | 10/32 (31%) | Significantly fewer high‐risk women in the P‐Chem group (14%) vs the control group (47%) developed GTN. There was no significant difference in the GTN rates of low‐risk women between groups. | |
| Retrospective case‐control | 52 women (14 low‐risk, 21 medium‐risk and 17 high‐risk HM) | 88 women (38 low‐risk, 25 medium‐risk and 25 high‐risk HM) | Methotrexate 1 mg/kg (days 1, 3, 5, 7) and citrovorum factor (0.1 mg/kg (days 2, 4, 6, 8); or dactinomycin 12 μg/kg/day × 5 days started at the time of ERPC. | 8/52 (15.4%) | 28/88 (31.8%) | Significantly fewer high‐risk women in the P‐Chem group (7/17) vs the control group (22/25) developed GTN (41% vs 88%; P < 0.01). There was no significant difference in the GTN rates in low‐ and medium‐risk women between groups. The time to achieve normal hCG levels was shorter in high‐risk women in the P‐Chem group. | |
| Double‐blind RCT | 30 women (high‐risk CM) | 30 women (high risk CM) | Dactinomycin 10 µg/kg for 5 days, within 1 week after ERPC and histology. | 4/29 (15.4%) | 15/30 (50%) | Mild, reversible side effects reported including stomatitis (10%), nausea/vomiting (10%), oral ulcers (3.3%) and hair loss (13.3%) ‒ all grade 1 except for 2 women with grade 2 patchy alopecia. | |
| Retrospective case‐control | 29 adolescents (high‐risk CM) | 31 adolescents (high‐risk CM) | Dactinomycin 1.25 mg/m² IV given 1 hour before ERPC. | 2/29 (6.9%) | 9/31 (29%) | Mean risk scores and hCG levels were significantly higher and gestational age was significantly lower in the P‐Chem group than the control group. Mild and transient side effects included hepatotoxicity (10%) and mild alopecia (6.8%). | |
| Retrospective case‐control | 163 women (high risk, > 90% CM) | 102 women (high risk, > 90% CM) | Dactinomycin 1.25 mg/m² IV given 1 hour before ERPC. | 30/163 (18.4%) | 35/102 (34.3%) | Mild and transient side effects including nausea (8%), raised liver enzymes (3.7%), stomatitis (3.1%), rash (2.4%) diarrhoea (2.4%), alopecia (1.2%) and neutropenia (0.6%) were seen in 21% of the P‐Chem group. Time to GTN diagnosis, subsequent drug resistance and the number of chemotherapy course to cure was similar in the 2 groups. | |
| * Three studies administered P‐Chem after ERPC including Koga 1968, Kashimura 1986 and Limpongsanurak 2001. CM; complete mole; ERPC: evacuation of retained products of conception; GTN: gestational trophoblastic neoplasia; HM: hydatidiform mole; IM: intramuscular; IV: intravenous; P‐Chem; prophylactic chemotherapy; PO: per os; RCT: randomised controlled trial. | |||||||
| Outcome or subgroup title | No. of studies | No. of participants | Statistical method | Effect size |
| 1 Incidence of GTN (overall) Show forest plot | 3 | 550 | Risk Ratio (M‐H, Random, 95% CI) | 0.37 [0.24, 0.57] |
| 1.1 Methotrexate prophylaxis | 2 | 491 | Risk Ratio (M‐H, Random, 95% CI) | 0.39 [0.24, 0.64] |
| 1.2 Dactinomycin prophylaxis | 1 | 59 | Risk Ratio (M‐H, Random, 95% CI) | 0.28 [0.10, 0.73] |
| 2 Incidence of GTN (high‐risk HM only) Show forest plot | 2 | 99 | Risk Ratio (M‐H, Random, 95% CI) | 0.29 [0.14, 0.60] |
| 2.1 Methotrexate prophylaxis | 1 | 40 | Risk Ratio (M‐H, Random, 95% CI) | 0.30 [0.10, 0.95] |
| 2.2 Dactinomycin prophylaxis | 1 | 59 | Risk Ratio (M‐H, Random, 95% CI) | 0.28 [0.10, 0.73] |
| 3 Time to GTN diagnosis Show forest plot | 2 | 33 | Mean Difference (IV, Random, 95% CI) | 28.72 [13.19, 44.24] |
| 3.1 Methotrexate prophylaxis | 1 | 14 | Mean Difference (IV, Random, 95% CI) | 30.80 [12.93, 48.67] |
| 3.2 Dactinomycin prophylaxis | 1 | 19 | Mean Difference (IV, Random, 95% CI) | 22.30 [‐9.05, 53.65] |
| 4 Number of courses of chemotherapy to cure Show forest plot | 1 | Mean Difference (IV, Random, 95% CI) | Subtotals only | |
| 4.1 Methotrexate prophylaxis | 1 | 14 | Mean Difference (IV, Random, 95% CI) | 1.1 [0.52, 1.68] |
| 5 Mortality rate Show forest plot | 1 | Risk Ratio (M‐H, Random, 95% CI) | Subtotals only | |