Inmunonutrición como tratamiento adyuvante para las quemaduras
Información
- DOI:
- https://doi.org/10.1002/14651858.CD007174.pub2Copiar DOI

- Base de datos:
-
- Cochrane Database of Systematic Reviews
- Versión publicada:
-
- 23 diciembre 2014see what's new
- Tipo:
-
- Intervention
- Etapa:
-
- Review
- Grupo Editorial Cochrane:
-
Grupo Cochrane de Lesiones
- Copyright:
-
- Copyright © 2014 The Cochrane Collaboration. Published by John Wiley & Sons, Ltd.
Cifras del artículo
Altmetric:
Citado por:
Autores
Contributions of authors
Hannah Beatrix Tan: trial screening, manuscript drafting and editing, assessing quality.
Stefan Danilla: manuscript drafting, trial screening, extracting data, assessing quality, performing statistical analysis.
Alexandra Murray: trial screening, manuscript drafting and editing.
Ramon Serra: searching grey literature, manuscript drafting, extracting data, assessing quality.
Regina El Dib: manuscript drafting, trial screening.
Tom Henderson: trial screening, manuscript drafting.
Jason Wasiak: trial screening, manuscript drafting and editing, assessing quality.
Declarations of interest
All authors: none known.
Acknowledgements
Sincere thanks to Dr Zhaowei Zhou (Department of Cardiothoracic Surgery, Hammersmith Hospital, London, UK) for translating Chinese articles, to Dr María Teresa Valenzuela for sending letters to the authors of selected articles and to Frances Phillips (Head of Dietetics and Nutrition, Royal Perth Hospital, Perth, AUS) for providing insights into clinical content.
Version history
| Published | Title | Stage | Authors | Version |
| 2014 Dec 23 | Immunonutrition as an adjuvant therapy for burns | Review | Hannah B Tan, Stefan Danilla, Alexandra Murray, Ramón Serra, Regina El Dib, Tom OW Henderson, Jason Wasiak | |
| 2008 Apr 23 | Immunonutrition as an adjuvant therapy for burns | Protocol | Stefan Danilla, Regina P El Dib, Ramón Serra, Gabriel Cavada, Maria Valenzuela | |
Differences between protocol and review
-
Performed trial sequential analysis for mortality on glutamine intervention post hoc according to the peer review process.
-
Changed population of interest from “patients with severe burn injuries” to "patients of any age with a burn of any severity" because of the heterogeneity of the definition of "severe" burn injury.
-
Removed the following secondary outcomes: mortality due to sepsis, rates of multiple organ failure (MOF).
-
Combined the following secondary outcomes into "Rate of non‐wound infection": pneumonia, urinary tract infection, burn wound sepsis, central venous catheter–associated bloodstream infection.
-
Did not perform the following subgroup analyses.
-
Minor versus major burns (major burns are defined as burns to at least 20% of the total body surface).
-
Early versus delayed nutrition.
-
Children (birth to 18 years of age) versus adults (19 years of age or older).
-
Different types of immunonutrients in the experimental group.
-
Different types of nutrition in the control group.
-
Different doses of immunonutrients.
-
Keywords
MeSH
Medical Subject Headings (MeSH) Keywords
- Amino Acids, Branched‐Chain [therapeutic use];
- Burns [immunology, mortality, *therapy];
- Fatty Acids, Omega‐3 [therapeutic use];
- Glutamine [therapeutic use];
- Length of Stay;
- Malnutrition [immunology, *therapy];
- Nutrition Therapy [*methods];
- Ornithine [analogs & derivatives, therapeutic use];
- Randomized Controlled Trials as Topic;
- Soybean Proteins [therapeutic use];
- Vitamins [therapeutic use];
- Wound Infection [etiology];
Medical Subject Headings Check Words
Humans;
PICO

Study flow diagram.

Risk of bias summary: review authors' judgements about each risk of bias item for each included study.

Risk of bias graph: review authors' judgements about each risk of bias item presented as percentages across all included studies.

Comparison 1 All‐cause mortality, Outcome 1 Glutamine vs control.

Comparison 1 All‐cause mortality, Outcome 2 Ornithine α‐ketoglutarate vs control.

Comparison 1 All‐cause mortality, Outcome 3 Branched‐chain amino acids vs control.

Comparison 1 All‐cause mortality, Outcome 4 Fish oil vs control.

Comparison 1 All‐cause mortality, Outcome 5 Combined immunonutrients vs control.

Comparison 2 Length of hospital stay, Outcome 1 Glutamine vs control.

Comparison 2 Length of hospital stay, Outcome 2 Ornithine α‐ketoglutarate vs control.

Comparison 2 Length of hospital stay, Outcome 3 Branched‐chain amino acids.

Comparison 2 Length of hospital stay, Outcome 4 Fish oil vs control.
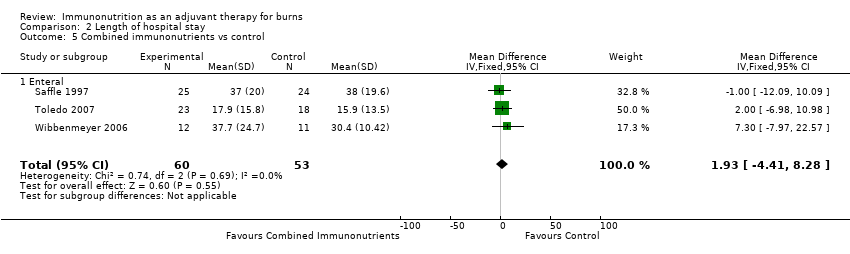
Comparison 2 Length of hospital stay, Outcome 5 Combined immunonutrients vs control.

Comparison 3 Rate of burn wound infection, Outcome 1 Glutamine vs control.

Comparison 3 Rate of burn wound infection, Outcome 2 Ornithine α‐ketoglutarate vs control.

Comparison 3 Rate of burn wound infection, Outcome 3 Combined immunonutrients vs control.

Comparison 4 Rate of non‐wound infection, Outcome 1 Glutamine vs control.

Comparison 4 Rate of non‐wound infection, Outcome 2 Fish oil vs control.

Comparison 4 Rate of non‐wound infection, Outcome 3 Combined immunonutrients vs control.
| Outcome or subgroup title | No. of studies | No. of participants | Statistical method | Effect size |
| 1 Glutamine vs control Show forest plot | 3 | 111 | Risk Ratio (M‐H, Fixed, 95% CI) | 0.25 [0.08, 0.78] |
| 1.1 Enteral | 2 | 85 | Risk Ratio (M‐H, Fixed, 95% CI) | 0.23 [0.06, 0.93] |
| 1.2 Parenteral | 1 | 26 | Risk Ratio (M‐H, Fixed, 95% CI) | 0.29 [0.04, 2.27] |
| 2 Ornithine α‐ketoglutarate vs control Show forest plot | 3 | 155 | Risk Ratio (M‐H, Fixed, 95% CI) | 0.93 [0.37, 2.36] |
| 2.1 Enteral | 3 | 155 | Risk Ratio (M‐H, Fixed, 95% CI) | 0.93 [0.37, 2.36] |
| 3 Branched‐chain amino acids vs control Show forest plot | 1 | Risk Ratio (M‐H, Fixed, 95% CI) | Totals not selected | |
| 3.1 Parenteral | 1 | Risk Ratio (M‐H, Fixed, 95% CI) | 0.0 [0.0, 0.0] | |
| 4 Fish oil vs control Show forest plot | 1 | Risk Ratio (M‐H, Fixed, 95% CI) | Totals not selected | |
| 4.1 Enteral | 1 | Risk Ratio (M‐H, Fixed, 95% CI) | 0.0 [0.0, 0.0] | |
| 5 Combined immunonutrients vs control Show forest plot | 4 | 163 | Risk Ratio (M‐H, Fixed, 95% CI) | 1.10 [0.47, 2.60] |
| 5.1 Enteral | 4 | 163 | Risk Ratio (M‐H, Fixed, 95% CI) | 1.10 [0.47, 2.60] |
| Outcome or subgroup title | No. of studies | No. of participants | Statistical method | Effect size |
| 1 Glutamine vs control Show forest plot | 7 | 255 | Mean Difference (IV, Fixed, 95% CI) | ‐5.65 [‐8.09, ‐3.22] |
| 1.1 Enteral | 5 | 199 | Mean Difference (IV, Fixed, 95% CI) | ‐6.29 [‐9.12, ‐3.46] |
| 1.2 Parenteral | 2 | 56 | Mean Difference (IV, Fixed, 95% CI) | ‐3.84 [‐8.63, 0.95] |
| 2 Ornithine α‐ketoglutarate vs control Show forest plot | 1 | Mean Difference (IV, Fixed, 95% CI) | Totals not selected | |
| 2.1 Enteral | 1 | Mean Difference (IV, Fixed, 95% CI) | 0.0 [0.0, 0.0] | |
| 3 Branched‐chain amino acids Show forest plot | 1 | Mean Difference (IV, Fixed, 95% CI) | Totals not selected | |
| 3.1 Parenteral | 1 | Mean Difference (IV, Fixed, 95% CI) | 0.0 [0.0, 0.0] | |
| 4 Fish oil vs control Show forest plot | 1 | Mean Difference (IV, Fixed, 95% CI) | Totals not selected | |
| 4.1 Enteral | 1 | Mean Difference (IV, Fixed, 95% CI) | 0.0 [0.0, 0.0] | |
| 5 Combined immunonutrients vs control Show forest plot | 3 | 113 | Mean Difference (IV, Fixed, 95% CI) | 1.93 [‐4.41, 8.28] |
| 5.1 Enteral | 3 | 113 | Mean Difference (IV, Fixed, 95% CI) | 1.93 [‐4.41, 8.28] |
| Outcome or subgroup title | No. of studies | No. of participants | Statistical method | Effect size |
| 1 Glutamine vs control Show forest plot | 2 | 81 | Risk Ratio (M‐H, Fixed, 95% CI) | 0.42 [0.16, 1.06] |
| 1.1 Enteral | 2 | 81 | Risk Ratio (M‐H, Fixed, 95% CI) | 0.42 [0.16, 1.06] |
| 2 Ornithine α‐ketoglutarate vs control Show forest plot | 1 | Risk Ratio (M‐H, Fixed, 95% CI) | Totals not selected | |
| 2.1 Enteral | 1 | Risk Ratio (M‐H, Fixed, 95% CI) | 0.0 [0.0, 0.0] | |
| 3 Combined immunonutrients vs control Show forest plot | 3 | 122 | Risk Ratio (M‐H, Fixed, 95% CI) | 0.79 [0.51, 1.20] |
| 3.1 Enteral | 3 | 122 | Risk Ratio (M‐H, Fixed, 95% CI) | 0.79 [0.51, 1.20] |
| Outcome or subgroup title | No. of studies | No. of participants | Statistical method | Effect size |
| 1 Glutamine vs control Show forest plot | 2 | 67 | Odds Ratio (M‐H, Fixed, 95% CI) | 0.73 [0.27, 1.95] |
| 1.1 Bacteraemia | 2 | 67 | Odds Ratio (M‐H, Fixed, 95% CI) | 0.73 [0.27, 1.95] |
| 2 Fish oil vs control Show forest plot | 1 | Risk Ratio (M‐H, Fixed, 95% CI) | Totals not selected | |
| 2.1 Pneumonia | 1 | Risk Ratio (M‐H, Fixed, 95% CI) | 0.0 [0.0, 0.0] | |
| 3 Combined immunonutrients vs control Show forest plot | 3 | 266 | Risk Ratio (M‐H, Fixed, 95% CI) | 1.16 [0.86, 1.57] |
| 3.1 Pneumonia | 3 | 122 | Risk Ratio (M‐H, Fixed, 95% CI) | 0.83 [0.59, 1.15] |
| 3.2 Urinary tract infection | 2 | 72 | Risk Ratio (M‐H, Fixed, 95% CI) | 2.46 [0.98, 6.20] |
| 3.3 Bacteraemia | 2 | 72 | Risk Ratio (M‐H, Fixed, 95% CI) | 1.77 [0.81, 3.88] |