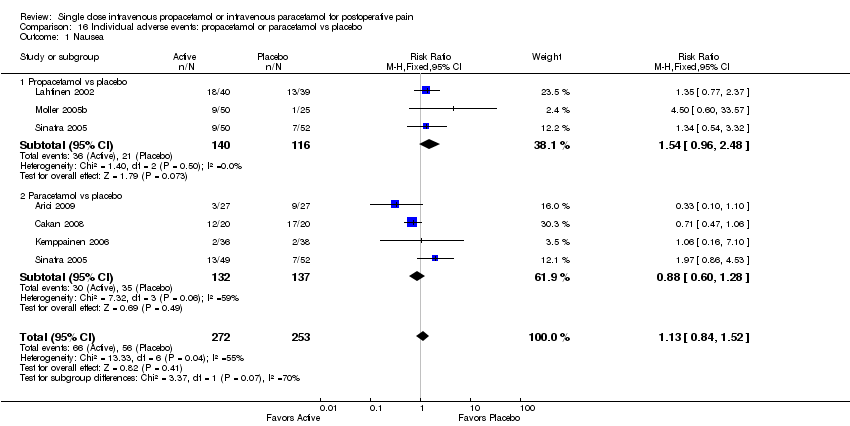
| 1 Nausea Show forest plot | 6 | 525 | Risk Ratio (M‐H, Fixed, 95% CI) | 1.13 [0.84, 1.52] |
|
| 1.1 Propacetamol vs placebo | 3 | 256 | Risk Ratio (M‐H, Fixed, 95% CI) | 1.54 [0.96, 2.48] |
| 1.2 Paracetamol vs placebo | 4 | 269 | Risk Ratio (M‐H, Fixed, 95% CI) | 0.88 [0.60, 1.28] |
| 2 Vomiting Show forest plot | 6 | 672 | Risk Ratio (M‐H, Fixed, 95% CI) | 0.85 [0.58, 1.25] |
|
| 2.1 Propacetamol vs placebo | 3 | 403 | Risk Ratio (M‐H, Fixed, 95% CI) | 1.46 [0.71, 3.00] |
| 2.2 Paracetamol vs placebo | 4 | 269 | Risk Ratio (M‐H, Fixed, 95% CI) | 0.65 [0.41, 1.04] |
| 3 Nausea/vomiting Show forest plot | 7 | 949 | Risk Ratio (M‐H, Fixed, 95% CI) | 0.91 [0.75, 1.11] |
|
| 3.1 Propacetamol vs placebo | 6 | 873 | Risk Ratio (M‐H, Fixed, 95% CI) | 0.88 [0.72, 1.08] |
| 3.2 Paracetamol vs placebo | 1 | 76 | Risk Ratio (M‐H, Fixed, 95% CI) | 1.43 [0.61, 3.36] |
| 4 Headache Show forest plot | 6 | 778 | Risk Ratio (M‐H, Fixed, 95% CI) | 1.03 [0.53, 2.01] |
|
| 4.1 Propacetamol vs placebo | 3 | 398 | Risk Ratio (M‐H, Fixed, 95% CI) | 1.31 [0.37, 4.57] |
| 4.2 Paracetamol vs placebo | 4 | 380 | Risk Ratio (M‐H, Fixed, 95% CI) | 0.94 [0.43, 2.08] |
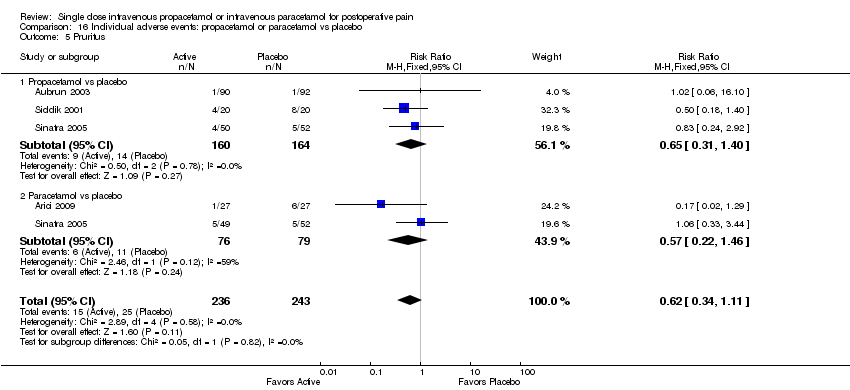
| 5 Pruritus Show forest plot | 4 | 479 | Risk Ratio (M‐H, Fixed, 95% CI) | 0.62 [0.34, 1.11] |
|
| 5.1 Propacetamol vs placebo | 3 | 324 | Risk Ratio (M‐H, Fixed, 95% CI) | 0.65 [0.31, 1.40] |
| 5.2 Paracetamol vs placebo | 2 | 155 | Risk Ratio (M‐H, Fixed, 95% CI) | 0.57 [0.22, 1.46] |
| 6 Respiratory depression Show forest plot | 3 | 640 | Risk Ratio (M‐H, Fixed, 95% CI) | 0.85 [0.28, 2.60] |
|
| 6.1 Propacetamol vs placebo | 3 | 640 | Risk Ratio (M‐H, Fixed, 95% CI) | 0.85 [0.28, 2.60] |
| 7 Sedation Show forest plot | 6 | 339 | Risk Ratio (M‐H, Fixed, 95% CI) | 1.12 [0.71, 1.78] |
|
| 7.1 Propacetamol vs placebo | 4 | 225 | Risk Ratio (M‐H, Fixed, 95% CI) | 1.05 [0.65, 1.69] |
| 7.2 Paracetamol vs placebo | 2 | 114 | Risk Ratio (M‐H, Fixed, 95% CI) | 1.71 [0.41, 7.07] |
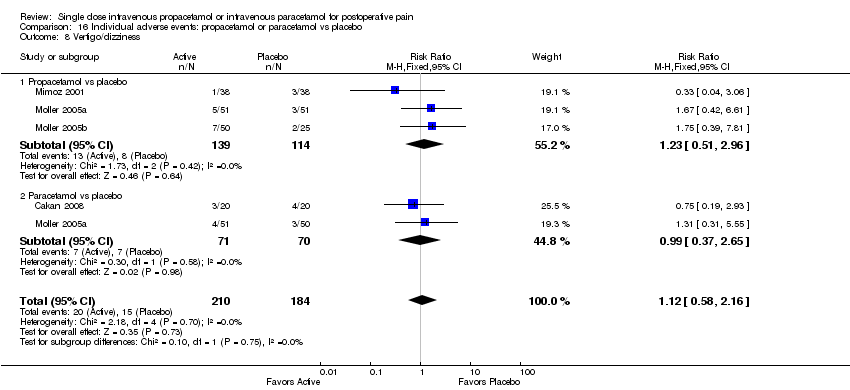
| 8 Vertigo/dizziness Show forest plot | 4 | 394 | Risk Ratio (M‐H, Fixed, 95% CI) | 1.12 [0.58, 2.16] |
|
| 8.1 Propacetamol vs placebo | 3 | 253 | Risk Ratio (M‐H, Fixed, 95% CI) | 1.23 [0.51, 2.96] |
| 8.2 Paracetamol vs placebo | 2 | 141 | Risk Ratio (M‐H, Fixed, 95% CI) | 0.99 [0.37, 2.65] |
| 9 Fatigue Show forest plot | 3 | 442 | Risk Ratio (M‐H, Fixed, 95% CI) | 0.88 [0.43, 1.78] |
|
| 9.1 Propacetamol vs placebo | 2 | 176 | Risk Ratio (M‐H, Fixed, 95% CI) | 0.62 [0.22, 1.79] |
| 9.2 Paracetamol vs placebo | 2 | 266 | Risk Ratio (M‐H, Fixed, 95% CI) | 1.14 [0.43, 3.00] |
| 10 Fever Show forest plot | 1 | 203 | Risk Ratio (M‐H, Fixed, 95% CI) | 0.18 [0.04, 0.76] |
|
| 10.1 Propacetamol vs placebo | 1 | 102 | Risk Ratio (M‐H, Fixed, 95% CI) | 0.17 [0.02, 1.39] |
| 10.2 Paracetamol vs placebo | 1 | 101 | Risk Ratio (M‐H, Fixed, 95% CI) | 0.18 [0.02, 1.42] |
| 11 GI disorders: constipation, epigastric pain, abdominal distension Show forest plot | 2 | 162 | Risk Ratio (M‐H, Fixed, 95% CI) | 2.04 [0.59, 7.10] |
|
| 11.1 Propacetamol vs placebo | 2 | 162 | Risk Ratio (M‐H, Fixed, 95% CI) | 2.04 [0.59, 7.10] |
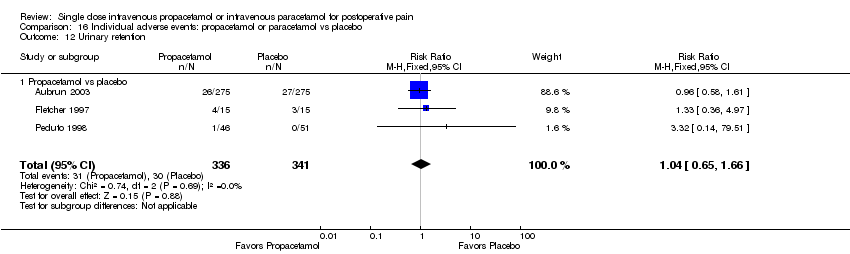
| 12 Urinary retention Show forest plot | 3 | 677 | Risk Ratio (M‐H, Fixed, 95% CI) | 1.04 [0.65, 1.66] |
|
| 12.1 Propacetamol vs placebo | 3 | 677 | Risk Ratio (M‐H, Fixed, 95% CI) | 1.04 [0.65, 1.66] |
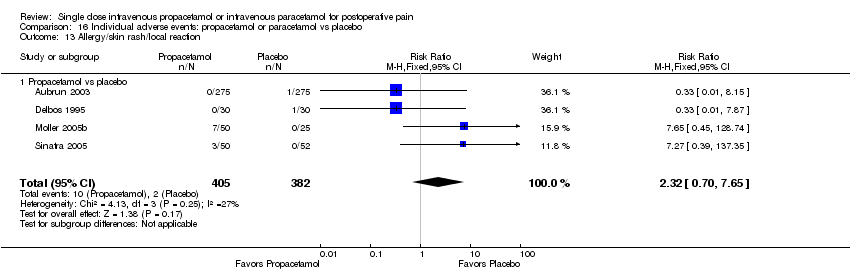
| 13 Allergy/skin rash/local reaction Show forest plot | 4 | 787 | Risk Ratio (M‐H, Fixed, 95% CI) | 2.32 [0.70, 7.65] |
|
| 13.1 Propacetamol vs placebo | 4 | 787 | Risk Ratio (M‐H, Fixed, 95% CI) | 2.32 [0.70, 7.65] |
| 14 Heart rate disorders Show forest plot | 1 | 76 | Risk Ratio (M‐H, Fixed, 95% CI) | 0.33 [0.01, 7.93] |
|
| 14.1 Propacetamol vs placebo | 1 | 76 | Risk Ratio (M‐H, Fixed, 95% CI) | 0.33 [0.01, 7.93] |
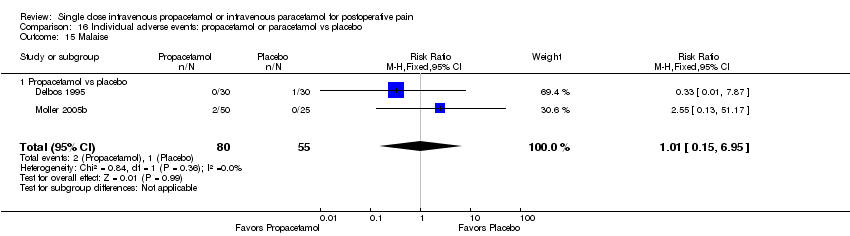
| 15 Malaise Show forest plot | 2 | 135 | Risk Ratio (M‐H, Fixed, 95% CI) | 1.01 [0.15, 6.95] |
|
| 15.1 Propacetamol vs placebo | 2 | 135 | Risk Ratio (M‐H, Fixed, 95% CI) | 1.01 [0.15, 6.95] |
| 16 Bleeding Show forest plot | 3 | 318 | Risk Ratio (M‐H, Fixed, 95% CI) | 1.15 [0.61, 2.16] |
|
| 16.1 Propacetamol vs placebo | 1 | 79 | Risk Ratio (M‐H, Fixed, 95% CI) | 1.3 [0.50, 3.40] |
| 16.2 Paracetamol vs placebo | 2 | 239 | Risk Ratio (M‐H, Fixed, 95% CI) | 1.04 [0.45, 2.41] |
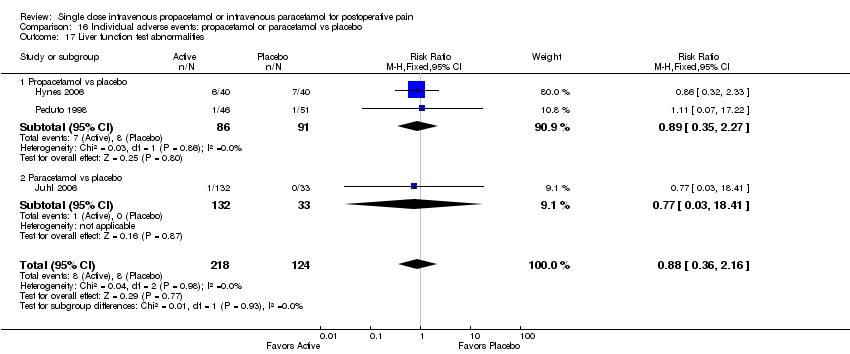
| 17 Liver function test abnormalities Show forest plot | 3 | 342 | Risk Ratio (M‐H, Fixed, 95% CI) | 0.88 [0.36, 2.16] |
|
| 17.1 Propacetamol vs placebo | 2 | 177 | Risk Ratio (M‐H, Fixed, 95% CI) | 0.89 [0.35, 2.27] |
| 17.2 Paracetamol vs placebo | 1 | 165 | Risk Ratio (M‐H, Fixed, 95% CI) | 0.77 [0.03, 18.41] |
| 18 Hypotension Show forest plot | 3 | 217 | Risk Ratio (M‐H, Fixed, 95% CI) | 1.03 [0.24, 4.39] |
|
| 18.1 Propacetamol vs placebo | 2 | 177 | Risk Ratio (M‐H, Fixed, 95% CI) | 3.16 [0.33, 29.74] |
| 18.2 Paracetamol vs placebo | 1 | 40 | Risk Ratio (M‐H, Fixed, 95% CI) | 0.2 [0.01, 3.92] |
| 19 AEs causing patient to withdraw from study Show forest plot | 2 | 263 | Risk Ratio (M‐H, Fixed, 95% CI) | 1.03 [0.29, 3.72] |
|
| 19.1 Propacetamol vs placebo | 2 | 162 | Risk Ratio (M‐H, Fixed, 95% CI) | 1.36 [0.32, 5.89] |
| 19.2 Paracetamol vs placebo | 1 | 101 | Risk Ratio (M‐H, Fixed, 95% CI) | 0.35 [0.01, 8.47] |