| 1 Shoulder function Show forest plot | 1 | | Mean Difference (IV, Fixed, 95% CI) | Totals not selected |
|
| 1.1 Constant score (at end of follow‐up: 6 ‐ 12 months) | 1 | | Mean Difference (IV, Fixed, 95% CI) | 0.0 [0.0, 0.0] |
| 1.2 ASES score (at end of follow‐up: 6 ‐ 12 months) | 1 | | Mean Difference (IV, Fixed, 95% CI) | 0.0 [0.0, 0.0] |
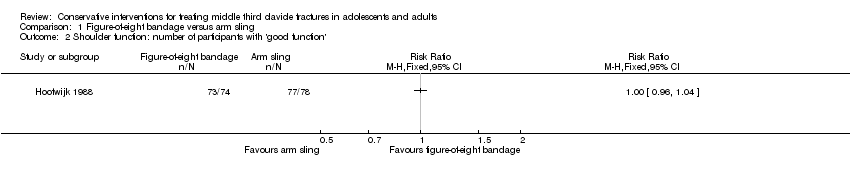
| 2 Shoulder function: number of participants with 'good function' Show forest plot | 1 | | Risk Ratio (M‐H, Fixed, 95% CI) | Totals not selected |
|
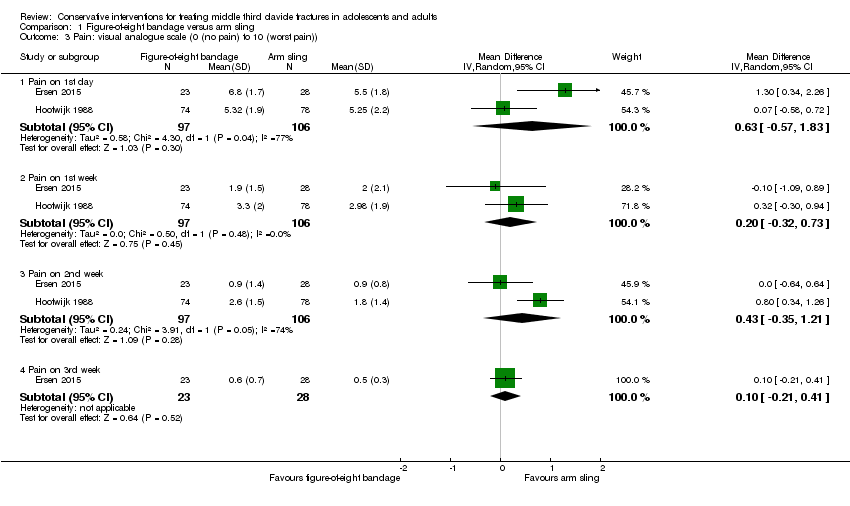
| 3 Pain: visual analogue scale (0 (no pain) to 10 (worst pain)) Show forest plot | 2 | | Mean Difference (IV, Random, 95% CI) | Subtotals only |
|
| 3.1 Pain on 1st day | 2 | 203 | Mean Difference (IV, Random, 95% CI) | 0.63 [‐0.57, 1.83] |
| 3.2 Pain on 1st week | 2 | 203 | Mean Difference (IV, Random, 95% CI) | 0.20 [‐0.32, 0.73] |
| 3.3 Pain on 2nd week | 2 | 203 | Mean Difference (IV, Random, 95% CI) | 0.43 [‐0.35, 1.21] |
| 3.4 Pain on 3rd week | 1 | 51 | Mean Difference (IV, Random, 95% CI) | 0.10 [‐0.21, 0.41] |
| 4 Pain: duration of painkiller consumption (days) Show forest plot | 1 | | Mean Difference (IV, Fixed, 95% CI) | Totals not selected |
|
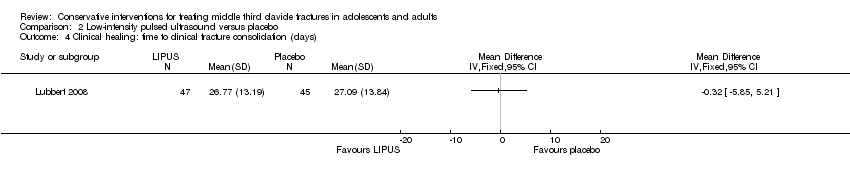
| 5 Clinical healing: time to clinical fracture consolidation (weeks) Show forest plot | 1 | | Mean Difference (IV, Fixed, 95% CI) | Totals not selected |
|
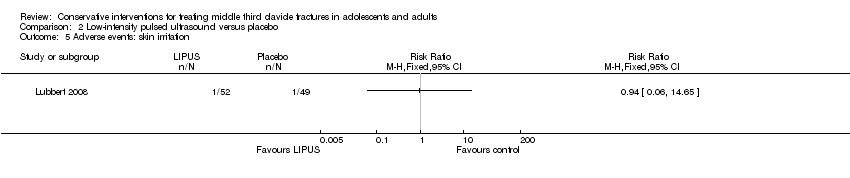
| 6 Adverse event Show forest plot | 3 | | Risk Ratio (M‐H, Fixed, 95% CI) | Subtotals only |
|
| 6.1 Poor cosmetic appearance post fracture healing | 1 | 152 | Risk Ratio (M‐H, Fixed, 95% CI) | 1.32 [0.55, 3.16] |
| 6.2 Change in allocated treatment due to pain and discomfort | 1 | 79 | Risk Ratio (M‐H, Fixed, 95% CI) | 3.02 [0.35, 25.83] |
| 6.3 Worsened fracture position on healing | 1 | 61 | Risk Ratio (M‐H, Fixed, 95% CI) | 0.60 [0.15, 2.44] |
| 6.4 Shortening > 15 mm | 1 | 51 | Risk Ratio (M‐H, Fixed, 95% CI) | 1.01 [0.35, 2.90] |
| 6.5 Non‐union | 3 | 264 | Risk Ratio (M‐H, Fixed, 95% CI) | 9.48 [0.52, 173.09] |
| 6.6 Permanent pain at mean 10 months | 1 | 152 | Risk Ratio (M‐H, Fixed, 95% CI) | 9.48 [0.52, 173.09] |
| 7 Time to return to previous activities (weeks) Show forest plot | 2 | | Mean Difference (IV, Fixed, 95% CI) | Subtotals only |
|
| 7.1 Resumption of school/work | 2 | 176 | Mean Difference (IV, Fixed, 95% CI) | ‐0.12 [‐0.69, 0.45] |
| 7.2 Resumption of sports activities | 1 | 104 | Mean Difference (IV, Fixed, 95% CI) | ‐0.60 [‐1.48, 0.28] |
| 8 Patient dissatisfaction with course of treatment Show forest plot | 2 | 112 | Risk Ratio (M‐H, Fixed, 95% CI) | 2.73 [1.03, 7.23] |
|