مقایسه شیمیدرمانی بهتنهایی در مقابل شیمیدرمانی همراه با پرتودرمانی در مدیریت درمانی بزرگسالان مبتلا به مرحله اولیه لنفوم هوچکین
Referencias
منابع مطالعات واردشده در این مرور
منابع مطالعات خارجشده از این مرور
منابع مطالعات در حال انجام
منابع اضافی
منابع دیگر نسخههای منتشرشده این مرور
Characteristics of studies
Characteristics of included studies [ordered by study ID]
| Methods | Randomised controlled trial with two arms:
Recruitment period:
Baseline patient's characteristics described Median follow‐up time:
No ITT analysis; more than 10% of the enrolled patients not evaluated Conducted by the Cancer and Leukemia Group B (CALGB), USA | |
| Participants | Inclusion criteria:
Exclusion criteria:
PS I, II:
Prognostic features: not reported Mean age:
Gender:
Baseline patient's characteristics: more male patients in chemotherapy plus radiotherapy arm; more patients with mediastinal mass in chemotherapy alone arm Histopathologic diagnosis: according to Rye modification of Lukes and Butler classification Country:
| |
| Interventions |
| |
| Outcomes |
| |
| Notes |
| |
| Risk of bias | ||
| Bias | Authors' judgement | Support for judgement |
| Random sequence generation (selection bias) | Unclear risk | "randomly allocated". |
| Allocation concealment (selection bias) | Unclear risk | Not reported. |
| Blinding (performance bias and detection bias) | Low risk | Patients not blinded. No information about blinding of the assessor. This is judged not to be a source of bias for overall survival. |
| Blinding (performance bias and detection bias) | Unclear risk | Patients not blinded. No information about blinding of the assessor. |
| Incomplete outcome data (attrition bias) | High risk | 22 months OS and response outcome: 18/55 missing from the outcome analysis; no information per study arm. This trial was considered not to have performed an ITT analysis in the subgroup analysis. |
| Selective reporting (reporting bias) | Unclear risk | Dates of relapse and deaths are given. Dates of progression not given nor information about censoring. No time‐ to‐ event outcomes calculated. No study protocol identified, therefore unclear if all the planned outcomes are reported. |
| Other bias | Unclear risk | Insufficient information to assess whether an important risk of bias exists. |
| Methods | Randomised controlled trial with three arms:
Recruitment period
Baseline patient's characteristics not reported (abstract publication) Median follow‐up:
ITT analysis Conducted by EORTC (European Organization for Research and Treatment of Cancer) and GELA (Groupe d'Etude des Lymphomes de l'Adulte); 111 institutions from 10 European countries involved | |
| Participants | Inclusion criteria:
Exclusion criteria:
Mean age (range):
Gender:
CS: patients with CS I‐II without bulky disease Prognostic features: all included patients with favourable risk factors Histopathologic diagnosis: not reported Country:
| |
| Interventions |
| |
| Outcomes |
| |
| Notes |
| |
| Risk of bias | ||
| Bias | Authors' judgement | Support for judgement |
| Random sequence generation (selection bias) | Unclear risk | Patients were randomly allocated. No further information available. |
| Allocation concealment (selection bias) | Unclear risk | No information available from the publications. |
| Blinding (performance bias and detection bias) | Low risk | Patients not blinded (not expected due to the treatment with radiotherapy). No information about blinding of the assessor. This is judged not to be a source of bias for overall survival. |
| Blinding (performance bias and detection bias) | Unclear risk | Patients and physicians not blinded (not expected due to the treatment with radiotherapy). No information about blinding of the assessor. |
| Incomplete outcome data (attrition bias) | Low risk | No withdrawals and protocol violations after randomisation reported. Analysis was performed on ITT basis and all randomised patients were included in the analysis. |
| Selective reporting (reporting bias) | Unclear risk | Rationale for the use of disease‐free survival not described. However all patients are in CR at the time of randomisation. Disease‐free survival should therefore be equivalent to progression‐free survival. Other progression outcomes that are more prone to bias are not used and not reported. Study protocol available, no planed outcomes stated. |
| Other bias | High risk | The chemotherapy alone arm ended early due to stopping rules. Unfortunately it was not possible to receive the data on patients receiving additional radiotherapy only up to the date the chemotherapy alone arm was stopped. This is known to increase the effect estimate of trials. In addition the data are preliminary. |
| Methods | See H10U | |
| Participants | See H10U | |
| Interventions | See H10U | |
| Outcomes | See H10U | |
| Notes | See H10U | |
| Risk of bias | ||
| Bias | Authors' judgement | Support for judgement |
| Random sequence generation (selection bias) | Low risk | "Minimization technique was used...". |
| Allocation concealment (selection bias) | Low risk | "Centrally randomly assigned to receive either...". |
| Blinding (performance bias and detection bias) | Low risk | Although the study is likely not to be blinded, this does not affect the outcome OS. |
| Blinding (performance bias and detection bias) | Low risk | The study did not address blinding of participants or physicians. Regarding the study design it is likely that there was no blinding. However, the outcome assessors were blinded. |
| Incomplete outcome data (attrition bias) | Low risk | No missing outcome data. |
| Selective reporting (reporting bias) | High risk | Study protocol available. Not all of the study’s pre‐specified secondary outcomes reported:
|
| Other bias | Unclear risk | Insufficient information to assess whether an important risk of bias exists. |
| Methods | Randomised controlled trial with two main groups (favourable (F) vs unfavourable (U) disease), each with two subgroups, one consisting of two arms, the other of one arm. Comparison of three treatment models in total. PET measurement after randomisation Subgroups: experimental arm (PET‐adapted therapy) vs standard treatment
The PET‐positive arms are not considered in this review Recruitment period:
Favourable:
Unfavourable:
Baseline patient's characteristics described Median follow‐up time:
No ITT analysis Conducted by the European Organisation for Research and Treatment of Cancer (EORTC) | |
| Participants | Inclusion criteria:
Exclusion criteria:
Mean age (range):
Gender:
CS I, II:
Country:
| |
| Interventions | Experimental:
Standard treatment:
FDG‐PET scans:
| |
| Outcomes | Primary outcome:
Secondary outcomes:
| |
| Notes | Source of funding not reported | |
| Risk of bias | ||
| Bias | Authors' judgement | Support for judgement |
| Random sequence generation (selection bias) | Low risk | "Minimization technique was used...". |
| Allocation concealment (selection bias) | Low risk | "Centrally randomly assigned to receive either...". |
| Blinding (performance bias and detection bias) | Low risk | Although the study is likely not to be blinded, this does not affect the outcome OS. |
| Blinding (performance bias and detection bias) | Low risk | The study did not address blinding of participants or physicians. Regarding the study design it is likely that there was no blinding. However, the outcome assessors were blinded. |
| Incomplete outcome data (attrition bias) | Low risk | No missing outcome data. |
| Selective reporting (reporting bias) | High risk | Study protocol available. Not all of the study’s pre‐specified secondary outcomes reported:
|
| Other bias | Unclear risk | Insufficient information to assess whether an important risk of bias exists. |
| Methods | Randomised controlled trial with three arms: Chemotherapy alone arm and chemotherapy plus radiotherapy or radiotherapy alone arm
Recruitment period:
Baseline patient characteristics described Median follow‐up time:
ITT‐Analysis Conducted by National Cancer Institute of Canada Clinical Trials Group (NCIC‐CTG) in 1994. Collaboration with the Eastern Cooperative Oncology Group (ECOG) in 1996 | |
| Participants | Inclusion criteria:
Exclusion criteria:
399 patients included in the analyses
Patients not receiving therapy as randomised (41 of 399):
Patients excluded before randomisation: 6 Mean age:
Gender:
Country:
| |
| Interventions | Chemotherapy alone:
Chemotherapy plus radiotherapy:
| |
| Outcomes | Primary outcome:
Secondary outcomes:
| |
| Notes |
| |
| Risk of bias | ||
| Bias | Authors' judgement | Support for judgement |
| Random sequence generation (selection bias) | Low risk | "The HD.6 trial was a [...] randomized, controlled trial". "The process for randomization was concealed and was performed by means of a computer‐generated random‐number sequence that was held at the central office of the NCIC Clinical Trials Group". |
| Allocation concealment (selection bias) | Low risk | "The process for randomization was concealed and was performed by means of a computer‐generated random‐number sequence that was held at the central office of the NCIC Clinical Trials Group". |
| Blinding (performance bias and detection bias) | Low risk | Patients not blinded. No information about blinding of the assessor. This is judged not to be a source of bias for overall survival. |
| Blinding (performance bias and detection bias) | Unclear risk | Patients not blinded. No information about blinding of the assessor. |
| Incomplete outcome data (attrition bias) | Low risk | "All primary analyses were performed on data from the modified intention‐to‐treat population". 6 of 405 randomised patients were "subsequently considered to be ineligible on the basis of prerandomization data". |
| Selective reporting (reporting bias) | High risk | Study protocol available. Not all of the study’s pre‐specified secondary outcomes reported. Not all of the study’s pre‐specified secondary outcomes reported:
|
| Other bias | High risk | 41 of 399 patients not received therapy as randomised. |
| Methods | Randomised controlled trial with three arms:
Recruitment period:
Median follow‐up time:
No ITT analysis; less than 10% of enrolled patients not evaluated Conducted at Oncology Hospital, National Medical Center, Mexico | |
| Participants | Inclusion criteria:
Exclusion criteria:
CS I, II:
Prognostic features not reported Mean age (range):
Gender:
Country:
| |
| Interventions |
| |
| Outcomes |
| |
| Notes |
| |
| Risk of bias | ||
| Bias | Authors' judgement | Support for judgement |
| Random sequence generation (selection bias) | Unclear risk | "a prospective randomised trial" No further information available. |
| Allocation concealment (selection bias) | Unclear risk | No information available. |
| Blinding (performance bias and detection bias) | Low risk | Patients not blinded. No information about blinding of the assessor. This is judged not to be a source of bias for overall survival. |
| Blinding (performance bias and detection bias) | Unclear risk | Patients and physicians not blinded. No information about blinding of the assessor. |
| Incomplete outcome data (attrition bias) | Low risk | 12 years OS and tumour control outcome: 20/327 missing from the outcome analysis; no information per study arm. The authors do not give any further information about the method of analysis (e.g. ITT ) We do not believe that these few missing patients induced large bias in the analysis, the information is not available by study arm. For subgroup analysis this trial was considered to have no ITT analysis. |
| Selective reporting (reporting bias) | Unclear risk | In the methods section: "Disease‐free survival was calculated for CR patients from the beginning of treatment until clinical or radiological and biopsy proven relapse." No information about patients who did not achieve CR. However, the denominator in the results section is the full population, not only patients in CR. Both disease‐free survival and relapse‐free survival were calculated but only disease‐free survival was reported. Due to the information given about toxic deaths, overall survival and disease‐free survival, we assumed that relapse‐free survival would also have been statistically significant and possibly similar to disease‐free survival, thus not resulting in any bias. In addition, disease‐free survival is preferable to relapse‐free survival as it includes deaths. For these reasons, we choose "unclear" and not "no". There is no information about progression‐free survival. No study protocol available. |
| Other bias | Unclear risk | Insufficient information to assess whether an important risk of bias exists. |
| Methods | Randomised controlled with two arms:
Recruitment period:
Median follow‐up time:
ITT analysis for overall survival; no ITT analysis for response outcomes Conducted by MSKCC (Memorial Sloan‐Kettering Cancer Center), USA | |
| Participants | Inclusion criteria:
Exclusion criteria:
CS I, II:
CS III:
Prognostic features not reported Median age:
Gender:
Country:
| |
| Interventions |
| |
| Outcomes |
| |
| Notes |
| |
| Risk of bias | ||
| Bias | Authors' judgement | Support for judgement |
| Random sequence generation (selection bias) | Low risk | Sequence generation was not reported. "Randomisation was performed after a check for eligibility. Patients were stratified according to clinical stage (IA or IIA, IIIA, I B or IIB)." Presumably the randomisation was adequate. |
| Allocation concealment (selection bias) | Low risk | "Patients were enrolled by telephone call or fax to the MSKCC Clinical Trials Office". |
| Blinding (performance bias and detection bias) | Low risk | Patients and physicians not blinded. No information about blinding of the assessor. This is judged not to be a source of bias for overall survival. |
| Blinding (performance bias and detection bias) | Unclear risk | Patients and physicians not blinded. No information about blinding of the assessor. |
| Incomplete outcome data (attrition bias) | Low risk | OS: all patients included in the analysis, ITT‐analysis Tumour control: all patients included in the analysis, ITT‐analysis Response rates: 7/76 excluded from chemotherapy alone arm and 7/76 excluded from chemotherapy plus radiotherapy arm; three lost to follow‐up before completion of six cycles of chemotherapy and 11 stage IA patients with no measurable disease prior to treatment. |
| Selective reporting (reporting bias) | Unclear risk | Choice of progression outcome not described ‐ both disease‐free survival and freedom from progression evaluated; freedom from progression was closer to our definition of PFS and was thus used in the analyses. No study protocol available. |
| Other bias | High risk | 11 patients randomised to radiotherapy never received radiotherapy: 6 refused, 4 progressed on chemotherapy prior to receiving radiotherapy, 1 never received radiotherapy because of bleomycin induced toxicity to radiotherapy. |
| Methods | Randomised controlled trial with two arms:
Recruitment period:
Median follow‐up time:
Information about not randomised patients provided ITT analysis for OS and PFS | |
| Participants | Inclusion criteria:
Exclusion criteria:
420 patients randomised:
Patients not receiving therapy as randomised (28 of 420)
Patients not randomised (182):
Mean age of all 602 patients registered into the RAPID trial:
Gender of all 602 patients registered into the RAPID trial:
Country:
| |
| Interventions | Induction chemotherapy (all patients):
| |
| Outcomes |
| |
| Notes |
| |
| Risk of bias | ||
| Bias | Authors' judgement | Support for judgement |
| Random sequence generation (selection bias) | Unclear risk | Insufficient information about the sequence generation progress. ("This is an ongoing randomized, controlled, non‐inferiority trial (...)"). |
| Allocation concealment (selection bias) | Low risk | "Block randomization was performed at the Cancer Research UK and University College London Cancer Trials Centre; no stratification factors were used". |
| Blinding (performance bias and detection bias) | Low risk | Although the study is likely not to be blinded, this does not affect the outcome OS. |
| Blinding (performance bias and detection bias) | Unclear risk | The study did not address blinding of participants or physicians. Regarding the study design it is likely that there was no blinding. |
| Incomplete outcome data (attrition bias) | Low risk | All patients included in the analysis, ITT‐analysis |
| Selective reporting (reporting bias) | High risk | Study protocol available. Not all of the study’s pre‐specified secondary outcomes reported:
|
| Other bias | High risk | 28 of 420 patients did not received treatment as randomised: 2 received radiotherapy in chemotherapy alone arm and 26 did not received radiotherapy in the chemotherapy plus radiotherapy arm. These patients were still included in the analysis. In the chemotherapy plus radiotherapy arm 5 of the 8 deaths occurred in patients who received no radiotherapy. |
ABVD: adriamycin, bleomycin, vinblastine, and dacarbazine
CS: clinical stage
CVPP: cyclophosphamide, vinblastine , procarbazine , prednisone
EBVP: epirubicin , bleomycin , vinblastine , prednisone
EF: extended‐field radiotherapy
ESR: erythrocyte sedimentation rate
IF: involved‐field radiotherapy
ITT: intent i on‐ to‐treat
MF: mantle‐field radiotherapy
OS: overall survival
PET: positron emission tomography
PS: pathologic stage
Characteristics of excluded studies [ordered by study ID]
| Study | Reason for exclusion |
| Comparison arms not treated with chemotherapy alone or chemotherapy plus radiotherapy; all included patients received chemotherapy plus radiotherapy. Less than 80% of the patients had early stage Hodgkin lymphoma; only 25% of the included patients had early stage Hodgkin lymphoma. | |
| Less than 80% of the patients had early stage Hodgkin lymphoma; only 6 of the 576 included patients had Hodgkin lymphoma. | |
| Comparison arms not treated with chemotherapy alone or chemotherapy plus radiotherapy; compared interventions radiotherapy alone versus chemotherapy plus radiotherapy. | |
| Comparison arms not treated with chemotherapy alone or chemotherapy plus radiotherapy; all included patients received chemotherapy plus radiotherapy. | |
| Not a randomised controlled trial; a review article. | |
| Not a randomised controlled trial; a review article. | |
| Comparison arms not treated with chemotherapy alone or chemotherapy plus radiotherapy; all patients received chemotherapy plus radiotherapy. | |
| Comparison arms not treated with chemotherapy alone or chemotherapy plus radiotherapy and different chemotherapy regimens used in comparison arms. | |
| Comparison arms not treated with chemotherapy alone or chemotherapy plus radiotherapy; all patients received radiotherapy. Unfavourable patients of the EORTC‐GELA H9 trial. | |
| Only children are included in this trial. | |
| Evaluation of pulmonary symptoms in patients randomised to MSKCC trials 1989 to 1993. Not a report of one specific trial Relevant patients presumably analysed in MSKCC trial #90‐44 (recruitment 1990‐2000) Only 45 patients with the relevant comparison included 30: 6 X ABVD 15: 6 X ABVD plus EF radiotherapy No mortality data given Adverse events included only pulmonary function and included 15 patients not in the relevant randomised comparison. During chemotherapy 53% of patients had symptoms of cough or dyspnoea on exertion At the end of follow‐up (˜ 1 year after treatment), 18% (chemotherapy alone) vs. 30% (chemotherapy plus radiotherapy) reported persistent symptoms (P = 0.36).(See also Hirsch 1996). | |
| Evaluation of pulmonary symptoms in patients randomised to MSKCC trials 1989 to 1993. Not a report of one specific trial Relevant patients presumably analysed in MSKCC trial #90‐44 (recruitment 1990‐2000) Only 45 patients with the relevant comparison included 30: 6 X ABVD 15: 6 X ABVD plus EF radiotherapy No mortality data given Adverse events included only pulmonary function and included 15 patients not in the relevant randomised comparison. During chemotherapy 53% of patients had symptoms of cough or dyspnoea on exertion At the end of follow‐up (˜ 1 year after treatment), 18% (chemotherapy alone) vs. 30% (chemotherapy plus radiotherapy) reported persistent symptoms (P = 0.36). | |
| Less than 80% of the patients had early stage Hodgkin lymphoma; only 42% of the included patients had early stage Hodgkin lymphoma. | |
| Comparison arms not treated with chemotherapy alone or chemotherapy plus radiotherapy; compared interventions radiotherapy alone versus chemotherapy plus radiotherapy. | |
| Not a randomised controlled trial; a retrospective data analysis of patients' records with Hodgkin lymphoma. | |
| Less than 80% of the patients had early stage Hodgkin lymphoma; 69% of the included patients had early stage Hodgkin lymphoma. No subgroup information available. (See also Kung 2006). | |
| Less than 80% of the patients had early stage Hodgkin lymphoma; 69% of the included patients had early stage Hodgkin lymphoma. No subgroup information available. | |
| Not a randomised controlled trial. | |
| Less than 80% of the patients had early stage Hodgkin lymphoma; 55% of the included patients had early stage Hodgkin lymphoma. | |
| Only children are included in this trial. | |
| Not a randomised controlled trial; a review article about the trials (Pavlovsky 1988; O'Dwyer 1985). | |
| Not a randomised controlled trial. | |
| Only children and adolescents are included in this trial. No subgroup information regarding age available. Less than 80% of the patients had early stage Hodgkin lymphoma; 72% of the included patients had early stage Hodgkin lymphoma. | |
| Comparison arms not treated with chemotherapy alone or chemotherapy plus radiotherapy; compared interventions radiotherapy alone versus chemotherapy plus radiotherapy. | |
| Less than 80% of the patients with early stage Hodgkin lymphoma; 69% of the evaluable patients with early stage Hodgkin lymphoma. Duplicate publication (see also O'Dwyer 1985). | |
| Less than 80% of the patients had early stage Hodgkin lymphoma; 69% of the evaluable patients had early stage Hodgkin lymphoma. | |
| The GATLA 9‐H‐77 trial was included in the first version of the review. The trial did not include a large enough proportion of adults (124 patients (45%) are children < 16 years) and data for this subgroup were not available. | |
| Comparison arms not treated with chemotherapy alone or chemotherapy plus radiotherapy. | |
| Less than 80% of the patients had early stage Hodgkin lymphoma; 66% of the included patients had early stage Hodgkin lymphoma. No subgroup information available. | |
| Comparison arms not treated with chemotherapy alone or chemotherapy plus radiotherapy; compared interventions radiotherapy alone versus chemotherapy plus radiotherapy. | |
| Not a randomised controlled trial; a review article about the trial Wolden 2012. | |
| Comparison arms not treated with chemotherapy alone or chemotherapy plus radiotherapy; compared interventions radiotherapy versus radiotherapy. | |
| Comparison arms not treated with chemotherapy alone or chemotherapy plus radiotherapy; all patients received chemotherapy plus radiotherapy. | |
| Comparison arms not treated with chemotherapy alone or chemotherapy plus radiotherapy; all patients received chemotherapy plus radiotherapy. Duplicate publication (see also Rüffer 1998); all patients received chemotherapy plus radiotherapy. | |
| Not a randomised controlled trial; a review article. | |
| Comparison arms not treated with chemotherapy alone or chemotherapy plus radiotherapy; all patients received chemotherapy plus radiotherapy. | |
| Comparison arms not treated with chemotherapy alone or chemotherapy plus radiotherapy; compared interventions radiotherapy alone versus chemotherapy plus radiotherapy. | |
| Comparison arms not treated with chemotherapy alone or chemotherapy plus radiotherapy; all patients received radiotherapy. Unfavourable patients of the EORTC‐GELA H9 trial. | |
| Only children and adolescents are included in this trial. No subgroup information regarding age available. | |
| Only children and adolescents are included in this trial. No subgroup information regarding age available. Less than 80% of the patients had early stage Hodgkin lymphoma; 72% of the included patients had early stage Hodgkin lymphoma. Duplicate publication (see also Nachman 2002). |
ABVD: adriamycin, bleomycin, vinblastine, and dacarbazine
EF: e xtended‐field radio therapy
Characteristics of ongoing studies [ordered by study ID]
| Trial name or title | Official title: HD16 for early stages ‐ treatment optimization trial in the first‐line treatment of early stage Hodgkin lymphoma; treatment stratification by means of FDG‐PET |
| Methods | Randomised controlled trial, non‐inferiority design |
| Participants | 18 years to 75 years Inclusion criteria:
Exclusion criteria:
|
| Interventions | Arm 1: 2 cycles ABVD followed by 30 Gy IF‐radiotherapy irrespective of FDG‐PET results after chemotherapy Arm 2: 2 cycles ABVD followed by 30 Gy IF‐radiotherapy if FDG‐PET is positive after chemotherapy; 2 cycles ABVD and treatment stop if FDG‐PET is negative after chemotherapy |
| Outcomes |
|
| Starting date | unclear |
| Contact information | Michael Fuchs; GHSG@uk‐koeln.de |
| Notes | clinicaltrials.gov identifier NCT00736320; 1100 patients to be enrolled |
| Trial name or title | Official title: HD17 for intermediate stages treatment optimization trial in the firstline treatment of intermediate stage Hodgkin lymphoma |
| Methods | Randomised controlled trial |
| Participants | 18 years to 60 years Inclusion criteria:
Exclusion criteria:
|
| Interventions | Arm 1: 2 cycles BEACOPP escalated plus 2 cycles ABVD followed by 30 Gy IF‐RT irrespective of FDG‐PET results after chemotherapy Arm 2: 2 cycles BEACOPP escalated plus 2 cycles ABVD followed by 30 Gy IN‐RT if FDG‐PET is positive after chemotherapy; 2 cycles BEACOPP escalated plus 2 cycles ABVD and treatment stop if FDG‐PET is negative after chemotherapy |
| Outcomes |
|
| Starting date | December 2011 |
| Contact information | Michael Fuchs; GHSG@uk‐koeln.de |
| Notes | clinicaltrials.gov identifier NCT01356680; 1100 patients to be enrolled |
| Trial name or title | Official title: Early salvage with high dose chemotherapy and stem cell transplantation in advanced stage Hodgkin's lymphoma patients with positive PET after two courses of ABVD (PET‐2 positive) and comparison of RT versus no RT in PET‐2 negative patients |
| Methods | Randomised controlled trial |
| Participants | 18 years to 70 years Inclusion criteria:
Exclusion criteria:
|
| Interventions | Arm 1: 2 courses of ABVD. Early restaging with FDG‐PET scan (PET‐2). The subsequent treatment will be as it follows:
Arm 2: 2 courses of ABVD. Early restaging with FDG‐PET scan (PET‐2). The subsequent treatment will be as it follows:
|
| Outcomes |
|
| Starting date | September 2008 |
| Contact information | Fondazione Italiana Linfomi ONLUS |
| Notes | clinicaltrials.gov identifier NCT00784537; 520 patients to be enrolled |
ABVD: adriamycin, bleomycin, vinblastine, and dacarbazine
A LT: alani ne transaminase
AST: aspartate transaminase
BEACOPP: Bleomycin, Etoposide, Adriamycin, Cyclophosphamide, Oncovin, Procarbazine, Prednisolone
CS: clinical stage
CT: computed tomography ESR: erythrocyte sedimentation rate
FDG‐PET : fluorodeoxyglucose positron emission tomography
IF ‐RT : involved‐field radiotherapy
Data and analyses
| Outcome or subgroup title | No. of studies | No. of participants | Statistical method | Effect size |
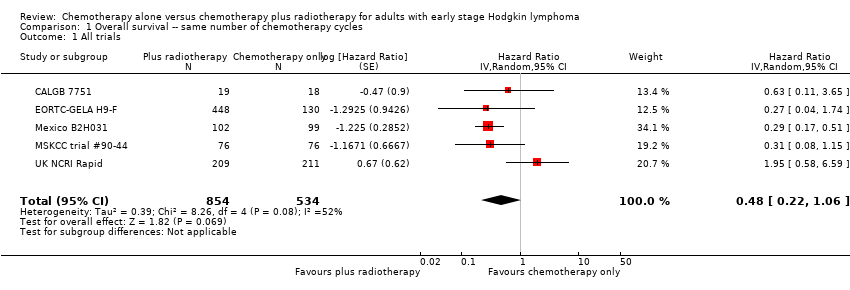
| 1 All trials Show forest plot | 5 | 1388 | Hazard Ratio (Random, 95% CI) | 0.48 [0.22, 1.06] |
| Analysis 1.1  Comparison 1 Overall survival ‐‐ same number of chemotherapy cycles, Outcome 1 All trials. | ||||
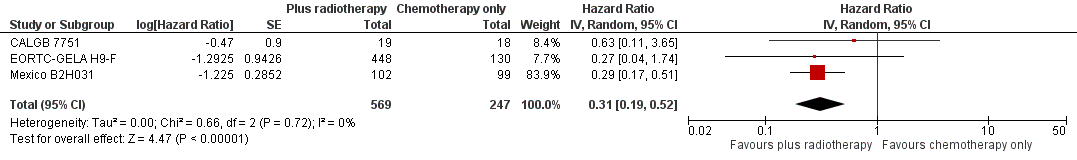
| 2 Proportion of patients early favourable Show forest plot | 4 | 968 | Hazard Ratio (Random, 95% CI) | 0.31 [0.19, 0.50] |
| Analysis 1.2  Comparison 1 Overall survival ‐‐ same number of chemotherapy cycles, Outcome 2 Proportion of patients early favourable. | ||||
| 2.1 All patients early favourable | 1 | 578 | Hazard Ratio (Random, 95% CI) | 0.27 [0.04, 1.74] |
| 2.2 Mixed patient population (˜ 30 to 50% patients early unfavourable) | 1 | 152 | Hazard Ratio (Random, 95% CI) | 0.31 [0.08, 1.15] |
| 2.3 All patients early unfavourable | 2 | 238 | Hazard Ratio (Random, 95% CI) | 0.31 [0.18, 0.54] |
| 3 Bulky vs non‐bulky Show forest plot | 4 | 1351 | Hazard Ratio (Random, 95% CI) | 0.47 [0.18, 1.19] |
| Analysis 1.3 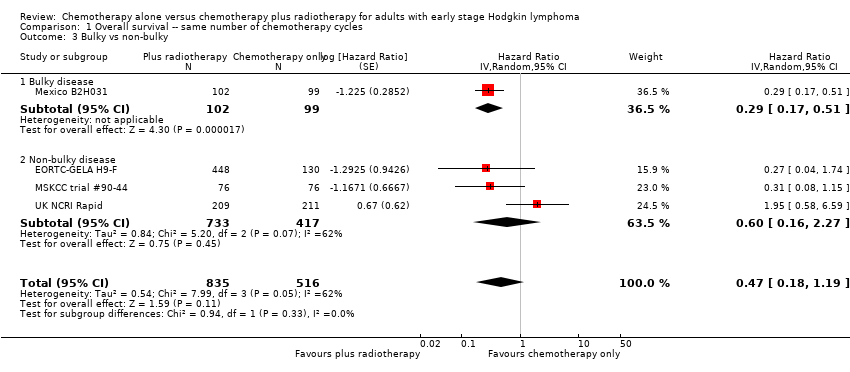 Comparison 1 Overall survival ‐‐ same number of chemotherapy cycles, Outcome 3 Bulky vs non‐bulky. | ||||
| 3.1 Bulky disease | 1 | 201 | Hazard Ratio (Random, 95% CI) | 0.29 [0.17, 0.51] |
| 3.2 Non‐bulky disease | 3 | 1150 | Hazard Ratio (Random, 95% CI) | 0.60 [0.16, 2.27] |
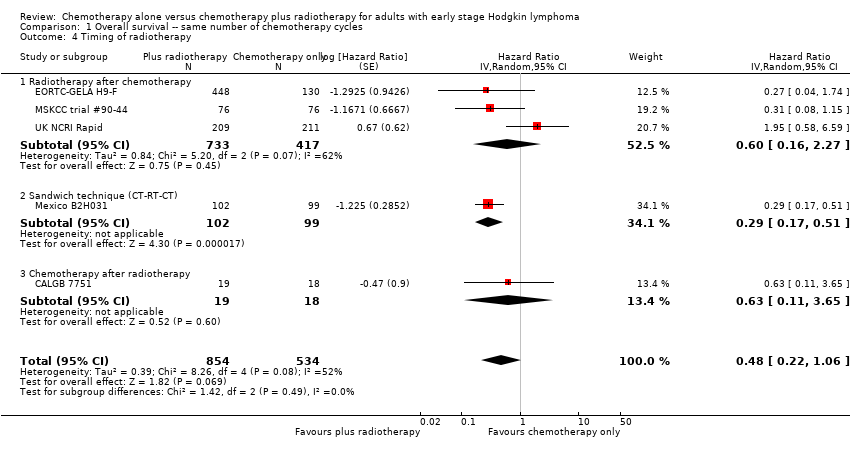
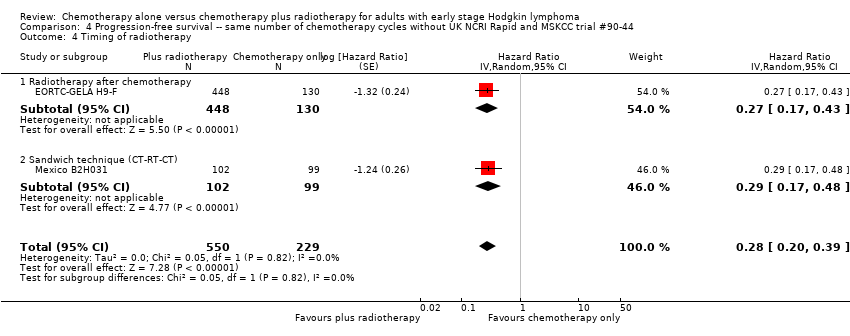
| 4 Timing of radiotherapy Show forest plot | 5 | 1388 | Hazard Ratio (Random, 95% CI) | 0.48 [0.22, 1.06] |
| Analysis 1.4  Comparison 1 Overall survival ‐‐ same number of chemotherapy cycles, Outcome 4 Timing of radiotherapy. | ||||
| 4.1 Radiotherapy after chemotherapy | 3 | 1150 | Hazard Ratio (Random, 95% CI) | 0.60 [0.16, 2.27] |
| 4.2 Sandwich technique (CT‐RT‐CT) | 1 | 201 | Hazard Ratio (Random, 95% CI) | 0.29 [0.17, 0.51] |
| 4.3 Chemotherapy after radiotherapy | 1 | 37 | Hazard Ratio (Random, 95% CI) | 0.63 [0.11, 3.65] |
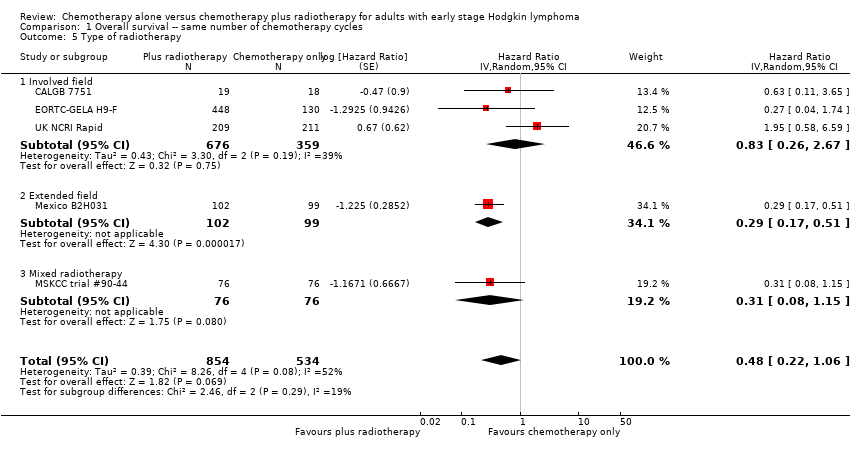
| 5 Type of radiotherapy Show forest plot | 5 | 1388 | Hazard Ratio (Random, 95% CI) | 0.48 [0.22, 1.06] |
| Analysis 1.5  Comparison 1 Overall survival ‐‐ same number of chemotherapy cycles, Outcome 5 Type of radiotherapy. | ||||
| 5.1 Involved field | 3 | 1035 | Hazard Ratio (Random, 95% CI) | 0.83 [0.26, 2.67] |
| 5.2 Extended field | 1 | 201 | Hazard Ratio (Random, 95% CI) | 0.29 [0.17, 0.51] |
| 5.3 Mixed radiotherapy | 1 | 152 | Hazard Ratio (Random, 95% CI) | 0.31 [0.08, 1.15] |
| 6 Type of chemotherapy Show forest plot | 5 | 1388 | Hazard Ratio (Random, 95% CI) | 0.48 [0.22, 1.06] |
| Analysis 1.6 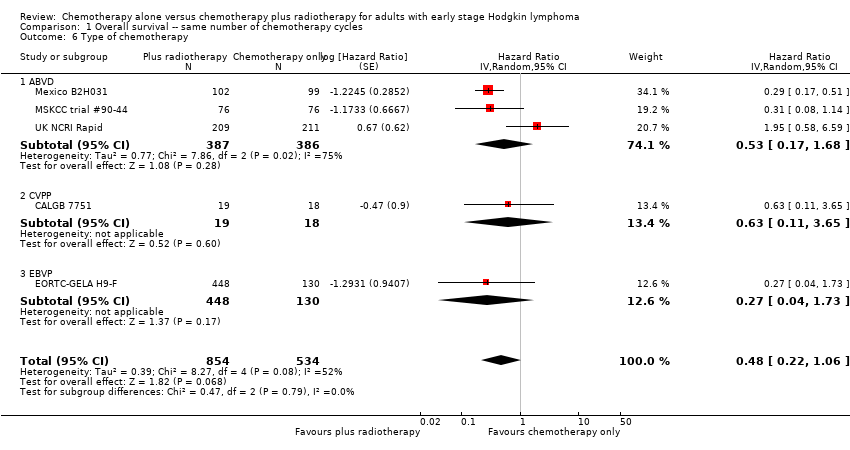 Comparison 1 Overall survival ‐‐ same number of chemotherapy cycles, Outcome 6 Type of chemotherapy. | ||||
| 6.1 ABVD | 3 | 773 | Hazard Ratio (Random, 95% CI) | 0.53 [0.17, 1.68] |
| 6.2 CVPP | 1 | 37 | Hazard Ratio (Random, 95% CI) | 0.63 [0.11, 3.65] |
| 6.3 EBVP | 1 | 578 | Hazard Ratio (Random, 95% CI) | 0.27 [0.04, 1.73] |
| 7 ITT‐analysis Show forest plot | 5 | 1388 | Hazard Ratio (Random, 95% CI) | 0.48 [0.22, 1.06] |
| Analysis 1.7  Comparison 1 Overall survival ‐‐ same number of chemotherapy cycles, Outcome 7 ITT‐analysis. | ||||
| 7.1 ITT‐analysis | 4 | 1351 | Hazard Ratio (Random, 95% CI) | 0.47 [0.18, 1.19] |
| 7.2 No ITT‐analysis | 1 | 37 | Hazard Ratio (Random, 95% CI) | 0.63 [0.11, 3.65] |
| Outcome or subgroup title | No. of studies | No. of participants | Statistical method | Effect size |
| 1 Sensitivity analysis ‐ without UK NCRI RAPID and MSKCC trial #90‐44 Show forest plot | 3 | 816 | Hazard Ratio (Random, 95% CI) | 0.31 [0.19, 0.52] |
| Analysis 2.1  Comparison 2 Overall survival ‐‐ same number of chemotherapy cycles without UK NCRI Rapid and MSKCC trial #90‐44, Outcome 1 Sensitivity analysis ‐ without UK NCRI RAPID and MSKCC trial #90‐44. | ||||
| 2 Proportion of patients early favourable Show forest plot | 3 | 816 | Hazard Ratio (Random, 95% CI) | 0.31 [0.19, 0.52] |
| Analysis 2.2  Comparison 2 Overall survival ‐‐ same number of chemotherapy cycles without UK NCRI Rapid and MSKCC trial #90‐44, Outcome 2 Proportion of patients early favourable. | ||||
| 2.1 All patients early favourable | 1 | 578 | Hazard Ratio (Random, 95% CI) | 0.27 [0.04, 1.74] |
| 2.2 All patients early unfavourable | 2 | 238 | Hazard Ratio (Random, 95% CI) | 0.31 [0.18, 0.54] |
| 3 Bulky vs non‐bulky Show forest plot | 2 | 779 | Hazard Ratio (Random, 95% CI) | 0.29 [0.17, 0.50] |
| Analysis 2.3 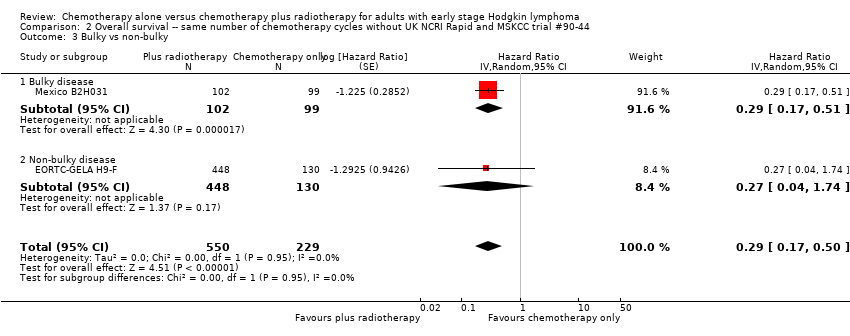 Comparison 2 Overall survival ‐‐ same number of chemotherapy cycles without UK NCRI Rapid and MSKCC trial #90‐44, Outcome 3 Bulky vs non‐bulky. | ||||
| 3.1 Bulky disease | 1 | 201 | Hazard Ratio (Random, 95% CI) | 0.29 [0.17, 0.51] |
| 3.2 Non‐bulky disease | 1 | 578 | Hazard Ratio (Random, 95% CI) | 0.27 [0.04, 1.74] |
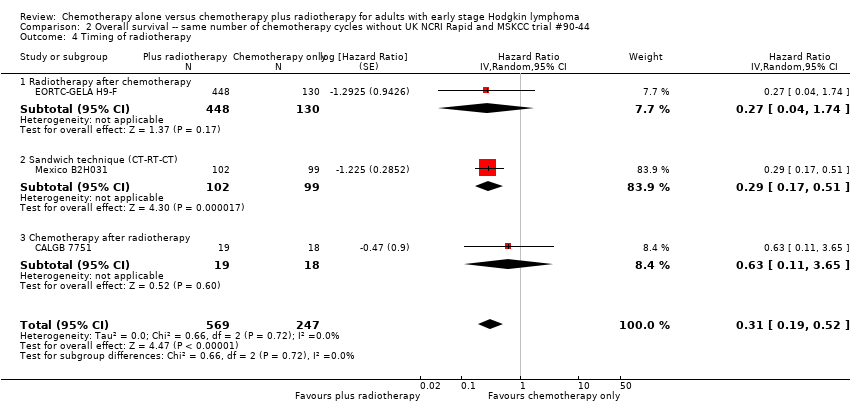
| 4 Timing of radiotherapy Show forest plot | 3 | 816 | Hazard Ratio (Random, 95% CI) | 0.31 [0.19, 0.52] |
| Analysis 2.4  Comparison 2 Overall survival ‐‐ same number of chemotherapy cycles without UK NCRI Rapid and MSKCC trial #90‐44, Outcome 4 Timing of radiotherapy. | ||||
| 4.1 Radiotherapy after chemotherapy | 1 | 578 | Hazard Ratio (Random, 95% CI) | 0.27 [0.04, 1.74] |
| 4.2 Sandwich technique (CT‐RT‐CT) | 1 | 201 | Hazard Ratio (Random, 95% CI) | 0.29 [0.17, 0.51] |
| 4.3 Chemotherapy after radiotherapy | 1 | 37 | Hazard Ratio (Random, 95% CI) | 0.63 [0.11, 3.65] |
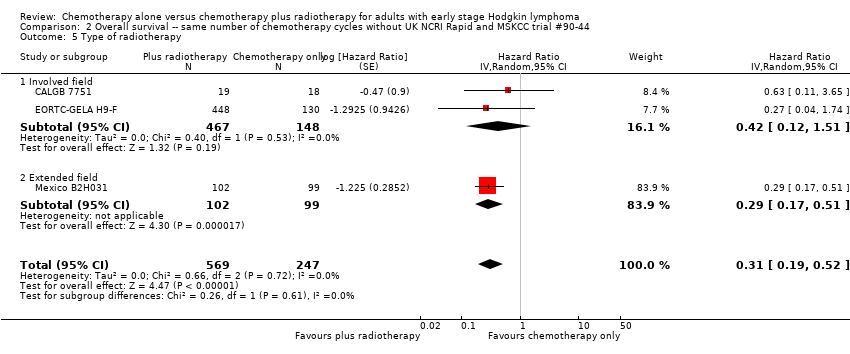
| 5 Type of radiotherapy Show forest plot | 3 | 816 | Hazard Ratio (Random, 95% CI) | 0.31 [0.19, 0.52] |
| Analysis 2.5  Comparison 2 Overall survival ‐‐ same number of chemotherapy cycles without UK NCRI Rapid and MSKCC trial #90‐44, Outcome 5 Type of radiotherapy. | ||||
| 5.1 Involved field | 2 | 615 | Hazard Ratio (Random, 95% CI) | 0.42 [0.12, 1.51] |
| 5.2 Extended field | 1 | 201 | Hazard Ratio (Random, 95% CI) | 0.29 [0.17, 0.51] |
| 6 Type of chemotherapy Show forest plot | 3 | 816 | Hazard Ratio (Random, 95% CI) | 0.31 [0.19, 0.52] |
| Analysis 2.6  Comparison 2 Overall survival ‐‐ same number of chemotherapy cycles without UK NCRI Rapid and MSKCC trial #90‐44, Outcome 6 Type of chemotherapy. | ||||
| 6.1 ABVD | 1 | 201 | Hazard Ratio (Random, 95% CI) | 0.29 [0.17, 0.51] |
| 6.2 CVPP | 1 | 37 | Hazard Ratio (Random, 95% CI) | 0.63 [0.11, 3.65] |
| 6.3 EBVP | 1 | 578 | Hazard Ratio (Random, 95% CI) | 0.27 [0.04, 1.73] |
| 7 ITT‐analysis Show forest plot | 3 | 816 | Hazard Ratio (Random, 95% CI) | 0.31 [0.19, 0.52] |
| Analysis 2.7  Comparison 2 Overall survival ‐‐ same number of chemotherapy cycles without UK NCRI Rapid and MSKCC trial #90‐44, Outcome 7 ITT‐analysis. | ||||
| 7.1 ITT‐analysis | 2 | 779 | Hazard Ratio (Random, 95% CI) | 0.29 [0.17, 0.50] |
| 7.2 No ITT‐analysis | 1 | 37 | Hazard Ratio (Random, 95% CI) | 0.63 [0.11, 3.65] |
| Outcome or subgroup title | No. of studies | No. of participants | Statistical method | Effect size |
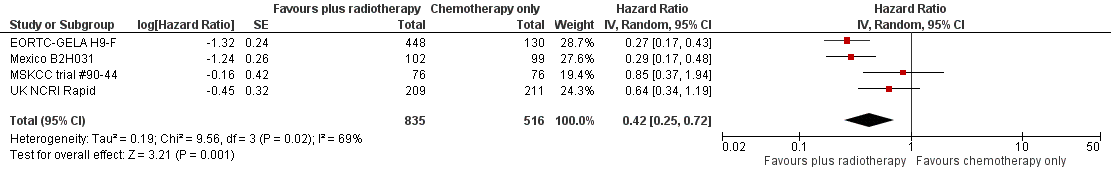
| 1 All trials Show forest plot | 4 | 1351 | Hazard Ratio (Random, 95% CI) | 0.42 [0.25, 0.72] |
| Analysis 3.1 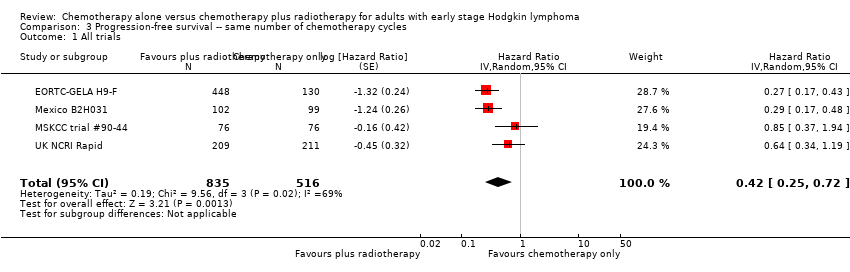 Comparison 3 Progression‐free survival ‐‐ same number of chemotherapy cycles, Outcome 1 All trials. | ||||
| 2 Proportion of patients early favourable Show forest plot | 4 | 1351 | Hazard Ratio (Random, 95% CI) | 0.42 [0.25, 0.72] |
| Analysis 3.2  Comparison 3 Progression‐free survival ‐‐ same number of chemotherapy cycles, Outcome 2 Proportion of patients early favourable. | ||||
| 2.1 All patients early favourable | 1 | 578 | Hazard Ratio (Random, 95% CI) | 0.27 [0.17, 0.43] |
| 2.2 Mixed patient population (˜ 30 to 50% patients early unfavourable) | 2 | 572 | Hazard Ratio (Random, 95% CI) | 0.71 [0.43, 1.17] |
| 2.3 All patients early unfavourable | 1 | 201 | Hazard Ratio (Random, 95% CI) | 0.29 [0.17, 0.48] |
| 3 Bulky vs non‐bulky Show forest plot | 4 | 1351 | Hazard Ratio (Random, 95% CI) | 0.42 [0.25, 0.72] |
| Analysis 3.3  Comparison 3 Progression‐free survival ‐‐ same number of chemotherapy cycles, Outcome 3 Bulky vs non‐bulky. | ||||
| 3.1 Bulky disease | 1 | 201 | Hazard Ratio (Random, 95% CI) | 0.29 [0.17, 0.48] |
| 3.2 Non‐bulky disease | 3 | 1150 | Hazard Ratio (Random, 95% CI) | 0.50 [0.24, 1.03] |
| 4 Timing of radiotherapy Show forest plot | 4 | 1351 | Hazard Ratio (Random, 95% CI) | 0.42 [0.25, 0.72] |
| Analysis 3.4 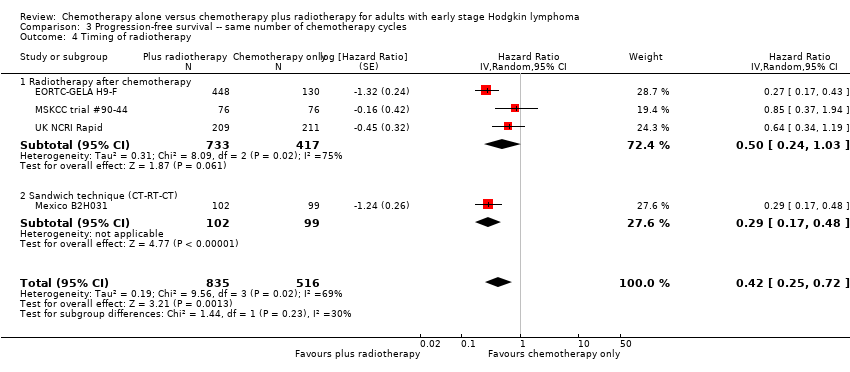 Comparison 3 Progression‐free survival ‐‐ same number of chemotherapy cycles, Outcome 4 Timing of radiotherapy. | ||||
| 4.1 Radiotherapy after chemotherapy | 3 | 1150 | Hazard Ratio (Random, 95% CI) | 0.50 [0.24, 1.03] |
| 4.2 Sandwich technique (CT‐RT‐CT) | 1 | 201 | Hazard Ratio (Random, 95% CI) | 0.29 [0.17, 0.48] |
| 5 Type of radiotherapy Show forest plot | 4 | 1351 | Hazard Ratio (Random, 95% CI) | 0.42 [0.25, 0.72] |
| Analysis 3.5  Comparison 3 Progression‐free survival ‐‐ same number of chemotherapy cycles, Outcome 5 Type of radiotherapy. | ||||
| 5.1 Involved field | 2 | 998 | Hazard Ratio (Random, 95% CI) | 0.40 [0.17, 0.94] |
| 5.2 Extended field | 1 | 201 | Hazard Ratio (Random, 95% CI) | 0.29 [0.17, 0.48] |
| 5.3 Mixed radiotherapy | 1 | 152 | Hazard Ratio (Random, 95% CI) | 0.85 [0.37, 1.94] |
| 6 Type of chemotherapy Show forest plot | 4 | 1351 | Hazard Ratio (Random, 95% CI) | 0.42 [0.25, 0.72] |
| Analysis 3.6  Comparison 3 Progression‐free survival ‐‐ same number of chemotherapy cycles, Outcome 6 Type of chemotherapy. | ||||
| 6.1 ABVD | 3 | 773 | Hazard Ratio (Random, 95% CI) | 0.51 [0.26, 0.99] |
| 6.2 EBVP | 1 | 578 | Hazard Ratio (Random, 95% CI) | 0.27 [0.17, 0.43] |
| 7 Sensitivity analysis (per protocol results of the UK NCRI RAPID, without MSKCC trial #90‐44) Show forest plot | 3 | 1199 | Hazard Ratio (Random, 95% CI) | 0.30 [0.22, 0.41] |
| Analysis 3.7 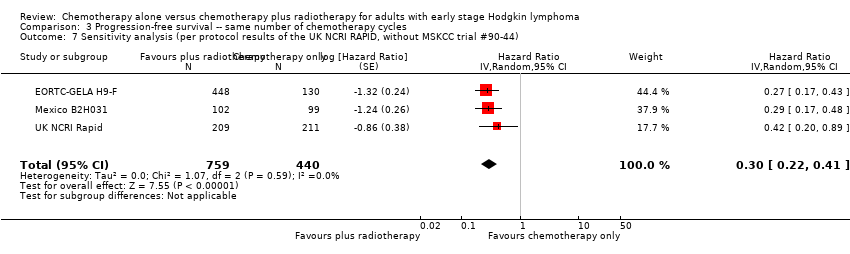 Comparison 3 Progression‐free survival ‐‐ same number of chemotherapy cycles, Outcome 7 Sensitivity analysis (per protocol results of the UK NCRI RAPID, without MSKCC trial #90‐44). | ||||
| Outcome or subgroup title | No. of studies | No. of participants | Statistical method | Effect size |
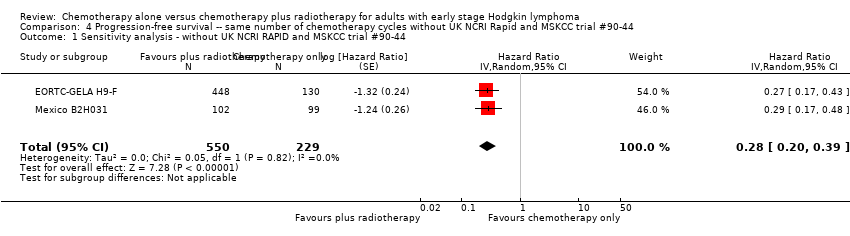
| 1 Sensitivity analysis ‐ without UK NCRI RAPID and MSKCC trial #90‐44 Show forest plot | 2 | 779 | Hazard Ratio (Random, 95% CI) | 0.28 [0.20, 0.39] |
| Analysis 4.1  Comparison 4 Progression‐free survival ‐‐ same number of chemotherapy cycles without UK NCRI Rapid and MSKCC trial #90‐44, Outcome 1 Sensitivity analysis ‐ without UK NCRI RAPID and MSKCC trial #90‐44. | ||||
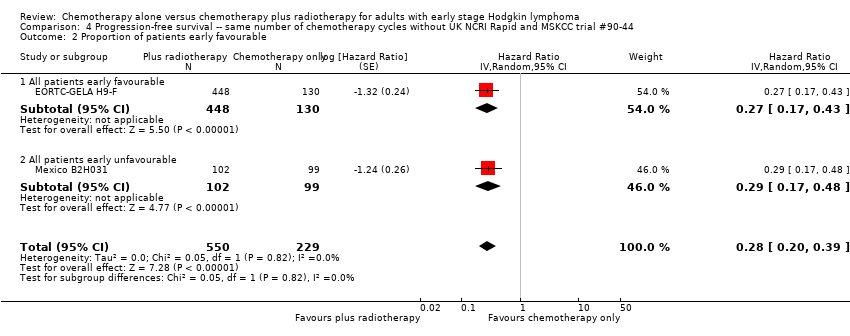
| 2 Proportion of patients early favourable Show forest plot | 2 | 779 | Hazard Ratio (Random, 95% CI) | 0.28 [0.20, 0.39] |
| Analysis 4.2  Comparison 4 Progression‐free survival ‐‐ same number of chemotherapy cycles without UK NCRI Rapid and MSKCC trial #90‐44, Outcome 2 Proportion of patients early favourable. | ||||
| 2.1 All patients early favourable | 1 | 578 | Hazard Ratio (Random, 95% CI) | 0.27 [0.17, 0.43] |
| 2.2 All patients early unfavourable | 1 | 201 | Hazard Ratio (Random, 95% CI) | 0.29 [0.17, 0.48] |
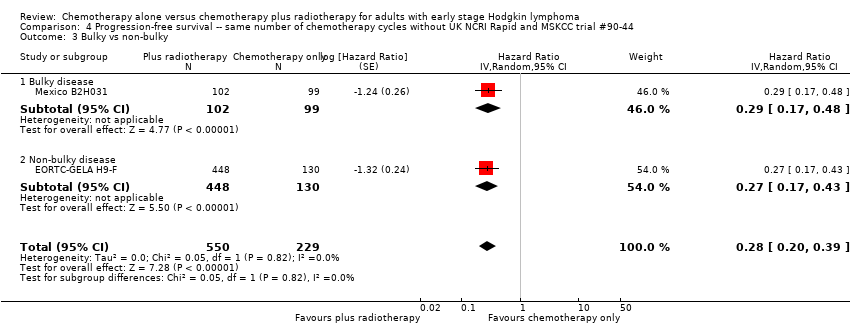
| 3 Bulky vs non‐bulky Show forest plot | 2 | 779 | Hazard Ratio (Random, 95% CI) | 0.28 [0.20, 0.39] |
| Analysis 4.3  Comparison 4 Progression‐free survival ‐‐ same number of chemotherapy cycles without UK NCRI Rapid and MSKCC trial #90‐44, Outcome 3 Bulky vs non‐bulky. | ||||
| 3.1 Bulky disease | 1 | 201 | Hazard Ratio (Random, 95% CI) | 0.29 [0.17, 0.48] |
| 3.2 Non‐bulky disease | 1 | 578 | Hazard Ratio (Random, 95% CI) | 0.27 [0.17, 0.43] |
| 4 Timing of radiotherapy Show forest plot | 2 | 779 | Hazard Ratio (Random, 95% CI) | 0.28 [0.20, 0.39] |
| Analysis 4.4  Comparison 4 Progression‐free survival ‐‐ same number of chemotherapy cycles without UK NCRI Rapid and MSKCC trial #90‐44, Outcome 4 Timing of radiotherapy. | ||||
| 4.1 Radiotherapy after chemotherapy | 1 | 578 | Hazard Ratio (Random, 95% CI) | 0.27 [0.17, 0.43] |
| 4.2 Sandwich technique (CT‐RT‐CT) | 1 | 201 | Hazard Ratio (Random, 95% CI) | 0.29 [0.17, 0.48] |
| 5 Type of radiotherapy Show forest plot | 2 | 779 | Hazard Ratio (Random, 95% CI) | 0.28 [0.20, 0.39] |
| Analysis 4.5  Comparison 4 Progression‐free survival ‐‐ same number of chemotherapy cycles without UK NCRI Rapid and MSKCC trial #90‐44, Outcome 5 Type of radiotherapy. | ||||
| 5.1 Involved field | 1 | 578 | Hazard Ratio (Random, 95% CI) | 0.27 [0.17, 0.43] |
| 5.2 Extended field | 1 | 201 | Hazard Ratio (Random, 95% CI) | 0.29 [0.17, 0.48] |
| 6 Type of chemotherapy Show forest plot | 2 | 779 | Hazard Ratio (Random, 95% CI) | 0.28 [0.20, 0.39] |
| Analysis 4.6  Comparison 4 Progression‐free survival ‐‐ same number of chemotherapy cycles without UK NCRI Rapid and MSKCC trial #90‐44, Outcome 6 Type of chemotherapy. | ||||
| 6.1 ABVD | 1 | 201 | Hazard Ratio (Random, 95% CI) | 0.29 [0.17, 0.48] |
| 6.2 EBVP | 1 | 578 | Hazard Ratio (Random, 95% CI) | 0.27 [0.17, 0.43] |
| Outcome or subgroup title | No. of studies | No. of participants | Statistical method | Effect size |
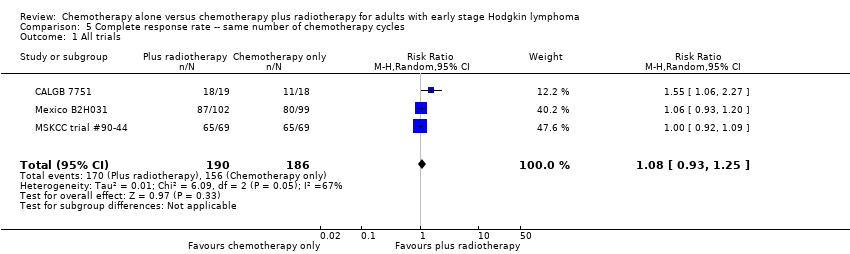
| 1 All trials Show forest plot | 3 | 376 | Risk Ratio (M‐H, Random, 95% CI) | 1.08 [0.93, 1.25] |
| Analysis 5.1  Comparison 5 Complete response rate ‐‐ same number of chemotherapy cycles, Outcome 1 All trials. | ||||
| 2 Proportion of patients early favourable Show forest plot | 3 | 376 | Risk Ratio (M‐H, Random, 95% CI) | 1.08 [0.93, 1.25] |
| Analysis 5.2 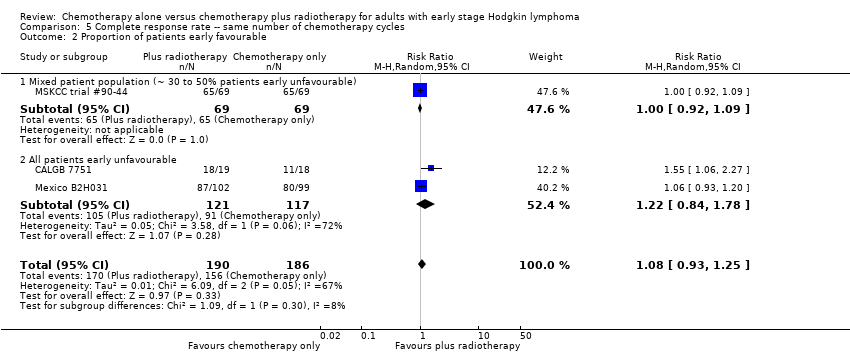 Comparison 5 Complete response rate ‐‐ same number of chemotherapy cycles, Outcome 2 Proportion of patients early favourable. | ||||
| 2.1 Mixed patient population (˜ 30 to 50% patients early unfavourable) | 1 | 138 | Risk Ratio (M‐H, Random, 95% CI) | 1.0 [0.92, 1.09] |
| 2.2 All patients early unfavourable | 2 | 238 | Risk Ratio (M‐H, Random, 95% CI) | 1.22 [0.84, 1.78] |
| 3 Bulky vs non‐bulky Show forest plot | 3 | 376 | Risk Ratio (M‐H, Random, 95% CI) | 1.08 [0.93, 1.25] |
| Analysis 5.3  Comparison 5 Complete response rate ‐‐ same number of chemotherapy cycles, Outcome 3 Bulky vs non‐bulky. | ||||
| 3.1 Bulky disease | 1 | 201 | Risk Ratio (M‐H, Random, 95% CI) | 1.06 [0.93, 1.20] |
| 3.2 Non‐bulky disease | 2 | 175 | Risk Ratio (M‐H, Random, 95% CI) | 1.21 [0.73, 2.01] |
| 4 Timing of radiotherapy Show forest plot | 3 | 376 | Risk Ratio (M‐H, Random, 95% CI) | 1.08 [0.93, 1.25] |
| Analysis 5.4 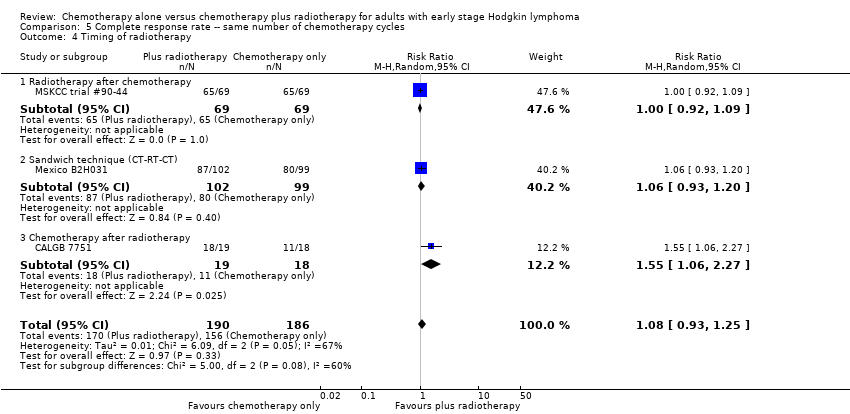 Comparison 5 Complete response rate ‐‐ same number of chemotherapy cycles, Outcome 4 Timing of radiotherapy. | ||||
| 4.1 Radiotherapy after chemotherapy | 1 | 138 | Risk Ratio (M‐H, Random, 95% CI) | 1.0 [0.92, 1.09] |
| 4.2 Sandwich technique (CT‐RT‐CT) | 1 | 201 | Risk Ratio (M‐H, Random, 95% CI) | 1.06 [0.93, 1.20] |
| 4.3 Chemotherapy after radiotherapy | 1 | 37 | Risk Ratio (M‐H, Random, 95% CI) | 1.55 [1.06, 2.27] |
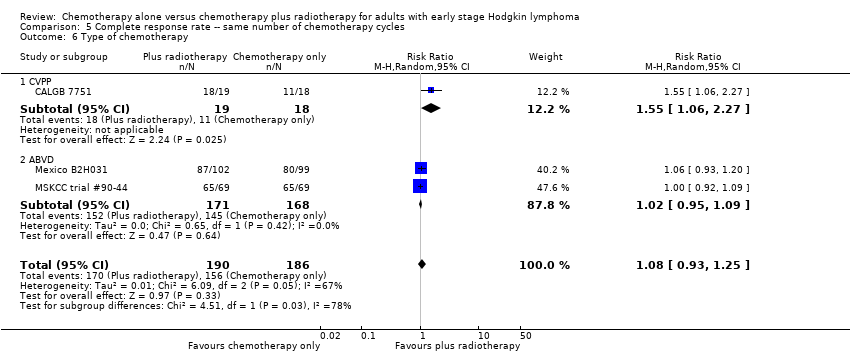
| 5 Type of radiotherapy Show forest plot | 3 | 376 | Risk Ratio (M‐H, Random, 95% CI) | 1.08 [0.93, 1.25] |
| Analysis 5.5 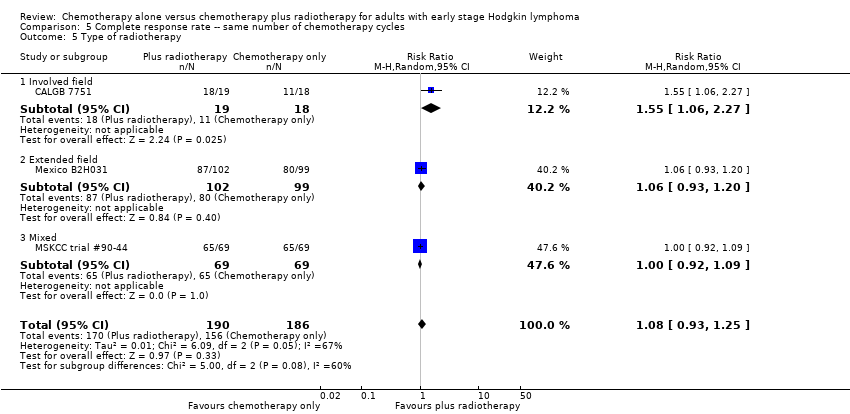 Comparison 5 Complete response rate ‐‐ same number of chemotherapy cycles, Outcome 5 Type of radiotherapy. | ||||
| 5.1 Involved field | 1 | 37 | Risk Ratio (M‐H, Random, 95% CI) | 1.55 [1.06, 2.27] |
| 5.2 Extended field | 1 | 201 | Risk Ratio (M‐H, Random, 95% CI) | 1.06 [0.93, 1.20] |
| 5.3 Mixed | 1 | 138 | Risk Ratio (M‐H, Random, 95% CI) | 1.0 [0.92, 1.09] |
| 6 Type of chemotherapy Show forest plot | 3 | 376 | Risk Ratio (M‐H, Random, 95% CI) | 1.08 [0.93, 1.25] |
| Analysis 5.6  Comparison 5 Complete response rate ‐‐ same number of chemotherapy cycles, Outcome 6 Type of chemotherapy. | ||||
| 6.1 CVPP | 1 | 37 | Risk Ratio (M‐H, Random, 95% CI) | 1.55 [1.06, 2.27] |
| 6.2 ABVD | 2 | 339 | Risk Ratio (M‐H, Random, 95% CI) | 1.02 [0.95, 1.09] |
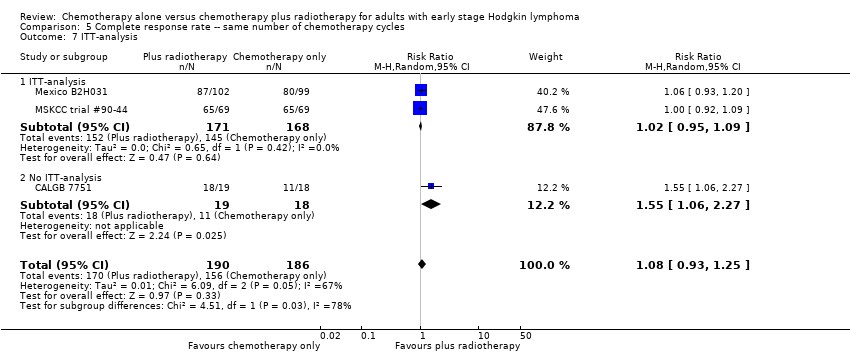
| 7 ITT‐analysis Show forest plot | 3 | 376 | Risk Ratio (M‐H, Random, 95% CI) | 1.08 [0.93, 1.25] |
| Analysis 5.7  Comparison 5 Complete response rate ‐‐ same number of chemotherapy cycles, Outcome 7 ITT‐analysis. | ||||
| 7.1 ITT‐analysis | 2 | 339 | Risk Ratio (M‐H, Random, 95% CI) | 1.02 [0.95, 1.09] |
| 7.2 No ITT‐analysis | 1 | 37 | Risk Ratio (M‐H, Random, 95% CI) | 1.55 [1.06, 2.27] |
| Outcome or subgroup title | No. of studies | No. of participants | Statistical method | Effect size |
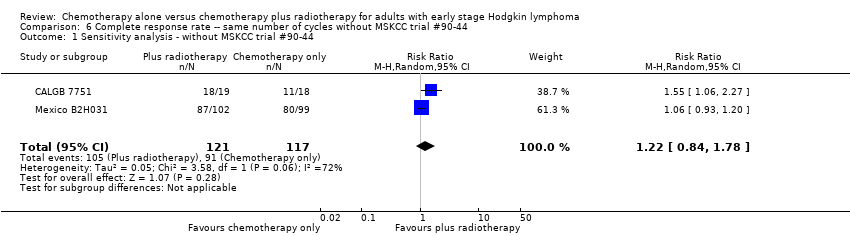
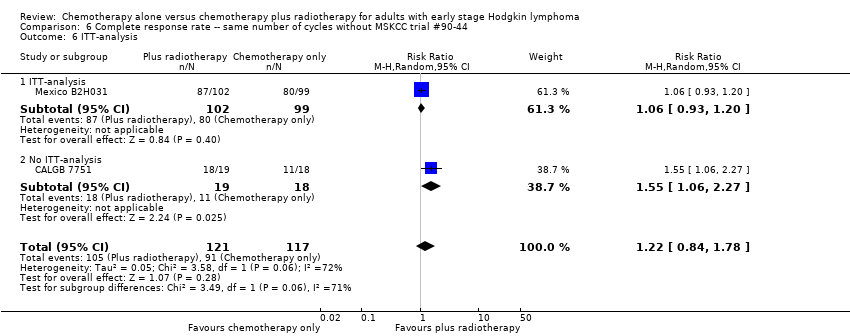
| 1 Sensitivity analysis ‐ without MSKCC trial #90‐44 Show forest plot | 2 | 238 | Risk Ratio (M‐H, Random, 95% CI) | 1.22 [0.84, 1.78] |
| Analysis 6.1  Comparison 6 Complete response rate ‐‐ same number of cycles without MSKCC trial #90‐44, Outcome 1 Sensitivity analysis ‐ without MSKCC trial #90‐44. | ||||
| 2 Bulky vs non‐bulky Show forest plot | 2 | 238 | Risk Ratio (M‐H, Random, 95% CI) | 1.22 [0.84, 1.78] |
| Analysis 6.2  Comparison 6 Complete response rate ‐‐ same number of cycles without MSKCC trial #90‐44, Outcome 2 Bulky vs non‐bulky. | ||||
| 2.1 Bulky disease | 1 | 201 | Risk Ratio (M‐H, Random, 95% CI) | 1.06 [0.93, 1.20] |
| 2.2 Non‐bulky disease | 1 | 37 | Risk Ratio (M‐H, Random, 95% CI) | 1.55 [1.06, 2.27] |
| 3 Timing of radiotherapy Show forest plot | 2 | 238 | Risk Ratio (M‐H, Random, 95% CI) | 1.22 [0.84, 1.78] |
| Analysis 6.3 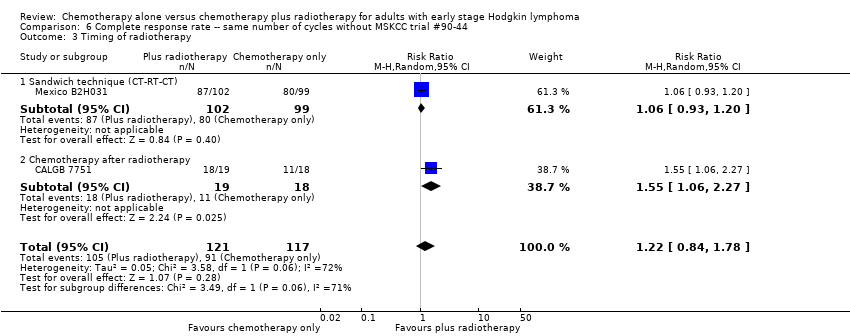 Comparison 6 Complete response rate ‐‐ same number of cycles without MSKCC trial #90‐44, Outcome 3 Timing of radiotherapy. | ||||
| 3.1 Sandwich technique (CT‐RT‐CT) | 1 | 201 | Risk Ratio (M‐H, Random, 95% CI) | 1.06 [0.93, 1.20] |
| 3.2 Chemotherapy after radiotherapy | 1 | 37 | Risk Ratio (M‐H, Random, 95% CI) | 1.55 [1.06, 2.27] |
| 4 Type of radiotherapy Show forest plot | 2 | 238 | Risk Ratio (M‐H, Random, 95% CI) | 1.22 [0.84, 1.78] |
| Analysis 6.4  Comparison 6 Complete response rate ‐‐ same number of cycles without MSKCC trial #90‐44, Outcome 4 Type of radiotherapy. | ||||
| 4.1 Involved field | 1 | 37 | Risk Ratio (M‐H, Random, 95% CI) | 1.55 [1.06, 2.27] |
| 4.2 Extended field | 1 | 201 | Risk Ratio (M‐H, Random, 95% CI) | 1.06 [0.93, 1.20] |
| 5 Type of chemotherapy Show forest plot | 2 | 238 | Risk Ratio (M‐H, Random, 95% CI) | 1.22 [0.84, 1.78] |
| Analysis 6.5 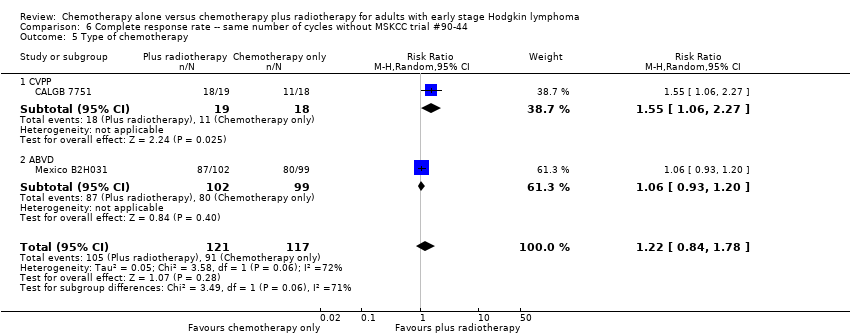 Comparison 6 Complete response rate ‐‐ same number of cycles without MSKCC trial #90‐44, Outcome 5 Type of chemotherapy. | ||||
| 5.1 CVPP | 1 | 37 | Risk Ratio (M‐H, Random, 95% CI) | 1.55 [1.06, 2.27] |
| 5.2 ABVD | 1 | 201 | Risk Ratio (M‐H, Random, 95% CI) | 1.06 [0.93, 1.20] |
| 6 ITT‐analysis Show forest plot | 2 | 238 | Risk Ratio (M‐H, Random, 95% CI) | 1.22 [0.84, 1.78] |
| Analysis 6.6  Comparison 6 Complete response rate ‐‐ same number of cycles without MSKCC trial #90‐44, Outcome 6 ITT‐analysis. | ||||
| 6.1 ITT‐analysis | 1 | 201 | Risk Ratio (M‐H, Random, 95% CI) | 1.06 [0.93, 1.20] |
| 6.2 No ITT‐analysis | 1 | 37 | Risk Ratio (M‐H, Random, 95% CI) | 1.55 [1.06, 2.27] |
| Outcome or subgroup title | No. of studies | No. of participants | Statistical method | Effect size |
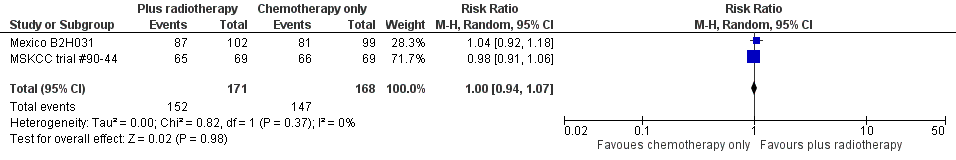
| 1 All trials Show forest plot | 2 | 339 | Risk Ratio (M‐H, Random, 95% CI) | 1.00 [0.94, 1.07] |
| Analysis 7.1  Comparison 7 Overall response rate ‐‐ same number of chemotherapy cycles, Outcome 1 All trials. | ||||
| 2 Proportion of patients early favourable Show forest plot | 2 | 339 | Risk Ratio (M‐H, Random, 95% CI) | 1.00 [0.94, 1.07] |
| Analysis 7.2  Comparison 7 Overall response rate ‐‐ same number of chemotherapy cycles, Outcome 2 Proportion of patients early favourable. | ||||
| 2.1 All patients early favourable | 1 | 138 | Risk Ratio (M‐H, Random, 95% CI) | 0.98 [0.91, 1.06] |
| 2.2 Mixed patient population (˜ 30 to 50% patients early unfavourable) | 1 | 201 | Risk Ratio (M‐H, Random, 95% CI) | 1.04 [0.92, 1.18] |
| 3 Bulky vs non‐bulky Show forest plot | 2 | 339 | Risk Ratio (M‐H, Random, 95% CI) | 1.00 [0.94, 1.07] |
| Analysis 7.3 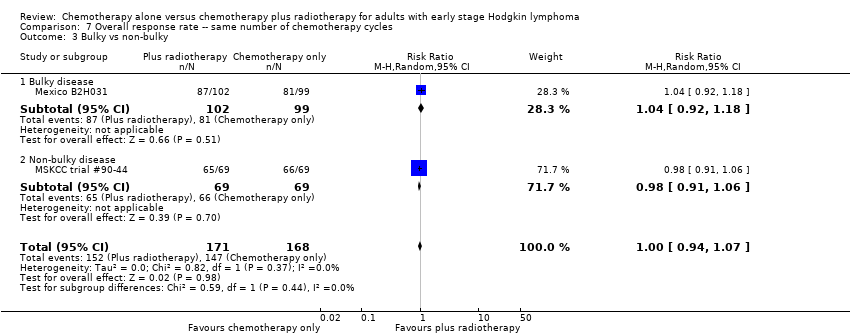 Comparison 7 Overall response rate ‐‐ same number of chemotherapy cycles, Outcome 3 Bulky vs non‐bulky. | ||||
| 3.1 Bulky disease | 1 | 201 | Risk Ratio (M‐H, Random, 95% CI) | 1.04 [0.92, 1.18] |
| 3.2 Non‐bulky disease | 1 | 138 | Risk Ratio (M‐H, Random, 95% CI) | 0.98 [0.91, 1.06] |
| 4 Timing of radiotherapy Show forest plot | 2 | 339 | Risk Ratio (M‐H, Random, 95% CI) | 1.00 [0.94, 1.07] |
| Analysis 7.4 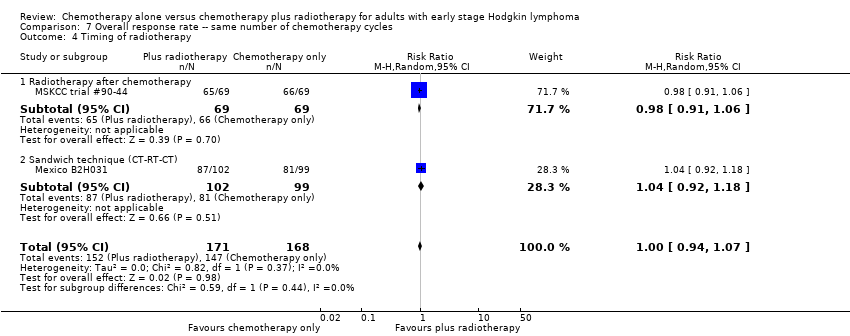 Comparison 7 Overall response rate ‐‐ same number of chemotherapy cycles, Outcome 4 Timing of radiotherapy. | ||||
| 4.1 Radiotherapy after chemotherapy | 1 | 138 | Risk Ratio (M‐H, Random, 95% CI) | 0.98 [0.91, 1.06] |
| 4.2 Sandwich technique (CT‐RT‐CT) | 1 | 201 | Risk Ratio (M‐H, Random, 95% CI) | 1.04 [0.92, 1.18] |
| 5 Type of radiotherapy Show forest plot | 2 | 339 | Risk Ratio (M‐H, Random, 95% CI) | 1.00 [0.94, 1.07] |
| Analysis 7.5  Comparison 7 Overall response rate ‐‐ same number of chemotherapy cycles, Outcome 5 Type of radiotherapy. | ||||
| 5.1 Extended field | 1 | 201 | Risk Ratio (M‐H, Random, 95% CI) | 1.04 [0.92, 1.18] |
| 5.2 Mixed | 1 | 138 | Risk Ratio (M‐H, Random, 95% CI) | 0.98 [0.91, 1.06] |
| Outcome or subgroup title | No. of studies | No. of participants | Statistical method | Effect size |
| 1 Sensitivity analysis ‐ without MSKCC trial #90‐44 Show forest plot | 1 | 201 | Risk Ratio (M‐H, Random, 95% CI) | 1.04 [0.92, 1.18] |
| Analysis 8.1  Comparison 8 Overall response rate ‐‐ same number of chemotherapy cycles without MSKCC trial #90‐44, Outcome 1 Sensitivity analysis ‐ without MSKCC trial #90‐44. | ||||
| Outcome or subgroup title | No. of studies | No. of participants | Statistical method | Effect size |
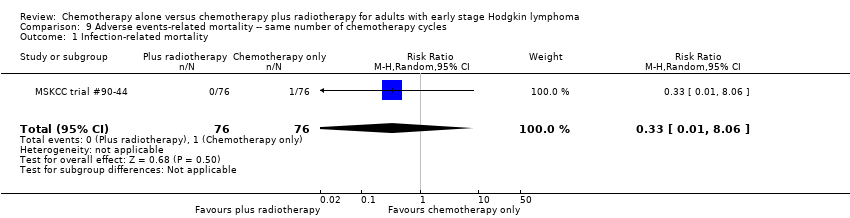
| 1 Infection‐ related mortality Show forest plot | 1 | 152 | Risk Ratio (M‐H, Random, 95% CI) | 0.33 [0.01, 8.06] |
| Analysis 9.1  Comparison 9 Adverse events‐ related mortality ‐‐ same number of chemotherapy cycles, Outcome 1 Infection‐ related mortality. | ||||
| 2 Second cancer‐ related mortality Show forest plot | 3 | 1199 | Risk Ratio (M‐H, Random, 95% CI) | 0.53 [0.07, 4.29] |
| Analysis 9.2 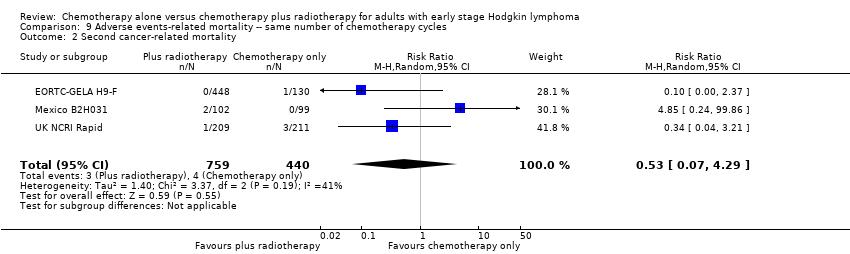 Comparison 9 Adverse events‐ related mortality ‐‐ same number of chemotherapy cycles, Outcome 2 Second cancer‐ related mortality. | ||||
| 3 Cardiac disease‐ related mortality Show forest plot | 2 | 457 | Risk Ratio (M‐H, Random, 95% CI) | 2.94 [0.31, 27.55] |
| Analysis 9.3 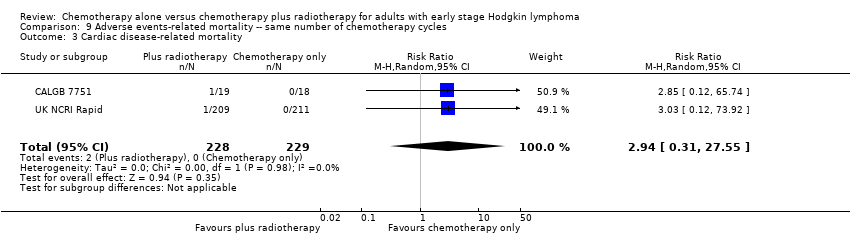 Comparison 9 Adverse events‐ related mortality ‐‐ same number of chemotherapy cycles, Outcome 3 Cardiac disease‐ related mortality. | ||||
| Outcome or subgroup title | No. of studies | No. of participants | Statistical method | Effect size |
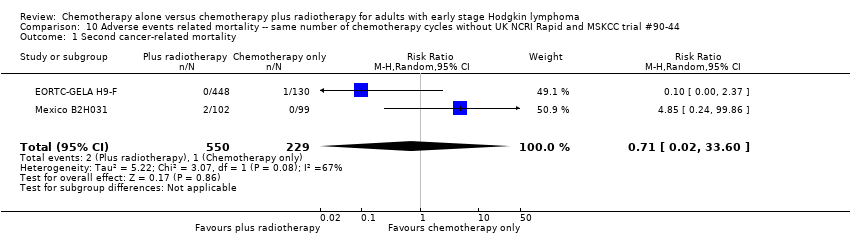
| 1 Second cancer‐ related mortality Show forest plot | 2 | 779 | Risk Ratio (M‐H, Random, 95% CI) | 0.71 [0.02, 33.60] |
| Analysis 10.1  Comparison 10 Adverse events related mortality ‐‐ same number of chemotherapy cycles without UK NCRI Rapid and MSKCC trial #90‐44, Outcome 1 Second cancer‐ related mortality. | ||||
| 2 Cardiac disease‐ related mortality Show forest plot | 1 | 37 | Risk Ratio (M‐H, Random, 95% CI) | 2.85 [0.12, 65.74] |
| Analysis 10.2  Comparison 10 Adverse events related mortality ‐‐ same number of chemotherapy cycles without UK NCRI Rapid and MSKCC trial #90‐44, Outcome 2 Cardiac disease‐ related mortality. | ||||
| Outcome or subgroup title | No. of studies | No. of participants | Statistical method | Effect size |
| 1 All trials Show forest plot | 1 | 276 | Hazard Ratio (Random, 95% CI) | 2.12 [1.03, 4.37] |
| Analysis 11.1  Comparison 11 Overall survival ‐ different numbers of chemotherapy cycles, Outcome 1 All trials. | ||||
| Outcome or subgroup title | No. of studies | No. of participants | Statistical method | Effect size |
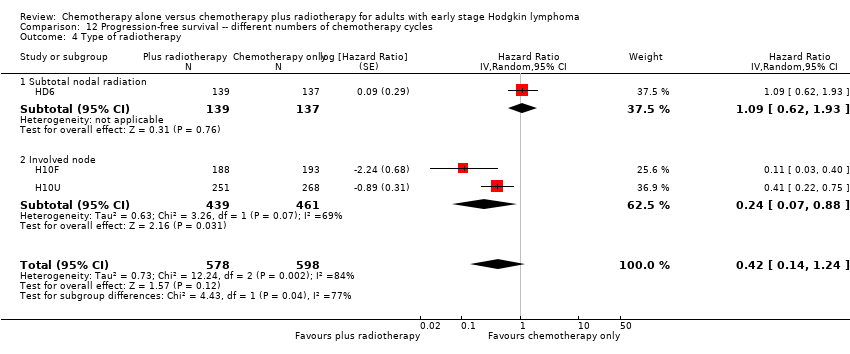
| 1 All trials Show forest plot | 3 | 1176 | Hazard Ratio (Random, 95% CI) | 0.42 [0.14, 1.24] |
| Analysis 12.1 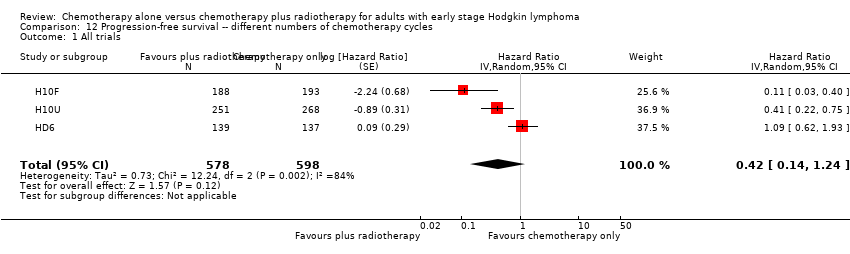 Comparison 12 Progression‐free survival ‐‐ different numbers of chemotherapy cycles, Outcome 1 All trials. | ||||
| 2 Proportion of patients early favourable Show forest plot | 3 | 1176 | Hazard Ratio (Random, 95% CI) | 0.42 [0.14, 1.24] |
| Analysis 12.2  Comparison 12 Progression‐free survival ‐‐ different numbers of chemotherapy cycles, Outcome 2 Proportion of patients early favourable. | ||||
| 2.1 All patients early favourable | 1 | 381 | Hazard Ratio (Random, 95% CI) | 0.11 [0.03, 0.40] |
| 2.2 All patients early unfavourable | 2 | 795 | Hazard Ratio (Random, 95% CI) | 0.67 [0.26, 1.76] |
| 3 Bulky vs non‐bulky Show forest plot | 3 | 1176 | Hazard Ratio (Random, 95% CI) | 0.42 [0.14, 1.24] |
| Analysis 12.3  Comparison 12 Progression‐free survival ‐‐ different numbers of chemotherapy cycles, Outcome 3 Bulky vs non‐bulky. | ||||
| 3.1 Bulky disease | 1 | 519 | Hazard Ratio (Random, 95% CI) | 0.41 [0.22, 0.75] |
| 3.2 Non‐bulky disease | 2 | 657 | Hazard Ratio (Random, 95% CI) | 0.37 [0.04, 3.61] |
| 4 Type of radiotherapy Show forest plot | 3 | 1176 | Hazard Ratio (Random, 95% CI) | 0.42 [0.14, 1.24] |
| Analysis 12.4  Comparison 12 Progression‐free survival ‐‐ different numbers of chemotherapy cycles, Outcome 4 Type of radiotherapy. | ||||
| 4.1 Subtotal nodal radiation | 1 | 276 | Hazard Ratio (Random, 95% CI) | 1.09 [0.62, 1.93] |
| 4.2 Involved node | 2 | 900 | Hazard Ratio (Random, 95% CI) | 0.24 [0.07, 0.88] |
| Outcome or subgroup title | No. of studies | No. of participants | Statistical method | Effect size |
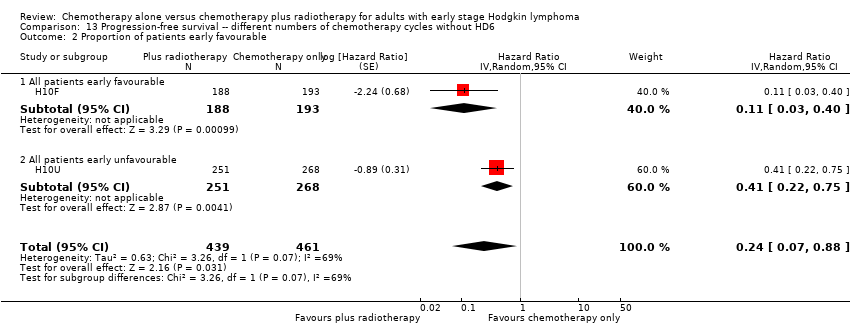
| 1 Sensitivity analysis ‐ without HD6 Show forest plot | 2 | 900 | Hazard Ratio (Random, 95% CI) | 0.24 [0.07, 0.88] |
| Analysis 13.1 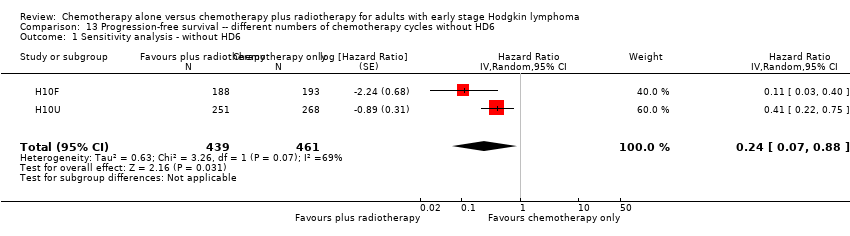 Comparison 13 Progression‐free survival ‐‐ different numbers of chemotherapy cycles without HD6, Outcome 1 Sensitivity analysis ‐ without HD6. | ||||
| 2 Proportion of patients early favourable Show forest plot | 2 | 900 | Hazard Ratio (Random, 95% CI) | 0.24 [0.07, 0.88] |
| Analysis 13.2  Comparison 13 Progression‐free survival ‐‐ different numbers of chemotherapy cycles without HD6, Outcome 2 Proportion of patients early favourable. | ||||
| 2.1 All patients early favourable | 1 | 381 | Hazard Ratio (Random, 95% CI) | 0.11 [0.03, 0.40] |
| 2.2 All patients early unfavourable | 1 | 519 | Hazard Ratio (Random, 95% CI) | 0.41 [0.22, 0.75] |
| 3 Bulky vs non‐bulky Show forest plot | 2 | 900 | Hazard Ratio (Random, 95% CI) | 0.24 [0.07, 0.88] |
| Analysis 13.3  Comparison 13 Progression‐free survival ‐‐ different numbers of chemotherapy cycles without HD6, Outcome 3 Bulky vs non‐bulky. | ||||
| 3.1 Bulky disease | 1 | 519 | Hazard Ratio (Random, 95% CI) | 0.41 [0.22, 0.75] |
| 3.2 Non‐bulky disease | 1 | 381 | Hazard Ratio (Random, 95% CI) | 0.11 [0.03, 0.40] |
| Outcome or subgroup title | No. of studies | No. of participants | Statistical method | Effect size |
| 1 Infection‐ related mortality Show forest plot | 1 | 276 | Risk Ratio (M‐H, Random, 95% CI) | 6.9 [0.36, 132.34] |
| Analysis 14.1  Comparison 14 Adverse events related mortality ‐‐ different numbers of chemotherapy cycles, Outcome 1 Infection‐ related mortality. | ||||
| 2 Second cancer‐ related mortality Show forest plot | 1 | 276 | Risk Ratio (M‐H, Random, 95% CI) | 2.22 [0.70, 7.03] |
| Analysis 14.2 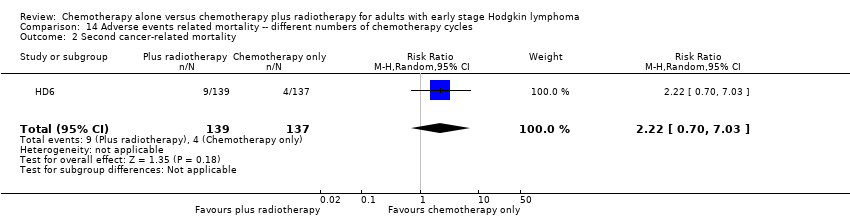 Comparison 14 Adverse events related mortality ‐‐ different numbers of chemotherapy cycles, Outcome 2 Second cancer‐ related mortality. | ||||
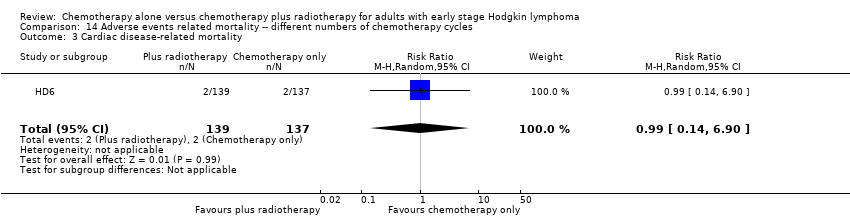
| 3 Cardiac disease‐ related mortality Show forest plot | 1 | 276 | Risk Ratio (M‐H, Random, 95% CI) | 0.99 [0.14, 6.90] |
| Analysis 14.3  Comparison 14 Adverse events related mortality ‐‐ different numbers of chemotherapy cycles, Outcome 3 Cardiac disease‐ related mortality. | ||||
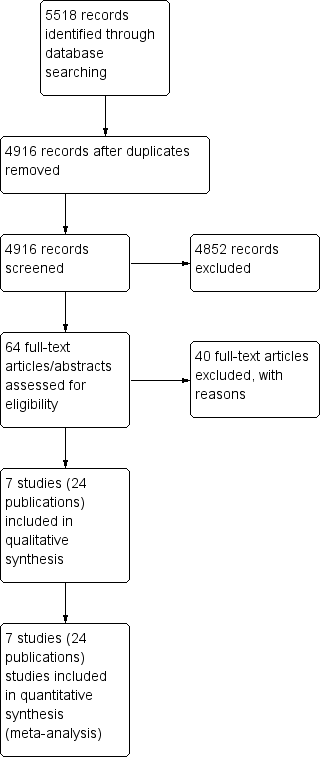
Study flow diagram.
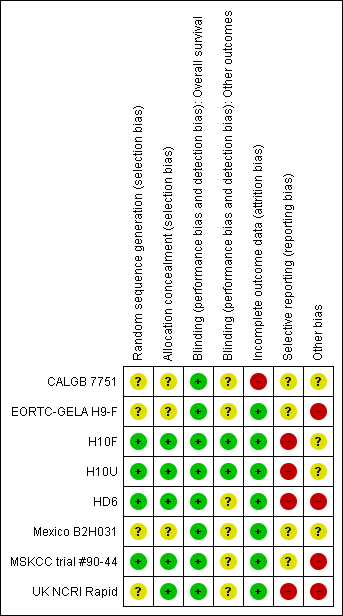
Methodological quality summary: review authors' judgements about each methodological quality item for each included study.
Forest plot of comparison: 2 Overall survival ‐‐ same number of chemotherapy cycles without UK NCRI Rapid and MSKCC trial #90‐44 , outcome: 2.1 Sensitivity analysis ‐ without UK NCRI Rapid and MSKCC trial #90‐44.
Forest plot of comparison: 2 Progression‐free survival, outcome: 2.1 All trials.

Forest plot of comparison: 3 Complete response rate, outcome: 3.1 All trials.
Forest plot of comparison: 4 Overall Response Rate, outcome: 4.1 All Trials.
Comparison 1 Overall survival ‐‐ same number of chemotherapy cycles, Outcome 1 All trials.

Comparison 1 Overall survival ‐‐ same number of chemotherapy cycles, Outcome 2 Proportion of patients early favourable.

Comparison 1 Overall survival ‐‐ same number of chemotherapy cycles, Outcome 3 Bulky vs non‐bulky.
Comparison 1 Overall survival ‐‐ same number of chemotherapy cycles, Outcome 4 Timing of radiotherapy.
Comparison 1 Overall survival ‐‐ same number of chemotherapy cycles, Outcome 5 Type of radiotherapy.

Comparison 1 Overall survival ‐‐ same number of chemotherapy cycles, Outcome 6 Type of chemotherapy.

Comparison 1 Overall survival ‐‐ same number of chemotherapy cycles, Outcome 7 ITT‐analysis.

Comparison 2 Overall survival ‐‐ same number of chemotherapy cycles without UK NCRI Rapid and MSKCC trial #90‐44, Outcome 1 Sensitivity analysis ‐ without UK NCRI RAPID and MSKCC trial #90‐44.

Comparison 2 Overall survival ‐‐ same number of chemotherapy cycles without UK NCRI Rapid and MSKCC trial #90‐44, Outcome 2 Proportion of patients early favourable.

Comparison 2 Overall survival ‐‐ same number of chemotherapy cycles without UK NCRI Rapid and MSKCC trial #90‐44, Outcome 3 Bulky vs non‐bulky.
Comparison 2 Overall survival ‐‐ same number of chemotherapy cycles without UK NCRI Rapid and MSKCC trial #90‐44, Outcome 4 Timing of radiotherapy.
Comparison 2 Overall survival ‐‐ same number of chemotherapy cycles without UK NCRI Rapid and MSKCC trial #90‐44, Outcome 5 Type of radiotherapy.

Comparison 2 Overall survival ‐‐ same number of chemotherapy cycles without UK NCRI Rapid and MSKCC trial #90‐44, Outcome 6 Type of chemotherapy.

Comparison 2 Overall survival ‐‐ same number of chemotherapy cycles without UK NCRI Rapid and MSKCC trial #90‐44, Outcome 7 ITT‐analysis.

Comparison 3 Progression‐free survival ‐‐ same number of chemotherapy cycles, Outcome 1 All trials.

Comparison 3 Progression‐free survival ‐‐ same number of chemotherapy cycles, Outcome 2 Proportion of patients early favourable.
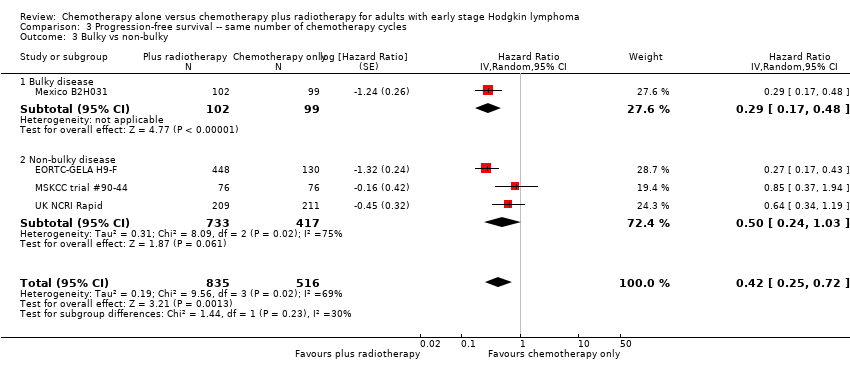
Comparison 3 Progression‐free survival ‐‐ same number of chemotherapy cycles, Outcome 3 Bulky vs non‐bulky.

Comparison 3 Progression‐free survival ‐‐ same number of chemotherapy cycles, Outcome 4 Timing of radiotherapy.

Comparison 3 Progression‐free survival ‐‐ same number of chemotherapy cycles, Outcome 5 Type of radiotherapy.

Comparison 3 Progression‐free survival ‐‐ same number of chemotherapy cycles, Outcome 6 Type of chemotherapy.

Comparison 3 Progression‐free survival ‐‐ same number of chemotherapy cycles, Outcome 7 Sensitivity analysis (per protocol results of the UK NCRI RAPID, without MSKCC trial #90‐44).
Comparison 4 Progression‐free survival ‐‐ same number of chemotherapy cycles without UK NCRI Rapid and MSKCC trial #90‐44, Outcome 1 Sensitivity analysis ‐ without UK NCRI RAPID and MSKCC trial #90‐44.
Comparison 4 Progression‐free survival ‐‐ same number of chemotherapy cycles without UK NCRI Rapid and MSKCC trial #90‐44, Outcome 2 Proportion of patients early favourable.
Comparison 4 Progression‐free survival ‐‐ same number of chemotherapy cycles without UK NCRI Rapid and MSKCC trial #90‐44, Outcome 3 Bulky vs non‐bulky.
Comparison 4 Progression‐free survival ‐‐ same number of chemotherapy cycles without UK NCRI Rapid and MSKCC trial #90‐44, Outcome 4 Timing of radiotherapy.

Comparison 4 Progression‐free survival ‐‐ same number of chemotherapy cycles without UK NCRI Rapid and MSKCC trial #90‐44, Outcome 5 Type of radiotherapy.

Comparison 4 Progression‐free survival ‐‐ same number of chemotherapy cycles without UK NCRI Rapid and MSKCC trial #90‐44, Outcome 6 Type of chemotherapy.
Comparison 5 Complete response rate ‐‐ same number of chemotherapy cycles, Outcome 1 All trials.

Comparison 5 Complete response rate ‐‐ same number of chemotherapy cycles, Outcome 2 Proportion of patients early favourable.

Comparison 5 Complete response rate ‐‐ same number of chemotherapy cycles, Outcome 3 Bulky vs non‐bulky.

Comparison 5 Complete response rate ‐‐ same number of chemotherapy cycles, Outcome 4 Timing of radiotherapy.

Comparison 5 Complete response rate ‐‐ same number of chemotherapy cycles, Outcome 5 Type of radiotherapy.
Comparison 5 Complete response rate ‐‐ same number of chemotherapy cycles, Outcome 6 Type of chemotherapy.
Comparison 5 Complete response rate ‐‐ same number of chemotherapy cycles, Outcome 7 ITT‐analysis.
Comparison 6 Complete response rate ‐‐ same number of cycles without MSKCC trial #90‐44, Outcome 1 Sensitivity analysis ‐ without MSKCC trial #90‐44.

Comparison 6 Complete response rate ‐‐ same number of cycles without MSKCC trial #90‐44, Outcome 2 Bulky vs non‐bulky.

Comparison 6 Complete response rate ‐‐ same number of cycles without MSKCC trial #90‐44, Outcome 3 Timing of radiotherapy.

Comparison 6 Complete response rate ‐‐ same number of cycles without MSKCC trial #90‐44, Outcome 4 Type of radiotherapy.

Comparison 6 Complete response rate ‐‐ same number of cycles without MSKCC trial #90‐44, Outcome 5 Type of chemotherapy.
Comparison 6 Complete response rate ‐‐ same number of cycles without MSKCC trial #90‐44, Outcome 6 ITT‐analysis.

Comparison 7 Overall response rate ‐‐ same number of chemotherapy cycles, Outcome 1 All trials.

Comparison 7 Overall response rate ‐‐ same number of chemotherapy cycles, Outcome 2 Proportion of patients early favourable.

Comparison 7 Overall response rate ‐‐ same number of chemotherapy cycles, Outcome 3 Bulky vs non‐bulky.

Comparison 7 Overall response rate ‐‐ same number of chemotherapy cycles, Outcome 4 Timing of radiotherapy.

Comparison 7 Overall response rate ‐‐ same number of chemotherapy cycles, Outcome 5 Type of radiotherapy.

Comparison 8 Overall response rate ‐‐ same number of chemotherapy cycles without MSKCC trial #90‐44, Outcome 1 Sensitivity analysis ‐ without MSKCC trial #90‐44.
Comparison 9 Adverse events‐ related mortality ‐‐ same number of chemotherapy cycles, Outcome 1 Infection‐ related mortality.

Comparison 9 Adverse events‐ related mortality ‐‐ same number of chemotherapy cycles, Outcome 2 Second cancer‐ related mortality.

Comparison 9 Adverse events‐ related mortality ‐‐ same number of chemotherapy cycles, Outcome 3 Cardiac disease‐ related mortality.
Comparison 10 Adverse events related mortality ‐‐ same number of chemotherapy cycles without UK NCRI Rapid and MSKCC trial #90‐44, Outcome 1 Second cancer‐ related mortality.

Comparison 10 Adverse events related mortality ‐‐ same number of chemotherapy cycles without UK NCRI Rapid and MSKCC trial #90‐44, Outcome 2 Cardiac disease‐ related mortality.

Comparison 11 Overall survival ‐ different numbers of chemotherapy cycles, Outcome 1 All trials.

Comparison 12 Progression‐free survival ‐‐ different numbers of chemotherapy cycles, Outcome 1 All trials.

Comparison 12 Progression‐free survival ‐‐ different numbers of chemotherapy cycles, Outcome 2 Proportion of patients early favourable.

Comparison 12 Progression‐free survival ‐‐ different numbers of chemotherapy cycles, Outcome 3 Bulky vs non‐bulky.
Comparison 12 Progression‐free survival ‐‐ different numbers of chemotherapy cycles, Outcome 4 Type of radiotherapy.

Comparison 13 Progression‐free survival ‐‐ different numbers of chemotherapy cycles without HD6, Outcome 1 Sensitivity analysis ‐ without HD6.
Comparison 13 Progression‐free survival ‐‐ different numbers of chemotherapy cycles without HD6, Outcome 2 Proportion of patients early favourable.

Comparison 13 Progression‐free survival ‐‐ different numbers of chemotherapy cycles without HD6, Outcome 3 Bulky vs non‐bulky.

Comparison 14 Adverse events related mortality ‐‐ different numbers of chemotherapy cycles, Outcome 1 Infection‐ related mortality.

Comparison 14 Adverse events related mortality ‐‐ different numbers of chemotherapy cycles, Outcome 2 Second cancer‐ related mortality.
Comparison 14 Adverse events related mortality ‐‐ different numbers of chemotherapy cycles, Outcome 3 Cardiac disease‐ related mortality.
| Same number of chemotherapy cycles in both arms | ||||||
| Chemotherapy alone versus chemotherapy plus radiotherapy for adults with early stage Hodgkin lymphoma. | ||||||
| Outcomes | № of participants | Quality of the evidence | Relative effect | Anticipated absolute effects* (95% CI) | Comment | |
| Risk with chemotherapy only | Risk with chemotherapy plus radiotherapy | |||||
| Mortality (calculated instead of overall survival) Follow‐up : 5 years The low‐ mortality rate was taken from the EORTC‐GELA H9‐F trial, the high‐ mortality rate was taken from the Mexico B2H031trial | 1388 | ⊕⊕⊕⊝ | HR 0.48 | Low risk to die | ||
| 30 per 1000 | 15 per 1000 | Number of people who will die | ||||
| High risk to die | ||||||
| 150 per 1000 | 75 per 1000 | |||||
| Mortality sensitivity analysis (calculated instead of overall survival) ‐ without UK NCRI Rapid trial and MSKCC trial #90‐44due to high risk of other bias Follow‐up : 5 years The low‐ mortality rate was taken from the EORTC‐GELA H9‐F trial, the high‐ mortality rate was taken from the Mexico B2H031trial | 816 | ⊕⊕⊕⊝ | HR 0.31 | Low risk to die | ||
| 30 per 1000 | 9 per 1000 | Number of people who will die | ||||
| High risk to die | ||||||
| 150 per 1000 | 49 per 1000 | |||||
| Relapse, progression or death (calculated instead of PFS) Follow‐up : 5 years | 1351 | ⊕⊕⊕⊝ | HR 0.42 | Low risk of progress, relapse or death | ||
| 100 per 1000 | 43 per 1000 | Number of people who will have a progress, relapse or die | ||||
| High risk of progress, relapse or death | ||||||
| 300 per 1000 | 139 per 1000 | |||||
| Infection‐ related mortality | 152 | ⊕⊕⊝⊝ | RR 0.33 | Study population | ||
| 13 per 1000 | 4 per 1000 | |||||
| Second cancer‐ related mortality | 1199 | ⊕⊕⊝⊝ | RR 0.53 | Study population | ||
| 9 per 1,000 | 5 per 1000 | |||||
| Cardiac disease‐ related mortality | 457 | ⊕⊕⊝⊝ | RR 2.94 | Low risk | ||
| 1 per 1,000 | 3 per 1000 | |||||
| Complete response rate | 376 | ⊕⊕⊝⊝ | RR 1.08 | Study population | ||
| 839 per 1,000 | 906 per 1000 | |||||
| *The risk in the intervention group (and its 95% confidence interval) is based on the assumed risk in the comparison group and the relative effect of the intervention (and its 95% CI). | ||||||
| GRADE Working Group grades of evidence | ||||||
| 1 Substantial heterogeneity, downgraded by 1 point for inconsistency 2 Sensitivity analysis, excluding two trials with potential high risk of other bias. Downgraded by 1 point for imprecision due to low number of included patients and events 3 Definition of PFS varied across trials, downgraded by 1 point for inconsistency 4 Very small number of events, downgraded by 2 points for imprecision 5Statistical heterogeneity (I ² = 67%), downgraded by 1 point for inconsistency 6 Low number of events, downgraded by 1 point for imprecision | ||||||
| Different numbers of chemotherapy cycles in both arms | ||||||
| Chemotherapy alone versus chemotherapy plus radiotherapy for adults with early stage Hodgkin lymphoma | ||||||
| Outcomes | № of participants | Quality of the evidence | Relative effect | Anticipated absolute effects* (95% CI) | Comment | |
| Risk with chemotherapy only | Risk with chemotherapy plus radiotherapy | |||||
| Mortality (calculated instead of overall survival) Follow‐up : 5 years The low‐ mortality rate was taken from the EORTC‐GELA H9‐F trial, the high‐ mortality rate was taken from the Mexico B2H031trial | 276 | ⊕⊕⊝⊝ | HR 2.12 | Low risk to die | ||
| 30 per 1000 | 63 per 1000 | Number of people who will die | ||||
| High risk to die | ||||||
| 150 per 1000 | 291 per 1000 | |||||
| Relapse, progression or death (calculated instead of PFS) Follow‐up : 5 years | 1176 | ⊕⊕⊝⊝ | HR 0.42 | Low risk of progress, death | ||
| 100 per 1000 | 43 per 1000 | Number of people who will have a progress, relapse or die | ||||
| High risk of progress, death | ||||||
| 300 per 1000 | 139 per 1000 | |||||
| Relapse, progression or death (calculated instead of PFS) sensitivity analysis ‐ without HD6trial due to high risk of other bias Follow‐up : 5 years | 900 2 (RCTs) | ⊕⊕⊕⊝ | HR 0.24 | Low risk of progress, death | ||
| 100 per 1000 | 25 per 1000 (7 to 88) | Number of people who will have a progress, relapse or die | ||||
| High risk of progress, death | ||||||
| 300 per 1000 | 82 per 1000 (25 to 269) | |||||
| Infection‐ related mortality | 276 | ⊕⊕⊝⊝ | RR 6.90 | Low risk | ||
| 1 per 1000 | 7 per 1000 | |||||
| Second cancer‐ related mortality | 276 | ⊕⊕⊝⊝ | RR 2.22 | Study population | ||
| 29 per 1000 | 65 per 1000 | |||||
| Cardiac disease‐ related mortality | 276 | ⊕⊕⊝⊝ | RR 0.99 | Study population | ||
| 15 per 1000 | 14 per 1000 | |||||
| Complete response rate | not reported | |||||
| *The risk in the intervention group (and its 95% confidence interval) is based on the assumed risk in the comparison group and the relative effect of the intervention (and its 95% CI). | ||||||
| GRADE Working Group grades of evidence | ||||||
| 1 Very low number of events, downgraded by 2 points for imprecision 2 Serious heterogeneity (I² = 84%), downgraded by 2 points for inconsistency | ||||||
| Number of patients evaluated | 18: chemotherapy 19: chemotherapy plus radiotherapy | 193: chemotherapy 188: chemotherapy plus radiotherapy | 268: chemotherapy 251: chemotherapy plus radiotherapy | 137: chemotherapy 139: chemotherapy plus radiotherapy | 130: chemotherapy 448: chemotherapy plus radiotherapy | 99: chemotherapy 102: chemotherapy plus radiotherapy | 76: chemotherapy 76: chemotherapy plus radiotherapy | 211: chemotherapy 209: chemotherapy plus radiotherapy |
| Chemotherapy and radiotherapy | 6 cycles of CVPP +/‐ involved‐field radiotherapy (dosage unknown) | 4 cycles of ABVD vs 3 cycles of ABVD + 30 Gy (+6 Gy) involved node radiotherapy | 6 cycles of ABVD vs 4 cycles of ABVD + 30 Gy (+6 Gy) involved node radiotherapy | 4 cycles of ABVD or 2 cycles of ABVD + 35 Gy subtotal nodal radiotherapy | 6 cycles of EBVP +/‐ IF radiotherapy | 6 cycles of ABVD +/‐ EF‐radiotherapy | 6 cycles of ABVD +/‐ EF or IF radiotherapy | 3 cycles of ABVD +/‐ 30 Gy IF‐radiotherapy |
| Median duration of follow‐up | 1.8 years | 1.1 years | 1.1 years | 11.3 years | 4.3 years | 11.4 years | 5.6 years | 60 months |
| Trial | Definition of progression outcome. |
| Definition of disease‐free survival not reported (Note all patients are in CR at the time of randomisation). | |
| From the date of random assignment to date of progression—as relapse after previous complete remission or progression after reaching partial remission (>= 50% decrease and resolution of B symptoms and no new lesions) or progressive disease (50% increase from nadir of any previous partial remission lesions or appearance of new lesions) on computed tomography scan measurements during protocol treatment or death resulting from any cause, whichever occurred first. | |
| Measured as event‐free survival from the date of randomisation until the date of disease progression or death from any cause. | |
| Contradictory definitions. In the methods section: “Disease free survival was calculated for CR patients from the beginning of treatment until clinically or radiologically and biopsy proven relapse.” In the results section the percentage disease free were calculated based on the full population. | |
| Time from enrolment until any progression of disease. | |
| Time from the date of randomisation to first progression, relapse, or death, whichever occurred first. |
| Outcome or subgroup title | No. of studies | No. of participants | Statistical method | Effect size |
| 1 All trials Show forest plot | 5 | 1388 | Hazard Ratio (Random, 95% CI) | 0.48 [0.22, 1.06] |
| 2 Proportion of patients early favourable Show forest plot | 4 | 968 | Hazard Ratio (Random, 95% CI) | 0.31 [0.19, 0.50] |
| 2.1 All patients early favourable | 1 | 578 | Hazard Ratio (Random, 95% CI) | 0.27 [0.04, 1.74] |
| 2.2 Mixed patient population (˜ 30 to 50% patients early unfavourable) | 1 | 152 | Hazard Ratio (Random, 95% CI) | 0.31 [0.08, 1.15] |
| 2.3 All patients early unfavourable | 2 | 238 | Hazard Ratio (Random, 95% CI) | 0.31 [0.18, 0.54] |
| 3 Bulky vs non‐bulky Show forest plot | 4 | 1351 | Hazard Ratio (Random, 95% CI) | 0.47 [0.18, 1.19] |
| 3.1 Bulky disease | 1 | 201 | Hazard Ratio (Random, 95% CI) | 0.29 [0.17, 0.51] |
| 3.2 Non‐bulky disease | 3 | 1150 | Hazard Ratio (Random, 95% CI) | 0.60 [0.16, 2.27] |
| 4 Timing of radiotherapy Show forest plot | 5 | 1388 | Hazard Ratio (Random, 95% CI) | 0.48 [0.22, 1.06] |
| 4.1 Radiotherapy after chemotherapy | 3 | 1150 | Hazard Ratio (Random, 95% CI) | 0.60 [0.16, 2.27] |
| 4.2 Sandwich technique (CT‐RT‐CT) | 1 | 201 | Hazard Ratio (Random, 95% CI) | 0.29 [0.17, 0.51] |
| 4.3 Chemotherapy after radiotherapy | 1 | 37 | Hazard Ratio (Random, 95% CI) | 0.63 [0.11, 3.65] |
| 5 Type of radiotherapy Show forest plot | 5 | 1388 | Hazard Ratio (Random, 95% CI) | 0.48 [0.22, 1.06] |
| 5.1 Involved field | 3 | 1035 | Hazard Ratio (Random, 95% CI) | 0.83 [0.26, 2.67] |
| 5.2 Extended field | 1 | 201 | Hazard Ratio (Random, 95% CI) | 0.29 [0.17, 0.51] |
| 5.3 Mixed radiotherapy | 1 | 152 | Hazard Ratio (Random, 95% CI) | 0.31 [0.08, 1.15] |
| 6 Type of chemotherapy Show forest plot | 5 | 1388 | Hazard Ratio (Random, 95% CI) | 0.48 [0.22, 1.06] |
| 6.1 ABVD | 3 | 773 | Hazard Ratio (Random, 95% CI) | 0.53 [0.17, 1.68] |
| 6.2 CVPP | 1 | 37 | Hazard Ratio (Random, 95% CI) | 0.63 [0.11, 3.65] |
| 6.3 EBVP | 1 | 578 | Hazard Ratio (Random, 95% CI) | 0.27 [0.04, 1.73] |
| 7 ITT‐analysis Show forest plot | 5 | 1388 | Hazard Ratio (Random, 95% CI) | 0.48 [0.22, 1.06] |
| 7.1 ITT‐analysis | 4 | 1351 | Hazard Ratio (Random, 95% CI) | 0.47 [0.18, 1.19] |
| 7.2 No ITT‐analysis | 1 | 37 | Hazard Ratio (Random, 95% CI) | 0.63 [0.11, 3.65] |
| Outcome or subgroup title | No. of studies | No. of participants | Statistical method | Effect size |
| 1 Sensitivity analysis ‐ without UK NCRI RAPID and MSKCC trial #90‐44 Show forest plot | 3 | 816 | Hazard Ratio (Random, 95% CI) | 0.31 [0.19, 0.52] |
| 2 Proportion of patients early favourable Show forest plot | 3 | 816 | Hazard Ratio (Random, 95% CI) | 0.31 [0.19, 0.52] |
| 2.1 All patients early favourable | 1 | 578 | Hazard Ratio (Random, 95% CI) | 0.27 [0.04, 1.74] |
| 2.2 All patients early unfavourable | 2 | 238 | Hazard Ratio (Random, 95% CI) | 0.31 [0.18, 0.54] |
| 3 Bulky vs non‐bulky Show forest plot | 2 | 779 | Hazard Ratio (Random, 95% CI) | 0.29 [0.17, 0.50] |
| 3.1 Bulky disease | 1 | 201 | Hazard Ratio (Random, 95% CI) | 0.29 [0.17, 0.51] |
| 3.2 Non‐bulky disease | 1 | 578 | Hazard Ratio (Random, 95% CI) | 0.27 [0.04, 1.74] |
| 4 Timing of radiotherapy Show forest plot | 3 | 816 | Hazard Ratio (Random, 95% CI) | 0.31 [0.19, 0.52] |
| 4.1 Radiotherapy after chemotherapy | 1 | 578 | Hazard Ratio (Random, 95% CI) | 0.27 [0.04, 1.74] |
| 4.2 Sandwich technique (CT‐RT‐CT) | 1 | 201 | Hazard Ratio (Random, 95% CI) | 0.29 [0.17, 0.51] |
| 4.3 Chemotherapy after radiotherapy | 1 | 37 | Hazard Ratio (Random, 95% CI) | 0.63 [0.11, 3.65] |
| 5 Type of radiotherapy Show forest plot | 3 | 816 | Hazard Ratio (Random, 95% CI) | 0.31 [0.19, 0.52] |
| 5.1 Involved field | 2 | 615 | Hazard Ratio (Random, 95% CI) | 0.42 [0.12, 1.51] |
| 5.2 Extended field | 1 | 201 | Hazard Ratio (Random, 95% CI) | 0.29 [0.17, 0.51] |
| 6 Type of chemotherapy Show forest plot | 3 | 816 | Hazard Ratio (Random, 95% CI) | 0.31 [0.19, 0.52] |
| 6.1 ABVD | 1 | 201 | Hazard Ratio (Random, 95% CI) | 0.29 [0.17, 0.51] |
| 6.2 CVPP | 1 | 37 | Hazard Ratio (Random, 95% CI) | 0.63 [0.11, 3.65] |
| 6.3 EBVP | 1 | 578 | Hazard Ratio (Random, 95% CI) | 0.27 [0.04, 1.73] |
| 7 ITT‐analysis Show forest plot | 3 | 816 | Hazard Ratio (Random, 95% CI) | 0.31 [0.19, 0.52] |
| 7.1 ITT‐analysis | 2 | 779 | Hazard Ratio (Random, 95% CI) | 0.29 [0.17, 0.50] |
| 7.2 No ITT‐analysis | 1 | 37 | Hazard Ratio (Random, 95% CI) | 0.63 [0.11, 3.65] |
| Outcome or subgroup title | No. of studies | No. of participants | Statistical method | Effect size |
| 1 All trials Show forest plot | 4 | 1351 | Hazard Ratio (Random, 95% CI) | 0.42 [0.25, 0.72] |
| 2 Proportion of patients early favourable Show forest plot | 4 | 1351 | Hazard Ratio (Random, 95% CI) | 0.42 [0.25, 0.72] |
| 2.1 All patients early favourable | 1 | 578 | Hazard Ratio (Random, 95% CI) | 0.27 [0.17, 0.43] |
| 2.2 Mixed patient population (˜ 30 to 50% patients early unfavourable) | 2 | 572 | Hazard Ratio (Random, 95% CI) | 0.71 [0.43, 1.17] |
| 2.3 All patients early unfavourable | 1 | 201 | Hazard Ratio (Random, 95% CI) | 0.29 [0.17, 0.48] |
| 3 Bulky vs non‐bulky Show forest plot | 4 | 1351 | Hazard Ratio (Random, 95% CI) | 0.42 [0.25, 0.72] |
| 3.1 Bulky disease | 1 | 201 | Hazard Ratio (Random, 95% CI) | 0.29 [0.17, 0.48] |
| 3.2 Non‐bulky disease | 3 | 1150 | Hazard Ratio (Random, 95% CI) | 0.50 [0.24, 1.03] |
| 4 Timing of radiotherapy Show forest plot | 4 | 1351 | Hazard Ratio (Random, 95% CI) | 0.42 [0.25, 0.72] |
| 4.1 Radiotherapy after chemotherapy | 3 | 1150 | Hazard Ratio (Random, 95% CI) | 0.50 [0.24, 1.03] |
| 4.2 Sandwich technique (CT‐RT‐CT) | 1 | 201 | Hazard Ratio (Random, 95% CI) | 0.29 [0.17, 0.48] |
| 5 Type of radiotherapy Show forest plot | 4 | 1351 | Hazard Ratio (Random, 95% CI) | 0.42 [0.25, 0.72] |
| 5.1 Involved field | 2 | 998 | Hazard Ratio (Random, 95% CI) | 0.40 [0.17, 0.94] |
| 5.2 Extended field | 1 | 201 | Hazard Ratio (Random, 95% CI) | 0.29 [0.17, 0.48] |
| 5.3 Mixed radiotherapy | 1 | 152 | Hazard Ratio (Random, 95% CI) | 0.85 [0.37, 1.94] |
| 6 Type of chemotherapy Show forest plot | 4 | 1351 | Hazard Ratio (Random, 95% CI) | 0.42 [0.25, 0.72] |
| 6.1 ABVD | 3 | 773 | Hazard Ratio (Random, 95% CI) | 0.51 [0.26, 0.99] |
| 6.2 EBVP | 1 | 578 | Hazard Ratio (Random, 95% CI) | 0.27 [0.17, 0.43] |
| 7 Sensitivity analysis (per protocol results of the UK NCRI RAPID, without MSKCC trial #90‐44) Show forest plot | 3 | 1199 | Hazard Ratio (Random, 95% CI) | 0.30 [0.22, 0.41] |
| Outcome or subgroup title | No. of studies | No. of participants | Statistical method | Effect size |
| 1 Sensitivity analysis ‐ without UK NCRI RAPID and MSKCC trial #90‐44 Show forest plot | 2 | 779 | Hazard Ratio (Random, 95% CI) | 0.28 [0.20, 0.39] |
| 2 Proportion of patients early favourable Show forest plot | 2 | 779 | Hazard Ratio (Random, 95% CI) | 0.28 [0.20, 0.39] |
| 2.1 All patients early favourable | 1 | 578 | Hazard Ratio (Random, 95% CI) | 0.27 [0.17, 0.43] |
| 2.2 All patients early unfavourable | 1 | 201 | Hazard Ratio (Random, 95% CI) | 0.29 [0.17, 0.48] |
| 3 Bulky vs non‐bulky Show forest plot | 2 | 779 | Hazard Ratio (Random, 95% CI) | 0.28 [0.20, 0.39] |
| 3.1 Bulky disease | 1 | 201 | Hazard Ratio (Random, 95% CI) | 0.29 [0.17, 0.48] |
| 3.2 Non‐bulky disease | 1 | 578 | Hazard Ratio (Random, 95% CI) | 0.27 [0.17, 0.43] |
| 4 Timing of radiotherapy Show forest plot | 2 | 779 | Hazard Ratio (Random, 95% CI) | 0.28 [0.20, 0.39] |
| 4.1 Radiotherapy after chemotherapy | 1 | 578 | Hazard Ratio (Random, 95% CI) | 0.27 [0.17, 0.43] |
| 4.2 Sandwich technique (CT‐RT‐CT) | 1 | 201 | Hazard Ratio (Random, 95% CI) | 0.29 [0.17, 0.48] |
| 5 Type of radiotherapy Show forest plot | 2 | 779 | Hazard Ratio (Random, 95% CI) | 0.28 [0.20, 0.39] |
| 5.1 Involved field | 1 | 578 | Hazard Ratio (Random, 95% CI) | 0.27 [0.17, 0.43] |
| 5.2 Extended field | 1 | 201 | Hazard Ratio (Random, 95% CI) | 0.29 [0.17, 0.48] |
| 6 Type of chemotherapy Show forest plot | 2 | 779 | Hazard Ratio (Random, 95% CI) | 0.28 [0.20, 0.39] |
| 6.1 ABVD | 1 | 201 | Hazard Ratio (Random, 95% CI) | 0.29 [0.17, 0.48] |
| 6.2 EBVP | 1 | 578 | Hazard Ratio (Random, 95% CI) | 0.27 [0.17, 0.43] |
| Outcome or subgroup title | No. of studies | No. of participants | Statistical method | Effect size |
| 1 All trials Show forest plot | 3 | 376 | Risk Ratio (M‐H, Random, 95% CI) | 1.08 [0.93, 1.25] |
| 2 Proportion of patients early favourable Show forest plot | 3 | 376 | Risk Ratio (M‐H, Random, 95% CI) | 1.08 [0.93, 1.25] |
| 2.1 Mixed patient population (˜ 30 to 50% patients early unfavourable) | 1 | 138 | Risk Ratio (M‐H, Random, 95% CI) | 1.0 [0.92, 1.09] |
| 2.2 All patients early unfavourable | 2 | 238 | Risk Ratio (M‐H, Random, 95% CI) | 1.22 [0.84, 1.78] |
| 3 Bulky vs non‐bulky Show forest plot | 3 | 376 | Risk Ratio (M‐H, Random, 95% CI) | 1.08 [0.93, 1.25] |
| 3.1 Bulky disease | 1 | 201 | Risk Ratio (M‐H, Random, 95% CI) | 1.06 [0.93, 1.20] |
| 3.2 Non‐bulky disease | 2 | 175 | Risk Ratio (M‐H, Random, 95% CI) | 1.21 [0.73, 2.01] |
| 4 Timing of radiotherapy Show forest plot | 3 | 376 | Risk Ratio (M‐H, Random, 95% CI) | 1.08 [0.93, 1.25] |
| 4.1 Radiotherapy after chemotherapy | 1 | 138 | Risk Ratio (M‐H, Random, 95% CI) | 1.0 [0.92, 1.09] |
| 4.2 Sandwich technique (CT‐RT‐CT) | 1 | 201 | Risk Ratio (M‐H, Random, 95% CI) | 1.06 [0.93, 1.20] |
| 4.3 Chemotherapy after radiotherapy | 1 | 37 | Risk Ratio (M‐H, Random, 95% CI) | 1.55 [1.06, 2.27] |
| 5 Type of radiotherapy Show forest plot | 3 | 376 | Risk Ratio (M‐H, Random, 95% CI) | 1.08 [0.93, 1.25] |
| 5.1 Involved field | 1 | 37 | Risk Ratio (M‐H, Random, 95% CI) | 1.55 [1.06, 2.27] |
| 5.2 Extended field | 1 | 201 | Risk Ratio (M‐H, Random, 95% CI) | 1.06 [0.93, 1.20] |
| 5.3 Mixed | 1 | 138 | Risk Ratio (M‐H, Random, 95% CI) | 1.0 [0.92, 1.09] |
| 6 Type of chemotherapy Show forest plot | 3 | 376 | Risk Ratio (M‐H, Random, 95% CI) | 1.08 [0.93, 1.25] |
| 6.1 CVPP | 1 | 37 | Risk Ratio (M‐H, Random, 95% CI) | 1.55 [1.06, 2.27] |
| 6.2 ABVD | 2 | 339 | Risk Ratio (M‐H, Random, 95% CI) | 1.02 [0.95, 1.09] |
| 7 ITT‐analysis Show forest plot | 3 | 376 | Risk Ratio (M‐H, Random, 95% CI) | 1.08 [0.93, 1.25] |
| 7.1 ITT‐analysis | 2 | 339 | Risk Ratio (M‐H, Random, 95% CI) | 1.02 [0.95, 1.09] |
| 7.2 No ITT‐analysis | 1 | 37 | Risk Ratio (M‐H, Random, 95% CI) | 1.55 [1.06, 2.27] |
| Outcome or subgroup title | No. of studies | No. of participants | Statistical method | Effect size |
| 1 Sensitivity analysis ‐ without MSKCC trial #90‐44 Show forest plot | 2 | 238 | Risk Ratio (M‐H, Random, 95% CI) | 1.22 [0.84, 1.78] |
| 2 Bulky vs non‐bulky Show forest plot | 2 | 238 | Risk Ratio (M‐H, Random, 95% CI) | 1.22 [0.84, 1.78] |
| 2.1 Bulky disease | 1 | 201 | Risk Ratio (M‐H, Random, 95% CI) | 1.06 [0.93, 1.20] |
| 2.2 Non‐bulky disease | 1 | 37 | Risk Ratio (M‐H, Random, 95% CI) | 1.55 [1.06, 2.27] |
| 3 Timing of radiotherapy Show forest plot | 2 | 238 | Risk Ratio (M‐H, Random, 95% CI) | 1.22 [0.84, 1.78] |
| 3.1 Sandwich technique (CT‐RT‐CT) | 1 | 201 | Risk Ratio (M‐H, Random, 95% CI) | 1.06 [0.93, 1.20] |
| 3.2 Chemotherapy after radiotherapy | 1 | 37 | Risk Ratio (M‐H, Random, 95% CI) | 1.55 [1.06, 2.27] |
| 4 Type of radiotherapy Show forest plot | 2 | 238 | Risk Ratio (M‐H, Random, 95% CI) | 1.22 [0.84, 1.78] |
| 4.1 Involved field | 1 | 37 | Risk Ratio (M‐H, Random, 95% CI) | 1.55 [1.06, 2.27] |
| 4.2 Extended field | 1 | 201 | Risk Ratio (M‐H, Random, 95% CI) | 1.06 [0.93, 1.20] |
| 5 Type of chemotherapy Show forest plot | 2 | 238 | Risk Ratio (M‐H, Random, 95% CI) | 1.22 [0.84, 1.78] |
| 5.1 CVPP | 1 | 37 | Risk Ratio (M‐H, Random, 95% CI) | 1.55 [1.06, 2.27] |
| 5.2 ABVD | 1 | 201 | Risk Ratio (M‐H, Random, 95% CI) | 1.06 [0.93, 1.20] |
| 6 ITT‐analysis Show forest plot | 2 | 238 | Risk Ratio (M‐H, Random, 95% CI) | 1.22 [0.84, 1.78] |
| 6.1 ITT‐analysis | 1 | 201 | Risk Ratio (M‐H, Random, 95% CI) | 1.06 [0.93, 1.20] |
| 6.2 No ITT‐analysis | 1 | 37 | Risk Ratio (M‐H, Random, 95% CI) | 1.55 [1.06, 2.27] |
| Outcome or subgroup title | No. of studies | No. of participants | Statistical method | Effect size |
| 1 All trials Show forest plot | 2 | 339 | Risk Ratio (M‐H, Random, 95% CI) | 1.00 [0.94, 1.07] |
| 2 Proportion of patients early favourable Show forest plot | 2 | 339 | Risk Ratio (M‐H, Random, 95% CI) | 1.00 [0.94, 1.07] |
| 2.1 All patients early favourable | 1 | 138 | Risk Ratio (M‐H, Random, 95% CI) | 0.98 [0.91, 1.06] |
| 2.2 Mixed patient population (˜ 30 to 50% patients early unfavourable) | 1 | 201 | Risk Ratio (M‐H, Random, 95% CI) | 1.04 [0.92, 1.18] |
| 3 Bulky vs non‐bulky Show forest plot | 2 | 339 | Risk Ratio (M‐H, Random, 95% CI) | 1.00 [0.94, 1.07] |
| 3.1 Bulky disease | 1 | 201 | Risk Ratio (M‐H, Random, 95% CI) | 1.04 [0.92, 1.18] |
| 3.2 Non‐bulky disease | 1 | 138 | Risk Ratio (M‐H, Random, 95% CI) | 0.98 [0.91, 1.06] |
| 4 Timing of radiotherapy Show forest plot | 2 | 339 | Risk Ratio (M‐H, Random, 95% CI) | 1.00 [0.94, 1.07] |
| 4.1 Radiotherapy after chemotherapy | 1 | 138 | Risk Ratio (M‐H, Random, 95% CI) | 0.98 [0.91, 1.06] |
| 4.2 Sandwich technique (CT‐RT‐CT) | 1 | 201 | Risk Ratio (M‐H, Random, 95% CI) | 1.04 [0.92, 1.18] |
| 5 Type of radiotherapy Show forest plot | 2 | 339 | Risk Ratio (M‐H, Random, 95% CI) | 1.00 [0.94, 1.07] |
| 5.1 Extended field | 1 | 201 | Risk Ratio (M‐H, Random, 95% CI) | 1.04 [0.92, 1.18] |
| 5.2 Mixed | 1 | 138 | Risk Ratio (M‐H, Random, 95% CI) | 0.98 [0.91, 1.06] |
| Outcome or subgroup title | No. of studies | No. of participants | Statistical method | Effect size |
| 1 Sensitivity analysis ‐ without MSKCC trial #90‐44 Show forest plot | 1 | 201 | Risk Ratio (M‐H, Random, 95% CI) | 1.04 [0.92, 1.18] |
| Outcome or subgroup title | No. of studies | No. of participants | Statistical method | Effect size |
| 1 Infection‐ related mortality Show forest plot | 1 | 152 | Risk Ratio (M‐H, Random, 95% CI) | 0.33 [0.01, 8.06] |
| 2 Second cancer‐ related mortality Show forest plot | 3 | 1199 | Risk Ratio (M‐H, Random, 95% CI) | 0.53 [0.07, 4.29] |
| 3 Cardiac disease‐ related mortality Show forest plot | 2 | 457 | Risk Ratio (M‐H, Random, 95% CI) | 2.94 [0.31, 27.55] |
| Outcome or subgroup title | No. of studies | No. of participants | Statistical method | Effect size |
| 1 Second cancer‐ related mortality Show forest plot | 2 | 779 | Risk Ratio (M‐H, Random, 95% CI) | 0.71 [0.02, 33.60] |
| 2 Cardiac disease‐ related mortality Show forest plot | 1 | 37 | Risk Ratio (M‐H, Random, 95% CI) | 2.85 [0.12, 65.74] |
| Outcome or subgroup title | No. of studies | No. of participants | Statistical method | Effect size |
| 1 All trials Show forest plot | 1 | 276 | Hazard Ratio (Random, 95% CI) | 2.12 [1.03, 4.37] |
| Outcome or subgroup title | No. of studies | No. of participants | Statistical method | Effect size |
| 1 All trials Show forest plot | 3 | 1176 | Hazard Ratio (Random, 95% CI) | 0.42 [0.14, 1.24] |
| 2 Proportion of patients early favourable Show forest plot | 3 | 1176 | Hazard Ratio (Random, 95% CI) | 0.42 [0.14, 1.24] |
| 2.1 All patients early favourable | 1 | 381 | Hazard Ratio (Random, 95% CI) | 0.11 [0.03, 0.40] |
| 2.2 All patients early unfavourable | 2 | 795 | Hazard Ratio (Random, 95% CI) | 0.67 [0.26, 1.76] |
| 3 Bulky vs non‐bulky Show forest plot | 3 | 1176 | Hazard Ratio (Random, 95% CI) | 0.42 [0.14, 1.24] |
| 3.1 Bulky disease | 1 | 519 | Hazard Ratio (Random, 95% CI) | 0.41 [0.22, 0.75] |
| 3.2 Non‐bulky disease | 2 | 657 | Hazard Ratio (Random, 95% CI) | 0.37 [0.04, 3.61] |
| 4 Type of radiotherapy Show forest plot | 3 | 1176 | Hazard Ratio (Random, 95% CI) | 0.42 [0.14, 1.24] |
| 4.1 Subtotal nodal radiation | 1 | 276 | Hazard Ratio (Random, 95% CI) | 1.09 [0.62, 1.93] |
| 4.2 Involved node | 2 | 900 | Hazard Ratio (Random, 95% CI) | 0.24 [0.07, 0.88] |
| Outcome or subgroup title | No. of studies | No. of participants | Statistical method | Effect size |
| 1 Sensitivity analysis ‐ without HD6 Show forest plot | 2 | 900 | Hazard Ratio (Random, 95% CI) | 0.24 [0.07, 0.88] |
| 2 Proportion of patients early favourable Show forest plot | 2 | 900 | Hazard Ratio (Random, 95% CI) | 0.24 [0.07, 0.88] |
| 2.1 All patients early favourable | 1 | 381 | Hazard Ratio (Random, 95% CI) | 0.11 [0.03, 0.40] |
| 2.2 All patients early unfavourable | 1 | 519 | Hazard Ratio (Random, 95% CI) | 0.41 [0.22, 0.75] |
| 3 Bulky vs non‐bulky Show forest plot | 2 | 900 | Hazard Ratio (Random, 95% CI) | 0.24 [0.07, 0.88] |
| 3.1 Bulky disease | 1 | 519 | Hazard Ratio (Random, 95% CI) | 0.41 [0.22, 0.75] |
| 3.2 Non‐bulky disease | 1 | 381 | Hazard Ratio (Random, 95% CI) | 0.11 [0.03, 0.40] |
| Outcome or subgroup title | No. of studies | No. of participants | Statistical method | Effect size |
| 1 Infection‐ related mortality Show forest plot | 1 | 276 | Risk Ratio (M‐H, Random, 95% CI) | 6.9 [0.36, 132.34] |
| 2 Second cancer‐ related mortality Show forest plot | 1 | 276 | Risk Ratio (M‐H, Random, 95% CI) | 2.22 [0.70, 7.03] |
| 3 Cardiac disease‐ related mortality Show forest plot | 1 | 276 | Risk Ratio (M‐H, Random, 95% CI) | 0.99 [0.14, 6.90] |