Quimioterapia de primera línea para la neoplasia trofoblástica gestacional de bajo riesgo
Appendices
Appendix 1. Search strategies 2008
MEDLINE search strategies
Phase I:
1 RANDOMIZED CONTROLLED TRIAL.pt.
2 CONTROLLED CLINICAL TRIAL.pt.
3 RANDOMIZED CONTROLLED TRIALS.sh.
4 RANDOM ALLOCATION.sh.
5 DOUBLE BLIND METHOD.sh.
6 SINGLE BLIND METHOD.sh.
7 1 OR 2 OR 3 OR 4 OR 5 OR 6
8 ANIMALS.sh. not HUMANS.sh.
9 7 not 8
Phase II:
10 CLINICAL TRIAL.pt.
11 exp CLINICAL TRIALS/
12 (clin$ adj25 trial$).ti,ab.
13 ((singl$ or doubl$ or trebl$ or tripl$) adj25 (blind$ or mask$)).ti,ab.
14 PLACEBOS.sh.
15 placebo$.ti,ab.
16 random$.ti,ab.
17 RESEARCH DESIGN.sh.
18 10 OR 11 OR 12 OR 13 OR 14 OR 15 OR 16 OR 17
19 18 not 8
20 19 not 9
Phase III:
21 COMPARATIVE STUDY.pt
22 exp EVALUATION STUDIES/
23 FOLLOW UP STUDIES.sh
24 PROSPECTIVE STUDIES.sh.
25 (control$ or prospectiv$ or volunteer$).ti,ab.
26 21 OR 22 OR 23 OR 24 OR 25
27 26 not 8
28 27 not (9 or 20)
29 9 or 20 or 28
Phase IV (gestational trophoblastic tumours)
30 exp gestational trophoblastic neoplasm
31 exp gestational trophoblastic disease
32 invasive mole
33 choriocarcinoma
34 gestational trophoblastic tumo$
35 gestational trophoblastic disease
36 gestational trophoblastic neoplasm$
37 hydatidiform mole
38 persistent trophoblastic disease
39 GTT
40 GTD
41 GTN
42 30 OR 31 OR 32 OR 33 OR 34 OR 35 OR 36 OR 37 OR 38 OR 39 OR 40 OR 41
Phase V (chemotherapy)
43 dt.fs
44 tu.fs
45 exp drug therapy
46 exp antineoplastic agents
47 chemo$
48 methotrexate
49 actinomycin D
50 etoposide
51 cyclophosphamide
52 cisplatin
53 vincristine
54 chlorambucil
55 doxorubicin
56 melphalan
57 hydroxyurea
58 CHAMOCA
59 EMA‐CO
60 MAC
61 EMA
62 VPB
63 EMACE
64 5‐FU‐Adria
65 43 OR 44 OR 45 OR 46 OR 47 OR 48 OR 49 OR 50 OR 51 OR 52 OR 53 OR 54 OR 55 OR 56 OR 57 OR 58 OR 59 OR 60 OR 61 OR 62 OR 63 OR 64
Phase VI ( combining all previous phases)
66 29 AND 42 AND 65
CENTRAL search strategy:
#1 GTT
#2 GTD
#3 GTN
#4 (GESTATIONAL AND TROPHOBLASTIC)AND TUMO*
#5 (GESTATIONAL AND TROPHOBLASTIC) AND DISEASE
#6 (GESTATIONAL AND TROPHOBLASTIC) AND NEOPLAS*
#7INVASIVE MOLE
#8 CHORIOCRACINOMA
#9 HYDATIDIFORM
#10 PERSISTENT TROPHOBLASTIC DISEASE
#11 (OR/ #1‐#10)
#12 METHOTREXATE
#13 Act DINOMYCIN
#14 ETOPSIDE
#15 CYCLOPHOSPHAMIDE
#16 CISPLATIN
#17 VINCRISTINE
#18 CHLORAMBUCIL
#19 DOXORUBICIN
#20 MELPHALAN
#21 HYDROXYUREA
#22 CHAMOCA
#23 EMA‐CO
#24 MAC
#25 EMA
#26 VPB
#27 EMACE
#28 5‐FU‐ADRIA
#29 CHEMO*
#30 THERAPY
#31 TREATMENT
#32 (OR/ #12‐#31)
#33 (#11 AND #32)
Embasesearch strategy:
Study identification:
#1 Clinical trial/
#2 Randomized controlled trials/
#3 Random Allocation/
#4 Single‐Blind Method/
#5 Double‐Blind Method/
#6 Cross‐Over Studies/
#7 Placebos/
#8 Randomi?ed controlled trial$.tw.
#9 RCT.tw.
#10 Random allocation.tw.
#11 Randomly allocated.tw.
#12 Allocated randomly.tw.
#13 (allocated adj2 random).tw.
#14 Single blind$.tw.
#15 Double blind$.tw.
#16 ((treble or triple) adj blind$).tw.
#17 Placebo$.tw.
#18 Prospective Studies/
#19 or/1‐18
#20 Case study/
#21 Case report.tw.
#22 Abstract report/ or letter/
#23 or/20‐22
#24 19 not 23
#25 animal/
#26 human/
#27 25 not 26
#28 24 not 27
Location of gestational trophoblastic tumours:
#29 exp trophoblastic tumours
#30 exp trophoblastic disease
#31 invasive mole
#32 choriocarcinoma
#33 gestational trophoblastic tumo$
#34 gestational trophoblastic disease
#35 gestational trophoblastic neoplasm$
#36 hydatidiform mole
#37 persistent trophoblastic disease
#38 GTT
#39 GTD
#40 GTN
#41 or/ 29‐40
Location of chemotherapy:
#42 exp cancer chemotherapy
#43 exp antineoplastic agents
#44 DT.FS
#45 TU.FS
#46 chemo*
#47 methotrexate
#48 actinomycin D
#49 etopside
#50 cyclophosphamide
#51 cisplatin
#52 vincristine
#53 chlorambucil
#54 doxorubicin
#55 melphalan
#56 hydroxyurea
#57 CHAMOCA
#58 EMA‐CO
#59 MAC
#60 EMA
#61 VPB
#62 EMACE
#63 5‐FU‐Adria
#64 or/42‐63
Combining phases:
#65 #28 and #41and #64
Appendix 2. Search strategies 2012 and 2016 updates
CENTRAL
#1 MeSH descriptor Trophoblastic Neoplasms explode all trees
#2 (trophoblastic near/5 (cancer* or neoplas* or tumor* or tumour* or disease*))
#3 choriocarcinoma*
#4 ((hydatid* or invasive) near/5 mole*)
#5 molar near/5 pregnanc*
#6 (#1 OR #2 OR #3 OR #4 OR #5)
#7 Any MeSH descriptor with qualifier: DT
#8 MeSH descriptor Antineoplastic Agents explode all trees
#9 MeSH descriptor Antineoplastic Combined Chemotherapy Protocols explode all trees
#10 chemotherap*
#11 (methotrexate or actinomycin D or etoposide or cyclophosphamide or cisplatin or vincristine or chlorambucil or doxorubicin or melphalan or hydroxyurea or CHAMOCA or EMA or EMA‐CO or MAC or VPB or EMACE or 5‐FU* or 5‐fluorouracil)
#12 (#7 OR #8 OR #9 OR #10 OR #11)
#13 (#6 AND #12)
MEDLINE Ovid
1 exp Trophoblastic Neoplasms/
2 (trophoblastic adj5 (cancer* or neoplas* or tumor* or tumour* or disease*)).mp.
3 choriocarcinoma*.mp.
4 ((hydatid* or invasive) adj5 mole*).mp.
5 (molar adj5 pregnanc*).mp.
6 1 or 2 or 3 or 4 or 5
7 drug therapy.fs.
8 exp Antineoplastic Agents/
9 Antineoplastic Combined Chemotherapy Protocols/
10 chemotherap*.mp.
11 (methotrexate or actinomycin D or etoposide or cyclophosphamide or cisplatin or vincristine or chlorambucil or doxorubicin or melphalan or hydroxyurea or CHAMOCA or EMA or EMA‐CO or MAC or VPB or EMACE or 5‐FU* or 5‐fluorouracil).mp.
12 7 or 8 or 9 or 10 or 11
13 6 and 12
14 exp animals/ not humans.sh.
15 13 not 14
key:
mp=protocol supplementary concept, rare disease supplementary concept, title, original title, abstract, name of substance word, subject heading word, unique identifier
Embase Ovid
1 exp trophoblastic tumor/
2 (trophoblastic adj5 (cancer* or neoplas* or tumor* or tumour* or disease*)).mp.
3 choriocarcinoma*.mp.
4 ((hydatid* or invasive) adj5 mole*).mp.
5 (molar adj5 pregnanc*).mp.
6 1 or 2 or 3 or 4 or 5
7 exp chemotherapy/
8 exp antineoplastic agent/
9 chemotherap*.mp.
10 (methotrexate or actinomycin D or etoposide or cyclophosphamide or cisplatin or vincristine or chlorambucil or doxorubicin or melphalan or hydroxyurea or CHAMOCA or EMA or EMA‐CO or MAC or VPB or EMACE or 5‐FU* or 5‐fluorouracil).mp.
11 7 or 8 or 9 or 10
12 6 and 11
13 (exp Animal/ or Nonhuman/ or exp Animal Experiment/) not Human/
14 12 not 13
key:
mp=title, abstract, subject headings, heading word, drug trade name, original title, device manufacturer, drug manufacturer, device trade name, keyword
Appendix 3. Risk of bias assessment for included studies
We assessed the risk of bias of included RCTs in accordance with guidelines in the Cochrane Handbook for Systematic Reviews of Interventions (Higgins 2011) as follows.
Randomisation
The method of randomisation was noted on the data extraction form. We assessed the randomisation as:
-
low risk of bias: e.g. a computer‐generated random sequence or a table of random numbers;
-
high risk of bias: e.g. date of birth, clinic id‐number or surname;
-
unclear risk of bias: e.g. details not reported.
Allocation concealment
We assessed the concealment of allocation sequence from treatment providers and participants as:
-
low risk of bias: e.g. where the allocation sequence could not be foretold;
-
high risk of bias: e.g. the computer‐generated random sequence was displayed so treatment providers could see which arm of the trial the next participant was assigned to, or kept in a sealed opaque envelope;
-
unclear risk of bias: allocation concealment not reported.
Blinding
We described for each included study the methods used, if any, to blind study participants and personnel from knowledge of which intervention a participant received. We considered that studies were at low risk of bias if they were blinded, or if we judged that the lack of blinding would be unlikely to affect results. We assessed blinding separately for different outcomes or classes of outcomes and assessed the methods as:
-
low, high or unclear risk of bias for participants;
-
low, high or unclear risk of bias for personnel.
Incomplete outcome data
We recorded the proportion of participants whose outcomes were not reported at the end of the study and we noted if loss to follow‐up was not reported.
We assessed methods as:
-
low risk of bias, if fewer than 20% of patients were lost to follow‐up and reasons for loss to follow‐up were similar in both treatment arms;
-
high risk of bias, if more than 20% of patients were lost to follow‐up or reasons for loss to follow‐up differed between the treatment arms;
-
unclear risk of bias if loss to follow‐up was not reported.
Selective reporting
We assessed the methods of outcome reporting as:
-
low risk of bias (where it is clear that all of the study’s pre‐specified outcomes and all expected outcomes of interest have been reported);
-
high risk of bias (where not all the study’s pre‐specified outcomes were reported; one or more reported primary outcomes were not pre‐specified; outcomes of interest were reported incompletely and so could not be used; study fails to include results of a key outcome that would have been expected to have been reported);
-
unclear risk of bias.
Other bias
We described for each included study any important concerns we had about other possible sources of bias. We assessed whether each study was free of other problems that could put it at risk of bias and assessed the risk as follows:
-
low risk of other bias;
-
high risk of other bias;
-
unclear whether there is risk of other bias.
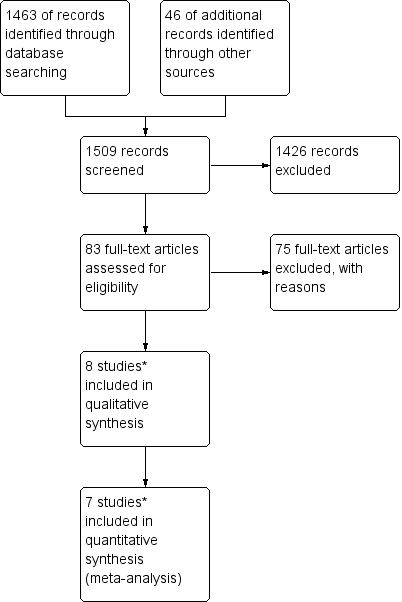
Study flow diagram of the original 2009 review
*The original 2009 review Included four non‐RCTs (Abrao 2008; Kohorn 1996; Smith 1982; Wong 1985) in the qualitative and three (Abrao 2008 not included) in the quantitative meta‐analysis). These non‐RCTs were excluded in the updated review.

Study flow diagram of the updated search conducted from January 2010 to February 2012.

Study flow diagram for the updated search conducted from Feb 2012 to January 2016.
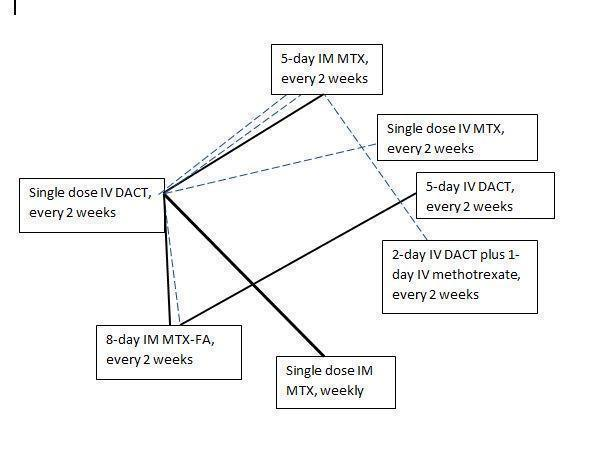
Chemotherapy treatment comparisons of included RCTs (solid lines) and ongoing RCTs (dotted lines)
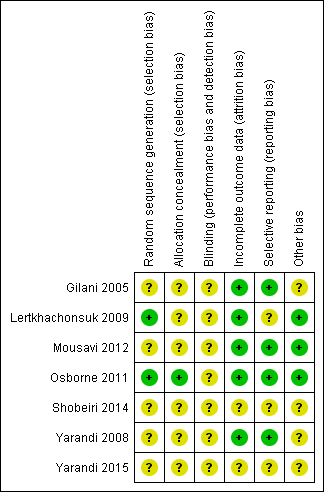
'Risk of bias' summary: review authors' judgements about each risk of bias item for each included study.
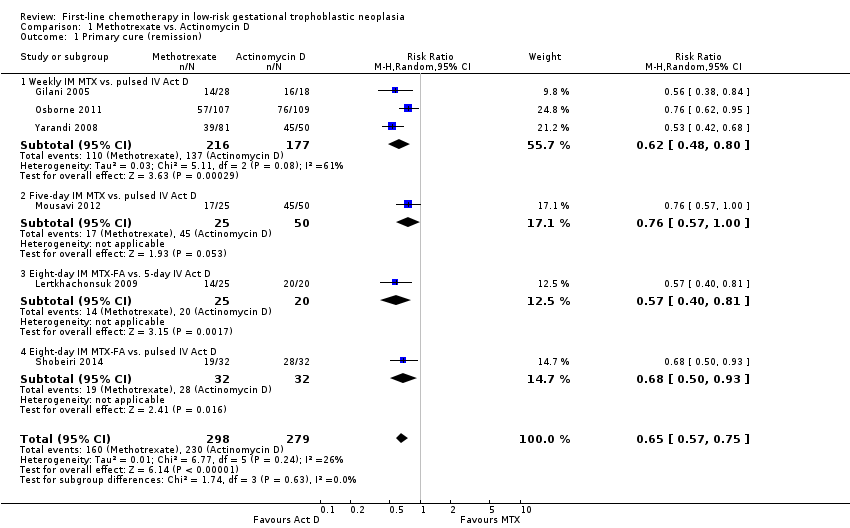
Comparison 1 Methotrexate vs. Actinomycin D, Outcome 1 Primary cure (remission).
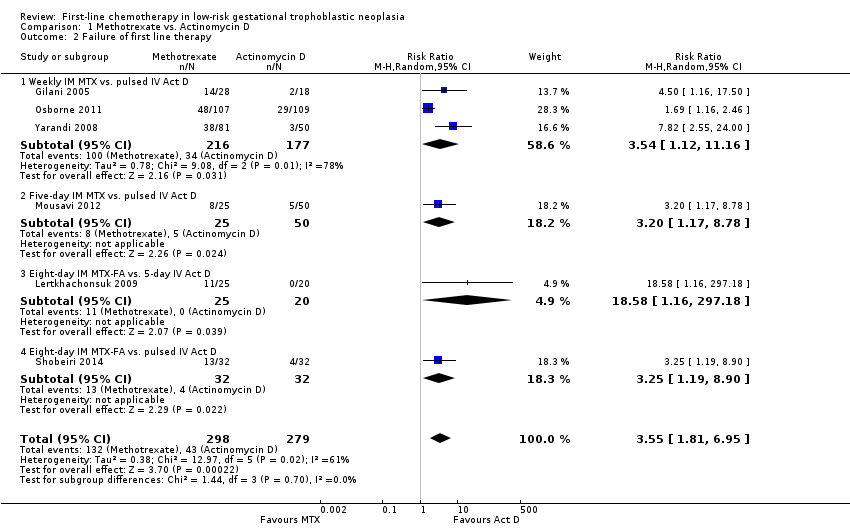
Comparison 1 Methotrexate vs. Actinomycin D, Outcome 2 Failure of first line therapy.
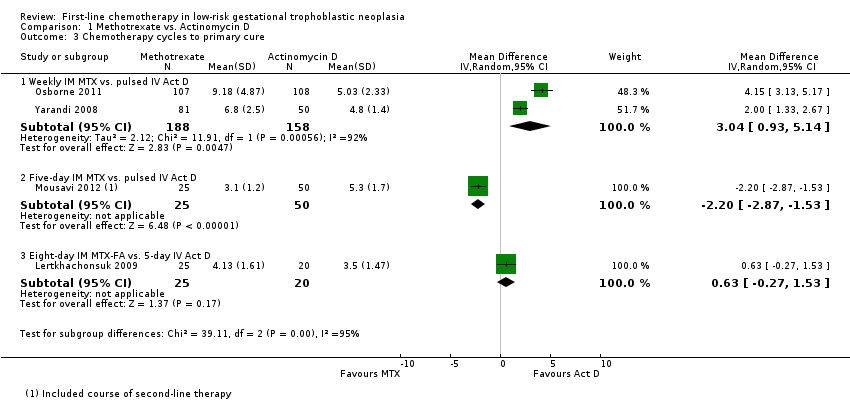
Comparison 1 Methotrexate vs. Actinomycin D, Outcome 3 Chemotherapy cycles to primary cure.

Comparison 1 Methotrexate vs. Actinomycin D, Outcome 4 Adverse effects: Nausea.
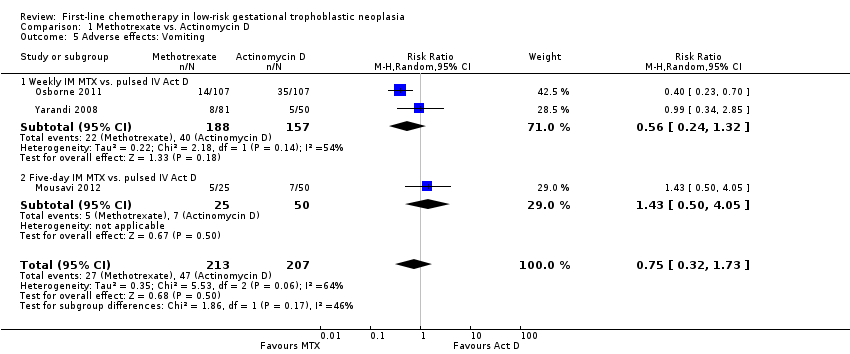
Comparison 1 Methotrexate vs. Actinomycin D, Outcome 5 Adverse effects: Vomiting.

Comparison 1 Methotrexate vs. Actinomycin D, Outcome 6 Adverse effects: Diarrhoea.
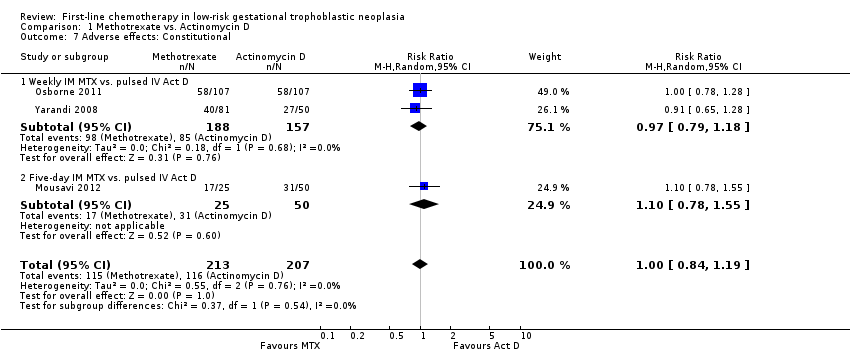
Comparison 1 Methotrexate vs. Actinomycin D, Outcome 7 Adverse effects: Constitutional.
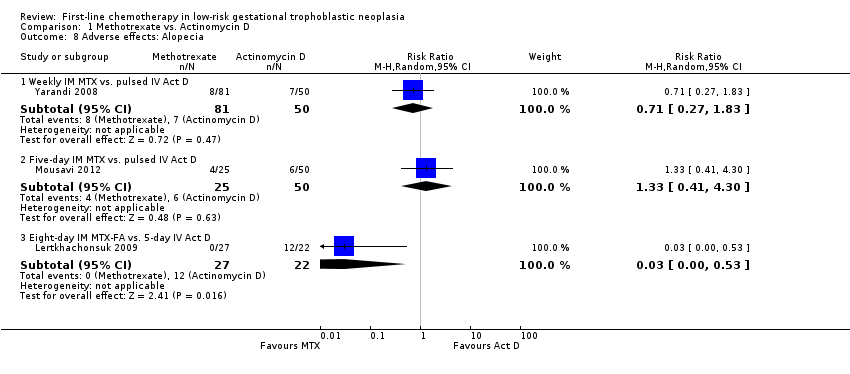
Comparison 1 Methotrexate vs. Actinomycin D, Outcome 8 Adverse effects: Alopecia.
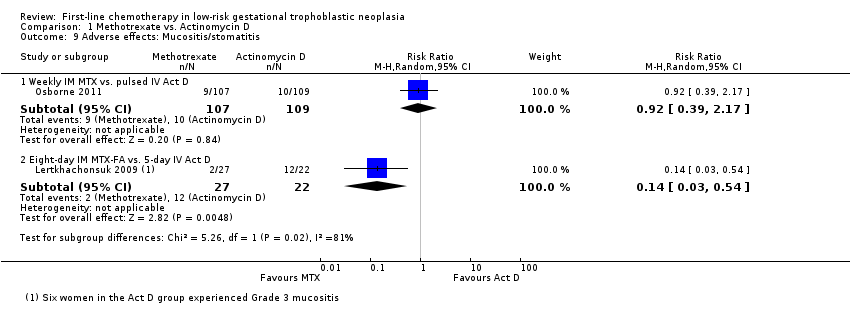
Comparison 1 Methotrexate vs. Actinomycin D, Outcome 9 Adverse effects: Mucositis/stomatitis.
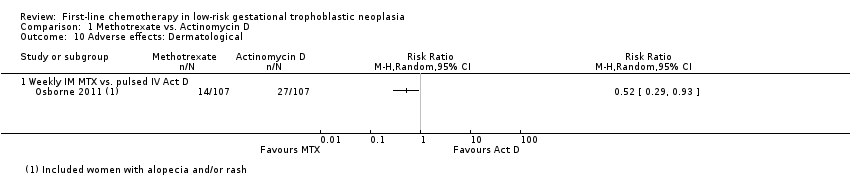
Comparison 1 Methotrexate vs. Actinomycin D, Outcome 10 Adverse effects: Dermatological.

Comparison 1 Methotrexate vs. Actinomycin D, Outcome 11 Adverse effects: Neutropenia.
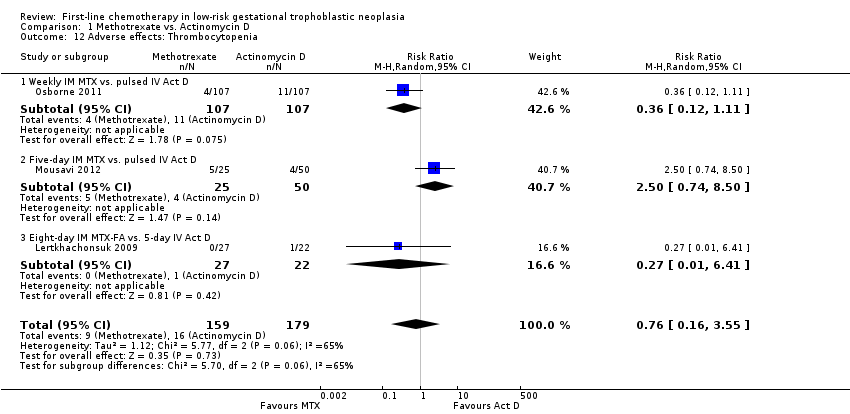
Comparison 1 Methotrexate vs. Actinomycin D, Outcome 12 Adverse effects: Thrombocytopenia.
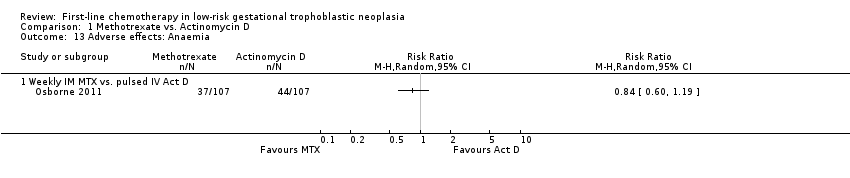
Comparison 1 Methotrexate vs. Actinomycin D, Outcome 13 Adverse effects: Anaemia.
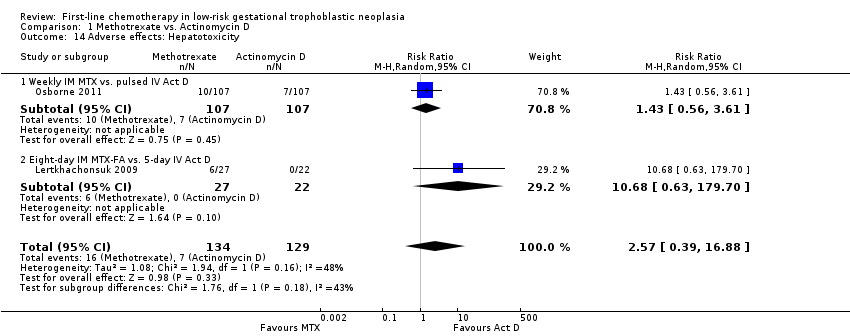
Comparison 1 Methotrexate vs. Actinomycin D, Outcome 14 Adverse effects: Hepatotoxicity.
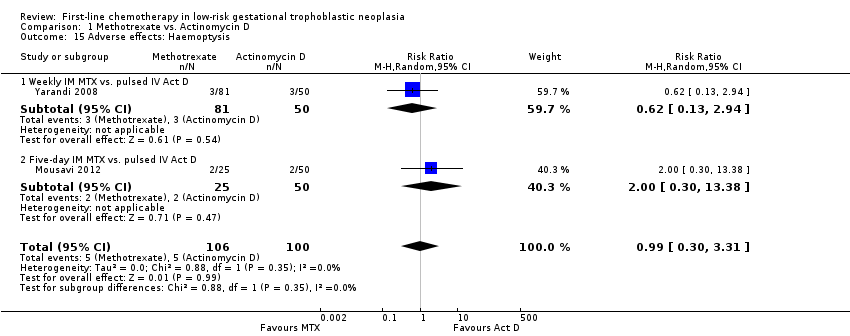
Comparison 1 Methotrexate vs. Actinomycin D, Outcome 15 Adverse effects: Haemoptysis.
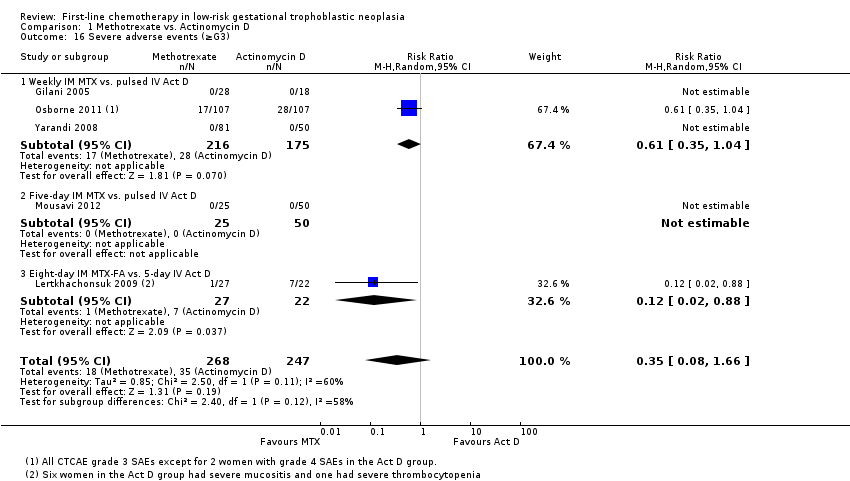
Comparison 1 Methotrexate vs. Actinomycin D, Outcome 16 Severe adverse events (≥G3).
| Actinomycin D compared with methotrexate (MTX) for low‐risk gestational trophoblastic neoplasia (GTN) | ||||||
| Patient or population: women withe low‐risk GTN Settings: outpatient or hospital Intervention: actinomycin D (Act D) Comparison: MTX | ||||||
| Outcomes | Illustrative Assumed risk* (Act D) | Illustrative Corresponding risk (MTX) | Relative effect | No of Participants | Quality of the evidence | Comments |
| Primary cure (remission) | 824 per 1000 | 536 per 1000 (470 to 618) | RR 0.65 (0.57 to 0.75) | 577 women (6 studies) | ⊕⊕⊕⊝ | Act D is probably more likely to achieve a primary cure than MTX. 55% of the data came from trials of weekly IM MTX, which may be less effective than the 5‐ or 8‐day MTX regimens. |
| Failure of first‐line therapy | 154 per 1000 | 547 per 1000 (279 to 1000) | RR 3.55 (1.81 to 6.95) | 577 women (6 studies) | ⊕⊕⊕⊝ | Act D as a first‐line treatment is probably less likely to fail than MTX. 59% of the data came from trials of weekly IM MTX, which may be less effective than the 5‐ or 8‐day MTX regimens. |
| Severe adverse events (≥ grade 3) | 142 per 1000 | 50 per 1000 (11 to 235) | RR 0.35 (0.08 to 1.66) | 515 women (5 studies) | ⊕⊕⊝⊝ low1,2 | There may be little or no difference between interventions overall. However, the point estimate and subgroup analyses favoured MTX. SAEs occurred in 3 out of 6 studies, but one study did not contribute to the meta‐analysis due to insufficient data. |
| Nausea | 462 per 1000 | 282 per 1000 (134 to 582) | RR 0.61 (0.29 to 1.26) | 466 women (4 studies) | ⊕⊕⊕⊝ | There is probably little or no difference between MTX and Act D for nausea. |
| Alopecia | Subtotals only | ⊕⊕⊝⊝ low1,2 | Data on alopecia were not pooled due to substantial subgroup differences. However, in general the evidence suggested that there may be little or no difference between MTX and Act D regimens with regard to alopecia, except for the five‐day Act D regimen, which may be more frequently associated with alopecia than the 8‐day MTX regimen. | |||
| *The basis for the assumed risk is the mean control group risk across studies. The corresponding risk (and its 95% confidence interval) is based on the assumed risk in the comparison group and the relative effect of the intervention (and its 95% CI). | ||||||
| GRADE Working Group grades of evidence IM = intramuscular; SAE = severe adverse effects | ||||||
| 1 Downgraded for clinical or statistical inconsistency 2 Downgraded for imprecision | ||||||
| Stage I | Disease confined to the uterus |
| Stage II | GTN extends outside of the uterus, but is limited to the genital structures (adnexae, vagina, broad ligament) |
| Stage III | GTN extends to the lungs with or without known genital tract involvement |
| Stage IV | All other metastatic sites |
| *FIGO 2009 | |
| Scores | 0 | 1 | 2 | 4 |
| Age (years) | < 40 | ≥ 40 | – | – |
| Antecedent pregnancy | mole | abortion | term | – |
| Interval months from index pregnancy | < 4 | 4–6 | 7–12 | > 12 |
| Pretreatment serum hCG (IU/L) | < 103 | 103 to 104 | 104 to 105 | > 105 |
| Largest tumour size (including uterus) | < 3 | 3cm to 4 cm | ≥ 5 cm | – |
| Site of metastases | lung | spleen, kidney | gastrointestinal | liver, brain |
| Number of metastases | – | 1to 4 | 5 to 8 | > 8 |
| Previous failed chemotherapy | – | – | single drug | ≥ 2 drugs |
| To stage and allot a risk factor score, a patient's diagnosis is allocated to a stage as represented by a Roman numeral I, II, III, and IV. This is then separated by a colon from the sum of all the actual risk factor scores expressed in Arabic numerals, i.e., stage II:4, stage IV:9. This stage and score will be allotted for each patient.(FIGO 2009). A score ≤ 6 indicates low‐risk; > 6 indicates high‐risk. | ||||
| hCG = human chorionic gonadotrophin; IU = Internationa Units | ||||
| Drug | Study | Comment |
| Intravenous (IV) methotrexate (100, 150, or 300 mg/m²) with folinic acid rescue 24 hours later, repeated weekly | The original Bagshawe regimen. | |
| Bolus (100 mg/m² IV or IM) and 12‐hour continuous methotrexate infusion (200 mg/m²) with folinic acid rescue 24 hours later, repeated fortnightly | ||
| Combined 5‐day methotrexate (day 1 to 5) and 5‐day actinomycin D (day 15 to 19), repeated every 28 days | Associated with a high incidence of toxicity. | |
| High‐dose methotrexate (600 mg/m²) | Did not effect a higher cure than other methotrexate regimens. | |
| Etoposide (oral and parenteral) | Reported to be highly effective but not widely used for low‐risk GTN due to the high risk of side‐effects, particularly alopecia. | |
| Fluorouracil | Used in China for several decades, mainly because of its low cost, but is not favoured elsewhere. | |
| Intra‐lesional methotrexate infusion | Not favoured in Europe or North America. | |
| Chinese preparations | Not favoured in Europe or North America. | |
| GTN = gestational trophoblastic neoplasia | ||
| Outcome or subgroup title | No. of studies | No. of participants | Statistical method | Effect size |
| 1 Primary cure (remission) Show forest plot | 6 | 577 | Risk Ratio (M‐H, Random, 95% CI) | 0.65 [0.57, 0.75] |
| 1.1 Weekly IM MTX vs. pulsed IV Act D | 3 | 393 | Risk Ratio (M‐H, Random, 95% CI) | 0.62 [0.48, 0.80] |
| 1.2 Five‐day IM MTX vs. pulsed IV Act D | 1 | 75 | Risk Ratio (M‐H, Random, 95% CI) | 0.76 [0.57, 1.00] |
| 1.3 Eight‐day IM MTX‐FA vs. 5‐day IV Act D | 1 | 45 | Risk Ratio (M‐H, Random, 95% CI) | 0.57 [0.40, 0.81] |
| 1.4 Eight‐day IM MTX‐FA vs. pulsed IV Act D | 1 | 64 | Risk Ratio (M‐H, Random, 95% CI) | 0.68 [0.50, 0.93] |
| 2 Failure of first line therapy Show forest plot | 6 | 577 | Risk Ratio (M‐H, Random, 95% CI) | 3.55 [1.81, 6.95] |
| 2.1 Weekly IM MTX vs. pulsed IV Act D | 3 | 393 | Risk Ratio (M‐H, Random, 95% CI) | 3.54 [1.12, 11.16] |
| 2.2 Five‐day IM MTX vs. pulsed IV Act D | 1 | 75 | Risk Ratio (M‐H, Random, 95% CI) | 3.2 [1.17, 8.78] |
| 2.3 Eight‐day IM MTX‐FA vs. 5‐day IV Act D | 1 | 45 | Risk Ratio (M‐H, Random, 95% CI) | 18.58 [1.16, 297.18] |
| 2.4 Eight‐day IM MTX‐FA vs. pulsed IV Act D | 1 | 64 | Risk Ratio (M‐H, Random, 95% CI) | 3.25 [1.19, 8.90] |
| 3 Chemotherapy cycles to primary cure Show forest plot | 4 | Mean Difference (IV, Random, 95% CI) | Subtotals only | |
| 3.1 Weekly IM MTX vs. pulsed IV Act D | 2 | 346 | Mean Difference (IV, Random, 95% CI) | 3.04 [0.93, 5.14] |
| 3.2 Five‐day IM MTX vs. pulsed IV Act D | 1 | 75 | Mean Difference (IV, Random, 95% CI) | ‐2.20 [‐2.87, ‐1.53] |
| 3.3 Eight‐day IM MTX‐FA vs. 5‐day IV Act D | 1 | 45 | Mean Difference (IV, Random, 95% CI) | 0.63 [‐0.27, 1.53] |
| 4 Adverse effects: Nausea Show forest plot | 4 | 466 | Risk Ratio (M‐H, Random, 95% CI) | 0.61 [0.29, 1.26] |
| 4.1 Weekly IM MTX vs. pulsed IV Act D | 3 | 391 | Risk Ratio (M‐H, Random, 95% CI) | 0.42 [0.11, 1.62] |
| 4.2 Five‐day IM MTX vs. pulsed IV Act D | 1 | 75 | Risk Ratio (M‐H, Random, 95% CI) | 1.18 [0.72, 1.93] |
| 5 Adverse effects: Vomiting Show forest plot | 3 | 420 | Risk Ratio (M‐H, Random, 95% CI) | 0.75 [0.32, 1.73] |
| 5.1 Weekly IM MTX vs. pulsed IV Act D | 2 | 345 | Risk Ratio (M‐H, Random, 95% CI) | 0.56 [0.24, 1.32] |
| 5.2 Five‐day IM MTX vs. pulsed IV Act D | 1 | 75 | Risk Ratio (M‐H, Random, 95% CI) | 1.43 [0.50, 4.05] |
| 6 Adverse effects: Diarrhoea Show forest plot | 3 | 419 | Risk Ratio (M‐H, Random, 95% CI) | 1.43 [0.85, 2.41] |
| 6.1 Weekly IM MTX vs. pulsed IV Act D | 2 | 344 | Risk Ratio (M‐H, Random, 95% CI) | 1.34 [0.57, 3.16] |
| 6.2 Five‐day IM MTX vs. pulsed IV Act D | 1 | 75 | Risk Ratio (M‐H, Random, 95% CI) | 1.5 [0.58, 3.85] |
| 7 Adverse effects: Constitutional Show forest plot | 3 | 420 | Risk Ratio (M‐H, Random, 95% CI) | 1.00 [0.84, 1.19] |
| 7.1 Weekly IM MTX vs. pulsed IV Act D | 2 | 345 | Risk Ratio (M‐H, Random, 95% CI) | 0.97 [0.79, 1.18] |
| 7.2 Five‐day IM MTX vs. pulsed IV Act D | 1 | 75 | Risk Ratio (M‐H, Random, 95% CI) | 1.10 [0.78, 1.55] |
| 8 Adverse effects: Alopecia Show forest plot | 3 | Risk Ratio (M‐H, Random, 95% CI) | Subtotals only | |
| 8.1 Weekly IM MTX vs. pulsed IV Act D | 1 | 131 | Risk Ratio (M‐H, Random, 95% CI) | 0.71 [0.27, 1.83] |
| 8.2 Five‐day IM MTX vs. pulsed IV Act D | 1 | 75 | Risk Ratio (M‐H, Random, 95% CI) | 1.33 [0.41, 4.30] |
| 8.3 Eight‐day IM MTX‐FA vs. 5‐day IV Act D | 1 | 49 | Risk Ratio (M‐H, Random, 95% CI) | 0.03 [0.00, 0.53] |
| 9 Adverse effects: Mucositis/stomatitis Show forest plot | 2 | Risk Ratio (M‐H, Random, 95% CI) | Subtotals only | |
| 9.1 Weekly IM MTX vs. pulsed IV Act D | 1 | 216 | Risk Ratio (M‐H, Random, 95% CI) | 0.92 [0.39, 2.17] |
| 9.2 Eight‐day IM MTX‐FA vs. 5‐day IV Act D | 1 | 49 | Risk Ratio (M‐H, Random, 95% CI) | 0.14 [0.03, 0.54] |
| 10 Adverse effects: Dermatological Show forest plot | 1 | Risk Ratio (M‐H, Random, 95% CI) | Totals not selected | |
| 10.1 Weekly IM MTX vs. pulsed IV Act D | 1 | Risk Ratio (M‐H, Random, 95% CI) | 0.0 [0.0, 0.0] | |
| 11 Adverse effects: Neutropenia Show forest plot | 4 | 469 | Risk Ratio (M‐H, Random, 95% CI) | 0.83 [0.48, 1.45] |
| 11.1 Weekly IM MTX vs. pulsed IV Act D | 2 | 345 | Risk Ratio (M‐H, Random, 95% CI) | 0.66 [0.38, 1.15] |
| 11.2 Five‐day IM MTX vs. pulsed IV Act D | 1 | 75 | Risk Ratio (M‐H, Random, 95% CI) | 2.0 [0.43, 9.20] |
| 11.3 Eight‐day IM MTX‐FA vs. 5‐day IV Act D | 1 | 49 | Risk Ratio (M‐H, Random, 95% CI) | 2.44 [0.27, 21.89] |
| 12 Adverse effects: Thrombocytopenia Show forest plot | 3 | 338 | Risk Ratio (M‐H, Random, 95% CI) | 0.76 [0.16, 3.55] |
| 12.1 Weekly IM MTX vs. pulsed IV Act D | 1 | 214 | Risk Ratio (M‐H, Random, 95% CI) | 0.36 [0.12, 1.11] |
| 12.2 Five‐day IM MTX vs. pulsed IV Act D | 1 | 75 | Risk Ratio (M‐H, Random, 95% CI) | 2.5 [0.74, 8.50] |
| 12.3 Eight‐day IM MTX‐FA vs. 5‐day IV Act D | 1 | 49 | Risk Ratio (M‐H, Random, 95% CI) | 0.27 [0.01, 6.41] |
| 13 Adverse effects: Anaemia Show forest plot | 1 | Risk Ratio (M‐H, Random, 95% CI) | Totals not selected | |
| 13.1 Weekly IM MTX vs. pulsed IV Act D | 1 | Risk Ratio (M‐H, Random, 95% CI) | 0.0 [0.0, 0.0] | |
| 14 Adverse effects: Hepatotoxicity Show forest plot | 2 | 263 | Risk Ratio (M‐H, Random, 95% CI) | 2.57 [0.39, 16.88] |
| 14.1 Weekly IM MTX vs. pulsed IV Act D | 1 | 214 | Risk Ratio (M‐H, Random, 95% CI) | 1.43 [0.56, 3.61] |
| 14.2 Eight‐day IM MTX‐FA vs. 5‐day IV Act D | 1 | 49 | Risk Ratio (M‐H, Random, 95% CI) | 10.68 [0.63, 179.70] |
| 15 Adverse effects: Haemoptysis Show forest plot | 2 | 206 | Risk Ratio (M‐H, Random, 95% CI) | 0.99 [0.30, 3.31] |
| 15.1 Weekly IM MTX vs. pulsed IV Act D | 1 | 131 | Risk Ratio (M‐H, Random, 95% CI) | 0.62 [0.13, 2.94] |
| 15.2 Five‐day IM MTX vs. pulsed IV Act D | 1 | 75 | Risk Ratio (M‐H, Random, 95% CI) | 2.0 [0.30, 13.38] |
| 16 Severe adverse events (≥G3) Show forest plot | 5 | 515 | Risk Ratio (M‐H, Random, 95% CI) | 0.35 [0.08, 1.66] |
| 16.1 Weekly IM MTX vs. pulsed IV Act D | 3 | 391 | Risk Ratio (M‐H, Random, 95% CI) | 0.61 [0.35, 1.04] |
| 16.2 Five‐day IM MTX vs. pulsed IV Act D | 1 | 75 | Risk Ratio (M‐H, Random, 95% CI) | 0.0 [0.0, 0.0] |
| 16.3 Eight‐day IM MTX‐FA vs. 5‐day IV Act D | 1 | 49 | Risk Ratio (M‐H, Random, 95% CI) | 0.12 [0.02, 0.88] |