一线化疗治疗低危妊娠滋养细胞肿瘤
摘要
研究背景
本系统综述是对首次发表于2009年第一期的Cochrane系统综述的第二次更新。妊娠滋养细胞肿瘤(gestational trophoblastic neoplasia, GTN)是一种罕见但可治愈的疾病,该疾病发生于妊娠期胎儿绒毛膜上。大多数患有低危GTN的女性可以通过清宫并进行或不进行单药化疗来治愈。然而,全球治疗中心的化疗方案各不相同,这些不同方案的可比效益和风险尚不清楚。
研究目的
确定一线化疗治疗低危GTN的有效性和安全性。
检索策略
我们于2008年9月、2012年2月和2016年1月通过电子方式检索了Cochrane对照试验中心注册库(Cochrane Central Register of Controlled Trials, CENTRAL)、MEDLINE和Embase。此外,我们还检索了线上临床试验注册库以筛选方案和正在进行的试验。
纳入排除标准
在原始系统综述中,我们纳入了随机对照试验(randomised controlled trials, RCT)、半随机对照试验和非随机对照试验,这些试验比较了一线化疗治疗低危GTN的效果。针对此次该系统综述的更新,我们只纳入了RCT。
资料收集与分析
共两名系统综述作者独立评价了已纳入的研究,并将资料提取至预先设计的资料提取表格中。我们使用随机效应模型进行meta分析。
主要结果
我们在此更新的系统综述中纳入了七项RCT(涉及667名女性)。大多数研究都存在低或中等偏倚风险,并且都将甲氨蝶呤与放线菌素D进行了比较。有三项研究将每周一次肌肉注射(IM)甲氨蝶呤与每两周脉冲式静脉注射(IV)放线菌素D进行了比较(涉及393名女性),一项研究将每五天肌肉注射甲氨蝶呤与每两周脉冲式静脉注射放线菌素D进行了比较(涉及75名女性),一项研究将每八周肌肉注射甲氨蝶呤‐亚叶酸(MTX‐FA)和每五天静脉注射放线菌素D进行了比较(涉及49女性),还有一项研究将每八天肌肉注射MTX‐FA和每两周脉冲式静脉注射放线菌素D进行了比较。有一项研究未提供相关数据。
中等质量证据表明放线菌素D可能比甲氨蝶呤更可能实现初步治愈(风险比(risk ratio, RR)=0.65, 95%置信区间(confidence interval, CI) [0.57, 0.75];6项试验,涉及577名受试者;I2=26%),一线甲氨蝶呤治疗可能比放线菌素D治疗更容易失败(RR=3.55, 95%CI [1.81, 6.95];6项试验,涉及577名受试者;I2=61%;中等质量证据)。
中等质量证据表明,甲氨蝶呤和放线菌素D在治疗恶心方面或者任何其他报告个体的副作用方面可能几乎没有或没有差异(4项研究,涉及466名女性;RR=0.61, 95%CI [0.29, 1.26]),尽管所有这些结局的数据都不够充分且不一致,无法得出结论。低质量证据表明,总体而言,在发生严重不良事件(severe adverse events, SAE)的风险方面,各组之间几乎没有或没有差异(5项研究,涉及515名女性;RR=0.35, 95%CI [0.08, 1.66]; I²=60%);然而,作用方向有利于甲氨蝶呤,仍需要更多的证据。此外,来自亚组分析的证据表明,与甲氨蝶呤相比,放线菌素D可能与SAE发生风险更高有关(低质量证据)。我们没有发现这些治疗对患者未来生育能力的影响的证据。
作者结论
与甲氨蝶呤治疗方案相比,放线菌素D可能更可能实现低危GTN女性患者的初步治愈,并且不太可能导致治疗失败。在副作用方面,脉冲式注射放线菌素D和甲氨蝶呤治疗方案之间可能几乎没有或没有差异。然而,与甲氨蝶呤治疗方案相比,放线菌素D可能与严重不良事件(SAE)的发生风险更高有关。仍需要治疗低危GTN的高质量证据,正在进行的四项试验可能会对该领域作出重大贡献。鉴于治疗方案的多样性,这些试验的研究结果可以有助于本系统综述下一版本的网络meta分析,以帮助女性和临床医生确定治疗低危GTN的最佳方案。
PICO
简语概要
抗癌药物对低风险妊娠滋养细胞肿瘤的一线治疗
研究问题是什么?
妊娠滋养细胞肿瘤(gestational trophoblastic neoplasia, GTN)是一种罕见但可治愈的疾病,它是在正常或葡萄胎妊娠(组织在子宫中发育,而不是婴儿)后在子宫内发生的恶性肿瘤。通过特定的评分系统将GTN女性患者分为低危或高危GTN。几乎所有患有低危GTN的女性在接受子宫扩张和子宫刮除术(dilatation and curettage, D&C)后都可以通过化疗(抗癌药物)治愈。甲氨蝶呤和放线菌素D是两种最常用的低危GTN的一线治疗药物,尽管甲氨蝶呤在欧洲和北美受到青睐。有时一线治疗不能治愈疾病或者有副作用需要停药,必须使用二级治疗。如果甲氨蝶呤是首选药物,放线菌素D则通常属于二级治疗,反之亦然。我们之所以进行此次系统综述是因为尚不清楚哪种药物(如果有可能的话)更可能首先治愈低危疾病。此外,尚不清楚哪些药物会引起更多副作用(如果有的话)。
本系统综述是如何进行的?
本系统综述是对首次发表于2009年的系统综述的更新。自开展本系统综述以来,我们已经检索了三次文献(2008年、2012年和2016年),并确定了七项已完成的随机对照试验(randomised controlled trials, RCT)和四项正在进行的试验。已完成的试验比较了三种不同的甲氨蝶呤治疗方案与两种不同的放线菌素D治疗方案,这些方案因药物剂量和给药频率而异。我们将这些试验评价为存在低偏倚风险到中度偏倚风险。我们在可能的情况下提取并合并了数据,根据研究中所比较的治疗对研究进行分组。
我们发现了什么?
总体而言,对于每个进行比较的治疗方案,系统综述证据表明放线菌素D可能比甲氨蝶呤更有可能首先治愈疾病,并且失败的可能性更小。据报告,任何一种治疗的副作用都相对较轻,研究中女性最常见的副作用是恶心、疲劳和贫血。然而,关于副作用和严重不良事件的证据尚不确定。低质量证据表明,放线菌素D治疗可能会导致严重不良事件更常发生,尤其是在五天的治疗方案中。
研究结论
放线菌素D可能是一种比甲氨蝶呤更有效的治疗方法,但关于其副作用和严重不良事件的证据尚不确定,仍需更多证据。还需要更多关于这些治疗对患者未来生育能力的影响的证据。目前有四项RCT正在对甲氨蝶呤和放线菌素D进行比较,它们将对该领域作出重要贡献。
Authors' conclusions
Summary of findings
| Actinomycin D compared with methotrexate (MTX) for low‐risk gestational trophoblastic neoplasia (GTN) | ||||||
| Patient or population: women withe low‐risk GTN Settings: outpatient or hospital Intervention: actinomycin D (Act D) Comparison: MTX | ||||||
| Outcomes | Illustrative Assumed risk* (Act D) | Illustrative Corresponding risk (MTX) | Relative effect | No of Participants | Quality of the evidence | Comments |
| Primary cure (remission) | 824 per 1000 | 536 per 1000 (470 to 618) | RR 0.65 (0.57 to 0.75) | 577 women (6 studies) | ⊕⊕⊕⊝ | Act D is probably more likely to achieve a primary cure than MTX. 55% of the data came from trials of weekly IM MTX, which may be less effective than the 5‐ or 8‐day MTX regimens. |
| Failure of first‐line therapy | 154 per 1000 | 547 per 1000 (279 to 1000) | RR 3.55 (1.81 to 6.95) | 577 women (6 studies) | ⊕⊕⊕⊝ | Act D as a first‐line treatment is probably less likely to fail than MTX. 59% of the data came from trials of weekly IM MTX, which may be less effective than the 5‐ or 8‐day MTX regimens. |
| Severe adverse events (≥ grade 3) | 142 per 1000 | 50 per 1000 (11 to 235) | RR 0.35 (0.08 to 1.66) | 515 women (5 studies) | ⊕⊕⊝⊝ low1,2 | There may be little or no difference between interventions overall. However, the point estimate and subgroup analyses favoured MTX. SAEs occurred in 3 out of 6 studies, but one study did not contribute to the meta‐analysis due to insufficient data. |
| Nausea | 462 per 1000 | 282 per 1000 (134 to 582) | RR 0.61 (0.29 to 1.26) | 466 women (4 studies) | ⊕⊕⊕⊝ | There is probably little or no difference between MTX and Act D for nausea. |
| Alopecia | Subtotals only | ⊕⊕⊝⊝ low1,2 | Data on alopecia were not pooled due to substantial subgroup differences. However, in general the evidence suggested that there may be little or no difference between MTX and Act D regimens with regard to alopecia, except for the five‐day Act D regimen, which may be more frequently associated with alopecia than the 8‐day MTX regimen. | |||
| *The basis for the assumed risk is the mean control group risk across studies. The corresponding risk (and its 95% confidence interval) is based on the assumed risk in the comparison group and the relative effect of the intervention (and its 95% CI). | ||||||
| GRADE Working Group grades of evidence IM = intramuscular; SAE = severe adverse effects | ||||||
| 1 Downgraded for clinical or statistical inconsistency 2 Downgraded for imprecision | ||||||
Background
This is an updated version of this original review first published in the Cochrane Database of Systematic Reviews, 2009, Issue 1, and re‐published as an update in 2012, Issue 7.
Description of the condition
Gestational trophoblastic disease (GTD) is a rare disease of pregnancy arising in the fetal chorion. It encompasses five main clinicopathologic forms: hydatidiform mole (complete and partial), invasive mole, choriocarcinoma, placental site trophoblastic tumour (PSTT) and epithelioid trophoblastic tumour (ETT). The term gestational trophoblastic neoplasia (GTN) refers only to the invasive and malignant forms of GTD i.e. invasive mole, choriocarcinoma, PSTT and ETT. GTN may develop after a molar or non‐molar pregnancy, irrespective of the site and gestational age, as a consequence of autonomous overgrowth of one of the three cell layers of the trophoblast.
The incidence of GTD varies between different regions of the world, with higher rates reported in Indonesia (around 10 per 1000 pregnancies), Mexico (4.6 per 1000) and Japan (two per 1000) and lower rates reported in North America and Europe (less than one per 1000); however, rates differ according to whether studies are population‐based or hospital‐based and may vary between areas within the same country (Lee 2009). Newer data from North America and Asia suggest that rates of GTD are declining (Lee 2009). The aetiology of GTD is poorly understood; a previous molar pregnancy and advanced or very young maternal age are associated with an increased risk of GTD; however, other factors including ethnicity, poor nutrition, viral infections and environmental factors may play a role (Lee 2009).
Complete moles (CMs) usually arise as a consequence of duplication of the haploid sperm following fertilisation of an 'empty' ovum, and are therefore diploid and androgenic in origin, with no evidence of fetal tissue. Partial moles (PMs) are typically triploid in origin with two sets of paternal haploid and one set of maternal haploid genes (Fisher 2009). In most cases, moles resolve spontaneously following one or more uterine evacuations without a need for chemotherapy, however, in approximately 16% of CMs and 0.5% of PMs the disease persists and chemotherapy is required (Seckl 2009). Molar transformation to GTN results in an enlarging uterine mass that may invade locally, metastasise to other sites (most ominously, the liver or brain), and lead to death if left untreated. The most common clinical manifestations of post‐molar GTN are vaginal bleeding, uterine and ovarian enlargement, and raised human chorionic gonadotrophin (hCG) levels (Lurain 2010).
Moles are considered to have undergone transformation to GTN if four or more hCG values indicate a plateau over a period of at least three weeks, if there is a rise in at least three consecutive hCG values by at least 10% over a two‐week period, if hCG values are raised six months after evacuation, or if there is a histological diagnosis of choriocarcinoma (Kohorn 2009). Urine hCG levels may be helpful in predicting malignant transformation (Alazzam 2011). There is limited evidence that Vitamin A prophylaxis may reduce the risk of malignant transformation (Andrijono 2010).
Various staging and scoring systems have been developed over the years (Bagshawe 1976; Hammond 1973; Nagan 2002; WHO 1983). The system described by Bagshawe 1976 formed the basis of the World Health Organization (WHO) Prognostic scoring System (WHO 1983) that included age, antecedent pregnancy, interval since antecedent pregnancy, hCG level, ABO blood group, largest tumour site(s) of metastases, site of metastases, and previous chemotherapy. This system was subsequently modified and adapted by the International Federation of Gynecology and Obstetrics (FIGO) (seeTable 1;Table 2) (Nagan 2002; FIGO 2009). The modified WHO‐FIGO system differs from the WHO system in that the ABO blood group risk factor has been eliminated and the risk factor of liver metastases has been upgraded from two to four. A score of six or less defines 'low‐risk' due to the merging of the old intermediate risk group (previously described by scores of five and six) with the existing low‐risk category (score zero to four). A score of seven or more defines 'high‐risk'.
| Stage I | Disease confined to the uterus |
| Stage II | GTN extends outside of the uterus, but is limited to the genital structures (adnexae, vagina, broad ligament) |
| Stage III | GTN extends to the lungs with or without known genital tract involvement |
| Stage IV | All other metastatic sites |
*FIGO 2009
GTN:
| Scores | 0 | 1 | 2 | 4 |
| Age (years) | < 40 | ≥ 40 | – | – |
| Antecedent pregnancy | mole | abortion | term | – |
| Interval months from index pregnancy | < 4 | 4–6 | 7–12 | > 12 |
| Pretreatment serum hCG (IU/L) | < 103 | 103 to 104 | 104 to 105 | > 105 |
| Largest tumour size (including uterus) | < 3 | 3cm to 4 cm | ≥ 5 cm | – |
| Site of metastases | lung | spleen, kidney | gastrointestinal | liver, brain |
| Number of metastases | – | 1to 4 | 5 to 8 | > 8 |
| Previous failed chemotherapy | – | – | single drug | ≥ 2 drugs |
| To stage and allot a risk factor score, a patient's diagnosis is allocated to a stage as represented by a Roman numeral I, II, III, and IV. This is then separated by a colon from the sum of all the actual risk factor scores expressed in Arabic numerals, i.e., stage II:4, stage IV:9. This stage and score will be allotted for each patient.(FIGO 2009). A score ≤ 6 indicates low‐risk; > 6 indicates high‐risk. | ||||
hCG = human chorionic gonadotrophin; IU = Internationa Units
Low‐risk GTN includes invasive moles and choriocarcinomas that receive a low‐risk score. Once the uterus has been evacuated (preferably by suction curettage to minimise the chance of uterine perforation) and a diagnosis of low‐risk GTN has been made, either histologically or following serial hCG measurements, treatment with single‐agent chemotherapy is usually commenced. FIGO criteria for commencing chemotherapy after evacuation are as follows (Mangili 2014):
-
weekly hCG rising (more than a 10% increase over the previous weekly value) for at least three consecutive measurements for a period of at least three weeks (day 0, 7, and 14);
-
weekly hCG plateauing (less than a 10% change over the previous weekly value) for at least four consecutive measurements for a period of at least three weeks (day 0, 7, 14, and 21);
-
persistence of hCG more than six months after evacuation;
-
histological diagnosis of choriocarcinoma.
Other criteria that may be used include a serum hCG greater than 20,000 IU/L more than four weeks after evacuation, because of the risk of uterine perforation and severe haemorrhage (Seckl 2010).
Description of the intervention
There are many effective chemotherapeutic regimens used worldwide for the treatment of low‐risk GTN, mostly involving methotrexate and actinomycin D. The first report of methotrexate therapy for GTN was in 1956 (Hertz 1956). By 1971, methotrexate had been reported in conjunction with folinic acid as "rescue" from the severe marrow and gestational toxicities seen with high‐dose methotrexate given alone (Bagshawe 1976) and actinomycin D had been reported as a drug of choice for initial therapy (Goldstein 1972).
The most commonly used first‐line regimens for treating low‐risk GTN are as follows.
-
Methotrexate eight‐day regimen (1 mg/kg intramuscular (IM), days one, three, five and seven) with folinic acid rescue (days two, four six and eight), repeated every 14 to 16 days (Bagshawe 1989; McNeish 2002); also know as the Charing Cross or Modified Bagshawe regimen.
-
Low‐dose (30 to 50 mg/m²) IM methotrexate, repeated weekly (Homesley 1988; Homesley 1990).
-
Five‐day low‐dose methotrexate (intravenous (IV) or IM); maximum of 25 mg/m² daily for five days, repeated every 14 days (Roberts 1996; Soper 1994).
-
Pulsed IV actinomycin D (1.25 mg/m² to a maximum 2 mg single dose), repeated every 14 days (Osborne 2011; Petrilli 1980; Schlaerth 1984; Twiggs 1983).
-
Five‐day actinomycin D (0.5 mg IV), repeated every 14 days (Kohorn 1996; Osathanondh 1975).
Other regimens that have been described are included in Table 3. Most women with low‐risk GTN will be cured by chemotherapy regardless of the regimen used; however, reported primary remission rates vary and up to 40% per cent of affected women may require additional drug therapy to effect a cure (Homesley 1988; Khan 2003; Lurain 1995; McNeish 2002; Soper 1994). In an analysis of 359 women with low‐risk GTN treated between 1979 and 2006 at the Brewer Trophoblastic Center (Chicago), approximately 80% of women were cured with first‐line single‐agent therapy (mainly methotrexate), an additional 10% responded to sequential single‐agent therapy and approximately 10% needed multi‐agent therapy (Lurain 2011).
| Drug | Study | Comment |
| Intravenous (IV) methotrexate (100, 150, or 300 mg/m²) with folinic acid rescue 24 hours later, repeated weekly | The original Bagshawe regimen. | |
| Bolus (100 mg/m² IV or IM) and 12‐hour continuous methotrexate infusion (200 mg/m²) with folinic acid rescue 24 hours later, repeated fortnightly | ||
| Combined 5‐day methotrexate (day 1 to 5) and 5‐day actinomycin D (day 15 to 19), repeated every 28 days | Associated with a high incidence of toxicity. | |
| High‐dose methotrexate (600 mg/m²) | Did not effect a higher cure than other methotrexate regimens. | |
| Etoposide (oral and parenteral) | Reported to be highly effective but not widely used for low‐risk GTN due to the high risk of side‐effects, particularly alopecia. | |
| Fluorouracil | Used in China for several decades, mainly because of its low cost, but is not favoured elsewhere. | |
| Intra‐lesional methotrexate infusion | Not favoured in Europe or North America. | |
| Chinese preparations | Not favoured in Europe or North America. |
GTN = gestational trophoblastic neoplasia
Due to the chemosensitive nature of this disease and its low prevalence, the choice of treatment regimen depends more on geographic location and clinician's experience/preference than high‐quality evidence relating to the relative efficacy and side‐effects of the various regimens. In Europe and North America, there has been a preference for the five‐day or eight‐day methotrexate regimens. On these regimens, women are usually hospitalised for the first cycle due to concerns regarding potential haemorrhage from arteriovenous malformations, and cycles are usually continued for at least three weeks once hCG is normal.
Historically, five‐day actinomycin D has been associated with severe alopecia and nausea; therefore, in many centres, it is reserved as salvage therapy in cases of methotrexate resistance or toxicity. However, pulsed actinomycin D every 14 days is reported to be effective, with minimal side‐effects, when used as salvage therapy (Covens 2006), and as effective as weekly methotrexate when used as first‐line therapy (Petrilli 1987; Schlaerth 1984; Twiggs 1983). In addition, the pulsed actinomycin D regimen has potential advantages over the other regimens in terms of convenience and cost.
Drug resistance and toxic side‐effects leading to discontinuation and switching to an alternative regimen may occur with either drug. Predictors of resistance to single‐agent treatment in low‐risk GTN include non‐molar antecedent pregnancy, a histological diagnosis of choriocarcinoma (Hammond 1973; Lurain 1995), higher pre‐treatment hCG levels (McGrath 2010; Yarandi 2008) and higher risk scores (Osborne 2011).
Why it is important to do this review
We embarked on this systematic review and meta‐analysis because various treatment regimens are used for the first‐line treatment of low‐risk GTN, yet the comparative benefits and risks of these regimens were unclear.
Objectives
To assess the efficacy and safety of the various first‐line chemotherapy regimens in the treatment of women with low‐risk GTN.
Methods
Criteria for considering studies for this review
Types of studies
Randomised controlled trials (RCTs) comparing first‐line chemotherapy regimens for the treatment of low‐risk gestational trophoblastic neoplasia (GTN).
Types of participants
Inclusions
All women with low‐risk GTN (as defined by any of the known risk‐scoring systems), who received primary chemotherapy. Studies that did not provide complete information about the risk‐scoring system, or that did not distinguish a low‐risk group were excluded from the review.
Exclusions
Women with high‐risk GTN, placental site trophoblastic tumour (PSTT) or epithelial trophoblastic tumour (ETT).
Types of interventions
Any chemotherapeutic agent used in the first‐line treatment of GTN (e.g. methotrexate, actinomycin D, fluorouracil, etoposide) in any dose, duration, frequency and setting.
Types of outcome measures
Primary outcomes
-
Primary cure (remission)
-
Failure of first‐line therapy
-
Overall survival (OS)
-
Death due to toxicity
-
Death due to disease
Secondary outcomes
-
Mean number of courses or time to first‐line cure
-
Mean number of courses or time to first‐line failure (failure was defined as change in regimen due to drug resistance or toxicity, or surgery for drug resistance)
-
Quality of life (QoL), measured by a validated scale
-
Secondary tumours due to chemotherapy
-
Toxicity due to chemotherapy
Grades of toxicity were extracted according to CTCAE 2010:
(a) haematological (anaemia, neutropenia, abnormal liver function);
(b) gastrointestinal (pain, nausea, vomiting);
(c) genitourinary (vaginal bleeding);
(d) skin (stomatitis, mucositis, alopecia, allergy);
(e) neurological (peripheral and central);
(f) respiratory (pain, shortness of breath, pleural effusion).
Search methods for identification of studies
Electronic searches
The original search included, Cochrane Central Register of Controlled Trials (CENTRAL, 2008, Issue 3), Ovid MEDLINE (1950 to 2008) and Embase (1980 to 2008) in September 2008. For the previous review update, we re‐ran these database searches to February 2012.
For this update we extended the searches to January 2016.
CENTRAL (December 2015, Issue 12)
MEDLINE Ovid (2012 to Jan Week 01 2016)
Embase Ovid (2012 to 2016 week 03)
The search strategy was broad and we adapted the key words in the strategies in the databases listed in Searching other resources, as appropriate. We considered papers in all languages. For the original search strategies see Appendix 1 and for the 2012 update see Appendix 2 .
Searching other resources
In addition to electronic searches, for this update we searched the following for ongoing trials: www.ClinicalTrials.gov and the International Clinical Trials Registry Platform search portal (http://apps.who.int/trialsearch/). We searched reference lists of identified studies for additional articles.
Data collection and analysis
Selection of studies
Two review authors independently selected articles on the basis of title and/or abstract for full‐text scrutiny (Mo'iad Alazzam (MA) and John Tidy (JT) for the original review; MA and Theresa Lawrie (TL) for the updates). We excluded those studies that clearly did not meet the inclusion criteria and obtained the full text of the others. For the original review, MA and JT independently assessed each article to determine whether it met the review eligibility criteria. MA and TL did this for the updates. We resolved difference by discussion between the two review authors or by involving a third review author.
Data extraction and management
For the original review, MA and JT independently extracted data using a pre‐designed data extraction form; for the updates, MA and TL performed this using an Excel spread sheet. We included the following information from each study.
-
Design: description of randomisation method, blinding, number of study centres, study duration and number of study withdrawals.
-
Participants: number, mean age, mean risk score.
-
Intervention; name of chemotherapy agents used, dose, route of administration and schedule.
-
Outcomes: Where possible data was extracted to allow intention‐to‐treat (ITT) analysis. For dichotomous outcomes (e.g. primary cure, adverse events, and number of patients who relapsed or died), we abstracted the number of patients in each treatment arm who experienced the outcome of interest, in order to estimate a risk ratio (RR). For continuous outcomes (e.g. quality of life (QoL) measures and duration of treatment), we extracted the arithmetic mean and standard deviation (SD) of the outcome of interest in each treatment arm. For dichotomous and continuous data, we abstracted the number of patients assessed at the endpoint. If reported, we extracted median and range data too. We noted any scoring systems (e.g. FIGO, WHO, National Cancer Institute (NCI)) used.
-
Outcomes: Where possible we extracted data to allow intention‐to‐treat (ITT) analysis. For dichotomous outcomes (e.g. primary cure, adverse events, and number of patients who relapsed or died), we abstracted the number of patients in each treatment arm who experienced the outcome of interest, in order to estimate the RR. For continuous outcomes (e.g. QoL measures and duration of treatment), we extracted the arithmetic mean and SD of the outcome of interest in each treatment arm. For dichotomous and continuous data, we abstracted the number of patients assessed at the endpoint. If reported, we extracted median and range data too. We noted any scoring systems (e.g. FIGO, WHO, NCI) used.
Where the data were insufficient or missing from a trial, we attempted to contact trial investigators for more information. We resolved differences between the review authors by discussion or by referral to a third review author.
Assessment of risk of bias in included studies
We assessed the risk of bias of included studies according to the guidelines in the Cochrane Handbook for Systematic Reviews of Interventions (Higgins 2011) including the following.
-
Selection bias (random sequence generation and allocation concealment).
-
Detection bias (blinding of outcome assessment).
-
Attrition bias (incomplete outcome data, loss to follow‐up).
-
Reporting bias (selective reporting of outcomes).
-
Other possible sources of bias.
For more details of 'Risk of bias' assessment, see Appendix 3.
Measures of treatment effect
We used the following measures of the effect of treatment.
-
For dichotomous outcomes, we present results as summary RR with 95% confidence intervals (CI).
-
For continuous outcomes, we present results as the mean difference (MD) between treatment arms with the associated SD.
Dealing with missing data
We attempted to extract data on the outcomes only among participants who were assessed at endpoint. We did not impute missing outcome data for the primary outcome. If data were missing or only imputed data were reported, we contacted trial authors to request data on the outcomes only among the participants who were assessed.
Assessment of heterogeneity
We assessed heterogeneity between studies by visual inspection of forest plots and by measuring the statistical variation between combined studies using the I² statistic (Deeks 2001; Higgins 2003). In addition, we applied random‐effects modelling (REM) to all pooled‐effect estimates. When heterogeneity was found, we tried to determine the potential reasons for it by examining individual study characteristics.
Assessment of reporting biases
As the largest meta‐analysis included only five studies we did not assess funnel plots.
Data synthesis
We grouped studies into those comparing similar chemotherapy regimens. Within these groups we performed meta‐analyses if there were sufficient trials using the RevMan 2014 software.
-
For dichotomous outcomes, we calculated the RR for each study and pooled these data.
-
For continuous outcomes, we calculated the MD between the treatment arms at the end of follow‐up and pooled these data provided outcomes were measured in a similar way between trials.
-
Random‐effects method was used for all meta‐analyses (DerSimonian 1986).
Grading of the evidence
We created a 'Summary of findings' table in RevMan 2014 using the GRADE approach (GRADEpro GDT 2015). For assessments of the overall quality of evidence for each outcome that included pooled data, we downgraded the evidence from 'high quality' by one level for serious (or by two for very serious) study limitations (risk of bias), indirectness of evidence, serious inconsistency, imprecision of effect estimates or potential publication bias.
Subgroup analysis and investigation of heterogeneity
In the protocol and for the original review, we did not perform subgroup analyses, but grouped studies into individual comparisons based on the comparative interventions and regimens tested. For the revised review, we compared interventions, subgrouping trials by regimen. Therefore, for trials comparing methotrexate with actinomycin D, we considered the following subgroups where possible.
-
Weekly IM methotrexate versus bi‐weekly pulsed IV actinomycin D.
-
Five‐day IM methotrexate versus bi‐weekly pulsed IV actinomycin D.
-
Eight‐day IM methotrexate‐folinic acid (MTX‐FA) versus five‐day IV actinomycin D.
-
Five‐day IM methotrexate versus five‐day IV actinomycin D.
-
Eight‐day IM MTX‐FA versus bi‐weekly pulsed IV actinomycin D.
-
Weekly IM methotrexate versus five‐day pulsed actinomycin D.
Although we did not pre‐specify subgroup analyses, we analysed these 'subgroups' in the original review, where possible, as individual comparisons.
Sensitivity analysis
We performed sensitivity analysis to assess the robustness of the meta‐analyses by comparing the results using all trials and then excluding trials of lower methodological quality or those considered to be at a higher risk of bias.
Results
Description of studies
See Characteristics of included studies; Characteristics of excluded studies
Results of the search
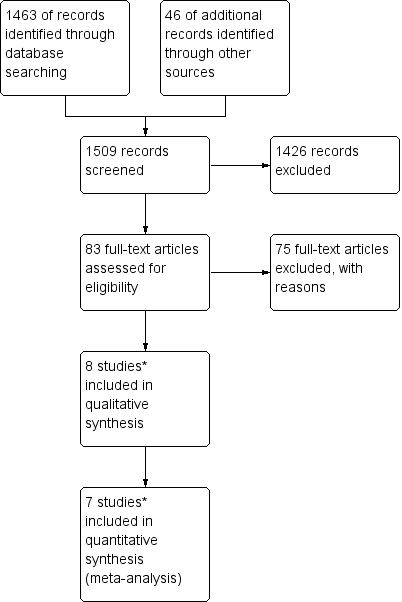
For the original review, we identified 14 potentially eligible studies and, of these, we included eight studies and excluded six (see Figure 1). The original version of the review included four non‐randomised studies (NRS). For the first update published in May 2012, which restricted studies to RCTs, only four of the originally included studies met the revised inclusion criteria (Gilani 2005; Lertkhachonsuk 2009; Osborne 2011; Yarandi 2008). One new study (Mousavi 2012) was included and (see Figure 2), three records relating to the previously included studies (Lertkhachonsuk 2009a; Osborne 2011a; Rahimi‐Moghaddam 2004) and one ongoing study (GOG 0275) were added. Thus, the previous version of this review included data from five RCTs (with eight references).

Study flow diagram of the original 2009 review
*The original 2009 review Included four non‐RCTs (Abrao 2008; Kohorn 1996; Smith 1982; Wong 1985) in the qualitative and three (Abrao 2008 not included) in the quantitative meta‐analysis). These non‐RCTs were excluded in the updated review.

Study flow diagram of the updated search conducted from January 2010 to February 2012.
For this 2016 version of the review, the updated search identified 88 records from which we identified six potentially eligible new studies. After full‐text retrieval of these records, two met the inclusion criteria (Figure 3). One was published as a conference abstract (Yarandi 2015), the other was published in Farsi (Shobeiri 2014). For the latter, at the time of writing we had been unable to obtain the published manuscript from the investigators.
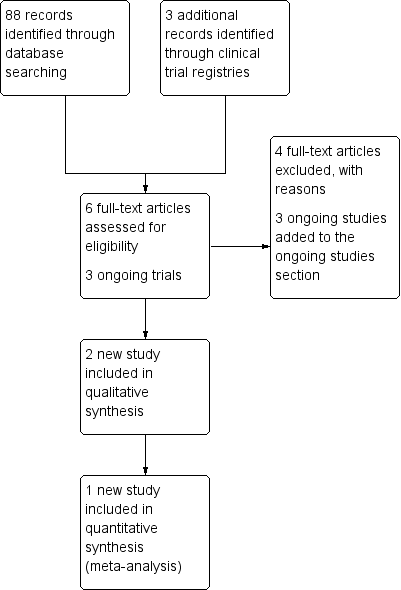
Study flow diagram for the updated search conducted from Feb 2012 to January 2016.
We identified three additional ongoing trials (CTRI/2012/11/003120; IRCT2015012519567N1; NCT01823315) from an updated search of clinical trial registries.
Included studies
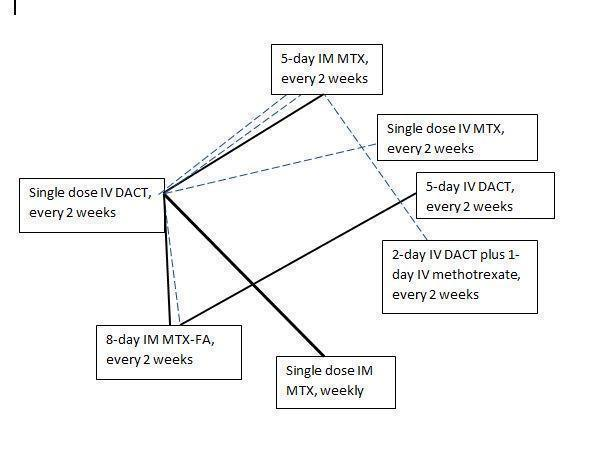
The seven included RCTs enrolled a total of 667 women with low‐risk gestational trophoblastic neoplasia (GTN). Low‐risk GTN was defined by either the earlier WHO/FIGO 2000 scoring system (Gilani 2005; Lertkhachonsuk 2009), or the modified WHO scoring system (Table 2; Mousavi 2012; Shobeiri 2014; Yarandi 2008). One study (Osborne 2011) defined low‐risk GTN as a score of less than or equal to four for women recruited before June 2002, and as less than or equal to six for women recruited from July 2002 and February 2007, following modification of the WHO scoring system. Shobeiri 2014 only included FIGO stage I disease. Another study in the form of a conference abstract only did not state how low‐risk GTN was defined (Yarandi 2015). The included RCTs evaluated the following comparisons (see Figure 4).

Chemotherapy treatment comparisons of included RCTs (solid lines) and ongoing RCTs (dotted lines)
1. Weekly IM methotrexate versus bi‐weekly pulsed IV actinomycin D
Three trials (Gilani 2005; Osborne 2011; Yarandi 2008) compared a weekly IM methotrexate regimen with fortnightly pulsed IV actinomycin D. All three trials used the same protocol of treatment (weekly IM methotrexate at 30 mg/m² versus bi‐weekly pulsed IV actinomycin D at 1.25 mg/m²). Gilani 2005 (46 women) and Yarandi 2008 (131 women) randomised participants in a methotrexate:actinomycin D ratio of 1.5:1 for 'economic reasons'; all participants were evaluated. Osborne 2011 randomised 240 participants in a 1:1 ratio, of whom 214 were analysed.
2. Five‐day IM methotrexate versus bi‐weekly pulsed IV actinomycin D
Mousavi 2012 randomised 75 participants in a ratio of 1:2 to receive five‐day methotrexate (0.4 mg/kg daily IM) or actinomycin D (1.25 mg/m² IV bolus) respectively, repeated every 14 days until normal human chorionic gonadotrophin (hCG) levels were obtained. All participants were evaluated. Yarandi 2015 also evaluated this comparison in 62 women; however, only a conference abstract for this study was available, which did not describe how many participants were allocated to each treatment group and we were unable to obtain this information from the authors. Therefore, Yarandi 2015 contributed no data to this updated review.
3. Eight‐day IM methotrexate‐folinic acid versus five‐day IV actinomycin D
Lertkhachonsuk 2009 randomised 49 participants to receive either five‐day actinomycin D (10 mcg/kg; N = 22) or eight‐day methotrexate‐folinic acid (MTX‐FA) (methotrexate 1 mg/kg, alternate days and folinic acid 0.1 mg/kg alternate days; N = 27). Two participants in each group were not evaluable for the primary outcome.
4. Eight‐day IM methotrexate‐folinic acid versus bi‐weekly pulsed IV actinomycin D
Shobeiri 2014 randomised 64 participants to receive either eight‐day IM methotrexate‐folinic acid (methotrexate 1 mg/kg, alternate days and folinic acid 0.1 mg/kg alternate days; N = 32) or bi‐weekly pulsed IV actinomycin D (1.25 mg/m² IV; N = 32).
Women were followed up in all trials for one year after last treatment. See Characteristics of included studies for further details.
Ongoing studies
As at 28 March 2016, there were four ongoing RCTs as follows.
-
GOG 0275: Eight‐day IM methotrexate‐folinic acid or five‐day methotrexate versus bi‐weekly pulsed IV actinomycin D
-
CTRI/2012/11/003120: One‐day methotrexate infusion versus bi‐weekly pulsed IV actinomycin D
-
IRCT2015012519567N1: Five‐day IV methotrexate versus bi‐weekly pulsed IV actinomycin D
-
NCT01823315: Five‐day IM methotrexate versus IV methotrexate/actinomycin D combined
For more details of the ongoing studies, see Characteristics of ongoing studies and Figure 4.
Excluded studies
For the original review, we excluded six studies (Berkowitz 1979; Gleeson 1993; Matsui 1998; Matsui 2005; Petrilli 1980; Roberts 1996). All these studies were non‐RCTs, excluded mainly due to a high risk of bias. (Characteristics of excluded studies).
For the 2012 updated review, we excluded a further four non‐RCTs, that had been classified as 'included' in the original review (see Differences between protocol and review), on the basis that they were not RCTs. These non‐randomised studies evaluated the following comparisons.
1. Eight‐day methotrexate‐folinic acid versus five‐day methotrexate
Smith 1982 and Wong 1985 compared eight‐day MTX‐FA with the five‐day methotrexate regimen. Both studies used the same treatment protocol (methotrexate at 1 mg/kg days one, three, five and seven and folinic acid at 0.1 mg/kg days two, four, six and eight; OR methotrexate 0.4 mg/kg on days one to five). Ninety‐seven participants received MTX‐FA and 72 participants received five‐day methotrexate. Remission rates in Wong 1985 were 82% versus 79%, respectively; and 82% versus 72% in Smith 1982.
2. 'Pulsed' actinomycin D versus five‐day actinomycin D
Kohorn 1996 compared pulsed actinomycin D (1.25 mg/m²; N = 18) with the five‐day actinomycin D (12 mcg/kg; N = 43). Complete response was achieved in 14 out of 18 (77%) and 38/43 (88%) respectively, with a mean number of 4.6 (SD 5.4) versus 2.7 (SD 1.3) courses. Toxicity was reported as 'minimal' in both groups with no further details.
3. Five‐day methotrexate versus five‐day actinomycin D versus combination of both
Abrao 2008 compared three different regimens; five‐day methotrexate (20 mg/m², N = 42), five‐day actinomycin D (12 mcg/kg, N = 42) and the combination of five‐day methotrexate and actinomycin D (methotrexate 20 mg/day and actinomycin D 500 mcg/kg, N = 24). Remission rates were 69%, 61% and 79%, respectively. Adverse effects occurred most frequently in the combined treatment group (62.5%) and least frequently in the actinomycin D group.
For the 2016 update, we excluded four NRS, including one comparative study that evaluated three treatments as follows.
4. Eight‐day methotrexate‐folinic acid versus five‐day actinomycin D versus five‐day etoposide
In Baptista 2012, 60 women with low‐risk gestational trophoblastic neoplasia (LRGTN) (risk score ≤ 6) were assigned to methotrexate (50 mg/day/IM) alternating with folinic acid rescue for eight days (n = 20), five‐day actinomycin D (12 mcg/kg/IV) (n = 20) or etoposide (100 mg/m2/IV) (n = 20). Complete responses were 50%, 90% and 100% for methotrexate, actinomycin D and etoposide, respectively. MTX was associated with the least toxicity and alopecia was the most common side‐effect caused by etoposide (occurred in 95% of women).
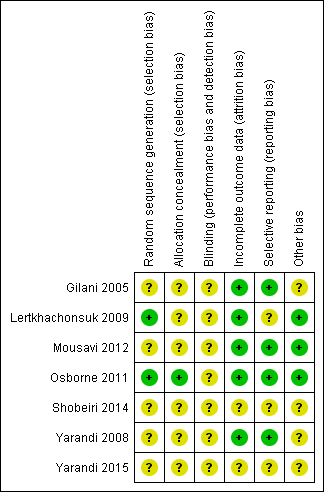
Risk of bias in included studies
The 'Risk of bias' assessment of included studies is graphically represented in Figure 5. In general, we considered Lertkhachonsuk 2009 and Osborne 2011 to be at low risk of bias and the other studies to be at moderate risk of bias due to a lack of clarity about study methods.

'Risk of bias' summary: review authors' judgements about each risk of bias item for each included study.
Allocation
The method of randomisation was described in only two trials: Lertkhachonsuk 2009 (random number tables) and Osborne 2011 (central randomisation). Only one trial described allocation concealment (Osborne 2011).
Blinding
Neither patients nor physicians were blind to the allocated treatment in Osborne 2011. Blinding was not described in most of the other studies. The Shobeiri 2014 abstract states that this study was 'single‐blind', however, in the absence of any details we judged the risk of bias for this study (as for the studies) to be unclear for blinding.
Incomplete outcome data
Loss to follow‐up was low (less than 20% for all assessable outcomes) in one trial (Lertkhachonsuk 2009) and balanced between treatment arms. Four trials reported complete follow‐up (Gilani 2005; Mousavi 2012; Osborne 2011; Yarandi 2008) and for two trials (Shobeiri 2014; Yarandi 2015), there was insufficient information on follow‐up to pass judgement.
Selective reporting
Protocols were only available for two of the seven trials (Osborne 2011; Shobeiri 2014). Five studies reported expected outcomes. Toxicity and adverse effects were insufficiently reported in Gilani 2005 but were described as 'minimal'. For Shobeiri 2014 and Yarandi 2015 there was insufficient information in the abstract reports to pass judgement on reporting bias.
Other potential sources of bias
It is not clear why the data from Gilani 2005 and Yarandi 2008 were not combined by the investigators, since these trials were conducted in consecutive years by the same investigators, compared the same interventions, and applied the same methodology. For this reason, we performed sensitivity analyses, by excluding the Gilani 2005 data in case these data were duplicated in Yarandi 2008. For Shobeiri 2014, and Yarandi 2015 there was insufficient information to pass judgement on other potential sources of bias.
Effects of interventions
See: Summary of findings for the main comparison
One trial (Yarandi 2015) contributed no data to this update. Therefore, six RCTs evaluated 581 women who were randomly allocated to receive methotrexate or actinomycin D for low‐risk GTN.
1. Methotrexate versus Actinomycin D
1.1 Primary cure (remission)
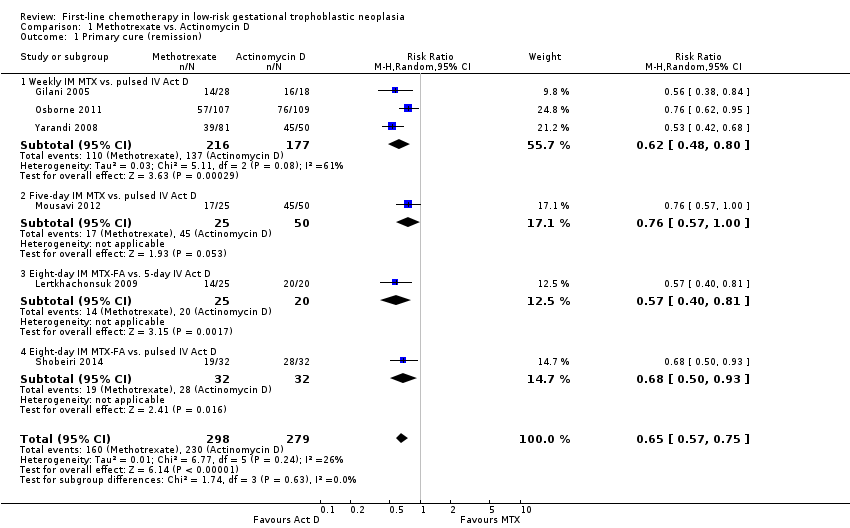
Irrespective of the type of regimen used, actinomycin D is probably more likely to lead to a primary cure than methotrexate in women with low‐risk GTN (risk ratio (RR) 0.65, 95% confidence interval (CI) 0.57 to 0.75; six trials, 577 participants; I2 = 26%; moderate‐certainty evidence, downgraded due clinical inconsistency; Analysis 1.1).
Due to concerns related to Other potential sources of bias, we performed sensitivity analysis, excluding Gilani 2005, and obtained similar results (RR 0.66, 95% CI 0.57 to 0.77).
Tests for subgroup differences indicated no heterogeneity between treatment subgroups for this outcome (I² = 0%).
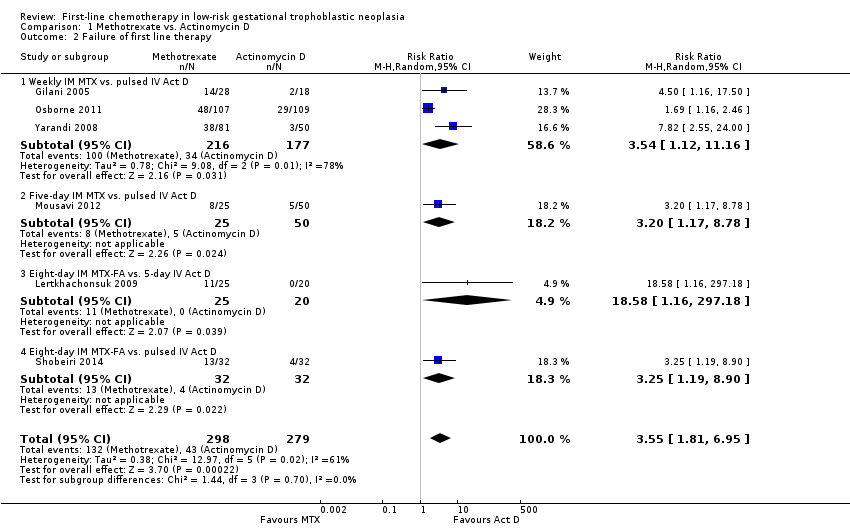
1.2 Failure of first‐line therapy
First‐line chemotherapy is probably more likely to fail with methotrexate regimen than with actinomycin D regimen (RR 3.55, 95% CI 1.81 to 6.95; six trials, 577 participants; I2 = 61%; Analysis 1.2; moderate‐certainty evidence, downgraded due inconsistency). As in Analysis 1.1, a sensitivity analysis, excluding Gilani 2005, produced similar results.
Tests for subgroup differences indicated no heterogeneity between treatment subgroups for this outcome (I² = 0%). The Lertkhachonsuk 2009 data included six women in the methotrexate‐folinic acid (MTX‐FA) group who were changed to second‐line therapy due to chemotoxicity. When we excluded these women, the results were similar.
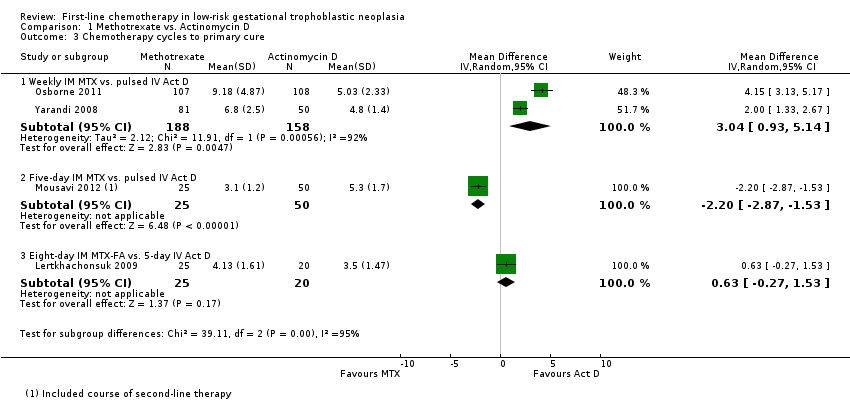
1.3 Chemotherapy cycles to primary cure
The combined data for this outcome was substantially heterogeneous and findings differed according to treatment subgroups (I² = 75.6%, P value = 0.04), therefore, we present these results as subtotals only.
For the subgroup of trials comparing weekly IM methotrexate versus bi‐weekly pulsed IV actinomycin D, fewer cycles of actinomycin D were needed to effect a primary cure (two trials, 346 participants; mean difference (MD) 3.04, 95% CI 0.93 to 5.14; Analysis 1.3). There was substantial heterogeneity between the two trials included in this subgroup (I² = 92%).
The other subgroups included only one trial for this outcome (Analysis 1.3).
Mousavi 2012 reported that significantly fewer cycles were necessary in the five‐day IM methotrexate group than in the pulsed IV actinomycin D group, however, this trial included secondary treatment cycles in these data.
In Lertkhachonsuk 2009, there was no clear difference between the eight‐day MTX‐FA group and the five‐day IV actinomycin D group with regard to the number of cycles.
1.4 to 1.14 Adverse effects
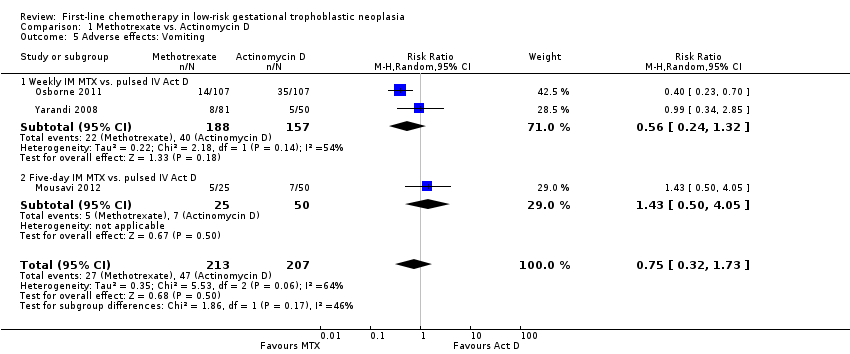
The most commonly occurring side‐effects in both groups were nausea, fatigue (constitutional) and anaemia. Findings indicate that there may be little or no difference between a methotrexate and actinomycin D regimen, overall or for subgroup analyses, in the following side‐effects and adverse events.
-
Nausea (four trials, 466 participants; RR 0.61, 95% CI 0.29 to 1.26; Analysis 1.4; I² = 80%).
-
Vomiting (three trials, 420 participants; RR 0.75, 95% CI 0.32 to 1.73; Analysis 1.5; I² = 64%).
-
Diarrhoea (three trials, 419 participants; RR 1.43, 95% CI 0.85 to 2.41; Analysis 1.6; I² = 0%).
-
Fatigue (constitutional) (three trials, 420 participants; RR 1.00, 95% CI 0.84 to 1.19; Analysis 1.7; I² = 0%).
-
Neutropenia (four trials, 469 participants; RR 0.83, 95% CI 0.48 to 1.45; Analysis 1.11 I² = 4%).
-
Thrombocytopenia (three trials, 338 participants; RR 0.76, 95% CI 0.16 to 3.55; Analysis 1.12; I² = 65%).
-
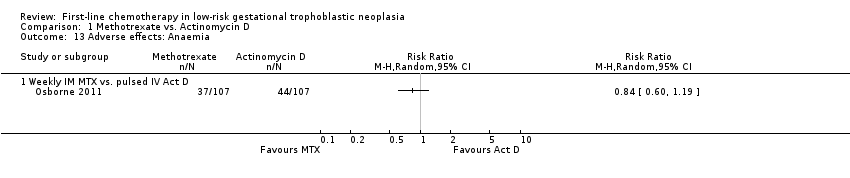
Anaemia (one trial, 214 participants; Analysis 1.13).
-
Hepatotoxicity (two trials, 263 participants; RR 2.57, 95% CI 0.39 to 16.88; Analysis 1.14).
-
Haemoptysis (two trials, 206 participants; RR 0.99, 95% CI 0.30 to 3.31; Analysis 1.15).
This evidence is mostly of low certainty.
Other adverse effects
Three studies reported alopecia. There was no significant difference in the rate of women experiencing alopecia in the two studies that compared methotrexate (weekly or five‐day IM) with pulsed IV actinomycin D (206 participants; RR 0.91, 95% CI 0.43 to 1.90; I² = 0%; Analysis 1.8). However, in the one study that compared eight‐day IM MTX‐FA with five‐day IV actinomycin D (Lertkhachonsuk 2009), significantly more women in the actinomycin D group experienced alopecia (49 participants; RR 0.03, 95% CI 0.00 to 0.53; Analysis 1.8). These findings suggest a dose‐response relationship for actinomycin D and alopecia, and we did not pool these heterogeneous subgroup data (Test for subgroup differences: P value = 0.05; I² = 65.7%).
Similarly, mucositis occurred more frequently in the five‐day IV actinomycin D group than the eight‐day MTX‐FA treatment group of Lertkhachonsuk 2009. These data differed from the only other study reporting this outcome and in which the interventions had similar effects on mucositis (Osborne 2011). Tests for subgroup differences suggest that the effects of these different regimen on the risk of mucositis differ (P value = 0.02; I² = 81%), therefore, we did not pool these data (Analysis 1.9).
Dermatological adverse effects (including rash or alopecia) occurred more frequently in the actinomycin D group, in the one study reporting this combined outcome (Osborne 2011; RR 0.52, 95% CI 0.29 to 0.93; Analysis 1.10), However, these adverse effects were all CTCAE 2010 grade one, except for one grade two effect in the methotrexate group.
Severe adverse events (SAEs; CTCAE 2010 or Gynecologic Oncology Group (GOG) ≥ grade 3) were experienced by participants of two out of the five studies (Lertkhachonsuk 2009; Osborne 2011). All reported SAEs were grade three except for two women in the actinomycin D group of the Osborne 2011 study who experienced grade four haematological SAEs. The evidence overall suggests that there may be little or no difference between the methotrexate and actinomycin D groups for SAEs; however, the evidence is of a low certainty due to imprecision and inconsistency (five trials, 515 participants; RR 0.35, 95% 0.08 to 1.66; Analysis 1.16; I² = 60%). Five‐day actinomycin D may be associated with a higher risk of SAEs than the eight‐day MTX‐FA regimen (low‐certainty evidence).
Six women in the Lertkhachonsuk 2009 study and one women in the Shobeiri 2014 had the allocated treatment (MTX‐FA) discontinued due to hepatotoxicity. No other incidents of treatment discontinuation were reported. No deaths occurred in any of the trials.
Reproductive data were scarce: only Yarandi 2008 reports that "no ovarian failure" occurred.
Discussion
Summary of main results
See summary of findings Table for the main comparison.
Seven RCTs were included and six trials evaluating 577 women contributed data. All trials compared methotrexate with actinomycin D. Moderate‐certainty evidence indicates that actinomycin D is probably more likely to be associated with a higher primary cure rate than methotrexate, irrespective of the treatment regimen compared, and less likely to be associated with first‐line treatment failure.
Side‐effects were reported to be mild (CTCAE 2010 or GOG grade one to two) or minimal in three trials. Low‐certainty evidence suggests that there may be little or no difference in various side‐effects. However, the five‐day actinomycin D regimen may cause more alopecia and mucositis than the eight‐day methotrexate‐folinic acid regimen (MTX‐FA).
Overall, it is uncertain whether there is a difference in the risk of severe adverse events (SAEs) between actinomycin D and methotrexate regimens. However, low‐certainty evidence suggests that the five‐day actinomycin D regimen may be more likely to be associated with SAEs than the eight‐day MTX‐FA regimen.
Overall completeness and applicability of evidence
The evidence indicates that actinomycin D is probably better than methotrexate in achieving a primary cure in women with low‐risk GTN. However, three out of seven included trials used a weekly IM dose of methotrexate and it has been argued that this regimen is not as effective as the five‐ or eight‐day regimens (Aghajanian 2011). Hence, the ongoing research comparing pulsed actinomycin D with more intensive methotrexate regimens (CTRI/2012/11/003120; GOG 0275; IRCT2015012519567N1) is likely to have an important impact on our confidence in this evidence.
Although most included studies reported minimal side‐effects and the evidence indicated that there may be little or no difference in side‐effect outcomes, the relative side‐effect profiles of the two drugs is still uncertain. This is largely because interventions and data were frequently heterogeneous. Furthermore, in the two studies with data on SAEs (mainly grade three) (Lertkhachonsuk 2009; Osborne 2011), data were scarce; however, more SAEs occurred in the actinomycin D group. As side‐effects and SAEs play an important role in treatment choice, more evidence on the relative side‐effects is necessary. However, since the efficacy of actinomycin D does not appear to be adversely affected by the lower, pulsed bi‐weekly dosage, which appears to be associated with fewer side‐effects than the five‐day regimen, pulsed actinomycin D may compare favourably in terms of relative side‐effects to the five‐ and eight‐day methotrexate regimens. This was shown in the one small included study (Mousavi 2012) in which no significant differences were found between these two groups in terms of side‐effects, and no SAEs occurred. Thus, the ongoing trials are likely to make an important contribution to the body of evidence on SAEs and side‐effects.
These results may not be applicable to women with WHO risk scores of five to six and/or those with histologically‐confirmed choriocarcinoma. Yarandi 2008 excluded women with histologically‐confirmed choriocarcinoma from their trial, and Osborne 2011 found that these higher scoring, low‐risk lesions (previously classified as intermediate risk) were significantly less likely to respond to either drug as single‐agent therapy. In the latter study, the primary response rate for these higher scoring lesions was 9% and 42% for methotrexate and actinomycin D, respectively. This needs further investigation.
Women undergoing treatment for low‐risk GTN may wish to bear children in the future. Follow‐up in the included studies was continued for one year after the last treatment cycle and only one mentioned ovarian failure as an potential adverse outcome (Yarandi 2008). Reproductive data should be included in future studies of treatment for low‐risk GTN.
As health economics play an increasingly important role in determining treatment guidelines, particularly where several different treatment regimens result in similar cure rates and similar/low rate of side‐effects, the relative cost of treatment and treatment failure needs to be examined. Unfortunately, this was beyond the scope of this review but may be considered for the next update.
Quality of the evidence
The quality of evidence ranges from low to moderate certainty, with evidence most frequently being downgraded due to clinical or statistical inconsistency and/or imprecision. For more details see summary of findings Table for the main comparison.
Potential biases in the review process
To our knowledge there were no potential biases in the review process. We included all the relevant randomised controlled trials (RCTs) identified by the search. Where there were concerns regarding the quality of included trials, we contacted the investigators, and performed sensitivity analyses. We were unable to obtain the full Shobeiri 2014 manuscript for this 2016 update but still hope to do so and, once translated, to include more data from this study in the next update.
Agreements and disagreements with other studies or reviews
The largest contributing subgroup of trials used the weekly methotrexate regimen. This regimen has been criticised as being less effective than the more commonly used methotrexate treatment regimens, namely the five‐ or eight‐day regimens (Aghajanian 2011). However, efficacy data on the various methotrexate regimens have come mainly from retrospective (Bagshawe 1989; McNeish 2002; Soper 1994) and case‐control studies (Smith 1982; Wong 1985), which may be subject to high levels of bias; furthermore, there have been no RCTs comparing the weekly methotrexate regimen with the five‐ and eight‐day regimens (Figure 4). Given the wide range of methotrexate and actinomycin D regimens evaluated, and the uncertainty with regard to which regimen is optimal, it would seem appropriate to conduct a network meta‐analysis for the next update of this review, when we should be able to include the data from current ongoing studies.
Study flow diagram of the original 2009 review
*The original 2009 review Included four non‐RCTs (Abrao 2008; Kohorn 1996; Smith 1982; Wong 1985) in the qualitative and three (Abrao 2008 not included) in the quantitative meta‐analysis). These non‐RCTs were excluded in the updated review.

Study flow diagram of the updated search conducted from January 2010 to February 2012.

Study flow diagram for the updated search conducted from Feb 2012 to January 2016.
Chemotherapy treatment comparisons of included RCTs (solid lines) and ongoing RCTs (dotted lines)
'Risk of bias' summary: review authors' judgements about each risk of bias item for each included study.
Comparison 1 Methotrexate vs. Actinomycin D, Outcome 1 Primary cure (remission).
Comparison 1 Methotrexate vs. Actinomycin D, Outcome 2 Failure of first line therapy.
Comparison 1 Methotrexate vs. Actinomycin D, Outcome 3 Chemotherapy cycles to primary cure.

Comparison 1 Methotrexate vs. Actinomycin D, Outcome 4 Adverse effects: Nausea.
Comparison 1 Methotrexate vs. Actinomycin D, Outcome 5 Adverse effects: Vomiting.

Comparison 1 Methotrexate vs. Actinomycin D, Outcome 6 Adverse effects: Diarrhoea.
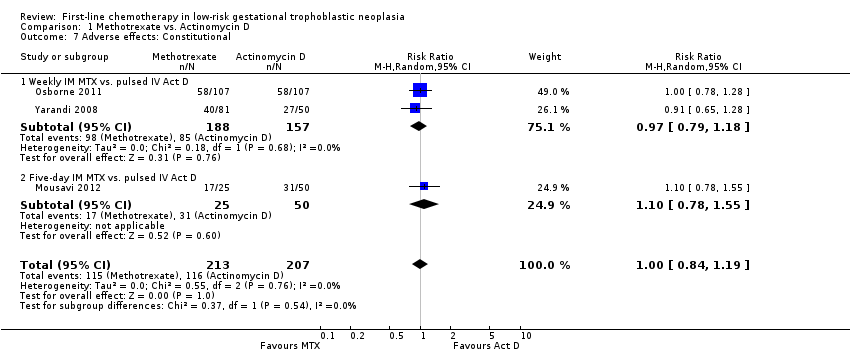
Comparison 1 Methotrexate vs. Actinomycin D, Outcome 7 Adverse effects: Constitutional.
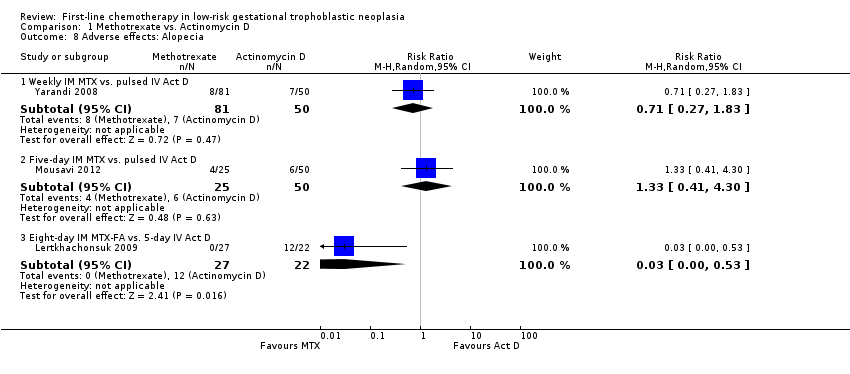
Comparison 1 Methotrexate vs. Actinomycin D, Outcome 8 Adverse effects: Alopecia.
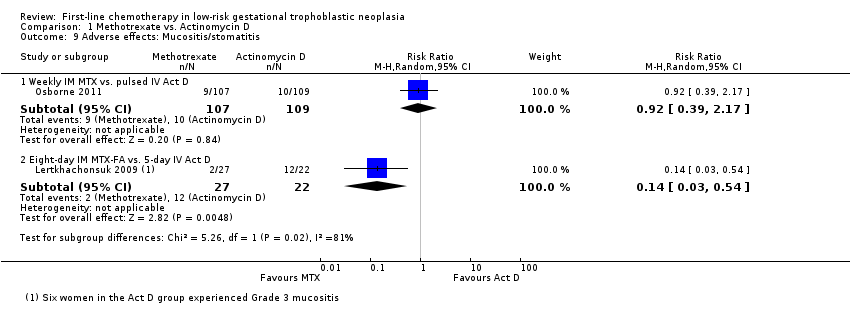
Comparison 1 Methotrexate vs. Actinomycin D, Outcome 9 Adverse effects: Mucositis/stomatitis.
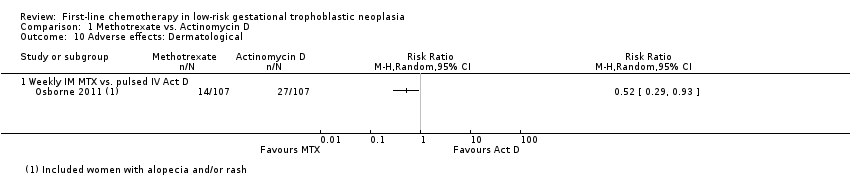
Comparison 1 Methotrexate vs. Actinomycin D, Outcome 10 Adverse effects: Dermatological.

Comparison 1 Methotrexate vs. Actinomycin D, Outcome 11 Adverse effects: Neutropenia.
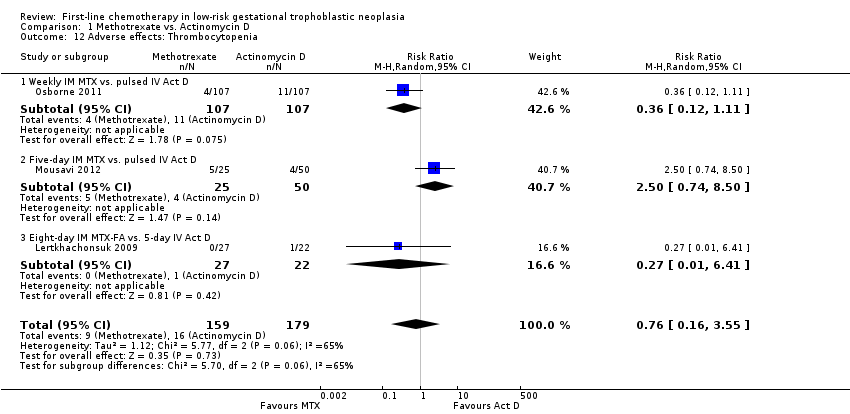
Comparison 1 Methotrexate vs. Actinomycin D, Outcome 12 Adverse effects: Thrombocytopenia.
Comparison 1 Methotrexate vs. Actinomycin D, Outcome 13 Adverse effects: Anaemia.
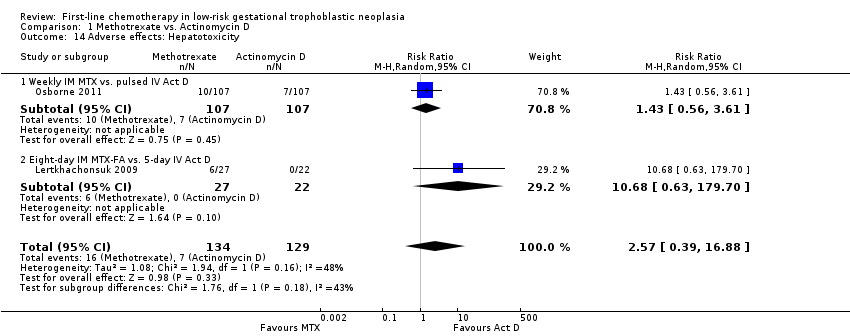
Comparison 1 Methotrexate vs. Actinomycin D, Outcome 14 Adverse effects: Hepatotoxicity.
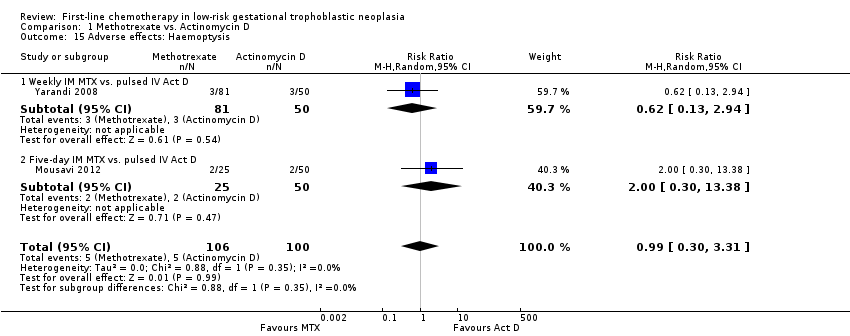
Comparison 1 Methotrexate vs. Actinomycin D, Outcome 15 Adverse effects: Haemoptysis.
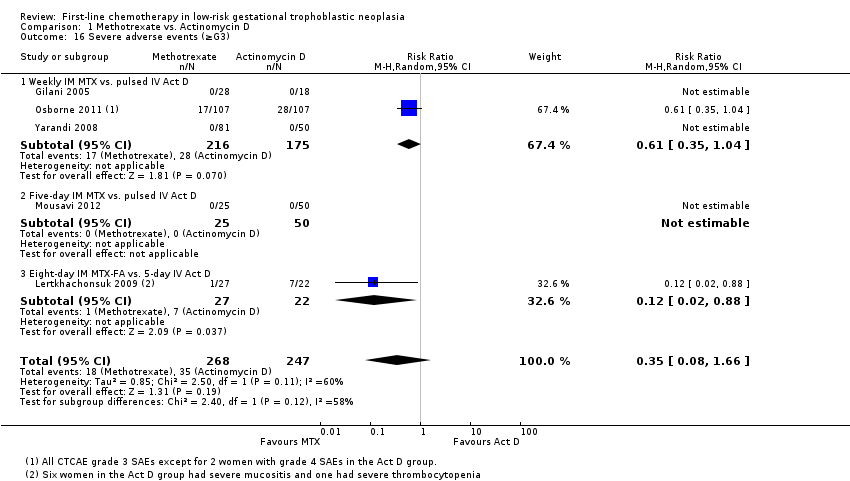
Comparison 1 Methotrexate vs. Actinomycin D, Outcome 16 Severe adverse events (≥G3).
| Actinomycin D compared with methotrexate (MTX) for low‐risk gestational trophoblastic neoplasia (GTN) | ||||||
| Patient or population: women withe low‐risk GTN Settings: outpatient or hospital Intervention: actinomycin D (Act D) Comparison: MTX | ||||||
| Outcomes | Illustrative Assumed risk* (Act D) | Illustrative Corresponding risk (MTX) | Relative effect | No of Participants | Quality of the evidence | Comments |
| Primary cure (remission) | 824 per 1000 | 536 per 1000 (470 to 618) | RR 0.65 (0.57 to 0.75) | 577 women (6 studies) | ⊕⊕⊕⊝ | Act D is probably more likely to achieve a primary cure than MTX. 55% of the data came from trials of weekly IM MTX, which may be less effective than the 5‐ or 8‐day MTX regimens. |
| Failure of first‐line therapy | 154 per 1000 | 547 per 1000 (279 to 1000) | RR 3.55 (1.81 to 6.95) | 577 women (6 studies) | ⊕⊕⊕⊝ | Act D as a first‐line treatment is probably less likely to fail than MTX. 59% of the data came from trials of weekly IM MTX, which may be less effective than the 5‐ or 8‐day MTX regimens. |
| Severe adverse events (≥ grade 3) | 142 per 1000 | 50 per 1000 (11 to 235) | RR 0.35 (0.08 to 1.66) | 515 women (5 studies) | ⊕⊕⊝⊝ low1,2 | There may be little or no difference between interventions overall. However, the point estimate and subgroup analyses favoured MTX. SAEs occurred in 3 out of 6 studies, but one study did not contribute to the meta‐analysis due to insufficient data. |
| Nausea | 462 per 1000 | 282 per 1000 (134 to 582) | RR 0.61 (0.29 to 1.26) | 466 women (4 studies) | ⊕⊕⊕⊝ | There is probably little or no difference between MTX and Act D for nausea. |
| Alopecia | Subtotals only | ⊕⊕⊝⊝ low1,2 | Data on alopecia were not pooled due to substantial subgroup differences. However, in general the evidence suggested that there may be little or no difference between MTX and Act D regimens with regard to alopecia, except for the five‐day Act D regimen, which may be more frequently associated with alopecia than the 8‐day MTX regimen. | |||
| *The basis for the assumed risk is the mean control group risk across studies. The corresponding risk (and its 95% confidence interval) is based on the assumed risk in the comparison group and the relative effect of the intervention (and its 95% CI). | ||||||
| GRADE Working Group grades of evidence IM = intramuscular; SAE = severe adverse effects | ||||||
| 1 Downgraded for clinical or statistical inconsistency 2 Downgraded for imprecision | ||||||
| Stage I | Disease confined to the uterus |
| Stage II | GTN extends outside of the uterus, but is limited to the genital structures (adnexae, vagina, broad ligament) |
| Stage III | GTN extends to the lungs with or without known genital tract involvement |
| Stage IV | All other metastatic sites |
| *FIGO 2009 | |
| Scores | 0 | 1 | 2 | 4 |
| Age (years) | < 40 | ≥ 40 | – | – |
| Antecedent pregnancy | mole | abortion | term | – |
| Interval months from index pregnancy | < 4 | 4–6 | 7–12 | > 12 |
| Pretreatment serum hCG (IU/L) | < 103 | 103 to 104 | 104 to 105 | > 105 |
| Largest tumour size (including uterus) | < 3 | 3cm to 4 cm | ≥ 5 cm | – |
| Site of metastases | lung | spleen, kidney | gastrointestinal | liver, brain |
| Number of metastases | – | 1to 4 | 5 to 8 | > 8 |
| Previous failed chemotherapy | – | – | single drug | ≥ 2 drugs |
| To stage and allot a risk factor score, a patient's diagnosis is allocated to a stage as represented by a Roman numeral I, II, III, and IV. This is then separated by a colon from the sum of all the actual risk factor scores expressed in Arabic numerals, i.e., stage II:4, stage IV:9. This stage and score will be allotted for each patient.(FIGO 2009). A score ≤ 6 indicates low‐risk; > 6 indicates high‐risk. | ||||
| hCG = human chorionic gonadotrophin; IU = Internationa Units | ||||
| Drug | Study | Comment |
| Intravenous (IV) methotrexate (100, 150, or 300 mg/m²) with folinic acid rescue 24 hours later, repeated weekly | The original Bagshawe regimen. | |
| Bolus (100 mg/m² IV or IM) and 12‐hour continuous methotrexate infusion (200 mg/m²) with folinic acid rescue 24 hours later, repeated fortnightly | ||
| Combined 5‐day methotrexate (day 1 to 5) and 5‐day actinomycin D (day 15 to 19), repeated every 28 days | Associated with a high incidence of toxicity. | |
| High‐dose methotrexate (600 mg/m²) | Did not effect a higher cure than other methotrexate regimens. | |
| Etoposide (oral and parenteral) | Reported to be highly effective but not widely used for low‐risk GTN due to the high risk of side‐effects, particularly alopecia. | |
| Fluorouracil | Used in China for several decades, mainly because of its low cost, but is not favoured elsewhere. | |
| Intra‐lesional methotrexate infusion | Not favoured in Europe or North America. | |
| Chinese preparations | Not favoured in Europe or North America. | |
| GTN = gestational trophoblastic neoplasia | ||
| Outcome or subgroup title | No. of studies | No. of participants | Statistical method | Effect size |
| 1 Primary cure (remission) Show forest plot | 6 | 577 | Risk Ratio (M‐H, Random, 95% CI) | 0.65 [0.57, 0.75] |
| 1.1 Weekly IM MTX vs. pulsed IV Act D | 3 | 393 | Risk Ratio (M‐H, Random, 95% CI) | 0.62 [0.48, 0.80] |
| 1.2 Five‐day IM MTX vs. pulsed IV Act D | 1 | 75 | Risk Ratio (M‐H, Random, 95% CI) | 0.76 [0.57, 1.00] |
| 1.3 Eight‐day IM MTX‐FA vs. 5‐day IV Act D | 1 | 45 | Risk Ratio (M‐H, Random, 95% CI) | 0.57 [0.40, 0.81] |
| 1.4 Eight‐day IM MTX‐FA vs. pulsed IV Act D | 1 | 64 | Risk Ratio (M‐H, Random, 95% CI) | 0.68 [0.50, 0.93] |
| 2 Failure of first line therapy Show forest plot | 6 | 577 | Risk Ratio (M‐H, Random, 95% CI) | 3.55 [1.81, 6.95] |
| 2.1 Weekly IM MTX vs. pulsed IV Act D | 3 | 393 | Risk Ratio (M‐H, Random, 95% CI) | 3.54 [1.12, 11.16] |
| 2.2 Five‐day IM MTX vs. pulsed IV Act D | 1 | 75 | Risk Ratio (M‐H, Random, 95% CI) | 3.2 [1.17, 8.78] |
| 2.3 Eight‐day IM MTX‐FA vs. 5‐day IV Act D | 1 | 45 | Risk Ratio (M‐H, Random, 95% CI) | 18.58 [1.16, 297.18] |
| 2.4 Eight‐day IM MTX‐FA vs. pulsed IV Act D | 1 | 64 | Risk Ratio (M‐H, Random, 95% CI) | 3.25 [1.19, 8.90] |
| 3 Chemotherapy cycles to primary cure Show forest plot | 4 | Mean Difference (IV, Random, 95% CI) | Subtotals only | |
| 3.1 Weekly IM MTX vs. pulsed IV Act D | 2 | 346 | Mean Difference (IV, Random, 95% CI) | 3.04 [0.93, 5.14] |
| 3.2 Five‐day IM MTX vs. pulsed IV Act D | 1 | 75 | Mean Difference (IV, Random, 95% CI) | ‐2.20 [‐2.87, ‐1.53] |
| 3.3 Eight‐day IM MTX‐FA vs. 5‐day IV Act D | 1 | 45 | Mean Difference (IV, Random, 95% CI) | 0.63 [‐0.27, 1.53] |
| 4 Adverse effects: Nausea Show forest plot | 4 | 466 | Risk Ratio (M‐H, Random, 95% CI) | 0.61 [0.29, 1.26] |
| 4.1 Weekly IM MTX vs. pulsed IV Act D | 3 | 391 | Risk Ratio (M‐H, Random, 95% CI) | 0.42 [0.11, 1.62] |
| 4.2 Five‐day IM MTX vs. pulsed IV Act D | 1 | 75 | Risk Ratio (M‐H, Random, 95% CI) | 1.18 [0.72, 1.93] |
| 5 Adverse effects: Vomiting Show forest plot | 3 | 420 | Risk Ratio (M‐H, Random, 95% CI) | 0.75 [0.32, 1.73] |
| 5.1 Weekly IM MTX vs. pulsed IV Act D | 2 | 345 | Risk Ratio (M‐H, Random, 95% CI) | 0.56 [0.24, 1.32] |
| 5.2 Five‐day IM MTX vs. pulsed IV Act D | 1 | 75 | Risk Ratio (M‐H, Random, 95% CI) | 1.43 [0.50, 4.05] |
| 6 Adverse effects: Diarrhoea Show forest plot | 3 | 419 | Risk Ratio (M‐H, Random, 95% CI) | 1.43 [0.85, 2.41] |
| 6.1 Weekly IM MTX vs. pulsed IV Act D | 2 | 344 | Risk Ratio (M‐H, Random, 95% CI) | 1.34 [0.57, 3.16] |
| 6.2 Five‐day IM MTX vs. pulsed IV Act D | 1 | 75 | Risk Ratio (M‐H, Random, 95% CI) | 1.5 [0.58, 3.85] |
| 7 Adverse effects: Constitutional Show forest plot | 3 | 420 | Risk Ratio (M‐H, Random, 95% CI) | 1.00 [0.84, 1.19] |
| 7.1 Weekly IM MTX vs. pulsed IV Act D | 2 | 345 | Risk Ratio (M‐H, Random, 95% CI) | 0.97 [0.79, 1.18] |
| 7.2 Five‐day IM MTX vs. pulsed IV Act D | 1 | 75 | Risk Ratio (M‐H, Random, 95% CI) | 1.10 [0.78, 1.55] |
| 8 Adverse effects: Alopecia Show forest plot | 3 | Risk Ratio (M‐H, Random, 95% CI) | Subtotals only | |
| 8.1 Weekly IM MTX vs. pulsed IV Act D | 1 | 131 | Risk Ratio (M‐H, Random, 95% CI) | 0.71 [0.27, 1.83] |
| 8.2 Five‐day IM MTX vs. pulsed IV Act D | 1 | 75 | Risk Ratio (M‐H, Random, 95% CI) | 1.33 [0.41, 4.30] |
| 8.3 Eight‐day IM MTX‐FA vs. 5‐day IV Act D | 1 | 49 | Risk Ratio (M‐H, Random, 95% CI) | 0.03 [0.00, 0.53] |
| 9 Adverse effects: Mucositis/stomatitis Show forest plot | 2 | Risk Ratio (M‐H, Random, 95% CI) | Subtotals only | |
| 9.1 Weekly IM MTX vs. pulsed IV Act D | 1 | 216 | Risk Ratio (M‐H, Random, 95% CI) | 0.92 [0.39, 2.17] |
| 9.2 Eight‐day IM MTX‐FA vs. 5‐day IV Act D | 1 | 49 | Risk Ratio (M‐H, Random, 95% CI) | 0.14 [0.03, 0.54] |
| 10 Adverse effects: Dermatological Show forest plot | 1 | Risk Ratio (M‐H, Random, 95% CI) | Totals not selected | |
| 10.1 Weekly IM MTX vs. pulsed IV Act D | 1 | Risk Ratio (M‐H, Random, 95% CI) | 0.0 [0.0, 0.0] | |
| 11 Adverse effects: Neutropenia Show forest plot | 4 | 469 | Risk Ratio (M‐H, Random, 95% CI) | 0.83 [0.48, 1.45] |
| 11.1 Weekly IM MTX vs. pulsed IV Act D | 2 | 345 | Risk Ratio (M‐H, Random, 95% CI) | 0.66 [0.38, 1.15] |
| 11.2 Five‐day IM MTX vs. pulsed IV Act D | 1 | 75 | Risk Ratio (M‐H, Random, 95% CI) | 2.0 [0.43, 9.20] |
| 11.3 Eight‐day IM MTX‐FA vs. 5‐day IV Act D | 1 | 49 | Risk Ratio (M‐H, Random, 95% CI) | 2.44 [0.27, 21.89] |
| 12 Adverse effects: Thrombocytopenia Show forest plot | 3 | 338 | Risk Ratio (M‐H, Random, 95% CI) | 0.76 [0.16, 3.55] |
| 12.1 Weekly IM MTX vs. pulsed IV Act D | 1 | 214 | Risk Ratio (M‐H, Random, 95% CI) | 0.36 [0.12, 1.11] |
| 12.2 Five‐day IM MTX vs. pulsed IV Act D | 1 | 75 | Risk Ratio (M‐H, Random, 95% CI) | 2.5 [0.74, 8.50] |
| 12.3 Eight‐day IM MTX‐FA vs. 5‐day IV Act D | 1 | 49 | Risk Ratio (M‐H, Random, 95% CI) | 0.27 [0.01, 6.41] |
| 13 Adverse effects: Anaemia Show forest plot | 1 | Risk Ratio (M‐H, Random, 95% CI) | Totals not selected | |
| 13.1 Weekly IM MTX vs. pulsed IV Act D | 1 | Risk Ratio (M‐H, Random, 95% CI) | 0.0 [0.0, 0.0] | |
| 14 Adverse effects: Hepatotoxicity Show forest plot | 2 | 263 | Risk Ratio (M‐H, Random, 95% CI) | 2.57 [0.39, 16.88] |
| 14.1 Weekly IM MTX vs. pulsed IV Act D | 1 | 214 | Risk Ratio (M‐H, Random, 95% CI) | 1.43 [0.56, 3.61] |
| 14.2 Eight‐day IM MTX‐FA vs. 5‐day IV Act D | 1 | 49 | Risk Ratio (M‐H, Random, 95% CI) | 10.68 [0.63, 179.70] |
| 15 Adverse effects: Haemoptysis Show forest plot | 2 | 206 | Risk Ratio (M‐H, Random, 95% CI) | 0.99 [0.30, 3.31] |
| 15.1 Weekly IM MTX vs. pulsed IV Act D | 1 | 131 | Risk Ratio (M‐H, Random, 95% CI) | 0.62 [0.13, 2.94] |
| 15.2 Five‐day IM MTX vs. pulsed IV Act D | 1 | 75 | Risk Ratio (M‐H, Random, 95% CI) | 2.0 [0.30, 13.38] |
| 16 Severe adverse events (≥G3) Show forest plot | 5 | 515 | Risk Ratio (M‐H, Random, 95% CI) | 0.35 [0.08, 1.66] |
| 16.1 Weekly IM MTX vs. pulsed IV Act D | 3 | 391 | Risk Ratio (M‐H, Random, 95% CI) | 0.61 [0.35, 1.04] |
| 16.2 Five‐day IM MTX vs. pulsed IV Act D | 1 | 75 | Risk Ratio (M‐H, Random, 95% CI) | 0.0 [0.0, 0.0] |
| 16.3 Eight‐day IM MTX‐FA vs. 5‐day IV Act D | 1 | 49 | Risk Ratio (M‐H, Random, 95% CI) | 0.12 [0.02, 0.88] |