Mel para tosse aguda em crianças
Referencias
References to studies included in this review
References to studies excluded from this review
References to studies awaiting assessment
References to ongoing studies
Additional references
References to other published versions of this review
Characteristics of studies
Characteristics of included studies [ordered by study ID]
| Methods | RCT | |
| Participants | 300 children (75 allocated to each treatment arm of eucalyptus honey, citrus honey, labiatae honey and placebo); 1 to 5 years with URTIs, nocturnal cough and illness duration of 7 days or less, attending general paediatric community clinics | |
| Interventions | Single dose of 10 g of eucalyptus honey, citrus honey, labiatae honey or placebo administered 30 minutes before bedtime | |
| Outcomes | Cough frequency, cough severity, bothersome nature of cough, child and parent sleep quality | |
| Notes | This study was supported in part by a research grant from Israel Ambulatory Paediatric Association, Maternal Infant Nutrition Research Institute and the Honey board of Israel | |
| Risk of bias | ||
| Bias | Authors' judgement | Support for judgement |
| Random sequence generation (selection bias) | Low risk | The 3 honeys and the placebo were prepared by someone not involved in the study, interventions were packed in small plastic containers marked A, B, C and D and distributed to the paediatric community clinics in blocks of 4 |
| Allocation concealment (selection bias) | Low risk | Silan date extract was used by the authors as a placebo because its structure, brown colour and taste are similar to that of honey. Interventions were packed in plastic containers labelled with the letters A, B, C and D |
| Blinding (performance bias and detection bias) | Low risk | The parents, physicians and investigators did not know the content of the preparation that was dispensed. The envelopes containing the codes for the study preparations were stored at the office of the Ministry of Agriculture, Extension service, Bee keeping Department and were not opened until after the statistical analysis was completed |
| Blinding (performance bias and detection bias) | Low risk | The parents, physicians and investigators did not know the content of the preparation that was dispensed. The envelopes containing the codes for the study preparations were stored at the office of the Ministry of Agriculture, Extension service, Bee keeping Department and were not opened until after the statistical analysis was completed |
| Blinding (performance bias and detection bias) | Low risk | The parents, physicians and investigators did not know the content of the preparation that was dispensed. The envelopes containing the codes for the study preparations were stored at the office of the Ministry of Agriculture, Extension service, Bee keeping Department and were not opened until after the statistical analysis was completed |
| Selective reporting (reporting bias) | Low risk | All outcomes were adequately reported |
| Other bias | Unclear risk | Participants lost to follow‐up or withdrawn were not included in the final analysis |
| Follow‐up | Low risk | 14, 13, 2 and 4 participants were lost to follow‐up in the eucalyptus honey, citrus honey, labiatae honey and placebo group respectively because they discontinued the intervention |
| Methods | RCT | |
| Participants | 108 participants (35 allocated to honey, 34 allocated to dextromethorphan and 39 who received 'no treatment'); 2 to 18 years of age with URTIs, nocturnal symptoms and illness duration of 7 days or less | |
| Interventions | A single dose of buckwheat honey, honey flavoured dextromethorphan or 'no treatment' administered 30 minutes prior to bedtime | |
| Outcomes | Cough frequency, cough severity, bothersome nature of cough, cough impact on sleep quality for children and parents | |
| Notes | This study was supported by an unrestricted research grant from the National Honey Board, an industry‐funded agency of the United States Department of Agriculture. It is possible that participants in the 'no treatment' group showed the least improvement because they were aware that they did not receive the active treatment, which could have been a source of bias in their responses | |
| Risk of bias | ||
| Bias | Authors' judgement | Support for judgement |
| Random sequence generation (selection bias) | Low risk | The randomisation sequence was done by a statistician not affiliated with the study and was then used by the study co‐ordinators to assign the treatment groups |
| Allocation concealment (selection bias) | Low risk | Treatment allocation was concealed in opaque brown envelopes |
| Blinding (performance bias and detection bias) | High risk | The syringes used for all the 3 treatment groups were opaque and placed in a brown paper bag to conceal the treatments from the investigators. The 'no treatment' group was not blinded to their treatment but the honey and dextromethorphan arms were blinded |
| Blinding (performance bias and detection bias) | High risk | Though all participants were given syringes in brown paper bags the 'no treatment' group had empty syringes, which could influence the assessment of the outcome |
| Blinding (performance bias and detection bias) | High risk | The 'no treatment' group were not blinded to the intervention they received |
| Selective reporting (reporting bias) | Low risk | All outcomes were adequately reported |
| Other bias | Unclear risk | It is unclear whether any of the 'no treatment' group revealed to any of the assessors during phone conversations that they were given 'no treatment'. Participants lost to follow‐up or withdrawn were not included in the final analysis |
| Follow‐up | Low risk | 2 participants from the 'no treatment' group were lost to follow‐up; 1 was withdrawn from the dextromethorphan group because the participant did not take the treatment |
| Methods | RCT | |
| Participants | 160 participants (40 allocated to honey, 40 allocated to dextromethorphan, 40 allocated to diphenhydramine and 40 were in the 'no treatment' group (but who received the supportive treatment given to the others); 2 to 5 years of age with URTIs, nocturnal symptoms and illness duration of 5 days | |
| Interventions | A single dose of natural honey from Kafi‐Abad (a village in Yazd, Iran), dextromethorphan, diphenhydramine or 'no treatment' (all treatment arms were advised to take supportive treatment with saline nose drops, water vapour, cleaning of a blocked nose and use of acetaminophen for fever, if necessary) | |
| Outcomes | Cough frequency, cough severity, cough impact on sleep quality for children and parents | |
| Notes | 160 participants were randomised into the 4 groups but only 139 were finally analysed | |
| Risk of bias | ||
| Bias | Authors' judgement | Support for judgement |
| Random sequence generation (selection bias) | Low risk | Randomisation was by random numbers table |
| Allocation concealment (selection bias) | Unclear risk | It was not clear whether treatment allocation was concealed |
| Blinding (performance bias and detection bias) | High risk | Both the investigators and caregivers were not blinded to the treatment given, which could greatly influence the assessment of outcome |
| Blinding (performance bias and detection bias) | High risk | Both the investigators and caregivers were not blinded to the treatment given, which could greatly influence the assessment of outcome |
| Blinding (performance bias and detection bias) | High risk | Investigators and caregivers were not blinded to the treatment given, which could greatly influence the assessment of outcome |
| Selective reporting (reporting bias) | Low risk | All outcomes were adequately reported |
| Other bias | Unclear risk | Some of the questions put to mothers were answered by the paediatrician because the questions were ambiguous, which could also be an influence on the assessment of outcomes. Since mothers were filling in the questionnaire in the presence of the physician, this could also be a source of influence on the assessment of outcomes. No ITT analysis. Participants that were withdrawn or lost to follow‐up were also not included in the final analysis, which could also have made a difference in the effect of the interventions |
| Follow‐up | Low risk | 7 participants from the honey group, 4 from the dextromethorphan group, 6 from the diphenhydramine group and 4 from the control group were either lost to follow‐up or withdrawn for violating the protocol |
ITT: intention‐to‐treat
RCT: randomised controlled trial
URTI: upper respiratory tract infection
Characteristics of excluded studies [ordered by study ID]
| Study | Reason for exclusion |
| This is a feasibility study of honey for the treatment of cough in children. It is not a clinical trial | |
| This is a non‐Cochrane review on the included study selected from www.inforpoem.com by the study authors | |
| The participants were randomised into "honey and milk" versus dextromethorphan and "honey and milk" versus levodropropizine | |
| This study is a non‐Cochrane review on the included study Paul 2007 |
Characteristics of studies awaiting assessment [ordered by year of study]
| Methods | RCT |
| Participants | Patients aged 2 to 15 years with acute irritative cough |
| Interventions | Bromelin versus placebo |
| Outcomes | Symtopmatic relieve of cough |
| Notes | Cough less than 24 hours |
| Methods | RCT |
| Participants | 2‐5 years old with viral acute respiratory infection |
| Interventions | Honey versus diphenhydramine |
| Outcomes | Cough severity and frequency |
| Notes | Comparison study of honey versus diphenhydramine effect on cough alleviation in 2‐5 years old children with viral upper respiratory tract infection |
RCT: randomised controlled trial
Characteristics of ongoing studies [author‐defined order]
| Trial name or title | Comparison of the effect of two kinds of Iranian honey and diphenhydramine on nocturnal cough and sleep quality in coughing children and their parents |
| Methods | Randomised, double‐blind |
| Participants | 2‐5 years |
| Interventions | Honey versus diphenhydramine |
| Outcomes | Cough frequency and severity |
| Starting date | 23 September, 2010 |
| Contact information | Dr. Mahshid Ahmadi Gamero building, Soltan tooye st, Velayat st, Saade Salman Sq 4818914799 Sari, Islamic Republic Of Iran |
| Notes |
Data and analyses
| Outcome or subgroup title | No. of studies | No. of participants | Statistical method | Effect size |
| 1 Cough frequency (mean improvement) Show forest plot | 3 | Mean Difference (Fixed, 95% CI) | Subtotals only | |
| Analysis 1.1  Comparison 1 Pre‐ and postintervention comparison, Outcome 1 Cough frequency (mean improvement). | ||||
| 1.1 Honey | 3 | 300 | Mean Difference (Fixed, 95% CI) | ‐1.97 [‐2.68, ‐1.25] |
| 1.2 Dextromethorphan | 2 | 74 | Mean Difference (Fixed, 95% CI) | ‐1.49 [‐2.09, ‐0.88] |
| 1.3 Diphenhydramine | 1 | 40 | Mean Difference (Fixed, 95% CI) | ‐1.73 [‐2.72, ‐0.74] |
| 1.4 Placebo (silan dates extract) | 1 | 75 | Mean Difference (Fixed, 95% CI) | ‐1.0 [‐1.82, ‐0.18] |
| 1.5 No treatment | 2 | 79 | Mean Difference (Fixed, 95% CI) | ‐0.98 [‐1.38, ‐0.59] |
| 1.6 Buckwheat honey | 1 | 35 | Mean Difference (Fixed, 95% CI) | ‐1.89 [‐2.96, ‐0.81] |
| 1.7 Natural honey from Kafi‐Abad (Iran) | 1 | 40 | Mean Difference (Fixed, 95% CI) | ‐2.16 [‐3.40, ‐0.92] |
| 1.8 Eucalyptus honey | 1 | 75 | Mean Difference (Fixed, 95% CI) | ‐1.77 [‐3.22, ‐0.32] |
| 1.9 Labiatae honey | 1 | 75 | Mean Difference (Fixed, 95% CI) | ‐1.82 [‐3.30, ‐0.34] |
| 1.10 Citrus honey | 1 | 75 | Mean Difference (Fixed, 95% CI) | ‐1.95 [‐3.55, ‐0.35] |
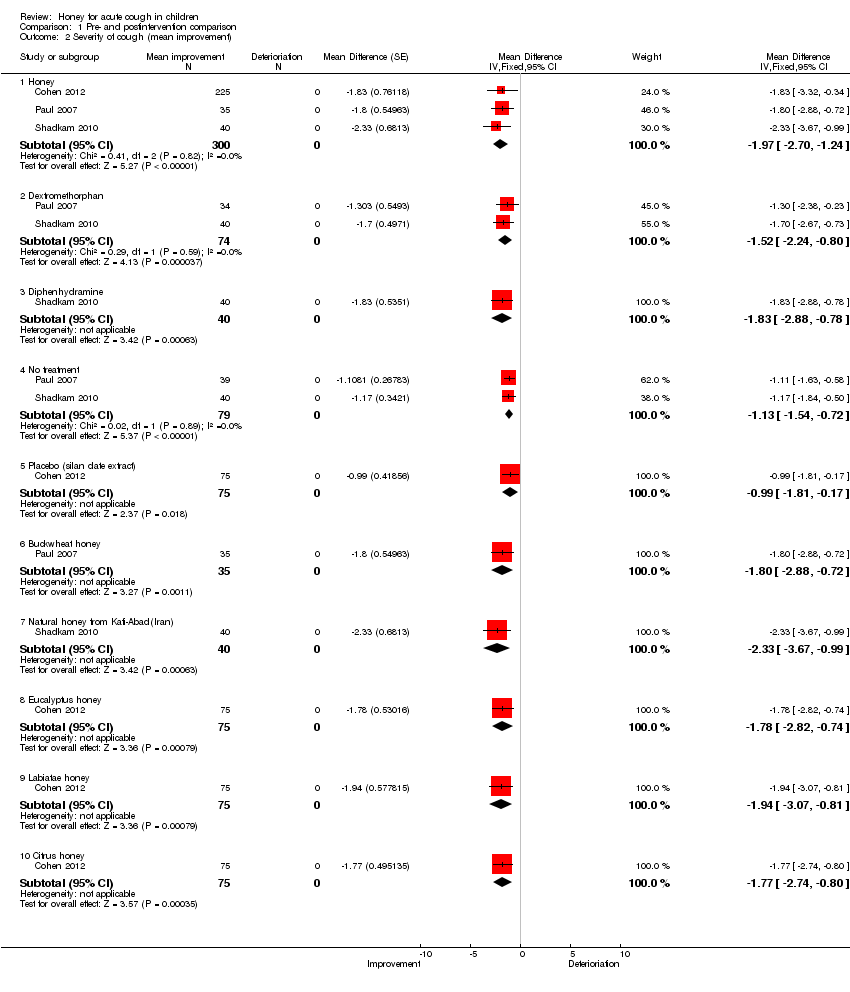
| 2 Severity of cough (mean improvement) Show forest plot | 3 | Mean Difference (Fixed, 95% CI) | Subtotals only | |
| Analysis 1.2  Comparison 1 Pre‐ and postintervention comparison, Outcome 2 Severity of cough (mean improvement). | ||||
| 2.1 Honey | 3 | 300 | Mean Difference (Fixed, 95% CI) | ‐1.97 [‐2.70, ‐1.24] |
| 2.2 Dextromethorphan | 2 | 74 | Mean Difference (Fixed, 95% CI) | ‐1.52 [‐2.24, ‐0.80] |
| 2.3 Diphenhydramine | 1 | 40 | Mean Difference (Fixed, 95% CI) | ‐1.83 [‐2.88, ‐0.78] |
| 2.4 No treatment | 2 | 79 | Mean Difference (Fixed, 95% CI) | ‐1.13 [‐1.54, ‐0.72] |
| 2.5 Placebo (silan date extract) | 1 | 75 | Mean Difference (Fixed, 95% CI) | ‐0.99 [‐1.81, ‐0.17] |
| 2.6 Buckwheat honey | 1 | 35 | Mean Difference (Fixed, 95% CI) | ‐1.80 [‐2.88, ‐0.72] |
| 2.7 Natural honey from Kafi‐Abad(Iran) | 1 | 40 | Mean Difference (Fixed, 95% CI) | ‐2.33 [‐3.67, ‐0.99] |
| 2.8 Eucalyptus honey | 1 | 75 | Mean Difference (Fixed, 95% CI) | ‐1.78 [‐2.82, ‐0.74] |
| 2.9 Labiatae honey | 1 | 75 | Mean Difference (Fixed, 95% CI) | ‐1.94 [‐3.07, ‐0.81] |
| 2.10 Citrus honey | 1 | 75 | Mean Difference (Fixed, 95% CI) | ‐1.77 [‐2.74, ‐0.80] |
| 3 Bothersome cough (mean improvement) reduction Show forest plot | 2 | Mean Difference (Fixed, 95% CI) | Subtotals only | |
| Analysis 1.3  Comparison 1 Pre‐ and postintervention comparison, Outcome 3 Bothersome cough (mean improvement) reduction. | ||||
| 3.1 Honey | 2 | 260 | Mean Difference (Fixed, 95% CI) | ‐2.18 [‐3.24, ‐1.13] |
| 3.2 Dextromethorphan | 1 | 34 | Mean Difference (Fixed, 95% CI) | ‐1.94 [‐3.05, ‐0.83] |
| 3.3 No treatment | 1 | 39 | Mean Difference (Fixed, 95% CI) | ‐1.30 [‐2.07, ‐0.53] |
| 3.4 Placebo | 1 | 75 | Mean Difference (Fixed, 95% CI) | ‐1.25 [‐2.39, ‐0.11] |
| 3.5 Buckwheat honey | 1 | 35 | Mean Difference (Fixed, 95% CI) | ‐2.23 [‐3.50, ‐0.96] |
| 3.6 Eucalyptus honey | 1 | 75 | Mean Difference (Fixed, 95% CI) | ‐2.0 [‐3.82, ‐0.18] |
| 3.7 Labiatae honey | 1 | 75 | Mean Difference (Fixed, 95% CI) | ‐2.07 [‐4.03, ‐0.11] |
| 3.8 Citrus honey | 1 | 75 | Mean Difference (Fixed, 95% CI) | ‐2.16 [‐4.20, ‐0.12] |
| 4 Children's sleep (cough impact on children's sleep score) Show forest plot | 3 | Mean Difference (Random, 95% CI) | Subtotals only | |
| Analysis 1.4  Comparison 1 Pre‐ and postintervention comparison, Outcome 4 Children's sleep (cough impact on children's sleep score). | ||||
| 4.1 Honey | 3 | 300 | Mean Difference (Random, 95% CI) | ‐2.27 [‐3.13, ‐1.41] |
| 4.2 Dextromethorphan | 2 | 74 | Mean Difference (Random, 95% CI) | ‐1.75 [‐2.46, ‐1.04] |
| 4.3 Diphenhydramine | 1 | 40 | Mean Difference (Random, 95% CI) | ‐1.64 [‐2.58, ‐0.70] |
| 4.4 No treatment | 2 | 79 | Mean Difference (Random, 95% CI) | ‐1.28 [‐1.81, ‐0.76] |
| 4.5 Placebo | 1 | 75 | Mean Difference (Random, 95% CI) | ‐1.21 [‐2.46, 0.04] |
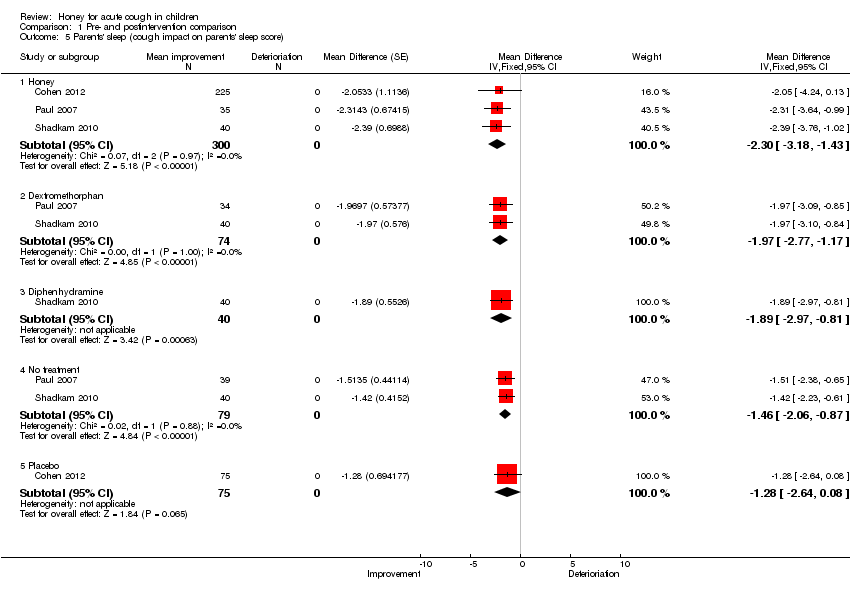
| 5 Parents' sleep (cough impact on parents' sleep score) Show forest plot | 3 | Mean Difference (Fixed, 95% CI) | Subtotals only | |
| Analysis 1.5  Comparison 1 Pre‐ and postintervention comparison, Outcome 5 Parents' sleep (cough impact on parents' sleep score). | ||||
| 5.1 Honey | 3 | 300 | Mean Difference (Fixed, 95% CI) | ‐2.30 [‐3.18, ‐1.43] |
| 5.2 Dextromethorphan | 2 | 74 | Mean Difference (Fixed, 95% CI) | ‐1.97 [‐2.77, ‐1.17] |
| 5.3 Diphenhydramine | 1 | 40 | Mean Difference (Fixed, 95% CI) | ‐1.89 [‐2.97, ‐0.81] |
| 5.4 No treatment | 2 | 79 | Mean Difference (Fixed, 95% CI) | ‐1.46 [‐2.06, ‐0.87] |
| 5.5 Placebo | 1 | 75 | Mean Difference (Fixed, 95% CI) | ‐1.28 [‐2.64, 0.08] |
| 6 Combined improvement Show forest plot | 2 | Mean Difference (Fixed, 95% CI) | Subtotals only | |
| Analysis 1.6 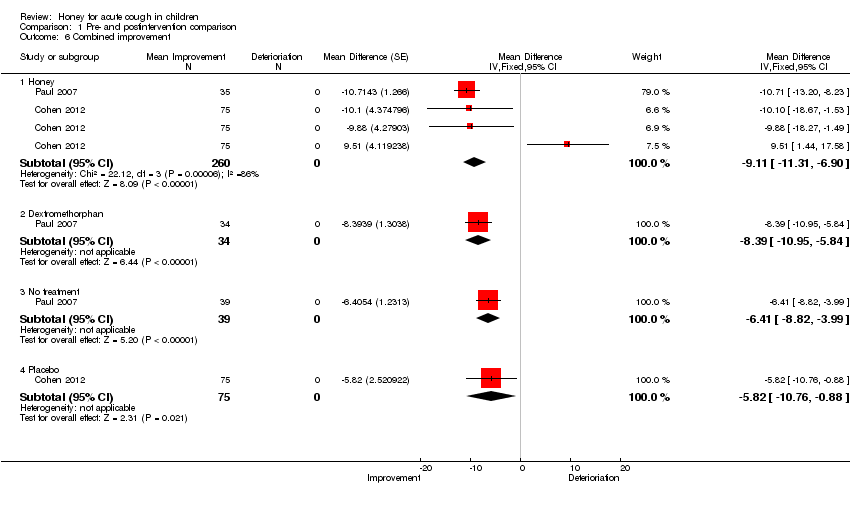 Comparison 1 Pre‐ and postintervention comparison, Outcome 6 Combined improvement. | ||||
| 6.1 Honey | 2 | 260 | Mean Difference (Fixed, 95% CI) | ‐9.11 [‐11.31, ‐6.90] |
| 6.2 Dextromethorphan | 1 | 34 | Mean Difference (Fixed, 95% CI) | ‐8.39 [‐10.95, ‐5.84] |
| 6.3 No treatment | 1 | 39 | Mean Difference (Fixed, 95% CI) | ‐6.41 [‐8.82, ‐3.99] |
| 6.4 Placebo | 1 | 75 | Mean Difference (Fixed, 95% CI) | ‐5.82 [‐10.76, ‐0.88] |
| Outcome or subgroup title | No. of studies | No. of participants | Statistical method | Effect size |
| 1 Honey versus dextromethorphan Show forest plot | 2 | Mean Difference (Random, 95% CI) | Subtotals only | |
| Analysis 2.1  Comparison 2 Pair‐wise comparison, Outcome 1 Honey versus dextromethorphan. | ||||
| 1.1 Frequency of cough (mean improvement) | 2 | 149 | Mean Difference (Random, 95% CI) | ‐0.07 [‐1.07, 0.94] |
| 1.2 Severity of cough (mean improvement) | 2 | 149 | Mean Difference (Random, 95% CI) | ‐0.13 [‐1.25, 0.99] |
| 1.3 Bothersome cough (mean improvement) | 1 | 69 | Mean Difference (Random, 95% CI) | 0.29 [‐0.56, 1.14] |
| 1.4 Children's sleep (cough impact on children's sleep score) | 2 | 149 | Mean Difference (Random, 95% CI) | 0.03 [‐1.12, 1.19] |
| 1.5 Parents' sleep (cough impact on parents' sleep score) | 2 | 149 | Mean Difference (Random, 95% CI) | ‐0.16 [‐0.84, 0.53] |
| 1.6 Combined mean improvement | 1 | 69 | Mean Difference (Random, 95% CI) | 2.32 [‐1.24, 5.88] |
| 2 Honey versus diphenhydramine Show forest plot | 1 | Mean Difference (Random, 95% CI) | Subtotals only | |
| Analysis 2.2  Comparison 2 Pair‐wise comparison, Outcome 2 Honey versus diphenhydramine. | ||||
| 2.1 Frequency of cough (mean improvement) | 1 | 80 | Mean Difference (Random, 95% CI) | ‐0.57 [‐0.90, ‐0.24] |
| 2.2 Severity of cough (mean improvement) | 1 | 80 | Mean Difference (Random, 95% CI) | ‐0.6 [‐0.94, ‐0.26] |
| 2.3 Children's sleep (cough impact on children's sleep score) | 1 | 80 | Mean Difference (Random, 95% CI) | ‐0.55 [‐0.87, ‐0.23] |
| 2.4 Parents' sleep (cough impact on parents' sleep score) | 1 | 80 | Mean Difference (Random, 95% CI) | ‐0.48 [‐0.76, ‐0.20] |
| 3 Honey versus 'no treatment' Show forest plot | 2 | Mean Difference (Random, 95% CI) | Subtotals only | |
| Analysis 2.3  Comparison 2 Pair‐wise comparison, Outcome 3 Honey versus 'no treatment'. | ||||
| 3.1 Frequency of cough (mean improvement score) | 2 | 154 | Mean Difference (Random, 95% CI) | ‐1.05 [‐1.48, ‐0.62] |
| 3.2 Severity of cough (mean improvement) | 2 | 154 | Mean Difference (Random, 95% CI) | ‐1.03 [‐1.59, ‐0.47] |
| 3.3 Bothersome cough (mean improvement) | 1 | 74 | Mean Difference (Random, 95% CI) | ‐0.93 [‐1.98, 0.12] |
| 3.4 Children's sleep (cough impact on children's sleep score) | 2 | 154 | Mean Difference (Random, 95% CI) | ‐1.04 [‐1.57, ‐0.51] |
| 3.5 Parents' sleep (cough impact on parents' sleep score) | 2 | 154 | Mean Difference (Random, 95% CI) | ‐0.88 [‐1.23, ‐0.52] |
| 3.6 Combined mean improvement | 1 | 74 | Mean Difference (Random, 95% CI) | ‐4.31 [‐6.77, ‐1.85] |
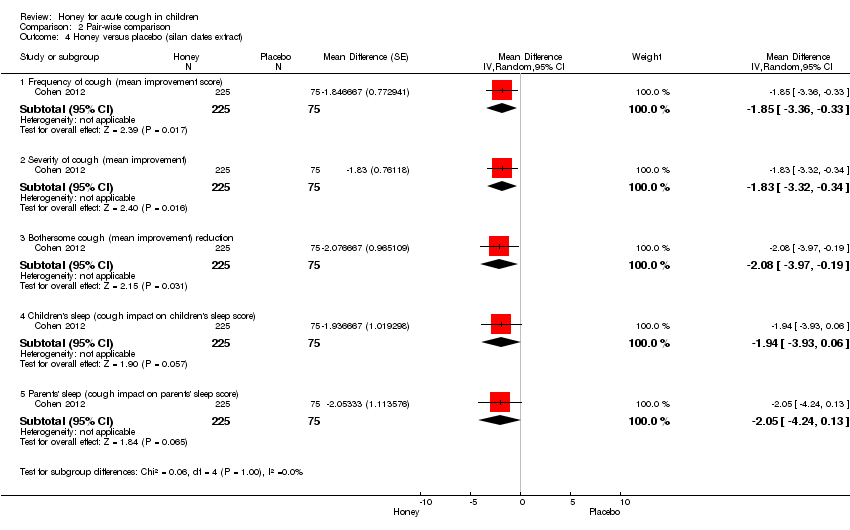
| 4 Honey versus placebo (silan dates extract) Show forest plot | 1 | Mean Difference (Random, 95% CI) | Subtotals only | |
| Analysis 2.4  Comparison 2 Pair‐wise comparison, Outcome 4 Honey versus placebo (silan dates extract). | ||||
| 4.1 Frequency of cough (mean improvement score) | 1 | 300 | Mean Difference (Random, 95% CI) | ‐1.85 [‐3.36, ‐0.33] |
| 4.2 Severity of cough (mean improvement) | 1 | 300 | Mean Difference (Random, 95% CI) | ‐1.83 [‐3.32, ‐0.34] |
| 4.3 Bothersome cough (mean improvement) reduction | 1 | 300 | Mean Difference (Random, 95% CI) | ‐2.08 [‐3.97, ‐0.19] |
| 4.4 Children's sleep (cough impact on children's sleep score) | 1 | 300 | Mean Difference (Random, 95% CI) | ‐1.94 [‐3.93, 0.06] |
| 4.5 Parents' sleep (cough impact on parents' sleep score) | 1 | 300 | Mean Difference (Random, 95% CI) | ‐2.05 [‐4.24, 0.13] |
| Outcome or subgroup title | No. of studies | No. of participants | Statistical method | Effect size |
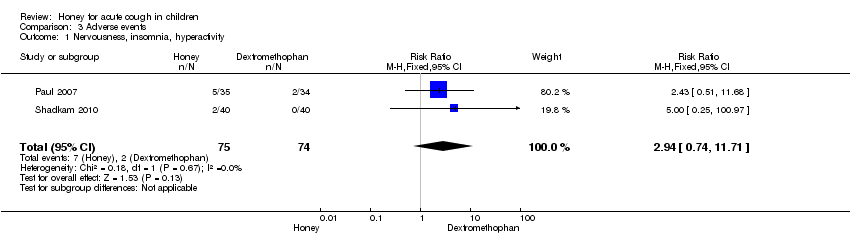
| 1 Nervousness, insomnia, hyperactivity Show forest plot | 2 | 149 | Risk Ratio (M‐H, Fixed, 95% CI) | 2.94 [0.74, 11.71] |
| Analysis 3.1  Comparison 3 Adverse events, Outcome 1 Nervousness, insomnia, hyperactivity. | ||||
| 2 Stomach ache, nausea and vomiting Show forest plot | 2 | 149 | Risk Ratio (M‐H, Fixed, 95% CI) | 4.86 [0.24, 97.69] |
| Analysis 3.2 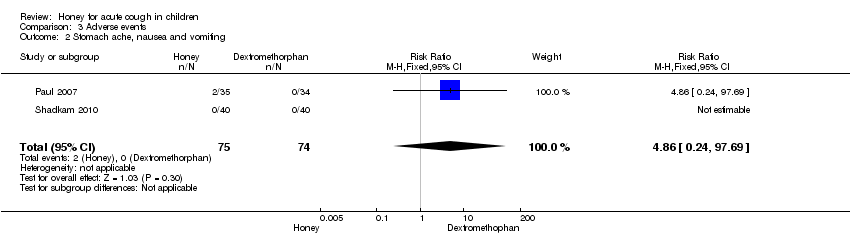 Comparison 3 Adverse events, Outcome 2 Stomach ache, nausea and vomiting. | ||||
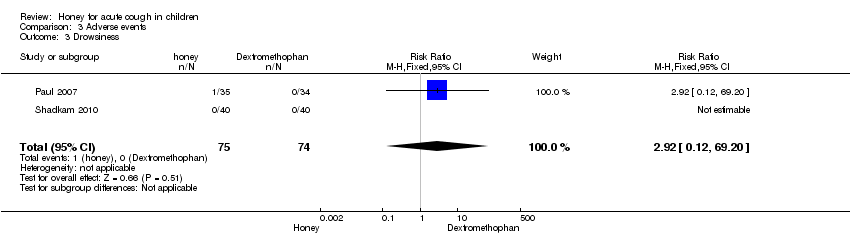
| 3 Drowsiness Show forest plot | 2 | 149 | Risk Ratio (M‐H, Fixed, 95% CI) | 2.92 [0.12, 69.20] |
| Analysis 3.3  Comparison 3 Adverse events, Outcome 3 Drowsiness. | ||||
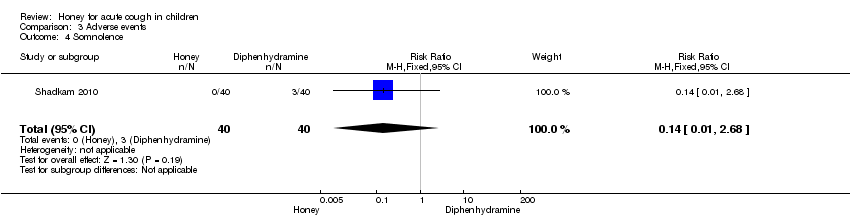
| 4 Somnolence Show forest plot | 1 | 80 | Risk Ratio (M‐H, Fixed, 95% CI) | 0.14 [0.01, 2.68] |
| Analysis 3.4  Comparison 3 Adverse events, Outcome 4 Somnolence. | ||||
| 5 Stomach ache, nausea and vomiting Show forest plot | 1 | 300 | Risk Ratio (M‐H, Fixed, 95% CI) | 1.33 [0.15, 11.74] |
| Analysis 3.5  Comparison 3 Adverse events, Outcome 5 Stomach ache, nausea and vomiting. | ||||
| 5.1 Honey | 1 | 300 | Risk Ratio (M‐H, Fixed, 95% CI) | 1.33 [0.15, 11.74] |

'Risk of bias' graph for included studies

'Risk of bias' summary: review authors' judgements about each risk of bias item for each included study.

Comparison 1 Pre‐ and postintervention comparison, Outcome 1 Cough frequency (mean improvement).
Comparison 1 Pre‐ and postintervention comparison, Outcome 2 Severity of cough (mean improvement).

Comparison 1 Pre‐ and postintervention comparison, Outcome 3 Bothersome cough (mean improvement) reduction.

Comparison 1 Pre‐ and postintervention comparison, Outcome 4 Children's sleep (cough impact on children's sleep score).
Comparison 1 Pre‐ and postintervention comparison, Outcome 5 Parents' sleep (cough impact on parents' sleep score).

Comparison 1 Pre‐ and postintervention comparison, Outcome 6 Combined improvement.

Comparison 2 Pair‐wise comparison, Outcome 1 Honey versus dextromethorphan.

Comparison 2 Pair‐wise comparison, Outcome 2 Honey versus diphenhydramine.

Comparison 2 Pair‐wise comparison, Outcome 3 Honey versus 'no treatment'.
Comparison 2 Pair‐wise comparison, Outcome 4 Honey versus placebo (silan dates extract).
Comparison 3 Adverse events, Outcome 1 Nervousness, insomnia, hyperactivity.

Comparison 3 Adverse events, Outcome 2 Stomach ache, nausea and vomiting.
Comparison 3 Adverse events, Outcome 3 Drowsiness.
Comparison 3 Adverse events, Outcome 4 Somnolence.

Comparison 3 Adverse events, Outcome 5 Stomach ache, nausea and vomiting.
| Honey versus dextromethorphan | ||||||
| Patient or population: children with acute cough | ||||||
| Outcomes | Illustrative comparative risks* (95% CI) | Relative effect | No of participants | Quality of the evidence | Comments | |
| Assumed risk | Corresponding risk | |||||
| Dextromethorphan | Honey | |||||
| Cough frequency (mean improvement in symptom score) | The mean cough frequency (mean improvement in symptom score) in the control groups was | The mean cough frequency (mean improvement in symptom score) in the intervention groups was | 137 | ⊕⊕⊕⊝ | ||
| Cough severity (mean improvement in symptom score) | The mean cough severity (mean improvement in symptom score) in the control groups was | The mean cough severity (mean improvement in symptom score) in the intervention groups was | 137 | ⊕⊕⊕⊝ | ||
| Child's sleep (mean improvement score) | The mean child's sleep (mean improvement score) in the control groups was | The mean child's sleep (mean improvement score) in the intervention groups was | 137 | ⊕⊕⊕⊝ | ||
| Parents' sleep (mean improvement score) | The mean parents' sleep (mean improvement score) in the control groups was | The mean parents' sleep (mean improvement score) in the intervention groups was | 137 | ⊕⊕⊕⊝ | ||
| Improvement in quality of life: combined effect (mean improvement in symptom score) | The mean improvement in quality of life: combined effect (mean improvement in symptom score) in the control groups was | The mean improvement in quality of life: combined effect (mean improvement in symptom score) in the intervention groups was | 68 | ⊕⊕⊕⊕ | ||
| *The basis for the assumed risk (e.g. the median control group risk across studies) is provided in footnotes. The corresponding risk (and its 95% confidence interval) is based on the assumed risk in the comparison group and the relative effect of the intervention (and its 95% CI). | ||||||
| GRADE Working Group grades of evidence | ||||||
| 1It was unclear if Shadkam 2010 had allocation concealment and there was no blinding in the study, which could increase the risk of bias in the study outcomes, although there was allocation concealment and partial double‐blinding in Paul 2007. | ||||||
| Honey compared to diphenhydramine for acute cough in children | ||||||
| Patient or population: children with acute cough | ||||||
| Outcomes | Illustrative comparative risks* (95% CI) | Relative effect | No. of participants | Quality of the evidence | Comments | |
| Assumed risk | Corresponding risk | |||||
| Diphenhydramine | Honey | |||||
| Frequency of cough (mean improvement score) Scale from: 0 to 6 Follow‐up: mean 1 day | The mean frequency of cough (mean improvement) in the control groups was | The mean frequency of cough (mean improvement) in the intervention groups was 0.57 lower | 80 | ⊕⊕⊝⊝ | ||
| Severity of cough (mean improvement score) Scale from: 0 to 6 Follow‐up: mean 1 day | The mean severity of cough (mean improvement) in the control groups was | The mean severity of cough (mean improvement) in the intervention groups was 0.6 lower | 80 | ⊕⊕⊝⊝ | ||
| Children's sleep (cough impact on children's sleep score) Scale from: 0 to 6 Follow‐up: mean 1 day | The mean children's sleep quality (cough impact on children's sleep score) in the control groups was | The mean children's sleep quality (cough impact on children's sleep score) in the intervention groups was | 80 | ⊕⊕⊝⊝ | ||
| Parents' sleep (cough impact on parents' sleep score) Scale from: 0 to 6 Follow‐up: mean 1 day | The mean parents' sleep quality (cough impact on parents' sleep score) in the control groups was | The mean parents' sleep quality (cough impact on parents' sleep score) in the intervention groups was | 80 | ⊕⊕⊝⊝ | ||
| *The basis for the assumed risk (e.g. the median control group risk across studies) is provided in footnotes. The corresponding risk (and its 95%) is based on the assumed risk in the comparison group and the relative effect of the intervention (and its 95% CI). | ||||||
| GRADE Working Group grades of evidence | ||||||
| 1None of the treatment arms were blinded by Shadkam 2010 and allocation concealment was unclear. It was the same for the other outcomes. | ||||||
| Honey compared to 'no treatment' for acute cough in children | ||||||
| Patient or population: children with acute cough | ||||||
| Outcomes | Illustrative comparative risks* (95% CI) | Relative effect | No. of participants | Quality of the evidence | Comments | |
| Assumed risk | Corresponding risk | |||||
| 'No treatment' | Honey | |||||
| Frequency of cough (mean improvement score) Scale from: 0 to 6 Follow‐up: mean 1 day | The mean frequency of cough (mean improvement) in the control groups was | The mean frequency of cough (mean improvement score) in the intervention groups was | 154 | ⊕⊕⊕⊝ | ||
| Severity of cough (mean improvement score) Scale from: 0 to 6 Follow‐up: mean 1 day | The mean severity of cough (mean improvement) in the control groups was | The mean severity of cough (mean improvement) in the intervention groups was | 154 | ⊕⊕⊕⊝ | ||
| Bothersome cough (mean improvement score) Scale from: 0 to 6 Follow‐up: mean 1 day | The mean bothersome cough (mean improvement) in the control groups was | The mean bothersome cough (mean improvement) in the intervention groups was | 74 | ⊕⊕⊕⊝ | ||
| Childrens' sleep (cough impact on children's sleep score) Scale from: 0 to 6 Follow‐up: mean 1 day | The mean children's sleep quality (cough impact on children's sleep quality score) in the control groups was | The mean children's sleep quality (cough impact on children's sleep quality score) in the intervention groups was | 154 | ⊕⊕⊕⊝ | ||
| Parents' sleep (cough impact on parents' sleep score) Scale from: 0 to 6 Follow‐up: mean 1 day | The mean parents' sleep quality (cough impact on parents' sleep score) in the control groups was | The mean parents' sleep quality (cough impact on parents' sleep score) in the intervention groups was | 154 | ⊕⊕⊕⊝ | ||
| *The basis for the assumed risk (e.g. the median control group risk across studies) is provided in footnotes. The corresponding risk (and its 95% CI) is based on the assumed risk in the comparison group and the relative effect of the intervention (and its 95% CI). | ||||||
| GRADE Working Group grades of evidence | ||||||
| 1The 'no treatment' group were not blinded in either of the studies; allocation concealment was unclear in the Shadkam 2010 study. | ||||||
| Honey compared to placebo for acute cough in children | ||||||
| Patient or population: children with acute cough | ||||||
| Outcomes | Illustrative comparative risks* (95% CI) | Relative effect | No. of participants | Quality of the evidence | Comments | |
| Assumed risk | Corresponding risk | |||||
| Placebo | Honey | |||||
| Frequency of cough (mean improvement score) | The mean frequency of cough (mean improvement score) in the control groups was | The mean frequency of cough (mean improvement score) in the intervention groups was | 300 | ⊕⊕⊕⊕ | We downgraded quality of evidence to moderate because only 1 high quality RCT compared honey to placebo | |
| Severity of cough (mean improvement score) | The mean severity of cough (mean improvement score) in the control groups was | The mean severity of cough (mean improvement score) in the intervention groups was | 300 | ⊕⊕⊕⊕ | Downgraded (same reason as above) | |
| Bothersome cough | The mean bothersome cough in the control groups was | The mean bothersome cough in the intervention groups was | 300 | ⊕⊕⊕⊕ | Downgraded (same reason as above) | |
| Child's sleep (cough impact on child's sleep | The mean child's sleep (cough impact on child's sleep in the control groups was | The mean child's sleep (cough impact on child's sleep in the intervention groups was | 300 | ⊕⊕⊕⊕ | Downgraded (same reason as above) | |
| Parents' sleep (cough impact on parents' sleep score) | The mean parents' sleep (cough impact on parents' sleep score) in the control groups was | The mean parents' sleep (cough impact on parents' sleep score) in the intervention groups was | 300 | ⊕⊕⊕⊕ | Downgraded (same reason as above) | |
| *The basis for the assumed risk (e.g. the median control group risk across studies) is provided in footnotes. The corresponding risk (and its 95% confidence interval) is based on the assumed risk in the comparison group and the relative effect of the intervention (and its 95% CI). | ||||||
| GRADE Working Group grades of evidence | ||||||
| Adverse events | ||||||
| Patient or population: children with acute cough | ||||||
| Outcomes | Illustrative comparative risks* (95% CI) | Relative effect | No. of participants | Quality of the evidence | Comments | |
| Assumed risk | Corresponding risk | |||||
| Control | Honey | |||||
| Nervousness, insomnia, hyperactivity (honey versus dextromethorphan) | Study population | RR 2.94 | 149 | ⊕⊕⊕⊝ | ||
| 27 per 1000 | 79 per 1000 | |||||
| Moderate | ||||||
| 29 per 1000 | 85 per 1000 | |||||
| Stomach ache, nausea and vomiting (honey versus dextromethorphan) | Study population | RR 4.86 | 149 | ⊕⊕⊕⊝ | ||
| 0 per 1000 | 0 per 1000 | |||||
| Moderate | ||||||
| 0 per 1000 | 0 per 1000 | |||||
| Drowsiness (honey versus dextromethorphan) | Study population | RR 2.92 | 149 | ⊕⊕⊕⊝ | ||
| 0 per 1000 | 0 per 1000 | |||||
| Moderate | ||||||
| 0 per 1000 | 0 per 1000 | |||||
| Somnolence (honey versus diphenhydramine) | Study population | RR 0.14 | 80 | ⊕⊕⊕⊝ | ||
| 75 per 1000 | 10 per 1000 | |||||
| Moderate | ||||||
| 75 per 1000 | 10 per 1000 | |||||
| Stomach ache, nausea and vomiting (honey versus placebo) | Study population | RR 1.34 | 300 | ⊕⊕⊕⊕ | We downgraded the evidence because only 1 high quality RCT compared honey versus placebo | |
| 13 per 1000 | 18 per 1000 | |||||
| Moderate | ||||||
| *The basis for the assumed risk (e.g. the median control group risk across studies) is provided in footnotes. The corresponding risk (and its 95% confidence interval) is based on the assumed risk in the comparison group and the relative effect of the intervention (and its 95% CI). | ||||||
| GRADE Working Group grades of evidence | ||||||
| 1No explanation was provided. | ||||||
| Outcome or subgroup title | No. of studies | No. of participants | Statistical method | Effect size |
| 1 Cough frequency (mean improvement) Show forest plot | 3 | Mean Difference (Fixed, 95% CI) | Subtotals only | |
| 1.1 Honey | 3 | 300 | Mean Difference (Fixed, 95% CI) | ‐1.97 [‐2.68, ‐1.25] |
| 1.2 Dextromethorphan | 2 | 74 | Mean Difference (Fixed, 95% CI) | ‐1.49 [‐2.09, ‐0.88] |
| 1.3 Diphenhydramine | 1 | 40 | Mean Difference (Fixed, 95% CI) | ‐1.73 [‐2.72, ‐0.74] |
| 1.4 Placebo (silan dates extract) | 1 | 75 | Mean Difference (Fixed, 95% CI) | ‐1.0 [‐1.82, ‐0.18] |
| 1.5 No treatment | 2 | 79 | Mean Difference (Fixed, 95% CI) | ‐0.98 [‐1.38, ‐0.59] |
| 1.6 Buckwheat honey | 1 | 35 | Mean Difference (Fixed, 95% CI) | ‐1.89 [‐2.96, ‐0.81] |
| 1.7 Natural honey from Kafi‐Abad (Iran) | 1 | 40 | Mean Difference (Fixed, 95% CI) | ‐2.16 [‐3.40, ‐0.92] |
| 1.8 Eucalyptus honey | 1 | 75 | Mean Difference (Fixed, 95% CI) | ‐1.77 [‐3.22, ‐0.32] |
| 1.9 Labiatae honey | 1 | 75 | Mean Difference (Fixed, 95% CI) | ‐1.82 [‐3.30, ‐0.34] |
| 1.10 Citrus honey | 1 | 75 | Mean Difference (Fixed, 95% CI) | ‐1.95 [‐3.55, ‐0.35] |
| 2 Severity of cough (mean improvement) Show forest plot | 3 | Mean Difference (Fixed, 95% CI) | Subtotals only | |
| 2.1 Honey | 3 | 300 | Mean Difference (Fixed, 95% CI) | ‐1.97 [‐2.70, ‐1.24] |
| 2.2 Dextromethorphan | 2 | 74 | Mean Difference (Fixed, 95% CI) | ‐1.52 [‐2.24, ‐0.80] |
| 2.3 Diphenhydramine | 1 | 40 | Mean Difference (Fixed, 95% CI) | ‐1.83 [‐2.88, ‐0.78] |
| 2.4 No treatment | 2 | 79 | Mean Difference (Fixed, 95% CI) | ‐1.13 [‐1.54, ‐0.72] |
| 2.5 Placebo (silan date extract) | 1 | 75 | Mean Difference (Fixed, 95% CI) | ‐0.99 [‐1.81, ‐0.17] |
| 2.6 Buckwheat honey | 1 | 35 | Mean Difference (Fixed, 95% CI) | ‐1.80 [‐2.88, ‐0.72] |
| 2.7 Natural honey from Kafi‐Abad(Iran) | 1 | 40 | Mean Difference (Fixed, 95% CI) | ‐2.33 [‐3.67, ‐0.99] |
| 2.8 Eucalyptus honey | 1 | 75 | Mean Difference (Fixed, 95% CI) | ‐1.78 [‐2.82, ‐0.74] |
| 2.9 Labiatae honey | 1 | 75 | Mean Difference (Fixed, 95% CI) | ‐1.94 [‐3.07, ‐0.81] |
| 2.10 Citrus honey | 1 | 75 | Mean Difference (Fixed, 95% CI) | ‐1.77 [‐2.74, ‐0.80] |
| 3 Bothersome cough (mean improvement) reduction Show forest plot | 2 | Mean Difference (Fixed, 95% CI) | Subtotals only | |
| 3.1 Honey | 2 | 260 | Mean Difference (Fixed, 95% CI) | ‐2.18 [‐3.24, ‐1.13] |
| 3.2 Dextromethorphan | 1 | 34 | Mean Difference (Fixed, 95% CI) | ‐1.94 [‐3.05, ‐0.83] |
| 3.3 No treatment | 1 | 39 | Mean Difference (Fixed, 95% CI) | ‐1.30 [‐2.07, ‐0.53] |
| 3.4 Placebo | 1 | 75 | Mean Difference (Fixed, 95% CI) | ‐1.25 [‐2.39, ‐0.11] |
| 3.5 Buckwheat honey | 1 | 35 | Mean Difference (Fixed, 95% CI) | ‐2.23 [‐3.50, ‐0.96] |
| 3.6 Eucalyptus honey | 1 | 75 | Mean Difference (Fixed, 95% CI) | ‐2.0 [‐3.82, ‐0.18] |
| 3.7 Labiatae honey | 1 | 75 | Mean Difference (Fixed, 95% CI) | ‐2.07 [‐4.03, ‐0.11] |
| 3.8 Citrus honey | 1 | 75 | Mean Difference (Fixed, 95% CI) | ‐2.16 [‐4.20, ‐0.12] |
| 4 Children's sleep (cough impact on children's sleep score) Show forest plot | 3 | Mean Difference (Random, 95% CI) | Subtotals only | |
| 4.1 Honey | 3 | 300 | Mean Difference (Random, 95% CI) | ‐2.27 [‐3.13, ‐1.41] |
| 4.2 Dextromethorphan | 2 | 74 | Mean Difference (Random, 95% CI) | ‐1.75 [‐2.46, ‐1.04] |
| 4.3 Diphenhydramine | 1 | 40 | Mean Difference (Random, 95% CI) | ‐1.64 [‐2.58, ‐0.70] |
| 4.4 No treatment | 2 | 79 | Mean Difference (Random, 95% CI) | ‐1.28 [‐1.81, ‐0.76] |
| 4.5 Placebo | 1 | 75 | Mean Difference (Random, 95% CI) | ‐1.21 [‐2.46, 0.04] |
| 5 Parents' sleep (cough impact on parents' sleep score) Show forest plot | 3 | Mean Difference (Fixed, 95% CI) | Subtotals only | |
| 5.1 Honey | 3 | 300 | Mean Difference (Fixed, 95% CI) | ‐2.30 [‐3.18, ‐1.43] |
| 5.2 Dextromethorphan | 2 | 74 | Mean Difference (Fixed, 95% CI) | ‐1.97 [‐2.77, ‐1.17] |
| 5.3 Diphenhydramine | 1 | 40 | Mean Difference (Fixed, 95% CI) | ‐1.89 [‐2.97, ‐0.81] |
| 5.4 No treatment | 2 | 79 | Mean Difference (Fixed, 95% CI) | ‐1.46 [‐2.06, ‐0.87] |
| 5.5 Placebo | 1 | 75 | Mean Difference (Fixed, 95% CI) | ‐1.28 [‐2.64, 0.08] |
| 6 Combined improvement Show forest plot | 2 | Mean Difference (Fixed, 95% CI) | Subtotals only | |
| 6.1 Honey | 2 | 260 | Mean Difference (Fixed, 95% CI) | ‐9.11 [‐11.31, ‐6.90] |
| 6.2 Dextromethorphan | 1 | 34 | Mean Difference (Fixed, 95% CI) | ‐8.39 [‐10.95, ‐5.84] |
| 6.3 No treatment | 1 | 39 | Mean Difference (Fixed, 95% CI) | ‐6.41 [‐8.82, ‐3.99] |
| 6.4 Placebo | 1 | 75 | Mean Difference (Fixed, 95% CI) | ‐5.82 [‐10.76, ‐0.88] |
| Outcome or subgroup title | No. of studies | No. of participants | Statistical method | Effect size |
| 1 Honey versus dextromethorphan Show forest plot | 2 | Mean Difference (Random, 95% CI) | Subtotals only | |
| 1.1 Frequency of cough (mean improvement) | 2 | 149 | Mean Difference (Random, 95% CI) | ‐0.07 [‐1.07, 0.94] |
| 1.2 Severity of cough (mean improvement) | 2 | 149 | Mean Difference (Random, 95% CI) | ‐0.13 [‐1.25, 0.99] |
| 1.3 Bothersome cough (mean improvement) | 1 | 69 | Mean Difference (Random, 95% CI) | 0.29 [‐0.56, 1.14] |
| 1.4 Children's sleep (cough impact on children's sleep score) | 2 | 149 | Mean Difference (Random, 95% CI) | 0.03 [‐1.12, 1.19] |
| 1.5 Parents' sleep (cough impact on parents' sleep score) | 2 | 149 | Mean Difference (Random, 95% CI) | ‐0.16 [‐0.84, 0.53] |
| 1.6 Combined mean improvement | 1 | 69 | Mean Difference (Random, 95% CI) | 2.32 [‐1.24, 5.88] |
| 2 Honey versus diphenhydramine Show forest plot | 1 | Mean Difference (Random, 95% CI) | Subtotals only | |
| 2.1 Frequency of cough (mean improvement) | 1 | 80 | Mean Difference (Random, 95% CI) | ‐0.57 [‐0.90, ‐0.24] |
| 2.2 Severity of cough (mean improvement) | 1 | 80 | Mean Difference (Random, 95% CI) | ‐0.6 [‐0.94, ‐0.26] |
| 2.3 Children's sleep (cough impact on children's sleep score) | 1 | 80 | Mean Difference (Random, 95% CI) | ‐0.55 [‐0.87, ‐0.23] |
| 2.4 Parents' sleep (cough impact on parents' sleep score) | 1 | 80 | Mean Difference (Random, 95% CI) | ‐0.48 [‐0.76, ‐0.20] |
| 3 Honey versus 'no treatment' Show forest plot | 2 | Mean Difference (Random, 95% CI) | Subtotals only | |
| 3.1 Frequency of cough (mean improvement score) | 2 | 154 | Mean Difference (Random, 95% CI) | ‐1.05 [‐1.48, ‐0.62] |
| 3.2 Severity of cough (mean improvement) | 2 | 154 | Mean Difference (Random, 95% CI) | ‐1.03 [‐1.59, ‐0.47] |
| 3.3 Bothersome cough (mean improvement) | 1 | 74 | Mean Difference (Random, 95% CI) | ‐0.93 [‐1.98, 0.12] |
| 3.4 Children's sleep (cough impact on children's sleep score) | 2 | 154 | Mean Difference (Random, 95% CI) | ‐1.04 [‐1.57, ‐0.51] |
| 3.5 Parents' sleep (cough impact on parents' sleep score) | 2 | 154 | Mean Difference (Random, 95% CI) | ‐0.88 [‐1.23, ‐0.52] |
| 3.6 Combined mean improvement | 1 | 74 | Mean Difference (Random, 95% CI) | ‐4.31 [‐6.77, ‐1.85] |
| 4 Honey versus placebo (silan dates extract) Show forest plot | 1 | Mean Difference (Random, 95% CI) | Subtotals only | |
| 4.1 Frequency of cough (mean improvement score) | 1 | 300 | Mean Difference (Random, 95% CI) | ‐1.85 [‐3.36, ‐0.33] |
| 4.2 Severity of cough (mean improvement) | 1 | 300 | Mean Difference (Random, 95% CI) | ‐1.83 [‐3.32, ‐0.34] |
| 4.3 Bothersome cough (mean improvement) reduction | 1 | 300 | Mean Difference (Random, 95% CI) | ‐2.08 [‐3.97, ‐0.19] |
| 4.4 Children's sleep (cough impact on children's sleep score) | 1 | 300 | Mean Difference (Random, 95% CI) | ‐1.94 [‐3.93, 0.06] |
| 4.5 Parents' sleep (cough impact on parents' sleep score) | 1 | 300 | Mean Difference (Random, 95% CI) | ‐2.05 [‐4.24, 0.13] |
| Outcome or subgroup title | No. of studies | No. of participants | Statistical method | Effect size |
| 1 Nervousness, insomnia, hyperactivity Show forest plot | 2 | 149 | Risk Ratio (M‐H, Fixed, 95% CI) | 2.94 [0.74, 11.71] |
| 2 Stomach ache, nausea and vomiting Show forest plot | 2 | 149 | Risk Ratio (M‐H, Fixed, 95% CI) | 4.86 [0.24, 97.69] |
| 3 Drowsiness Show forest plot | 2 | 149 | Risk Ratio (M‐H, Fixed, 95% CI) | 2.92 [0.12, 69.20] |
| 4 Somnolence Show forest plot | 1 | 80 | Risk Ratio (M‐H, Fixed, 95% CI) | 0.14 [0.01, 2.68] |
| 5 Stomach ache, nausea and vomiting Show forest plot | 1 | 300 | Risk Ratio (M‐H, Fixed, 95% CI) | 1.33 [0.15, 11.74] |
| 5.1 Honey | 1 | 300 | Risk Ratio (M‐H, Fixed, 95% CI) | 1.33 [0.15, 11.74] |