Madu untuk batuk akut dalam kalangan kanak‐kanak
Abstract
Background
Cough causes concern for parents and is a major cause of outpatient visits. It can impact on quality of life, cause anxiety and affect sleep in parents and children. Several remedies, including honey, have been used to alleviate cough symptoms.
Objectives
To evaluate the effectiveness of honey for acute cough in children in ambulatory settings.
Search methods
We searched CENTRAL (2014, Issue 10), MEDLINE (1950 to October week 4, 2014), EMBASE (1990 to November 2014), CINAHL (1981 to November 2014), Web of Science (2000 to November 2014), AMED (1985 to November 2014), LILACS (1982 to November 2014) and CAB abstracts (2009 to January 2014).
Selection criteria
Randomised controlled trials (RCTs) comparing honey given alone, or in combination with antibiotics, versus nothing, placebo or other over‐the‐counter (OTC) cough medications to participants aged from one to 18 years for acute cough in ambulatory settings.
Data collection and analysis
Two review authors independently screened search results for eligible studies and extracted data on reported outcomes.
Main results
We included three RCTs, two at high risk of bias and one at low risk of bias, involving 568 children. The studies compared honey with dextromethorphan, diphenhydramine, 'no treatment' and placebo for the effect on symptomatic relief of cough using a seven‐point Likert scale. The lower the score, the better the cough symptom being assessed.
Moderate quality evidence showed that honey may be better than 'no treatment' in reducing the frequency of cough (mean difference (MD) ‐1.05; 95% confidence interval (CI) ‐1.48 to ‐0.62; I2 statistic 23%; two studies, 154 participants). High quality evidence also suggests that honey may be better than placebo for reduction of cough frequency (MD ‐1.85; 95% Cl ‐3.36 to ‐0.33; one study, 300 participants). Moderate quality evidence suggests that honey does not differ significantly from dextromethorphan in reducing cough frequency (MD ‐0.07; 95% CI ‐1.07 to 0.94; two studies, 149 participants). Low quality evidence suggests that honey may be slightly better than diphenhydramine in reducing cough frequency (MD ‐0.57; 95% CI ‐0.90 to ‐0.24; one study, 80 participants).
Adverse events included mild reactions (nervousness, insomnia and hyperactivity) experienced by seven children (9.3%) from the honey group and two (2.7%) from the dextromethorphan group; the difference was not significant (risk ratio (RR) 2.94; 95% Cl 0.74 to 11.71; two studies, 149 participants). Three children (7.5%) in the diphenhydramine group experienced somnolence (RR 0.14; 95% Cl 0.01 to 2.68; one study, 80 participants). When honey was compared with placebo, four children (1.8%) in the honey group and one (1.3%) from the placebo group complained of gastrointestinal symptoms (RR 1.33; 95% Cl 0.15 to 11.74). However, there was no significant difference between honey versus dextromethorphan, honey versus diphenhydramine or honey versus placebo. No adverse event was reported in the 'no treatment' group.
Authors' conclusions
Honey may be better than 'no treatment', diphenhydramine and placebo for the symptomatic relief of cough, but it is not better than dextromethorphan. None of the included studies assessed the effect of honey on 'cough duration' because intervention and follow‐up were for one night only. There is no strong evidence for or against the use of honey.
PICO
Ringkasan bahasa mudah
Madu untuk batuk akut dalam kalangan kanak‐kanak
Soalan Ulasan
Kami ingin mengetahui sama ada madu boleh mengurangkan gejala batuk yang disebabkan oleh bakteria dan virus dalam kalangan kanak‐kanak.
Latar Belakang
Batuk adalah satu punca yang membimbangkan ibu bapa dan punca utama untuk lawatan pesakit luar di kebanyakan klinik bagi kanak‐kanak dan orang dewasa. Batuk boleh menjejaskan kualiti hidup, menyebabkan kebimbangan dan menjejaskan tidur bagi ibu bapa dan kanak‐kanak. Ubat yang segera sering dicari oleh penjaga dan pesakit. Ulasan‐ulasan Cochrane telah melaporkan tentang kesan ubat batuk yang dijual di kaunter (OTC), tetapi tiada yang mengkaji madu untuk melegakan batuk.
Madu adalah campuran manis pelbagai jenis karbohidrat, asid amino, flavonoid, vitamin dan unsur surih. Madu dipercayai dapat mencegah pertumbuhan bakteria, virus dan yis, dan mengurangkan keradangan.
Ciri‐ciri Kajian
Kami memasukkan tiga kajian rawak terkawal yang kecil, melibatkan 568 kanak‐kanak, berusia satu hingga 18 tahun. Bukti adalah terkini sehingga November 2014.
Keputusan‐keputusan utama
Kajian‐kajian kecil ini menunjukkan bahawa madu mungkin lebih baik daripada 'tanpa rawatan' dan plasebo (cecair yang kelihatan dan rasa seperti madu, tetapi bukan madu) dalam melegakan batuk. Bukti juga menunjukkan bahawa madu mungkin adalah lebih baik daripada plasebo dalam mengurangkan kebimbangan akibat batuk. Namun, ia adalah tidak berbeza dengan 'tanpa rawatan'. Madu membolehkan kanak‐kanak dan ibu bapa untuk tidur dengan lebih baik pada waktu malam berbanding dengan 'tanpa rawatan'.
Kesan madu dan dextromethorphan atas semua gejala batuk adalah tidak berbeza. Madu mungkin lebih baik daripada diphenhydramine dalam melegakan dan mengurangkan kesan batuk dalam kanak‐kanak. Madu juga membolehkan ibu bapa dan kanak‐kanak tidur dengan lebih baik berbanding dengan diphenhydramine.
Kedua‐dua diphenhydramine dan dextromethorphan adalah bahan biasa dalam sirap batuk. Ibu bapa kepada tujuh anak yang diberikan madu dan dua diberikan dextromethorphan melaporkan kesan sampingan yang tidak terlalu serius, seperti tidak mudah untuk tidur, atau menjadi sangat resah dan lebih teruja. Ibu bapa kepada tiga kanak‐kanak dalam kumpulan diphenhydramine melaporkan anak‐anak mereka sering mengantuk.
Kualiti bukti
Seperti ubat yang lain, manfaat madu harus dipertimbangkan bersama dengan kemudaratannya. Ulasan terkini ini adalah terhad kepada tiga kajian yang dimasukkan. Dua adalah kajian kecil dengan peluang tinggi bahawa beberapa keputusan mereka mungkin tidak begitu tepat.
Adalah penting juga untuk menyatakan bahawa penggunaan madu pada bayi di bawah umur satu tahun adalah tidak digalakkan kerana imuniti mereka yang lemah terhadap Clostridium botulinum (C. botulinum), sejenis bakteria di dalam madu yang boleh menyebabkan botulism bayi.
Authors' conclusions
Summary of findings
| Honey versus dextromethorphan | ||||||
| Patient or population: children with acute cough | ||||||
| Outcomes | Illustrative comparative risks* (95% CI) | Relative effect | No of participants | Quality of the evidence | Comments | |
| Assumed risk | Corresponding risk | |||||
| Dextromethorphan | Honey | |||||
| Cough frequency (mean improvement in symptom score) | The mean cough frequency (mean improvement in symptom score) in the control groups was | The mean cough frequency (mean improvement in symptom score) in the intervention groups was | 137 | ⊕⊕⊕⊝ | ||
| Cough severity (mean improvement in symptom score) | The mean cough severity (mean improvement in symptom score) in the control groups was | The mean cough severity (mean improvement in symptom score) in the intervention groups was | 137 | ⊕⊕⊕⊝ | ||
| Child's sleep (mean improvement score) | The mean child's sleep (mean improvement score) in the control groups was | The mean child's sleep (mean improvement score) in the intervention groups was | 137 | ⊕⊕⊕⊝ | ||
| Parents' sleep (mean improvement score) | The mean parents' sleep (mean improvement score) in the control groups was | The mean parents' sleep (mean improvement score) in the intervention groups was | 137 | ⊕⊕⊕⊝ | ||
| Improvement in quality of life: combined effect (mean improvement in symptom score) | The mean improvement in quality of life: combined effect (mean improvement in symptom score) in the control groups was | The mean improvement in quality of life: combined effect (mean improvement in symptom score) in the intervention groups was | 68 | ⊕⊕⊕⊕ | ||
| *The basis for the assumed risk (e.g. the median control group risk across studies) is provided in footnotes. The corresponding risk (and its 95% confidence interval) is based on the assumed risk in the comparison group and the relative effect of the intervention (and its 95% CI). | ||||||
| GRADE Working Group grades of evidence | ||||||
| 1It was unclear if Shadkam 2010 had allocation concealment and there was no blinding in the study, which could increase the risk of bias in the study outcomes, although there was allocation concealment and partial double‐blinding in Paul 2007. | ||||||
| Honey compared to diphenhydramine for acute cough in children | ||||||
| Patient or population: children with acute cough | ||||||
| Outcomes | Illustrative comparative risks* (95% CI) | Relative effect | No. of participants | Quality of the evidence | Comments | |
| Assumed risk | Corresponding risk | |||||
| Diphenhydramine | Honey | |||||
| Frequency of cough (mean improvement score) Scale from: 0 to 6 Follow‐up: mean 1 day | The mean frequency of cough (mean improvement) in the control groups was | The mean frequency of cough (mean improvement) in the intervention groups was 0.57 lower | 80 | ⊕⊕⊝⊝ | ||
| Severity of cough (mean improvement score) Scale from: 0 to 6 Follow‐up: mean 1 day | The mean severity of cough (mean improvement) in the control groups was | The mean severity of cough (mean improvement) in the intervention groups was 0.6 lower | 80 | ⊕⊕⊝⊝ | ||
| Children's sleep (cough impact on children's sleep score) Scale from: 0 to 6 Follow‐up: mean 1 day | The mean children's sleep quality (cough impact on children's sleep score) in the control groups was | The mean children's sleep quality (cough impact on children's sleep score) in the intervention groups was | 80 | ⊕⊕⊝⊝ | ||
| Parents' sleep (cough impact on parents' sleep score) Scale from: 0 to 6 Follow‐up: mean 1 day | The mean parents' sleep quality (cough impact on parents' sleep score) in the control groups was | The mean parents' sleep quality (cough impact on parents' sleep score) in the intervention groups was | 80 | ⊕⊕⊝⊝ | ||
| *The basis for the assumed risk (e.g. the median control group risk across studies) is provided in footnotes. The corresponding risk (and its 95%) is based on the assumed risk in the comparison group and the relative effect of the intervention (and its 95% CI). | ||||||
| GRADE Working Group grades of evidence | ||||||
| 1None of the treatment arms were blinded by Shadkam 2010 and allocation concealment was unclear. It was the same for the other outcomes. | ||||||
| Honey compared to 'no treatment' for acute cough in children | ||||||
| Patient or population: children with acute cough | ||||||
| Outcomes | Illustrative comparative risks* (95% CI) | Relative effect | No. of participants | Quality of the evidence | Comments | |
| Assumed risk | Corresponding risk | |||||
| 'No treatment' | Honey | |||||
| Frequency of cough (mean improvement score) Scale from: 0 to 6 Follow‐up: mean 1 day | The mean frequency of cough (mean improvement) in the control groups was | The mean frequency of cough (mean improvement score) in the intervention groups was | 154 | ⊕⊕⊕⊝ | ||
| Severity of cough (mean improvement score) Scale from: 0 to 6 Follow‐up: mean 1 day | The mean severity of cough (mean improvement) in the control groups was | The mean severity of cough (mean improvement) in the intervention groups was | 154 | ⊕⊕⊕⊝ | ||
| Bothersome cough (mean improvement score) Scale from: 0 to 6 Follow‐up: mean 1 day | The mean bothersome cough (mean improvement) in the control groups was | The mean bothersome cough (mean improvement) in the intervention groups was | 74 | ⊕⊕⊕⊝ | ||
| Childrens' sleep (cough impact on children's sleep score) Scale from: 0 to 6 Follow‐up: mean 1 day | The mean children's sleep quality (cough impact on children's sleep quality score) in the control groups was | The mean children's sleep quality (cough impact on children's sleep quality score) in the intervention groups was | 154 | ⊕⊕⊕⊝ | ||
| Parents' sleep (cough impact on parents' sleep score) Scale from: 0 to 6 Follow‐up: mean 1 day | The mean parents' sleep quality (cough impact on parents' sleep score) in the control groups was | The mean parents' sleep quality (cough impact on parents' sleep score) in the intervention groups was | 154 | ⊕⊕⊕⊝ | ||
| *The basis for the assumed risk (e.g. the median control group risk across studies) is provided in footnotes. The corresponding risk (and its 95% CI) is based on the assumed risk in the comparison group and the relative effect of the intervention (and its 95% CI). | ||||||
| GRADE Working Group grades of evidence | ||||||
| 1The 'no treatment' group were not blinded in either of the studies; allocation concealment was unclear in the Shadkam 2010 study. | ||||||
| Honey compared to placebo for acute cough in children | ||||||
| Patient or population: children with acute cough | ||||||
| Outcomes | Illustrative comparative risks* (95% CI) | Relative effect | No. of participants | Quality of the evidence | Comments | |
| Assumed risk | Corresponding risk | |||||
| Placebo | Honey | |||||
| Frequency of cough (mean improvement score) | The mean frequency of cough (mean improvement score) in the control groups was | The mean frequency of cough (mean improvement score) in the intervention groups was | 300 | ⊕⊕⊕⊕ | We downgraded quality of evidence to moderate because only 1 high quality RCT compared honey to placebo | |
| Severity of cough (mean improvement score) | The mean severity of cough (mean improvement score) in the control groups was | The mean severity of cough (mean improvement score) in the intervention groups was | 300 | ⊕⊕⊕⊕ | Downgraded (same reason as above) | |
| Bothersome cough | The mean bothersome cough in the control groups was | The mean bothersome cough in the intervention groups was | 300 | ⊕⊕⊕⊕ | Downgraded (same reason as above) | |
| Child's sleep (cough impact on child's sleep | The mean child's sleep (cough impact on child's sleep in the control groups was | The mean child's sleep (cough impact on child's sleep in the intervention groups was | 300 | ⊕⊕⊕⊕ | Downgraded (same reason as above) | |
| Parents' sleep (cough impact on parents' sleep score) | The mean parents' sleep (cough impact on parents' sleep score) in the control groups was | The mean parents' sleep (cough impact on parents' sleep score) in the intervention groups was | 300 | ⊕⊕⊕⊕ | Downgraded (same reason as above) | |
| *The basis for the assumed risk (e.g. the median control group risk across studies) is provided in footnotes. The corresponding risk (and its 95% confidence interval) is based on the assumed risk in the comparison group and the relative effect of the intervention (and its 95% CI). | ||||||
| GRADE Working Group grades of evidence | ||||||
| Adverse events | ||||||
| Patient or population: children with acute cough | ||||||
| Outcomes | Illustrative comparative risks* (95% CI) | Relative effect | No. of participants | Quality of the evidence | Comments | |
| Assumed risk | Corresponding risk | |||||
| Control | Honey | |||||
| Nervousness, insomnia, hyperactivity (honey versus dextromethorphan) | Study population | RR 2.94 | 149 | ⊕⊕⊕⊝ | ||
| 27 per 1000 | 79 per 1000 | |||||
| Moderate | ||||||
| 29 per 1000 | 85 per 1000 | |||||
| Stomach ache, nausea and vomiting (honey versus dextromethorphan) | Study population | RR 4.86 | 149 | ⊕⊕⊕⊝ | ||
| 0 per 1000 | 0 per 1000 | |||||
| Moderate | ||||||
| 0 per 1000 | 0 per 1000 | |||||
| Drowsiness (honey versus dextromethorphan) | Study population | RR 2.92 | 149 | ⊕⊕⊕⊝ | ||
| 0 per 1000 | 0 per 1000 | |||||
| Moderate | ||||||
| 0 per 1000 | 0 per 1000 | |||||
| Somnolence (honey versus diphenhydramine) | Study population | RR 0.14 | 80 | ⊕⊕⊕⊝ | ||
| 75 per 1000 | 10 per 1000 | |||||
| Moderate | ||||||
| 75 per 1000 | 10 per 1000 | |||||
| Stomach ache, nausea and vomiting (honey versus placebo) | Study population | RR 1.34 | 300 | ⊕⊕⊕⊕ | We downgraded the evidence because only 1 high quality RCT compared honey versus placebo | |
| 13 per 1000 | 18 per 1000 | |||||
| Moderate | ||||||
| *The basis for the assumed risk (e.g. the median control group risk across studies) is provided in footnotes. The corresponding risk (and its 95% confidence interval) is based on the assumed risk in the comparison group and the relative effect of the intervention (and its 95% CI). | ||||||
| GRADE Working Group grades of evidence | ||||||
| 1No explanation was provided. | ||||||
Background
Description of the condition
Cough is a normal protective mechanism (Landau 2006), and a means by which the respiratory system rids itself of excessive secretions and foreign bodies (French 1998). Cough can be caused by bacterial or viral infections, the presence of an irritant or allergen in the respiratory tract, or both (Greaves 1997). Respiratory infections can be situated along the upper or lower respiratory tract and the resulting cough can be either productive or unproductive of sputum. When cough is unproductive of sputum it is usually referred to as a 'dry' cough. Children with a dry cough tend to have minimal airway secretions (Chang 2005).
Cough can also be classified as acute or chronic. Chronic cough is a cough that lasts for more than three weeks (Meyer 1996). Acute cough from an upper respiratory tract infection (URTI) is one of the most common symptoms presenting to primary care settings or general practitioners (Butler 2005; Cherry 2003). It has been reported that most coughs from acute URTIs are caused by viral infections (Braman 2006; Butler 2005). Cough is a cause for concern for parents (Hay 2003), and a major cause of outpatient visits in most settings for both children and adults (Gonzales 2000; Kusel 2007). Cough can impact on quality of life (French 2002), cause anxiety and affect sleep for parents and children. For this reason an immediate remedy is usually sought by both the caregiver and the recipient.
Description of the intervention
People frequently self prescribe over‐the‐counter (OTC) cough medications and many general practitioners in primary care settings recommend OTC medications to their patients as a first‐line treatment (PAGB 2000). Numerous OTC cough preparations are available but there is no good evidence regarding their efficacy (Chang 2014; Smith 2012). In children, these medications may be associated with serious adverse events such as death, altered consciousness and arrhythmias (CDC 2007; Gunn 2001; Kelly 2004). In some studies, cough preparations have been shown to relieve cough symptoms, but other studies have found that they have no effect compared with a placebo (Banderali 1995; Freestone 1997; Kurth 1978; Smith 1993). It has been reported that cough mixtures contain a variety of drugs with differing modes of action, thus making them difficult to compare (Morice 1998). OTC cough medication could contain any of the following: dextromethorphan hydrobromide, phenylephrine hydrochloride, chlorpheniramine maleate and methylparaben (El‐Gindy 2005).
How the intervention might work
Honey is a sweet, viscous liquid with a complex chemical composition. It is made up of a mixture of approximately 25 carbohydrates (Sanz 2004), free amino acids (Hermosin 2003; Suárez‐Luque 2002), vitamins, trace elements (Golob 2005; Hernández 2005; Nanda 2003; Tuzen 2007; Yao 2003), and flavonoids (Havsteen 2002). It also contains compounds that function as antioxidants (Nagai 2006). Honey is said to possess antibacterial (Lusby 2005; Mullai 2007) and anti‐inflammatory properties (Tonks 2003). A study of the antimicrobial effect of honey showed that it has broad‐spectrum antimicrobial actions, various gram‐negative and gram‐positive bacteria (Agbaje 2006; Garedew 2004), and is active against common bacteria found in the upper respiratory tract such as Staphylococcus aureus (S. aureus), Streptococcus faecalis (S. faecalis),Candida albicans (C. albicans),Klebsiella pneumoniae (K. pneumoniae),Pseudomonas aeruginosa (P. aeruginosa),Escherichia coli (E. coli), Salmonella spp and Shigella dysenteriae (S. dysenteriae) (Adeleye 2003; Mullai 2007). In another study honey was also shown to have antiviral properties (Zeina 1996). Due to these properties, honey has been used in traditional medicine for the treatment of cough (Adeleye 2003). It is also used in modern medicines to treat infected wounds (Lusby 2005; Molan 2006), and is an ingredient in some cough syrups (Zeina 1996). However, the use of honey in infants under the age of one is restricted because of their poor immunity against Clostridium botulinum (C. botulinum), a possible contaminant of honey (Küplülü 2006; Nevas 2002).
Why it is important to do this review
Identification of ineffective preparations could reduce costs for consumers and health care providers (Smith 2012). Cochrane reviews have assessed the effectiveness of OTC cough medications (Chang 2014; Smith 2012), but none have studied honey for cough relief. A systematic review evaluating the effectiveness of honey for reducing acute cough symptoms due to URTIs in children would be useful. This is the second update of our review (Oduwole 2010). If honey is effective it may save billions of dollars spent annually on OTC cough medications (Dicpinigaitis 2009). Our original review had no strong evidence for or against the use of honey for treating acute cough in children because only one small trial was included. Our conclusion in the first update of this review, Oduwole 2012, did not differ from that of the original review because only two small studies with high risk of bias were included. Identifying more RCTs that evaluate the effectiveness of honey for acute cough in children could answer this question.
Objectives
To evaluate the effectiveness of honey for acute cough in children in ambulatory settings.
Methods
Criteria for considering studies for this review
Types of studies
Randomised controlled trials (RCTs).
Types of participants
We included participants aged from one to 18 years with a cough caused by an acute URTI (viral or bacterial). We excluded studies that included participants with a chronic cough (cough lasting for more than three weeks). We also excluded studies with a sample size of fewer than 10 per intervention.
Types of interventions
We included studies comparing the following.
-
Honey only versus:
-
honey‐based cough syrup;
-
non‐honey cough syrup;
-
placebo; and
-
'no treatment'.
-
-
Honey plus antibiotics versus antibiotics alone.
-
Honey plus antibiotics versus non‐honey cough syrups plus antibiotics.
Types of outcome measures
Primary outcomes
-
Duration of cough.
-
Symptomatic relief of cough (frequency of cough, reduction in severity and less bothersome cough).
Secondary outcomes
-
Improvement in quality of sleep at night for children (cough impact on sleep score).
-
Improvement in quality of sleep at night for caregiver (cough impact on sleep score).
-
Improvement in quality of life (for example, school attendance and playing).
-
Adverse effects of the medications on participants.
-
Improvement in appetite.
-
Cost of honey alone compared with other cough syrups.
Search methods for identification of studies
Electronic searches
For this update we searched the Cochrane Central Register of Controlled Trials (CENTRAL) (2014, Issue 10), which contains the Cochrane Acute Respiratory Infections Group's Specialised Register, MEDLINE (January 2012 to October week 4, 2014), EMBASE (January 2012 to October 2014), CINAHL (January 2012 to October 2014), Web of Science (2011 to October 2014), AMED (2011 to October 2014), LILACS (2011 to October 2014) and CAB abstracts (2011 to January 2014). Details of previous searches are in Appendix 1.
We used the search strategy in Appendix 2 for searching MEDLINE and CENTRAL and modified terms for searching EMBASE (see Appendix 3), CINAHL (Appendix 4), Web of Science (Appendix 5), AMED (Appendix 6), LILACS (Appendix 7) and CAB abstracts (Appendix 8). We did not combine the MEDLINE search string with the Cochrane highly sensitive search strategy for identifying randomised trials in MEDLINE (Lefebvre 2011), because we found very few results. We imposed no language or publication restrictions.
Searching other resources
We also searched databases of complementary and alternative medicine literature and clinical trials registers. The latest search of the World Health Organization (WHO) International Clinical Trial Registry Platform (ICTRP) and www.clinicaltrials.gov was on 4 November 2014. We checked the reference lists of all relevant articles obtained from our search and those from previously published systematic reviews to identify other possible articles. We also contacted authors of the new included study for information on unpublished data.
Data collection and analysis
Selection of studies
Two review authors (OO, EU) independently screened search results for eligible studies based on a priori inclusion criteria. The authors resolved disagreements by consensus.
Data extraction and management
Two authors (OO, AO) independently extracted and entered data into Review Manager 5.3 (RevMan 2014). The same two review authors (OO, AO) resolved disagreements by consensus.
Assessment of risk of bias in included studies
Two authors (OO, AO) determined the risk of bias for the included trials by assessing random sequence generation, allocation concealment, blinding, selective reporting and other sources of bias, and recorded the assessment in the 'Risk of bias' tables. We ranked the studies as low risk, unclear risk and high risk of bias, as recommended in the Cochrane Handbook for Systematic Reviews of Interventions (Higgins 2011).
Measures of treatment effect
We used one‐way analysis of variance in comparing treatment effect for cough symptoms and quality of sleep by the trial authors. We presented estimates of effects as mean differences (MDs) derived from parents' subjective assessment of cough symptoms and the impact on sleep quality through validated questions using a seven‐point Likert scale (Likert 1932).
We analysed pair‐wise comparisons of outcomes using generic inverse variance in RevMan 2014. We estimated MDs between patients' Likert scores at baseline and postintervention for frequency of cough, bothersome cough and cough impact on quality of sleep for child and parent. We used the MD for the pair‐wise comparison of treatment effect between honey and dextromethorphan, honey and diphenhydramine, and honey and 'no treatment', using generic inverse variance in RevMan 2014.
Unit of analysis issues
Not applicable.
Dealing with missing data
We obtained the standard error (SE) of the mean from the lead trial author of the Paul 2007 study. We calculated the SE of the mean using PEPI version 3 (Abramson 1999) for the Shadkam 2010 study and Microsoft Excel 2007 version for Cohen 2012. We performed an intention‐to‐treat (ITT) analysis by including all randomised participants in the analysis according to the Cochrane Handbook for Systematic Reviews of Interventions (Higgins 2011). We assumed that all missing participants did not improve.
Assessment of heterogeneity
We considered heterogeneity statistically significant when the I2 statistic was 50% or more. We used the random‐effects model for meta‐analysis when the I2 statistic was more than 50%.
Assessment of reporting biases
We could not test asymmetry with a funnel plot because the number of included studies was too few.
Data synthesis
We used the fixed‐effect model for combining data from the three included studies. We used RevMan 2014 to perform an inverse‐variance meta‐analysis using a fixed‐effect method for differences in mean between pre‐ and postintervention Likert scores and pair‐wise comparisons of postintervention mean Likert scores between honey and dextromethorphan, honey and diphenhydramine and honey and 'no treatment'. We used a random‐effects model where there was heterogeneity. We extracted the estimates of effects (MDs) and SE of the mean for each outcome and calculated 95% CIs of the MDs using generic inverse variance. We used the Mantel‐Haenszel method to analyse the risk ratio (RR) for adverse events. We combined the mean score of the three honey groups (eucalyptus honey, citrus honey or labiatae honey) and compared to the placebo group in Cohen 2012.
Subgroup analysis and investigation of heterogeneity
Data were only available for three small studies; therefore investigation of heterogeneity was not feasible. We used a random‐effects model instead of a fixed‐effect model to address any possible heterogeneity. We also did a subgroup analysis of the different types of honey.
Sensitivity analysis
We did not perform a sensitivity analysis because we only included three small trials.
Results
Description of studies
Results of the search
Our updated 2014 search yielded 100 studies. Only one new study met our inclusion criteria (Cohen 2012). There was total agreement between the review authors on the relevance of this trial. Two studies have just been completed and are awaiting classification (IRCT201110247882N1; NCT01356693); one study is ongoing (IRCT2014090819037N1).
Included studies
We included three RCTs involving 568 participants in the review (Cohen 2012; Paul 2007; Shadkam 2010).
In the study by Paul 2007, 108 participants were randomised but only 105 participants were included in the final analysis. The median age was 5.22 years (range 2.22 to 16.92 years). These participants presented with URTIs and nocturnal symptoms. The duration of illness was seven days or less. The Shadkam 2010 study randomised 160 participants but only involved 139 participants in the final analysis. The mean age of the participants was 37.75 ± 11.12 months. These participants also presented with URTIs and nocturnal symptoms. The duration of illness was five days or less. The new included study, Cohen 2012, randomised 300 participants with URTIs and nocturnal cough but included 270 children in the final analysis. The median age of participants was 29 months (range 12 to 71 months). Paul 2007 compared honey (buckwheat honey) to dextromethorphan and 'no treatment'. Shadkam 2010 compared natural honey from Kafi‐Abad, a village in Yazd, Iran to dextromethorphan and 'no treatment'. Shadkam 2010 also included diphenhydramine in their comparison. Cohen 2012 compared three types of honey (eucalyptus honey, citrus honey or labiatae honey) to placebo (silan date extract).
Excluded studies
In the first publication of our review, we excluded two studies because they were reviews of the included studies (Gilbert 2008; Warren 2007). From the 2014 updated searches, we excluded Ahmed 2013 and Sopo 2014 because Ahmed 2013 was a feasibility study of honey for treatment of cough in children, while Sopo 2014 randomised participants into "honey and milk" versus dextromethorphan and "honey and milk" versus levodropropizine. The remaining 77 studies were either commentaries, non‐clinical studies, reviews relating to the included studies or studies not related to honey as an intervention for acute cough.
Risk of bias in included studies
Allocation
The randomisation sequence in Paul 2007 was generated by a statistician not affiliated with the study. Participants were assigned to their treatment groups by the study co‐ordinator according to the sequence generated by the statistician. The allocation sequence was concealed in brown envelopes. In Shadkam 2010, randomisation was achieved through the use of a random numbers table and it was not stated clearly if there was allocation concealment. Cohen 2012 packed all types of honey and silan date in plastic containers marked with the letters A, B, C or D (Figure 1).
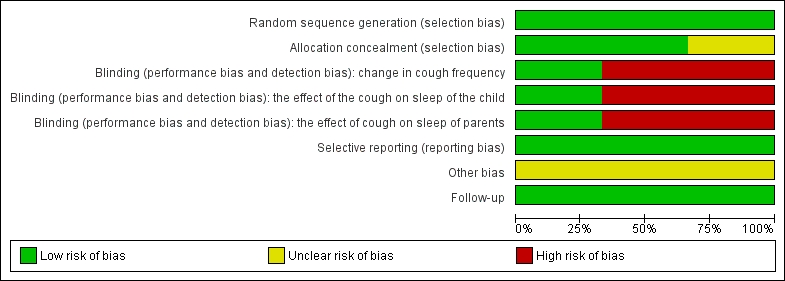
'Risk of bias' graph for included studies
Blinding
The baseline characteristics did not differ significantly between treatment groups in the included studies. In Paul 2007, the study personnel and participants were blinded to two intervention arms (dextromethorphan and honey) but it was not feasible to blind the 'no treatment' arm. This could have been a source of bias. The awareness of not receiving any treatment could have affected self reported outcomes in the 'no treatment' arm. There was no form of blinding in Shadkam 2010 (Figure 2). In Cohen 2012, parents, physicians, research assistants and the study co‐ordinator did not know the contents of the preparation that was dispensed. The envelopes containing the codes of the preparations were stored at the office of the Ministry of Agriculture and were not opened until after the statistical analysis was completed.

'Risk of bias' summary: review authors' judgements about each risk of bias item for each included study.
Incomplete outcome data
Attrition in the Paul 2007 study was minimal. The authors accounted for all of the participants: attrition rates were 3% and 5% for the dextromethorphan and 'no treatment' groups, respectively. Two participants were lost to follow‐up in the 'no treatment' group, while one was excluded from the dextromethorphan group for discontinuing the assigned intervention (see 'Risk of bias' table). There was no loss to follow‐up or exclusion of participants from the honey group. Attrition in the Shadkam 2010 study was relatively high. Attrition in the honey group was 17.5%, 10% in the dextromethorphan group, 15% in the diphenhydramine group and 10% in the 'no treatment' arm. All randomised participants were not included the final analysis. Attrition in Cohen 2012 was moderate, 15% in the eucalyptus honey group, 17% in the citrus honey group, 4% in the labiatae honey group and 5% in the placebo (silan date extract) group and all patients were accounted for. According to Cohen 2012, the participants lost to follow‐up were not included in the final analysis because they did not take the intervention they were assigned.
Selective reporting
We could not ascertain whether there was selective reporting in the three included studies as we had no access to the study protocols for the trials.
Other potential sources of bias
The baseline characteristics did not differ significantly between treatment groups but Paul 2007, Shadkam 2010 and Cohen 2012 did not conduct an ITT analysis.
Effects of interventions
See: Summary of findings for the main comparison Honey versus dextromethorphan for acute cough in children; Summary of findings 2 Honey compared to diphenhydramine for acute cough in children; Summary of findings 3 Honey compared to 'no treatment' for acute cough in children; Summary of findings 4 Honey compared to placebo for acute cough in children; Summary of findings 5 Adverse events
Pre‐ and post‐intervention comparison
Primary outcomes
1. Duration of cough
We could not determine the effect of honey on cough duration because none of the included studies assessed this outcome because the intervention and follow‐up were for one night only.
2. Symptomatic relief of cough (frequency of cough, less bothersome and reduction in severity)
Frequency of cough
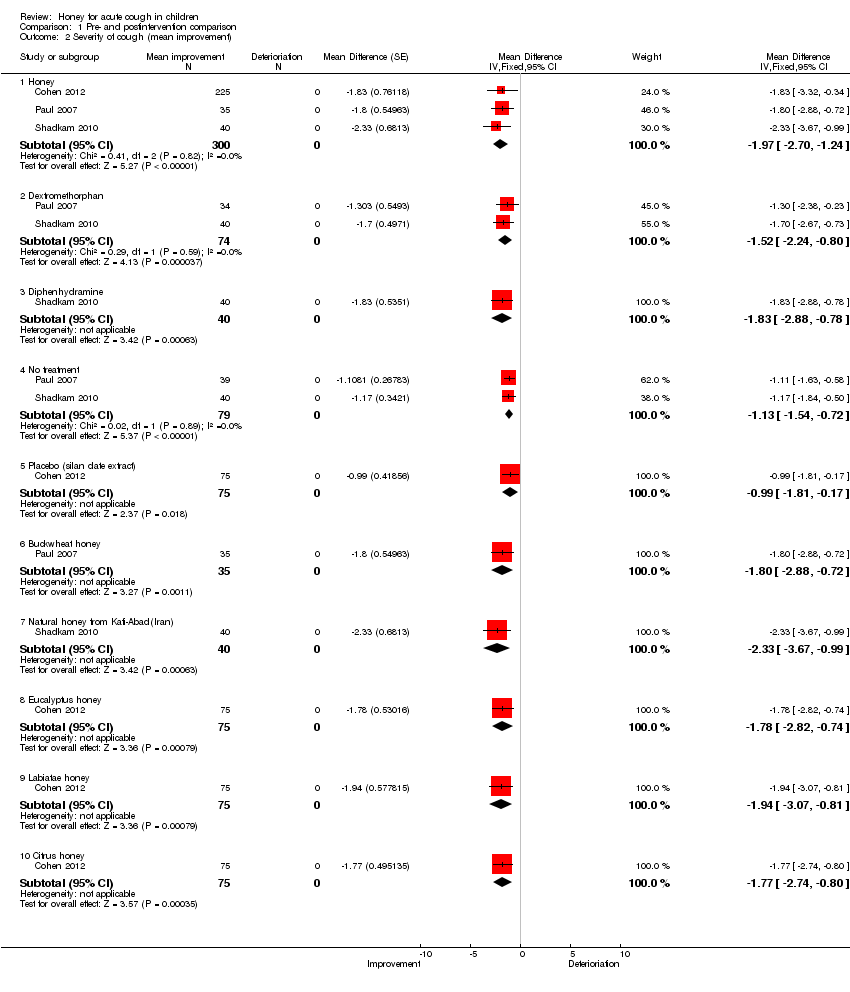
Using a seven‐point Likert scale, caregivers' responses to the questionnaire on cough symptoms ranged from 'extremely' (six points) to 'not at all' (zero points). Therefore, the lower the score, the better the cough symptom being assessed. Pre‐ and postintervention comparison for each treatment arm shows that honey was more effective in reducing the frequency of cough in the three studies. When the frequency of cough before the single night treatment and after treatment were compared using the seven‐point Likert scale, parents in the honey group rated their children to have a ‐1.97 mean score reduction (95% CI ‐2.68 to ‐1.25; I2 statistic 14%; three studies, 300 participants) compared to children in the diphenhydramine treatment group (mean difference (MD) ‐1.73; 95% CI ‐2.72 to ‐0.74, one study, 40 participants), dextromethorphan group (MD ‐1.49; 95% CI ‐2.09 to ‐0.88; I2 statistic 12%; two studies, 74 participants), placebo group (MD ‐1.00; 95% Cl ‐1.82 to ‐0.18; one study, 75 participants) and the 'no treatment' group (MD ‐0.98; 95% CI ‐1.38 to ‐0.59; I2 statistic 17%; two studies, 79 participants) (Analysis 1.1).
Subgroup analysis comparing types of honey
When we compared the different types of honey in a subgroup analysis, natural honey from Kafi‐Abad (Iran) reduced cough frequency to a greater extent (MD ‐2.16; 95% CI ‐3.40 to ‐0.92; one study, 40 participants) than citrus honey (MD ‐1.95; 95% CI ‐3.55 to ‐0.35; one study, 75 participants); buckwheat honey (MD ‐1.89; 95% CI ‐2.96 to ‐0.81; one study, 35 participants); labiatae honey (MD ‐1.82; 95% CI ‐3.30 to ‐0.34; one study, 75 participants) and eucalyptus honey (MD ‐1.77; 95% CI ‐3.22 to ‐0.32; one study, 75 participants) (Analysis 1.1).
Reduction in severity and less bothersome cough
Similarly, honey reduced the severity of cough in children post‐intervention on a seven‐point Likert scale (MD ‐1.97; 95% CI ‐2.70 to ‐1.24; I2 statistic 41%; three studies, 300 participants) to a greater extent than dextromethorphan (MD ‐1.52; 95% CI ‐2.24 to ‐0.80; I2 statistic 29%; two studies, 74 participants), diphenhydramine (MD ‐1.83; 95% CI ‐2.88 to ‐0.78; one study, 40 participants), the 'no treatment' arm (MD ‐1.13; 95% CI ‐1.54 to ‐0.72; I2 statistic 2%; two studies, 79 participants) and placebo (MD ‐0.99; 95% Cl ‐1.81 to ‐0.17; one study, 75 participants) (Analysis 1.2). The quality of evidence was moderate.
The bothersome cough of children in the honey group also improved to a greater extent when compared to children in the other treatment groups. Honey had a mean score reduction of ‐2.18; 95% CI ‐3.24 to ‐1.13; I2 statistic 2%; two studies, 260 participants); dextromethorphan had a mean score reduction of ‐1.94; 95% CI ‐3.05 to ‐0.83; one study, 34 participants; 'no treatment' (MD ‐1.30; 95% CI ‐2.07 to ‐0.53; one study, 39 participants) and placebo (MD ‐1.25; 95% Cl ‐2.39 to ‐0.11; one study, 75 participants) (Analysis 1.3).
Natural honey from Kafi‐Abad (Iran) also reduced the severity of cough of the children to a greater extent (MD ‐2.33; 95% CI ‐3.67 to ‐0.99; one study, 40 participants) than buckwheat honey (MD ‐1.80; 95% CI ‐2.88 to ‐0.72; one study, 35 participants); labiatae honey (MD ‐1.94; 95% CI ‐3.07 to ‐0.81; one study, 75 participants); eucalyptus honey (MD ‐1.78; 95% CI ‐2.82 to ‐0.74; one study, 75 participants) and citrus honey (MD ‐1.77; 95% CI ‐2.74 to ‐0.80; one study, 75 participants).
Buckwheat honey reduced bothersome cough to some extent (MD ‐2.23; 95% CI ‐3.50 to ‐0.96; one study, 35 participants) more than citrus honey (MD ‐2.16; 95% CI ‐4.20 to ‐0.12; one study, 75 participants); labiatae honey (MD ‐2.07; 95% CI ‐4.03 to ‐0.11; one study, 75 participants) and eucalyptus honey (MD ‐2.00; 95% CI ‐3.82 to ‐0.18; one study, 75 participants).
Secondary outcomes
1. Improvement in quality of sleep at night for children (cough impact on sleep score)
Caregivers' Likert scores for cough impact on children's sleep reduced to a greater extent in the honey group (MD ‐2.27; 95% CI ‐3.13 to ‐1.41; I2 statistic 20%; three studies, 300 participants) than in the dextromethorphan group (MD ‐1.75; 95% CI ‐2.46 to ‐1.04; I2 statistic 1%; two studies, 74 participants), diphenhydramine group (MD ‐1.64; 95% CI ‐2.58 to ‐0.70; one study, 40 participants), 'no treatment' group (MD ‐1.28; 95% CI ‐1.81 to ‐0.76; I2 statistic 60%; two studies, 79 participants) and placebo group (MD ‐1.21; 95% Cl ‐2.46 to 0.04; one study, 75 participants) (Analysis 1.4). The quality of evidence was moderate.
2. Improvement in quality of sleep at night for caregiver (cough impact on sleep score)
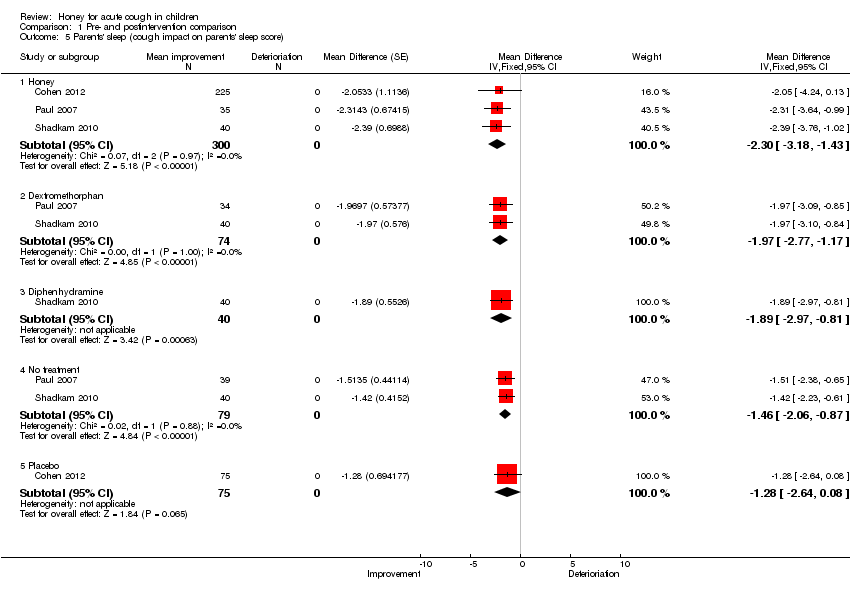
At postintervention, cough impact on parents' sleep was also improved to a greater extent by honey on a seven‐point Likert scale (MD ‐2.30; 95% CI ‐3.18 to ‐1.43; I2 statistic 7%; three studies, 300 participants) than dextromethorphan (MD ‐1.97; 95% CI ‐2.77 to ‐1.17; I2 statistic 0%; two studies, 74 participants), diphenhydramine (MD ‐1.89; 95% CI ‐2.97 to ‐0.81; one study, 40 participants), 'no treatment' (MD ‐1.46; 95% CI ‐2.06. to ‐0.87; I2 statistic 2%; two studies, 79 participants) and placebo (MD ‐1.28; 95% Cl ‐2.64 to 0.08; one study, 75 participants) (Analysis 1.5). The quality of evidence was moderate.
3. Improvement in quality of life (for example, school attendance and playing)
None of the included studies assessed the quality of life of participants.
4. Adverse effects of the medications on participants
Reported adverse events included mild reactions (nervousness, insomnia and hyperactivity); gastrointestinal symptoms (stomach ache, nausea and vomiting); drowsiness and somnolence. The difference observed in the adverse events between honey versus dextromethorphan, honey versus diphenhydramine and honey versus placebo were not statistically significant. Seven children (9.3%) from the honey group compared to two (2.7%) from the dextromethorphan group experienced mild reactions such as nervousness, insomnia and hyperactivity (risk ratio (RR) 2.94; 95% CI 0.74 to 11.71; two studies, 149 participants) (Analysis 3.1). Two children (2.7%) from the honey group had gastrointestinal symptoms (RR 4.86; 95% CI 0.24 to 97.69; two studies, 149 participants), and one (1.3%) experienced drowsiness (RR 2.92; 95% CI 0.12 to 69.20; two studies, 149 participants) (Analysis 3.2). Three children (7.5%) experienced somnolence in the diphenhydramine group but it was not significantly different from honey (RR 0.14; 95% CI 0.01 to 2.68; one study, 80 participants). No adverse reaction was reported in the 'no treatment' arm (Fisher 1922). Cohen 2012 reported that four children (1.8%) in the honey group compared to one (1.3%) from the placebo arm experienced gastrointestinal symptoms (RR 1.33; 95% Cl 0.15 to 11.74) (Analysis 3.5).
5. Improvement in appetite
None of the included studies assessed improvement in appetite as an outcome.
6. Cost of honey alone compared with other cough syrups
None of the included studies included cost of treatment as an outcome.
Pair‐wise comparison of honey and dextromethorphan
Moderate quality evidence showed that there was no difference between honey and dextromethorphan in reducing cough frequency (MD ‐0.07; 95% CI ‐1.07 to 0.94; two studies, 149 participants), cough severity (MD ‐0.13; 95% CI ‐1.25 to 0.99; two studies, 149 participants), bothersome cough (MD 0.29; 95% CI ‐0.56 to 1.14; one study, 69 participants), impact of cough on children's sleep (MD 0.03; 95% CI ‐1.12 to 1.19; two studies, 149 participants) and parents' sleep (MD ‐0.16; 95% CI ‐0.84 to 0.53; two studies, 149 participants) (Analysis 2.1).
Pair‐wise comparison of honey versus diphenhydramine
Honey may be better than diphenhydramine in reducing the frequency of cough (MD ‐0.57; 95% CI ‐0.90 to ‐0.24; one study, 80 participants), severity of cough (MD ‐0.60; 95% CI ‐0.94 to ‐0.26; one study, 80 participants), cough impact on children's sleep (MD ‐0.55; 95% CI ‐0.87 to ‐0.23; one study, 80 participants) and cough impact on parents' sleep (MD ‐0.48; 95% CI ‐0.76 to ‐0.20; one study, 80 participants). The quality of evidence was low (Analysis 2.2).
Pair‐wise comparison of honey versus 'no treatment'
Moderate quality evidence showed that the effect of honey was probably better than 'no treatment' in reducing cough frequency (MD ‐1.05; 95% CI ‐1.48 to ‐0.62; I2 statistic 23%; two studies, 154 participants); cough severity (MD ‐1.03; 95% CI ‐1.59 to ‐0.47; I2 statistic 63%; two studies, 154 participants); reduction in the impact of cough on children's sleep (MD ‐1.04; 95% CI ‐1.57 to ‐0.51; I2 statistic 7%; two studies, 154 participants) and reduction in the impact of cough on parents' sleep (MD ‐0.88; 95% CI ‐1.23 to ‐0.52; I2 statistic 26%; two studies, 154 participants). However, it was no different than 'no treatment' in resolving bothersome cough (MD ‐0.93; 95% CI ‐1.98 to 0.12; one study, 74 participants) (Analysis 2.3).
Pair‐wise comparison of honey versus placebo
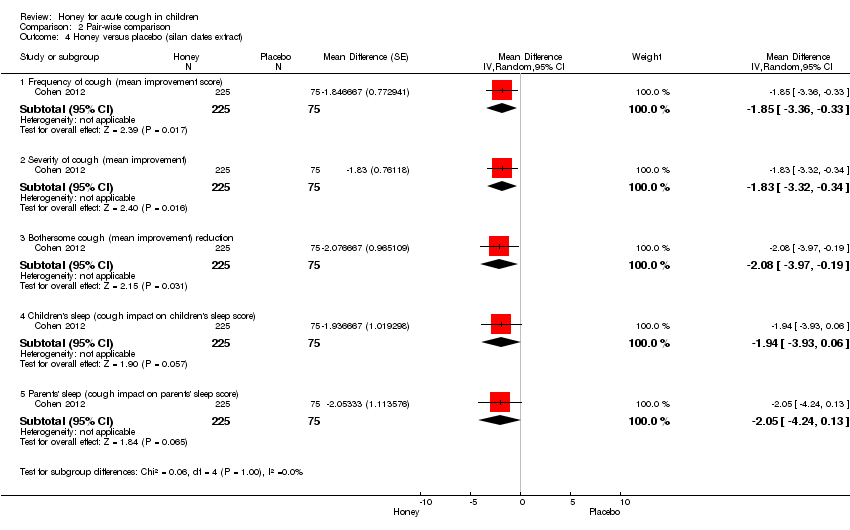
Evidence showed that honey may be better than placebo in reducing cough frequency (MD ‐1.85; 95% Cl ‐3.36 to ‐0.33; one study, 300 participants), severity of cough (MD ‐1.83; 95% Cl ‐3.32 to ‐0.34; one study, 300 participants) and bothersome cough (MD ‐2.08; 95% Cl ‐3.97 to ‐0.19; one study, 300 participants). However, there was no difference between honey and placebo in improving the sleep quality of children (MD ‐1.94; 95% Cl ‐3.93 to 0.06; one study, 300 participants) and their parents (MD ‐2.05; 95% Cl ‐4.24 to 0.13; one study, 300 participants) (Analysis 2.4). Even though the quality of Cohen 2012 was high, we downgraded the quality of evidence to moderate because only one study compared honey to placebo.
Discussion
Summary of main results
Honey may be better than 'no treatment' for symptomatic relief of cough and improving sleep quality for both children and parents. However, it was no different to 'no treatment' in resolving bothersome cough. Honey may also be better than diphenhydramine for symptomatic relief of cough and for reduction of cough impact on the sleep quality of children and their parents. Honey was likely to be no better than dextromethorphan for symptomatic relief of cough, resolving bothersome cough and improving sleep quality for both children and parents. Honey may also be better than placebo for symptomatic relief of cough and resolving bothersome cough. However, there is no evidence to suggest that honey has an effect on improving sleep quality for both children and parents. When the types of honey were compared, natural honey from Kafi‐Abad (Iran) reduced cough frequency and cough severity to a greater extent than other types of honey. However, this finding is from a study with high risk of bias, where none of the treatment arms were blinded.
No serious adverse event was reported in any of the treatment groups. Non‐severe adverse events were more common in the honey group than the 'no treatment' and placebo group, but comparable with the dextromethorphan group and diphenhydramine group.
Overall completeness and applicability of evidence
This review included three small trials. Outcomes could have been different or more reliable if treatment and follow‐up were longer than one night. Other outcomes such as improvements in appetite, school attendance and playing were not reported. We cannot generalise on the applicability of our findings.
Quality of the evidence
Two of the included studies, Paul 2007 and Shadkam 2010, were at high risk of bias due to non‐blinding of all participants and investigators (Shadkam 2010) and the 'no treatment arm' (Paul 2007), while Cohen 2012 had low risk of bias. In Shadkam 2010, allocation concealment was unclear and none of the study arms were blinded. Use of supportive treatment for all of the study arms in the Shadkam 2010 study may have contributed to the higher effects of interventions observed in this study. Also outcomes were measured using a seven‐point Likert scale, which is a qualitative ordinal scale; as a result symptom scores may be subjective.
Potential biases in the review process
None.
Agreements and disagreements with other studies or reviews
No other systematic review has been conducted on honey for treating cough.

'Risk of bias' graph for included studies

'Risk of bias' summary: review authors' judgements about each risk of bias item for each included study.

Comparison 1 Pre‐ and postintervention comparison, Outcome 1 Cough frequency (mean improvement).
Comparison 1 Pre‐ and postintervention comparison, Outcome 2 Severity of cough (mean improvement).

Comparison 1 Pre‐ and postintervention comparison, Outcome 3 Bothersome cough (mean improvement) reduction.

Comparison 1 Pre‐ and postintervention comparison, Outcome 4 Children's sleep (cough impact on children's sleep score).
Comparison 1 Pre‐ and postintervention comparison, Outcome 5 Parents' sleep (cough impact on parents' sleep score).

Comparison 1 Pre‐ and postintervention comparison, Outcome 6 Combined improvement.

Comparison 2 Pair‐wise comparison, Outcome 1 Honey versus dextromethorphan.

Comparison 2 Pair‐wise comparison, Outcome 2 Honey versus diphenhydramine.

Comparison 2 Pair‐wise comparison, Outcome 3 Honey versus 'no treatment'.
Comparison 2 Pair‐wise comparison, Outcome 4 Honey versus placebo (silan dates extract).
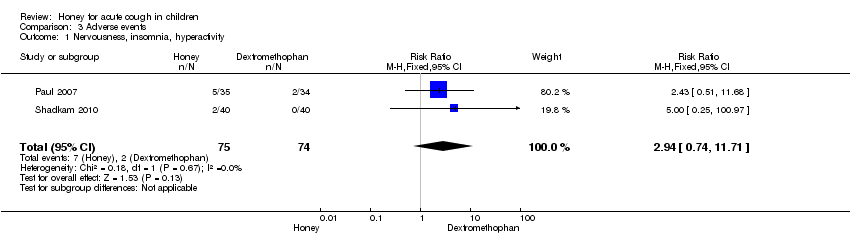
Comparison 3 Adverse events, Outcome 1 Nervousness, insomnia, hyperactivity.

Comparison 3 Adverse events, Outcome 2 Stomach ache, nausea and vomiting.
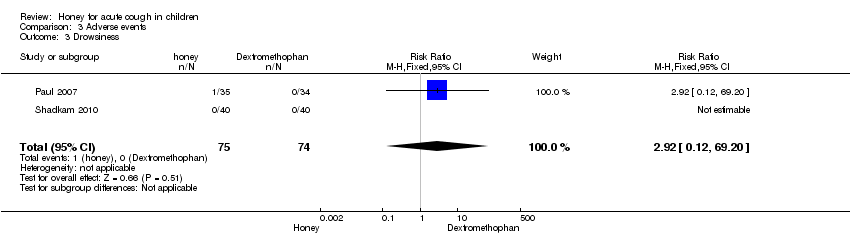
Comparison 3 Adverse events, Outcome 3 Drowsiness.
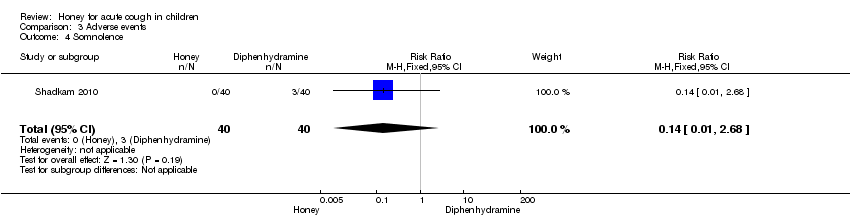
Comparison 3 Adverse events, Outcome 4 Somnolence.

Comparison 3 Adverse events, Outcome 5 Stomach ache, nausea and vomiting.
| Honey versus dextromethorphan | ||||||
| Patient or population: children with acute cough | ||||||
| Outcomes | Illustrative comparative risks* (95% CI) | Relative effect | No of participants | Quality of the evidence | Comments | |
| Assumed risk | Corresponding risk | |||||
| Dextromethorphan | Honey | |||||
| Cough frequency (mean improvement in symptom score) | The mean cough frequency (mean improvement in symptom score) in the control groups was | The mean cough frequency (mean improvement in symptom score) in the intervention groups was | 137 | ⊕⊕⊕⊝ | ||
| Cough severity (mean improvement in symptom score) | The mean cough severity (mean improvement in symptom score) in the control groups was | The mean cough severity (mean improvement in symptom score) in the intervention groups was | 137 | ⊕⊕⊕⊝ | ||
| Child's sleep (mean improvement score) | The mean child's sleep (mean improvement score) in the control groups was | The mean child's sleep (mean improvement score) in the intervention groups was | 137 | ⊕⊕⊕⊝ | ||
| Parents' sleep (mean improvement score) | The mean parents' sleep (mean improvement score) in the control groups was | The mean parents' sleep (mean improvement score) in the intervention groups was | 137 | ⊕⊕⊕⊝ | ||
| Improvement in quality of life: combined effect (mean improvement in symptom score) | The mean improvement in quality of life: combined effect (mean improvement in symptom score) in the control groups was | The mean improvement in quality of life: combined effect (mean improvement in symptom score) in the intervention groups was | 68 | ⊕⊕⊕⊕ | ||
| *The basis for the assumed risk (e.g. the median control group risk across studies) is provided in footnotes. The corresponding risk (and its 95% confidence interval) is based on the assumed risk in the comparison group and the relative effect of the intervention (and its 95% CI). | ||||||
| GRADE Working Group grades of evidence | ||||||
| 1It was unclear if Shadkam 2010 had allocation concealment and there was no blinding in the study, which could increase the risk of bias in the study outcomes, although there was allocation concealment and partial double‐blinding in Paul 2007. | ||||||
| Honey compared to diphenhydramine for acute cough in children | ||||||
| Patient or population: children with acute cough | ||||||
| Outcomes | Illustrative comparative risks* (95% CI) | Relative effect | No. of participants | Quality of the evidence | Comments | |
| Assumed risk | Corresponding risk | |||||
| Diphenhydramine | Honey | |||||
| Frequency of cough (mean improvement score) Scale from: 0 to 6 Follow‐up: mean 1 day | The mean frequency of cough (mean improvement) in the control groups was | The mean frequency of cough (mean improvement) in the intervention groups was 0.57 lower | 80 | ⊕⊕⊝⊝ | ||
| Severity of cough (mean improvement score) Scale from: 0 to 6 Follow‐up: mean 1 day | The mean severity of cough (mean improvement) in the control groups was | The mean severity of cough (mean improvement) in the intervention groups was 0.6 lower | 80 | ⊕⊕⊝⊝ | ||
| Children's sleep (cough impact on children's sleep score) Scale from: 0 to 6 Follow‐up: mean 1 day | The mean children's sleep quality (cough impact on children's sleep score) in the control groups was | The mean children's sleep quality (cough impact on children's sleep score) in the intervention groups was | 80 | ⊕⊕⊝⊝ | ||
| Parents' sleep (cough impact on parents' sleep score) Scale from: 0 to 6 Follow‐up: mean 1 day | The mean parents' sleep quality (cough impact on parents' sleep score) in the control groups was | The mean parents' sleep quality (cough impact on parents' sleep score) in the intervention groups was | 80 | ⊕⊕⊝⊝ | ||
| *The basis for the assumed risk (e.g. the median control group risk across studies) is provided in footnotes. The corresponding risk (and its 95%) is based on the assumed risk in the comparison group and the relative effect of the intervention (and its 95% CI). | ||||||
| GRADE Working Group grades of evidence | ||||||
| 1None of the treatment arms were blinded by Shadkam 2010 and allocation concealment was unclear. It was the same for the other outcomes. | ||||||
| Honey compared to 'no treatment' for acute cough in children | ||||||
| Patient or population: children with acute cough | ||||||
| Outcomes | Illustrative comparative risks* (95% CI) | Relative effect | No. of participants | Quality of the evidence | Comments | |
| Assumed risk | Corresponding risk | |||||
| 'No treatment' | Honey | |||||
| Frequency of cough (mean improvement score) Scale from: 0 to 6 Follow‐up: mean 1 day | The mean frequency of cough (mean improvement) in the control groups was | The mean frequency of cough (mean improvement score) in the intervention groups was | 154 | ⊕⊕⊕⊝ | ||
| Severity of cough (mean improvement score) Scale from: 0 to 6 Follow‐up: mean 1 day | The mean severity of cough (mean improvement) in the control groups was | The mean severity of cough (mean improvement) in the intervention groups was | 154 | ⊕⊕⊕⊝ | ||
| Bothersome cough (mean improvement score) Scale from: 0 to 6 Follow‐up: mean 1 day | The mean bothersome cough (mean improvement) in the control groups was | The mean bothersome cough (mean improvement) in the intervention groups was | 74 | ⊕⊕⊕⊝ | ||
| Childrens' sleep (cough impact on children's sleep score) Scale from: 0 to 6 Follow‐up: mean 1 day | The mean children's sleep quality (cough impact on children's sleep quality score) in the control groups was | The mean children's sleep quality (cough impact on children's sleep quality score) in the intervention groups was | 154 | ⊕⊕⊕⊝ | ||
| Parents' sleep (cough impact on parents' sleep score) Scale from: 0 to 6 Follow‐up: mean 1 day | The mean parents' sleep quality (cough impact on parents' sleep score) in the control groups was | The mean parents' sleep quality (cough impact on parents' sleep score) in the intervention groups was | 154 | ⊕⊕⊕⊝ | ||
| *The basis for the assumed risk (e.g. the median control group risk across studies) is provided in footnotes. The corresponding risk (and its 95% CI) is based on the assumed risk in the comparison group and the relative effect of the intervention (and its 95% CI). | ||||||
| GRADE Working Group grades of evidence | ||||||
| 1The 'no treatment' group were not blinded in either of the studies; allocation concealment was unclear in the Shadkam 2010 study. | ||||||
| Honey compared to placebo for acute cough in children | ||||||
| Patient or population: children with acute cough | ||||||
| Outcomes | Illustrative comparative risks* (95% CI) | Relative effect | No. of participants | Quality of the evidence | Comments | |
| Assumed risk | Corresponding risk | |||||
| Placebo | Honey | |||||
| Frequency of cough (mean improvement score) | The mean frequency of cough (mean improvement score) in the control groups was | The mean frequency of cough (mean improvement score) in the intervention groups was | 300 | ⊕⊕⊕⊕ | We downgraded quality of evidence to moderate because only 1 high quality RCT compared honey to placebo | |
| Severity of cough (mean improvement score) | The mean severity of cough (mean improvement score) in the control groups was | The mean severity of cough (mean improvement score) in the intervention groups was | 300 | ⊕⊕⊕⊕ | Downgraded (same reason as above) | |
| Bothersome cough | The mean bothersome cough in the control groups was | The mean bothersome cough in the intervention groups was | 300 | ⊕⊕⊕⊕ | Downgraded (same reason as above) | |
| Child's sleep (cough impact on child's sleep | The mean child's sleep (cough impact on child's sleep in the control groups was | The mean child's sleep (cough impact on child's sleep in the intervention groups was | 300 | ⊕⊕⊕⊕ | Downgraded (same reason as above) | |
| Parents' sleep (cough impact on parents' sleep score) | The mean parents' sleep (cough impact on parents' sleep score) in the control groups was | The mean parents' sleep (cough impact on parents' sleep score) in the intervention groups was | 300 | ⊕⊕⊕⊕ | Downgraded (same reason as above) | |
| *The basis for the assumed risk (e.g. the median control group risk across studies) is provided in footnotes. The corresponding risk (and its 95% confidence interval) is based on the assumed risk in the comparison group and the relative effect of the intervention (and its 95% CI). | ||||||
| GRADE Working Group grades of evidence | ||||||
| Adverse events | ||||||
| Patient or population: children with acute cough | ||||||
| Outcomes | Illustrative comparative risks* (95% CI) | Relative effect | No. of participants | Quality of the evidence | Comments | |
| Assumed risk | Corresponding risk | |||||
| Control | Honey | |||||
| Nervousness, insomnia, hyperactivity (honey versus dextromethorphan) | Study population | RR 2.94 | 149 | ⊕⊕⊕⊝ | ||
| 27 per 1000 | 79 per 1000 | |||||
| Moderate | ||||||
| 29 per 1000 | 85 per 1000 | |||||
| Stomach ache, nausea and vomiting (honey versus dextromethorphan) | Study population | RR 4.86 | 149 | ⊕⊕⊕⊝ | ||
| 0 per 1000 | 0 per 1000 | |||||
| Moderate | ||||||
| 0 per 1000 | 0 per 1000 | |||||
| Drowsiness (honey versus dextromethorphan) | Study population | RR 2.92 | 149 | ⊕⊕⊕⊝ | ||
| 0 per 1000 | 0 per 1000 | |||||
| Moderate | ||||||
| 0 per 1000 | 0 per 1000 | |||||
| Somnolence (honey versus diphenhydramine) | Study population | RR 0.14 | 80 | ⊕⊕⊕⊝ | ||
| 75 per 1000 | 10 per 1000 | |||||
| Moderate | ||||||
| 75 per 1000 | 10 per 1000 | |||||
| Stomach ache, nausea and vomiting (honey versus placebo) | Study population | RR 1.34 | 300 | ⊕⊕⊕⊕ | We downgraded the evidence because only 1 high quality RCT compared honey versus placebo | |
| 13 per 1000 | 18 per 1000 | |||||
| Moderate | ||||||
| *The basis for the assumed risk (e.g. the median control group risk across studies) is provided in footnotes. The corresponding risk (and its 95% confidence interval) is based on the assumed risk in the comparison group and the relative effect of the intervention (and its 95% CI). | ||||||
| GRADE Working Group grades of evidence | ||||||
| 1No explanation was provided. | ||||||
| Outcome or subgroup title | No. of studies | No. of participants | Statistical method | Effect size |
| 1 Cough frequency (mean improvement) Show forest plot | 3 | Mean Difference (Fixed, 95% CI) | Subtotals only | |
| 1.1 Honey | 3 | 300 | Mean Difference (Fixed, 95% CI) | ‐1.97 [‐2.68, ‐1.25] |
| 1.2 Dextromethorphan | 2 | 74 | Mean Difference (Fixed, 95% CI) | ‐1.49 [‐2.09, ‐0.88] |
| 1.3 Diphenhydramine | 1 | 40 | Mean Difference (Fixed, 95% CI) | ‐1.73 [‐2.72, ‐0.74] |
| 1.4 Placebo (silan dates extract) | 1 | 75 | Mean Difference (Fixed, 95% CI) | ‐1.0 [‐1.82, ‐0.18] |
| 1.5 No treatment | 2 | 79 | Mean Difference (Fixed, 95% CI) | ‐0.98 [‐1.38, ‐0.59] |
| 1.6 Buckwheat honey | 1 | 35 | Mean Difference (Fixed, 95% CI) | ‐1.89 [‐2.96, ‐0.81] |
| 1.7 Natural honey from Kafi‐Abad (Iran) | 1 | 40 | Mean Difference (Fixed, 95% CI) | ‐2.16 [‐3.40, ‐0.92] |
| 1.8 Eucalyptus honey | 1 | 75 | Mean Difference (Fixed, 95% CI) | ‐1.77 [‐3.22, ‐0.32] |
| 1.9 Labiatae honey | 1 | 75 | Mean Difference (Fixed, 95% CI) | ‐1.82 [‐3.30, ‐0.34] |
| 1.10 Citrus honey | 1 | 75 | Mean Difference (Fixed, 95% CI) | ‐1.95 [‐3.55, ‐0.35] |
| 2 Severity of cough (mean improvement) Show forest plot | 3 | Mean Difference (Fixed, 95% CI) | Subtotals only | |
| 2.1 Honey | 3 | 300 | Mean Difference (Fixed, 95% CI) | ‐1.97 [‐2.70, ‐1.24] |
| 2.2 Dextromethorphan | 2 | 74 | Mean Difference (Fixed, 95% CI) | ‐1.52 [‐2.24, ‐0.80] |
| 2.3 Diphenhydramine | 1 | 40 | Mean Difference (Fixed, 95% CI) | ‐1.83 [‐2.88, ‐0.78] |
| 2.4 No treatment | 2 | 79 | Mean Difference (Fixed, 95% CI) | ‐1.13 [‐1.54, ‐0.72] |
| 2.5 Placebo (silan date extract) | 1 | 75 | Mean Difference (Fixed, 95% CI) | ‐0.99 [‐1.81, ‐0.17] |
| 2.6 Buckwheat honey | 1 | 35 | Mean Difference (Fixed, 95% CI) | ‐1.80 [‐2.88, ‐0.72] |
| 2.7 Natural honey from Kafi‐Abad(Iran) | 1 | 40 | Mean Difference (Fixed, 95% CI) | ‐2.33 [‐3.67, ‐0.99] |
| 2.8 Eucalyptus honey | 1 | 75 | Mean Difference (Fixed, 95% CI) | ‐1.78 [‐2.82, ‐0.74] |
| 2.9 Labiatae honey | 1 | 75 | Mean Difference (Fixed, 95% CI) | ‐1.94 [‐3.07, ‐0.81] |
| 2.10 Citrus honey | 1 | 75 | Mean Difference (Fixed, 95% CI) | ‐1.77 [‐2.74, ‐0.80] |
| 3 Bothersome cough (mean improvement) reduction Show forest plot | 2 | Mean Difference (Fixed, 95% CI) | Subtotals only | |
| 3.1 Honey | 2 | 260 | Mean Difference (Fixed, 95% CI) | ‐2.18 [‐3.24, ‐1.13] |
| 3.2 Dextromethorphan | 1 | 34 | Mean Difference (Fixed, 95% CI) | ‐1.94 [‐3.05, ‐0.83] |
| 3.3 No treatment | 1 | 39 | Mean Difference (Fixed, 95% CI) | ‐1.30 [‐2.07, ‐0.53] |
| 3.4 Placebo | 1 | 75 | Mean Difference (Fixed, 95% CI) | ‐1.25 [‐2.39, ‐0.11] |
| 3.5 Buckwheat honey | 1 | 35 | Mean Difference (Fixed, 95% CI) | ‐2.23 [‐3.50, ‐0.96] |
| 3.6 Eucalyptus honey | 1 | 75 | Mean Difference (Fixed, 95% CI) | ‐2.0 [‐3.82, ‐0.18] |
| 3.7 Labiatae honey | 1 | 75 | Mean Difference (Fixed, 95% CI) | ‐2.07 [‐4.03, ‐0.11] |
| 3.8 Citrus honey | 1 | 75 | Mean Difference (Fixed, 95% CI) | ‐2.16 [‐4.20, ‐0.12] |
| 4 Children's sleep (cough impact on children's sleep score) Show forest plot | 3 | Mean Difference (Random, 95% CI) | Subtotals only | |
| 4.1 Honey | 3 | 300 | Mean Difference (Random, 95% CI) | ‐2.27 [‐3.13, ‐1.41] |
| 4.2 Dextromethorphan | 2 | 74 | Mean Difference (Random, 95% CI) | ‐1.75 [‐2.46, ‐1.04] |
| 4.3 Diphenhydramine | 1 | 40 | Mean Difference (Random, 95% CI) | ‐1.64 [‐2.58, ‐0.70] |
| 4.4 No treatment | 2 | 79 | Mean Difference (Random, 95% CI) | ‐1.28 [‐1.81, ‐0.76] |
| 4.5 Placebo | 1 | 75 | Mean Difference (Random, 95% CI) | ‐1.21 [‐2.46, 0.04] |
| 5 Parents' sleep (cough impact on parents' sleep score) Show forest plot | 3 | Mean Difference (Fixed, 95% CI) | Subtotals only | |
| 5.1 Honey | 3 | 300 | Mean Difference (Fixed, 95% CI) | ‐2.30 [‐3.18, ‐1.43] |
| 5.2 Dextromethorphan | 2 | 74 | Mean Difference (Fixed, 95% CI) | ‐1.97 [‐2.77, ‐1.17] |
| 5.3 Diphenhydramine | 1 | 40 | Mean Difference (Fixed, 95% CI) | ‐1.89 [‐2.97, ‐0.81] |
| 5.4 No treatment | 2 | 79 | Mean Difference (Fixed, 95% CI) | ‐1.46 [‐2.06, ‐0.87] |
| 5.5 Placebo | 1 | 75 | Mean Difference (Fixed, 95% CI) | ‐1.28 [‐2.64, 0.08] |
| 6 Combined improvement Show forest plot | 2 | Mean Difference (Fixed, 95% CI) | Subtotals only | |
| 6.1 Honey | 2 | 260 | Mean Difference (Fixed, 95% CI) | ‐9.11 [‐11.31, ‐6.90] |
| 6.2 Dextromethorphan | 1 | 34 | Mean Difference (Fixed, 95% CI) | ‐8.39 [‐10.95, ‐5.84] |
| 6.3 No treatment | 1 | 39 | Mean Difference (Fixed, 95% CI) | ‐6.41 [‐8.82, ‐3.99] |
| 6.4 Placebo | 1 | 75 | Mean Difference (Fixed, 95% CI) | ‐5.82 [‐10.76, ‐0.88] |
| Outcome or subgroup title | No. of studies | No. of participants | Statistical method | Effect size |
| 1 Honey versus dextromethorphan Show forest plot | 2 | Mean Difference (Random, 95% CI) | Subtotals only | |
| 1.1 Frequency of cough (mean improvement) | 2 | 149 | Mean Difference (Random, 95% CI) | ‐0.07 [‐1.07, 0.94] |
| 1.2 Severity of cough (mean improvement) | 2 | 149 | Mean Difference (Random, 95% CI) | ‐0.13 [‐1.25, 0.99] |
| 1.3 Bothersome cough (mean improvement) | 1 | 69 | Mean Difference (Random, 95% CI) | 0.29 [‐0.56, 1.14] |
| 1.4 Children's sleep (cough impact on children's sleep score) | 2 | 149 | Mean Difference (Random, 95% CI) | 0.03 [‐1.12, 1.19] |
| 1.5 Parents' sleep (cough impact on parents' sleep score) | 2 | 149 | Mean Difference (Random, 95% CI) | ‐0.16 [‐0.84, 0.53] |
| 1.6 Combined mean improvement | 1 | 69 | Mean Difference (Random, 95% CI) | 2.32 [‐1.24, 5.88] |
| 2 Honey versus diphenhydramine Show forest plot | 1 | Mean Difference (Random, 95% CI) | Subtotals only | |
| 2.1 Frequency of cough (mean improvement) | 1 | 80 | Mean Difference (Random, 95% CI) | ‐0.57 [‐0.90, ‐0.24] |
| 2.2 Severity of cough (mean improvement) | 1 | 80 | Mean Difference (Random, 95% CI) | ‐0.6 [‐0.94, ‐0.26] |
| 2.3 Children's sleep (cough impact on children's sleep score) | 1 | 80 | Mean Difference (Random, 95% CI) | ‐0.55 [‐0.87, ‐0.23] |
| 2.4 Parents' sleep (cough impact on parents' sleep score) | 1 | 80 | Mean Difference (Random, 95% CI) | ‐0.48 [‐0.76, ‐0.20] |
| 3 Honey versus 'no treatment' Show forest plot | 2 | Mean Difference (Random, 95% CI) | Subtotals only | |
| 3.1 Frequency of cough (mean improvement score) | 2 | 154 | Mean Difference (Random, 95% CI) | ‐1.05 [‐1.48, ‐0.62] |
| 3.2 Severity of cough (mean improvement) | 2 | 154 | Mean Difference (Random, 95% CI) | ‐1.03 [‐1.59, ‐0.47] |
| 3.3 Bothersome cough (mean improvement) | 1 | 74 | Mean Difference (Random, 95% CI) | ‐0.93 [‐1.98, 0.12] |
| 3.4 Children's sleep (cough impact on children's sleep score) | 2 | 154 | Mean Difference (Random, 95% CI) | ‐1.04 [‐1.57, ‐0.51] |
| 3.5 Parents' sleep (cough impact on parents' sleep score) | 2 | 154 | Mean Difference (Random, 95% CI) | ‐0.88 [‐1.23, ‐0.52] |
| 3.6 Combined mean improvement | 1 | 74 | Mean Difference (Random, 95% CI) | ‐4.31 [‐6.77, ‐1.85] |
| 4 Honey versus placebo (silan dates extract) Show forest plot | 1 | Mean Difference (Random, 95% CI) | Subtotals only | |
| 4.1 Frequency of cough (mean improvement score) | 1 | 300 | Mean Difference (Random, 95% CI) | ‐1.85 [‐3.36, ‐0.33] |
| 4.2 Severity of cough (mean improvement) | 1 | 300 | Mean Difference (Random, 95% CI) | ‐1.83 [‐3.32, ‐0.34] |
| 4.3 Bothersome cough (mean improvement) reduction | 1 | 300 | Mean Difference (Random, 95% CI) | ‐2.08 [‐3.97, ‐0.19] |
| 4.4 Children's sleep (cough impact on children's sleep score) | 1 | 300 | Mean Difference (Random, 95% CI) | ‐1.94 [‐3.93, 0.06] |
| 4.5 Parents' sleep (cough impact on parents' sleep score) | 1 | 300 | Mean Difference (Random, 95% CI) | ‐2.05 [‐4.24, 0.13] |
| Outcome or subgroup title | No. of studies | No. of participants | Statistical method | Effect size |
| 1 Nervousness, insomnia, hyperactivity Show forest plot | 2 | 149 | Risk Ratio (M‐H, Fixed, 95% CI) | 2.94 [0.74, 11.71] |
| 2 Stomach ache, nausea and vomiting Show forest plot | 2 | 149 | Risk Ratio (M‐H, Fixed, 95% CI) | 4.86 [0.24, 97.69] |
| 3 Drowsiness Show forest plot | 2 | 149 | Risk Ratio (M‐H, Fixed, 95% CI) | 2.92 [0.12, 69.20] |
| 4 Somnolence Show forest plot | 1 | 80 | Risk Ratio (M‐H, Fixed, 95% CI) | 0.14 [0.01, 2.68] |
| 5 Stomach ache, nausea and vomiting Show forest plot | 1 | 300 | Risk Ratio (M‐H, Fixed, 95% CI) | 1.33 [0.15, 11.74] |
| 5.1 Honey | 1 | 300 | Risk Ratio (M‐H, Fixed, 95% CI) | 1.33 [0.15, 11.74] |