Administración de suplementos de antioxidantes para la neumopatía en la fibrosis quística
Resumen
Antecedentes
La infección de las vías respiratorias da lugar a un daño pulmonar progresivo en los pacientes con fibrosis quística (FQ), y el estrés oxidativo ha sido implicado en la etiología. Por lo tanto, la administración de suplementos de micronutrientes antioxidantes (vitamina E, vitamina C, betacaroteno y selenio) o N‐acetilcisteína (NAC) como fuente de glutatión podría ayudar potencialmente a mantener un equilibrio oxidante‐antioxidante. El glutatión o la NAC también pueden ser inhalados y si se administran de esta manera también pueden tener un efecto mucolítico además del efecto antioxidante. La bibliografía actual sugiere una relación entre el estado oxidativo y la función pulmonar. Ésta es una actualización de una revisión publicada anteriormente.
Objetivos
Sintetizar el conocimiento existente sobre el efecto de los antioxidantes como la vitamina C, la vitamina E, el betacaroteno, el selenio y el glutatión (o la NAC como precursor del glutatión) en la función pulmonar a través de los marcadores del estrés inflamatorio y oxidativo en pacientes con FQ.
Métodos de búsqueda
Se hicieron búsquedas en el registro de ensayos del Grupo Cochrane de Fibrosis Quística y Enfermedades Genéticas (Cochrane Cystic Fibrosis and Genetic Disorders Group's Cystic Fibrosis) y en PubMed, utilizando estrategias de búsqueda detalladas. Se estableció contacto con los autores de los estudios incluidos y se verificaron las listas de referencias de estos estudios en busca de estudios adicionales potencialmente relevantes. También se hicieron búsquedas en registros de ensayos en línea.
Última búsqueda en el registro de ensayos de fibrosis quística: 08 enero 2019.
Criterios de selección
Estudios controlados aleatorios y cuasialeatorios que compararan los antioxidantes mencionados anteriormente (de forma individual o en combinación) en más de una administración única con placebo o atención estándar en pacientes con FQ.
Obtención y análisis de los datos
Dos autores, de forma independiente, seleccionaron los estudios, extrajeron los datos y evaluaron el riesgo de sesgo de los estudios incluidos. Se estableció contacto con los investigadores de los estudios para obtener la información faltante. Cuando se realizaron metanálisis, los estudios se subagruparon según el método de administración y la duración de la administración de suplementos. La calidad de la evidencia se evaluó con los criterios GRADE.
Resultados principales
Se incluyó un estudio controlado cuasialeatorio y 19 estudios controlados aleatorios (924 niños y adultos); 16 estudios (n = 639) analizaron la administración de suplementos antioxidantes orales y cuatro analizaron suplementos inhalados (n = 285). Solo uno de los 20 estudios incluidos se consideró libre de sesgo.
Suplementos orales versus control
El cambio desde el inicio en el volumen espiratorio forzado en un segundo (VEF1) % teórico a los tres y seis meses solo se informó para la comparación de la NAC con el control. Cuatro estudios (125 participantes) informaron datos a los tres meses; no se conoce si la NAC mejoró el VEF1 % teórico, debido a que la calidad de la evidencia fue muy baja, diferencia de medias [DM] 2,83% (intervalo de confianza [IC] del 95%: ‐2,16 a 7,83). Sin embargo, a los seis meses, dos estudios (109 participantes) mostraron que la NAC probablemente aumentó el VEF1 % teórico desde el inicio (evidencia de calidad moderada), DM 4,38% (IC del 95%: 0,89 a 7,87). Un estudio de un suplemento combinado de vitaminas y selenio (46 participantes) informó un mayor cambio con respecto al valor inicial en el VEF1 % teórico en el grupo de control a los dos meses, DM ‐4,30% (IC del 95%: ‐5,64 a ‐2,96). Un estudio (61 participantes) encontró que la NAC probablemente logra poca o ninguna diferencia en el cambio desde el inicio en la calidad de vida (CdV) a los seis meses (evidencia de calidad moderada), diferencia de medias estandarizada (DME) ‐0,03 (IC del 95%: ‐0,53 a 0,47), aunque el estudio de dos meses de la combinación de vitamina y selenio informó una diferencia pequeña en la CdV a favor del grupo de control, DME ‐0,66 (IC del 95%: ‐1,26 a ‐0,07). El estudio de la NAC informó del cambio desde el inicio en el índice de masa corporal (IMC) (62 participantes) y, de igual manera, encontró que la NAC probablemente no logró ninguna diferencia entre los grupos (evidencia de calidad moderada). Un estudio (69 participantes) encontró que un suplemento combinado de vitaminas y minerales puede dar lugar a un riesgo ligeramente menor de exacerbaciones pulmonares a los seis meses que un suplemento multivitamínico (evidencia de calidad baja). Nueve estudios (366 participantes) proporcionaron información sobre los eventos adversos, aunque no encontraron evidencia clara y consistente de diferencias entre los grupos de tratamiento o de control; la calidad de la evidencia varió de baja a moderada. Los estudios del β‐caroteno y la vitamina E informaron de manera consistente niveles plasmáticos mayores de los respectivos antioxidantes.
Suplementos inhalados versus control
Dos estudios (258 participantes) mostraron que el glutatión inhalado probablemente mejora el VEF1 % teórico a los tres meses, DM 3,50% (IC del 95%: 1,38 a 5,62), pero no a los seis meses en comparación con placebo, DM 2,30% (IC del 95%: ‐0,12 a 4,71) (evidencia de calidad moderada). Los mismos estudios informaron además una mejoría en el VEF1 L en el grupo tratado en comparación con placebo tanto a los tres como a los seis meses. Un estudio (153 participantes) informó que el glutatión inhalado probablemente logró poca o ninguna diferencia en el cambio en la CdV desde el inicio, DM 0,80 (IC del 95%: ‐1,63 a 3,23) (evidencia de calidad moderada). Ningún estudio informó del cambio desde el inicio en el IMC a los seis meses, aunque un estudio (16 participantes) lo informó a los dos meses y un estudio adicional (105 participantes) a los 12 meses; ningún estudio encontró diferencias en ningún punto temporal. Un estudio (153 participantes) no informó diferencias en el tiempo hasta la primera exacerbación pulmonar a los seis meses. Dos estudios (223 participantes) informaron que el tratamiento puede lograr poca o ninguna diferencia en los eventos adversos (evidencia de calidad baja), un estudio adicional (153 participantes) informó que el número de eventos adversos graves fue similar entre los grupos.
Conclusiones de los autores
Con respecto a los micronutrientes, no parece haber un efecto positivo del tratamiento con micronutrientes antioxidantes en las variables de evaluación clínicas; sin embargo, la administración de suplementos orales con glutatión mostró algún beneficio para la función pulmonar y el estado nutricional. Sobre la base de la evidencia disponible, el glutatión inhalado y oral parece mejorar la función pulmonar, mientras que la administración oral disminuye el estrés oxidativo; sin embargo, debido al tratamiento con antibióticos muy intensivo y a otros tratamientos concurrentes que reciben los pacientes con FQ, el efecto beneficioso de los antioxidantes sigue siendo difícil de evaluar en pacientes con infección crónica sin una muestra de población muy grande y un período de estudio a largo plazo. Se necesitan estudios adicionales, en especial en niños muy pequeños, que utilicen medidas de resultado como el índice de depuración pulmonar y las puntuaciones de la bronquiectasia derivadas de las exploraciones torácicas, con un mejor enfoque en las variables de diseño del estudio (como los niveles de la dosis y el momento adecuado) y que diluciden las vías biológicas claras por las que el estrés oxidativo está implicado en la fibrosis quística, antes de establecer una conclusión sólida con respecto a los efectos de la administración de suplementos de antioxidantes. El beneficio de los antioxidantes en los pacientes con FQ que reciben tratamientos moduladores con RTFQ también debe evaluarse en el futuro.
PICO
Resumen en términos sencillos
¿Cómo afectan las vitaminas E y C, los betacarotenos, el selenio y el glutatión la enfermedad pulmonar en personas con fibrosis quística?
Antecedentes
Las infecciones de las vías respiratorias frecuentes causan inflamación pulmonar a largo plazo; las células que causan inflamación producen una molécula de oxígeno (especies de oxígeno reactiva [EOR]), que puede dañar el tejido corporal (daño oxidativo); el cuerpo utiliza antioxidantes para protegerse. Los pacientes con fibrosis quística (FQ) tienen niveles altos de EOR en comparación con niveles bajos de antioxidantes. Los suplementos de antioxidantes podrían reducir el daño oxidativo y aumentar los niveles de antioxidantes.
Debido a las dificultades para absorber grasa, los pacientes con FQ tienen niveles bajos de antioxidantes liposolubles (vitamina E y betacaroteno). La vitamina C soluble en agua disminuye con la edad en los pacientes con FQ. El glutatión, uno de los antioxidantes más abundantes en las células, no se libera de forma adecuada en los pulmones de los pacientes con FQ. Algunas enzimas que ayudan a que los antioxidantes funcionen dependen del mineral selenio, por lo que los suplementos de selenio tienen como objetivo estimular la acción antioxidante.
La mayoría de los suplementos son ingeridos, pero el glutatión y la N‐acetilcisteína (NAC) (que el cuerpo utiliza para producir glutatión) también pueden ser inhalados, lo cual puede afectar la función pulmonar como antioxidantes, pero también debido al adelgazamiento de la mucosidad cuando se inhalan (lo que facilita la eliminación de la mucosidad).
Fecha de la búsqueda
Última búsqueda para esta revisión actualizada: 08 enero 2019.
Características de los estudios
Se incluyeron 20 estudios (924 pacientes con FQ, casi la misma división de género, de seis meses a 59 años de edad); 16 estudios compararon suplementos orales con placebo (tratamiento simulado) y cuatro compararon suplementos inhalados con placebo.
Resultados clave
Suplementos orales
No se conoce si la NAC cambia la función pulmonar (volumen espiratorio forzado en un segundo [VEF1] % teórico) a los tres meses (cuatro estudios, 125 participantes, evidencia de calidad muy baja), aunque a los seis meses dos estudios (109 participantes) informaron que la NAC probablemente mejoró el VEF1 % teórico (evidencia de calidad moderada). Un estudio (46 participantes) informó un cambio mayor en el VEF1 % teórico con placebo que con un suplemento combinado de vitaminas y selenio después de dos meses. Un estudio (61 participantes) informó poca o ninguna diferencia en las puntuaciones de la calidad de vida (CdV) entre la NAC y el control después de seis meses (evidencia de calidad moderada), aunque el estudio de dos meses de la combinación de vitamina y selenio informó puntuaciones de la CdV ligeramente mejores en el grupo de control. La NAC probablemente no logró ninguna diferencia en el índice de masa corporal (IMC) (un estudio, 62 participantes, evidencia de calidad moderada). Un estudio (69 participantes) informó que un suplemento combinado de vitaminas y minerales puede dar lugar a un menor riesgo de exacerbaciones pulmonares a los seis meses que un suplemento multivitamínico (evidencia de calidad baja). Nueve estudios (366 participantes) no encontraron diferencias claras y consistentes en los efectos secundarios entre los grupos (la evidencia varió de calidad baja a moderada). Los estudios de la vitamina E y el β‐caroteno informaron consistentemente de niveles mayores de estos antioxidantes en las muestras de sangre.
Suplementos inhalados
En dos estudios (258 participantes), el glutatión inhalado probablemente mejoró el VEF1 % teórico en comparación con el placebo a los tres meses pero no a los seis meses (evidencia de calidad moderada); estos estudios también informaron una mejoría mayor en los litros de VEF1 con glutatión en comparación con placebo en ambos puntos temporales. Dos estudios (258 participantes) encontraron poca o ninguna diferencia en el cambio en las puntuaciones de la CdV (evidencia de calidad moderada). Un estudio de dos meses (16 participantes) y un estudio de 12 meses (105 participantes) no informaron diferencias entre los grupos en el cambio en el IMC. No hubo diferencias en el tiempo hasta la primera exacerbación pulmonar en un estudio de seis meses. Dos estudios (223 participantes) no informaron diferencias entre los grupos en cuanto a los efectos secundarios (evidencia de calidad baja) y otro estudio (153 participantes) informó que el número de efectos secundarios graves fue similar entre los grupos.
Conclusiones
Los suplementos vitamínicos y minerales no parecen mejorar los resultados clínicos. El glutatión inhalado parece mejorar la función pulmonar, mientras que la administración oral disminuye el estrés oxidativo, con beneficios para la función pulmonar y las medidas nutricionales. La administración de antibióticos intensivos y otros tratamientos concurrentes para los pacientes con FQ e infección crónica da lugar a que sea difícil evaluar el efecto de los antioxidantes sin un estudio muy grande y prolongado. La investigación futura debe considerar cómo los antioxidantes afectan a los pacientes con FQ que reciben tratamientos moduladores con RTFQ.
Calidad de la evidencia
La calidad de la evidencia varió de muy baja a moderada. Todos los estudios excepto uno tuvieron algún sesgo, principalmente debido a que los datos no se informaron de forma completa (lo cual probablemente afecte los resultados). Tampoco hubo seguridad en cuanto a si los participantes sabían qué tratamiento recibían, tanto por adelantado como una vez iniciados los estudios (no se conoce de qué forma este hecho podría afectar los resultados).
Authors' conclusions
Summary of findings
| Oral antioxidants (NAC/GSH) compared to placebo for cystic fibrosis | ||||||
| Patient or population: adults and children with cystic fibrosis Settings: outpatients Intervention: oral antioxidants NAC/GSH Comparison: placebo | ||||||
| Outcomes | Illustrative comparative risks* (95% CI) | Relative effect | No of participants | Quality of the evidence | Comments | |
| Assumed risk | Corresponding risk | |||||
| Placebo | NAC/GSH | |||||
| Lung function: FEV1 % predicted mean change from baseline Follow‐up: 3 months | The mean change in FEV1 % predicted ranged across control groups from ‐8.6% to ‐1.64%. | The mean change in FEV1 % predicted in the intervention groups was 2.83% higher (2.16% lower to 7.83% higher). | NA | 125 | ⊕⊝⊝⊝ | The studies included in this analysis looked at different dosages of NAC. In 2 studies (n = 67), 600 mg/daily was divided in 3 doses (Ratjen 1985; Stafanger 1989), while in the remaining studies the doses were 2700 mg daily (n = 70) (Conrad 2015) and 2800 mg daily (n = 21) (Dauletbaev 2009) divided in 3 and 4 doses, respectively. |
| Lung function: FEV1 % predicted mean change from baseline Follow‐up: 6 months | Change in FEV1 was significantly higher in the intervention group compared to the control group, MD 4.38 (95% CI 0.89 to 7.87). | NA | 62 | ⊕⊕⊕⊝ | Results from the only included study favour NAC (2700 mg daily). A further study (n = 47) reported FEV1 % predicted at 6 months of GSH (administered as L‐glutathione), MD 17.40% (95% CI 13.97 to 20.83) (Visca 2015), but the studies were not combined due to the different action of the intervention. Both studies reported in favour of the antioxidant treatment. | |
| Quality of life: change in mean CFQ‐R score from baseline Follow‐up: 6 months | There was no significant difference in the change from from baseline in either group for CFQ‐R score at 6 months, MD ‐0.03 (95% CI ‐0.53 to 0.47). | NA | 61 | ⊕⊕⊕⊝ | Both groups showed a non‐significant decrease in CFQ‐R score (quality of life worsened) (P = 0.91). | |
| Nutritional status: change from baseline in BMI Follow‐up: 6 months | There was no significant difference from baseline in either group for BMI score at 6 months, MD 0.20 (95% CI ‐0.23 to 0.63). | NA | 62 | ⊕⊕⊕⊝ | There was no difference in the change in BMI between the intervention and control group. A further study (n = 47) reported on the change in BMI percentile after 6 months of oral supplementation with GSH (Visca 2015); BMI percentile increased significantly more with GSH supplementation than control, MD 17.20% (95% CI 14.35 to 20.05). | |
| Pulmonary exacerbations: mean time to next exacerbation Follow‐up: 6 months | Outcome not reported. | Although time to exacerbation was not reported, the Conrad study (n = 70) reported no difference in the number of participants with pulmonary exacerbations requiring antibiotics between NAC and control at 6 months, RR 0.83 (95% CI 0.50 to 1.390) and also reported no difference in the number of participants hospitalised, RR 0.94 (95% CI 0.49 to 1.81) (Conrad 2015). | ||||
| Adverse events Follow‐up: 6 months | Reported adverse effects were more common in the intervention group for: sinusitis, OR 2.92 (95% CI 0.11 to 74.05); diarrhoea, OR 1.29 (95% CI 0.27 to 6.25); and elevated liver enzymes, OR 2.92 (95% CI 0.11 to 74.05); but were more common in the control group for distal intestinal obstruction syndrome, OR 0.31 (95% CI 0.01 to 7.77). | 70 (1) | ⊕⊕⊕⊝ | Two further studies (n = 41) reported no adverse events in either control or intervention group (Götz 1980; Mitchell 1982). One study (n = 21) reported an adverse effect (gastrointestinal bleeding) which was considered to have a "possible" relationship to the medication (Dauletbaev 2009). | ||
| *The basis for the assumed risk (e.g. the median control group risk across studies) is provided in footnotes. The corresponding risk (and its 95% confidence interval) is based on the assumed risk in the comparison group and the relative effect of the intervention (and its 95% CI). | ||||||
| GRADE Working Group grades of evidence | ||||||
| 1. Downgraded once due to risk of bias across the included studies for this outcome; 1 study had a low risk of bias overall, but the remaining 3 had an unclear or high risk of bias across some of the domains particularly around allocation concealment and blinding. 2. Downgraded once due to inconsistency of results. There was heterogeneity with an I² value of 49% across the studies; this may be due to the different doses of NAC given and the quality of the underlying studies. 3. Downgraded once due to imprecision from small participant numbers. | ||||||
| Oral antioxidant vitamin E supplement compared with placebo or no treatment for cystic fibrosis | ||||||
| Patient or population: children and adults with cystic fibrosis Settings: outpatients Intervention: oral antioxidant vitamin E supplement Comparison: placebo or no treatment | ||||||
| Outcomes | Illustrative comparative risks* (95% CI) | Relative effect | No of participants | Quality of the evidence | Comments | |
| Assumed risk | Corresponding risk | |||||
| Placebo/no treatment | Vitamin E supplement | |||||
| Lung function: FEV1 % predicted mean change from baseline Follow‐up: 3 months | Outcome not reported. | |||||
| Lung function: FEV1 % predicted mean change from baseline Follow‐up: 6 months | Outcome not reported. | |||||
| Quality of life Follow‐up: 6 months | Outcome not reported. | |||||
| Nutritional status: change from baseline in BMI Follow‐up: 6 months | Outcome not reported. | |||||
| Pulmonary exacerbations: mean time to next exacerbation Follow‐up: 6 months | Outcome not reported. | |||||
| Adverse events Follow‐up: 3 months | No difference was found in the number of adverse events due to: sinusitis, OR 1.00 (95% CI 0.13 to 7.94); or exacerbations OR 1.00 (95% CI 0.06 to 17.25). Reported adverse effects were more common in the intervention group for: distal intestinal obstruction syndrome, OR 3.16 ( 95% CI 0.12 to 82.64); diarrhoea, OR 3.16 (95% CI 0.12 to 82.64); and elevated liver enzymes, OR 3.16 (95% CI 0.12 to 82.64). | 38 | ⊕⊕⊝⊝ | |||
| *The basis for the assumed risk (e.g. the median control group risk across studies) is provided in footnotes. The corresponding risk (and its 95% confidence interval) is based on the assumed risk in the comparison group and the relative effect of the intervention (and its 95% CI). | ||||||
| GRADE Working Group grades of evidence | ||||||
| 1. Downgraded once due to risk of bias within the included study across the domains of randomisation, allocation concealment, incomplete outcome reporting and selective reporting. 2. Downgraded due to low numbers of participants and small number of participants. | ||||||
| Oral antioxidant β‐carotene compared to placebo for cystic fibrosis | ||||||
| Patient or population: children and adults with cystic fibrosis Settings: outpatients Intervention: oral antioxidant β‐carotene Comparison: placebo | ||||||
| Outcomes | Illustrative comparative risks* (95% CI) | Relative effect | No of participants | Quality of the evidence | Comments | |
| Assumed risk | Corresponding risk | |||||
| Placebo | β‐carotene | |||||
| Lung function: FEV1 % predicted mean change from baseline Follow‐up: 3 months | Outcome not reported. | |||||
| Lung function: FEV1 % predicted mean change from baseline Follow‐up: 6 months | There was no significant difference from baseline in either group for FEV1 % predicted at 6 months, MD 0.90 (‐20.09 to 21.89). | NA | 24 (1) | ⊕⊝⊝⊝ | P = 0.93 | |
| Quality of life Follow‐up: 6 months | Outcome not reported. | |||||
| Nutritional status: change from baseline in BMI Follow‐up: 6 months | Outcome not reported. | |||||
| Pulmonary exacerbations: mean time to next exacerbation Follow‐up: 6 months | Outcome not reported. | |||||
| Adverse events Follow‐up: 6 months | The study reported no adverse events in either group. | NA | 24 | ⊕⊝⊝⊝ | ||
| *The basis for the assumed risk (e.g. the median control group risk across studies) is provided in footnotes. The corresponding risk (and its 95% confidence interval) is based on the assumed risk in the comparison group and the relative effect of the intervention (and its 95% CI). | ||||||
| GRADE Working Group grades of evidence | ||||||
| 1. Downgraded once due to unclear or high risk of bias across most domains, particularly randomisation, allocation concealment and publication bias. 2. Downgraded once due to imprecision from a small sample size. 3. Downgraded once because of a high risk of publication bias with the study being published multiple times without reference to other publications. | ||||||
| Oral antioxidant combination compared with control for cystic fibrosis | ||||||
| Patient or population: children with cystic fibrosis Settings: outpatients Intervention: oral antioxidant combination (vitamins E, C, A, β‐carotene and selenium) Comparison: control (continuation of a low‐dose supplement) | ||||||
| Outcomes | Illustrative comparative risks* (95% CI) | Relative effect | No of participants | Quality of the evidence | Comments | |
| Assumed risk | Corresponding risk | |||||
| Control (continuation of low dose supplement) | Combination of oral antioxidants | |||||
| Lung function: FEV1 % predicted mean change from baseline Follow‐up: 3 months | Outcome not reported at this time point. | After 2 months of a combined supplement, a single study reported a significant difference in favour of control, MD ‐4.30% (95% CI ‐5.64 to ‐2.96). | ||||
| Lung function: FEV1 % predicted mean change from baseline Follow‐up: 6 months | Outcome not reported. | |||||
| Quality of life: Quality of Well Being score change from baseline Follow‐up: six months | Outcome not reported at this time point. | Results significantly favoured control over antioxidant supplementation at 2 months, SMD ‐0.66 points (95% CI ‐1.26 to ‐0.07). A higher score indicates better quality of life. | ||||
| Nutritional status: change from baseline in BMI Follow‐up: 6 months | Outcome not reported. | |||||
| Pulmonary exacerbations: mean time to next exacerbation Follow‐up: 6 months | Outcome not reported. | |||||
| Adverse events Follow‐up: 6 months | Outcome not reported. | |||||
| *The basis for the assumed risk (e.g. the median control group risk across studies) is provided in footnotes. The corresponding risk (and its 95% confidence interval) is based on the assumed risk in the comparison group and the relative effect of the intervention (and its 95% CI). | ||||||
| GRADE Working Group grades of evidence | ||||||
| Oral antioxidant mixed supplement compared with control for cystic fibrosis | ||||||
| Patient or population: adults and children with cystic fibrosis Settings: outpatients Intervention: AquADEKs‐2 containing standard amounts of fat‐soluble vitamins (A, D, E, K) as in typical CF multivitamin supplements plus several antioxidants including β‐carotene, mixed tocopherols (different forms of vitamin E), CoQ10, mixed carotenoids (lutein, lycopene and zeaxanthin), and the minerals zinc and selenium Comparison: control multivitamin softgel capsules | ||||||
| Outcomes | Illustrative comparative risks* (95% CI) | Relative effect | No of participants | Quality of the evidence | Comments | |
| Assumed risk | Corresponding risk | |||||
| Control capsules | Mixed supplement | |||||
| Lung function: FEV1 % predicted mean change from baseline Follow‐up: 3 months | Outcome not reported at this time point. | At 4 months the MD between the groups was 1.44 higher (95% CI ‐2.23 to 5.11) favouring the mixed supplement. The effect was not significant P = 0.44. | ||||
| Lung function: FEV1 % predicted mean change from baseline Follow‐up: 6 months | Outcome not reported. | |||||
| Quality of life: Quality of Well Being score change from baseline Follow‐up: 6 months | Outcome not reported. | |||||
| Nutritional status: change from baseline in BMI Follow up: 6 months | Outcome not reported at this time point. | The study did however report that at 4 months there was no difference in weight z scores between the intervention and control group (Sagel 2018). | ||||
| Pulmonary exacerbations: mean time to next exacerbation Follow‐up: 6 months | There was a significantly lower risk of first pulmonary exacerbation in the antioxidant group than the control group at 4 months, HR 0.5 (95% CI 0.25 to 0.98) (P = 0.04). | NA | 69 | ⊕⊕⊝⊝ | This result was reported directly from the paper. | |
| Adverse events Follow‐up: 6 months | No significant differences were found in the number of adverse events due to: sinusitis, OR 2.12 (95% CI 0.18 to 24.44); DIOS, OR 0.24 (95% CI 0.03 to 2.22); diarrhoea, OR 2.19 (95% CI 0.37 to 12.76); or pulmonary exacerbations, OR 0.54 (95% CI 0.21 to 1.39). | NA | 69 | ⊕⊕⊝⊝ | Although not statistically significant, adverse events were more common in the intervention group for sinusitis and diarrhoea whilst they were more common in the control group for DIOS and pulmonary exacerbations. | |
| *The basis for the assumed risk (e.g. the median control group risk across studies) is provided in footnotes. The corresponding risk (and its 95% confidence interval) is based on the assumed risk in the comparison group and the relative effect of the intervention (and its 95% CI). | ||||||
| GRADE Working Group grades of evidence | ||||||
| 1. Downgraded once due to risk of bias within the single study. There were concerns about allocation concealment and also because the enrolment number was not reached. 2. Downgraded once due to imprecision from low event rates. | ||||||
| Inhaled antioxidants compared with placebo for cystic fibrosis | ||||||
| Patient or population: children and adults with cystic fibrosis Settings: outpatients Intervention: nebulised GSH Comparison: placebo | ||||||
| Outcomes | Illustrative comparative risks* (95% CI) | Relative effect | No of participants | Quality of the evidence | Comments | |
| Assumed risk | Corresponding risk | |||||
| Placebo | Nebulised GSH | |||||
| Lung function: FEV1 % predicted mean change from baseline Follow‐up: 3 months | The mean change in FEV1 % predicted ranged across control groups from | The mean change in FEV1 % predicted in the intervention groups was 3.5% higher | NA | 258 | ⊕⊕⊕⊝ | Data significantly favoured the antioxidant group (P = 0.001). This effect remained when the pediatric data were removed from the analysis. |
| Lung function: FEV1 % predicted mean change from baseline Follow‐up: 6 months | The mean change in FEV1 % predicted ranged across control groups from | The mean FEV1 % predicted in the intervention groups was 2.3% higher (0.12% lower to 4.71% higher). | NA | 258 | ⊕⊕⊕⊝ | These results include adult and pediatric data. The adult‐only data were also analysed, but there was no significant difference between groups, MD 2.17% (95% CI ‐1.07 to 5.41). |
| Quality of life: change in CFQoL score from baseline Follow‐up: 6 months | There was no difference between groups MD 0.80 (95% CI ‐1.63 to 3.23) (P = 0.52). | NA | 153 | ⊕⊕⊕⊝ | 2 further studies found no significant difference between groups at 12 months (data taken from the papers) (Calabrese 2015a; Calabrese 2015b). | |
| Nutritional status: change from baseline in BMI Follow‐up: 6 months | Outcome not reported at this time point. See comment. | No statistically significant difference was found between groups with regard to BMI either at 2 months, MD 0.10 (95% CI ‐0.74 to 0.94) or at 12 months, MD 0.04 (95% CI ‐8.20 to 8.27). | ||||
| Pulmonary exacerbations: mean time to next exacerbation Follow‐up: 6 months | Outcome not reported at this time point. See comment. | The time to first exacerbation was 163 days in the GSH treated group and 141 days in the control group. This difference was reported as not statistically significant by the authors using Wilcoxon rank sum test; not directly analysed in this review due to skewed data. | ||||
| Adverse events Follow‐up: 6 months | No significant differences were seen between groups for any adverse events. | NA | 223 (3) | ⊕⊕⊝⊝ | 1 study reported no serious adverse events (Bishop 2005). 2 studies reported that none of the reported adverse events led to discontinuation of the drug and that no death occurred (Calabrese 2015a; Calabrese 2015b). A further study reported that the number of serious adverse events were similar between the group treated with GSH inhalations and the placebo group (11% and 10%, respectively) (Griese 2013). | |
| *The basis for the assumed risk (e.g. the median control group risk across studies) is provided in footnotes. The corresponding risk (and its 95% confidence interval) is based on the assumed risk in the comparison group and the relative effect of the intervention (and its 95% CI). | ||||||
| GRADE Working Group grades of evidence | ||||||
| 1. Downgraded once due to risk of bias in the included studies, particularly through lack of blinding caused by the intervention having a distinctive taste and smell. 2. Downgraded once due to risk of bias within the single included study for this outcome. The study was at high risk of bias in the blinding domain as the intervention has a distinctive taste and smell. The participants were also allowed to continue oral N‐acetylcysteine (NAC) (a precursor of GSH). 3. Downgraded once due to imprecision caused by low event rates for many of the reported adverse events. | ||||||
Background
Description of the condition
Cystic fibrosis (CF) is the most prevalent inherited, life‐limiting disorder in white populations affecting approximately one in 2000 births. It is estimated that the present number of CF cases is 35,000 in Europe, 30,000 in the USA and 3000 in Canada (CCFF 2002; CFF 2005). Approximately 1000 new cases of CF are diagnosed in the USA each year. The median predicted lifespan for people with CF has risen steadily over the last 25 years. Since 2002, the median predicted survival age has increased by almost 10 years, from 31.3 years in 2002 to 41.7 years in 2015 (CFF 2015). Most people with CF are diagnosed before the age of two years. Today, in several countries, CF is typically diagnosed shortly after birth through newborn screening programs, e.g. since 2010, all newborns have been screened for CF in the USA. Early diagnosis may have played an important role in improving survival and research shows that people with CF who are diagnosed through the newborn screening programs have a higher weight and healthier lungs later in life than those diagnosed at a later time point because of CF symptoms (CFF 2015).
There are more than 1500 mutations in the cystic fibrosis transmembrane conductance regulator gene (CFTR) on chromosome 7, which lead to a malfunction of the chloride channel in people with CF. This malfunctioning of the chloride channel in people with CF leads to a decreased volume of the periciliary fluid in the lower respiratory tract, which in turn leads to impaired mucociliary clearance of inhaled microbes. The impaired mucociliary clearance was also proposed to be due to 'sticky', unfolded mucins caused by the lack of bicarbonate ion (HCO3‾) in the periciliary fluid, as a consequence of the defective CFTR (Quinton 2017). The impairment of the non‐inflammatory defence mechanism of the respiratory tract leads to early recruitment of inflammatory defence mechanisms such as polymorphonuclear leukocytes (PMN) and antibodies. However, in spite of an inflammatory response and intensive antibiotic therapy, infections caused by particularly Pseudomonas aeruginosa persist and lead to respiratory failure or death. This pathogen is able to survive by switching to the biofilm mode of growth, which provides tolerance to the inflammatory defence mechanisms and antibiotic treatment.
Therefore, from early childhood, people with CF have recurrent and chronic respiratory tract infections characterised by PMN inflammation. Counts of PMNs in CF airway fluid have been found to be thousands of times higher than normal. A consequence of the PMN‐dominated inflammation is the release of proteases and reactive oxygen species (ROS), which are believed to be the main modulators of tissue damage in CF. Besides the increased production of ROS, people with CF have an impaired absorption of dietary antioxidants in the gut and the inability of cells bearing mutant CFTR to efflux glutathione (GSH) ‐ the most abundant intracellular antioxidant ‐ into the extracellular milieu of the lung. It has also been shown that concentration of GSH is low in the airways of individuals with CF from an early age (Dickerhof 2017) and that increased oxidation of GSH by neutrophil‐derived hypochlorous acid contributes to this deficiency (Kettle 2014). As a primary water‐soluble antioxidant, GSH performs several important functions in the epithelial lining fluid by directly scavenging hydrogen peroxide and other free radicals (Kelly 1999). In this process, GSH is oxidized to glutathione disulfide (GSSG).
Furthermore, GSH also plays multiple, pivotal roles in the immune system as normal intracellular levels of GSH are essential for chemotaxis, phagocytosis, oxidative burst etc. In CF, reduced levels of total GSH (GSH and GSSG) and an increased GSSG to GSH redox ratio may partly explain the chronic and excessive inflammation in the respiratory system.
Thus, in CF, the source of oxidative stress is due to the imbalance between increased ROS production and impaired antioxidant systems. It is thought that ROS, which are the key players in oxidative stress, cause tissue damage in the lungs by attacking e.g. polyunsaturated fatty acids (PUFAs) in cell membranes. These PUFAs are one of the main components of dietary fats and are converted to arachidonic acid, a component of phospholipids in cell membranes. It is thought that ROS attack phospholipids (peroxidation) and produce a free radical, which in turn initiates attacks on adjacent arachidonic acid chains, thus compromising cell‐membrane structure. Free radical damage is propagated until host defence systems counteracts and terminates these actions. The peroxidation products of arachidonic acid are F2‐isoprostanes and these have become the gold‐standard indicator of oxidative stress in vivo (Mayne 2003). The mechanism of peroxide generation, propagation and termination is shown in the figures (Figure 1).
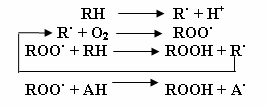
Peroxide chain reaction characterized by initiation, propagation and termination. (RH: PUFA; R·: free radical; ROO·: peroxide; ROOH: hydroxyl peroxide; AH: vitamin E; A·: oxidized Vitamin E. Adapted from: Tappel AL. Vitamin E and free radical peroxidation of lipids. Annals of the New York Academy of Sciences. 1972; 203(1):12‐28.
Description of the intervention
Unusually high levels of oxidative stress in CF (due to the chronic neutrophilic inflammation in the lungs of people with chronic infection) deplete the host‐defence system, which includes exogenous antioxidant micronutrients vitamin E, vitamin C, β‐carotene and selenium and the major cellular antioxidant, GSH. Supplementation of these micronutrients or of GSH or N‐acetylcysteine (NAC), alternatively referred to as free‐radical scavengers, may help in preventing the unfavourable shift towards redox imbalance observed in people with CF.
The ability of a substance to act as an antioxidant in a biologically relevant situation is a highly complex concept. In this respect, the location of ROS generation, the ROS species generated, the relative abundance of endogenous antioxidants in the locality, the rate constants of endogenous antioxidants for the ROS generated, together with their relative concentrations, will all be vital determinants of the success or failure of an administered antioxidant in helping to prevent cellular damage (Rushworth 2013).
Since the CFTR channel is the major mechanism of GSH efflux into the extracellular milieu of the lung from lung epithelial cells, this efflux is severely compromised in CF resulting in GSH system dysfunction. People with CF experience GSH deficiency both locally in the epithelial lining fluid of the lung and also as a systemic GSH deficiency in blood (Roum 1993). Besides this CFTR‐related mechanism, the GSH depletion in the CF lung is also caused by oxidation of GSH by myeloperoxidase‐derived hypochlorous acid liberated by the neutrophils infiltrating the lungs and it has been shown that this occurs very early in life, already in infancy in people with CF (Kettle 2014).
Pilot studies have shown that it is possible to replete alveolar GSH after GSH inhalation therapy and several clinical studies employing GSH, or a GSH precursor such as NAC, as an intervention have resulted in improved clinically‐relevant markers in CF (Tirouvanziam 2006). Therefore, both local treatment (inhalations) and systemic administration (oral) of GSH or the GSH precursor have been proposed to be beneficial for people with CF.
Although many other antioxidants exist, vitamin E, vitamin C, β‐carotene, selenium and glutathione or NAC have been chosen in this review due to their well‐defined antioxidant properties, mechanisms of action and long history of study in the body (Rock 1996). Other, more recently proposed antioxidants include, for example, other carotenoids (lycopene, zeaxanthin, lutein), melatonin and retinol (Pryor 2000). People with CF are largely affected by pancreatic insufficiency such that, despite replacement pancreatic enzyme therapy and high‐fat diets, the absorption of fat and fat‐soluble vitamins is usually sub‐optimal. Lowered plasma antioxidant status of vitamin C and decreased activity of erythrocyte glutathione peroxidase (GSHPx), an antioxidant enzyme dependent on the mineral selenium, have also been reported in people with CF (Benabdeslam 1999; Wood 2001). The effect of supplementation with vitamin E in CF has already been reviewed in a Cochrane Review (Okebukola 2017). As such, vitamins E and C, β‐carotene and selenium as well as glutathione comprise the antioxidant interventions that will be assessed in this review; as their mechanisms of action are sufficiently different, they are subgrouped accordingly.
How the intervention might work
Literature suggests that a relationship exists between oxidative stress status and lung function. Specifically, elevated levels of oxidative stress and inflammatory stress indicators with corresponding reduced lung function have previously been found in individuals with CF (Brown 1994; Brown 1996; Mayer‐Hamblett 2007; Wood 2001). Such indicators (oxidative and inflammatory markers) are often used as surrogate outcomes of lung function in respiratory research (Montuschi 1998; Repine 1997; Schunemann 1997). Lung function status or improvements, or both, are also routinely reported in the literature. Due to the chronic and progressive nature of CF, clinical benefits of antioxidant therapy may be difficult to determine.
It is suggested that oral administration of GSH is not optimal due to its poor bioavailability and rapid oxidation (Schmitt 2015). NAC is a thiol and mucolytic agent, a precursor of L‐cysteine and reduced GSH. A Cochrane Review looking at nebulised and oral thiol derivatives for pulmonary disease in cystic fibrosis was published in 2013 (Tam 2013). The pharmacokinetics and bioavailability of NAC is highly dependent of the administration route; NAC is rapidly absorbed following oral administration. After absorption, NAC is rapidly metabolised to cysteine, which is a direct precursor in the synthesis of intracellular GSH and in this way, it acts as an antioxidant by restoring the pool of intracellular reduced GSH (Rushworth 2013). This underlines that in order for oral NAC to confer antioxidant activity, the intracellular levels of GSH have to be depleted. There is no detectable NAC in bronchoalveolar lavage after oral administration, therefore it has no mucolytic effect. High‐dose oral NAC increases neutrophil GSH levels, decreases airway neutrophil recruitment and most likely act by reducing pulmonary oxidative stress and inflammation (Tam 2013).
Inhaled NAC acts directly on airway secretions and therefore has a mucolytic effect by reducing disulfide bonds (S‐S) between glycoproteins in mucus to sulfhydryl bonds (‐SH), which no longer participate in cross‐linking.
Thus, the potential effect of NAC after oral administration is due to its antioxidant effect, as recently shown in people with CF (Skov 2014), while the effect after inhalation may be multifactorial involving a mucolytic component. Recently, it has been proposed that the effect of GSH inhalations might depend on the sputum levels of gamma‐glutamyltransferase, an enzyme that degrades GSH and investigators suggest sputum gamma‐glutamyltransferase as a possible biomarker for individualized GSH inhalation treatment in people with CF (Corti 2017).
Why it is important to do this review
A synthesis of all available clinical studies on the effects of antioxidants on lung disease will indicate the relevance of antioxidants to health status in people with CF and will guide future therapeutic decisions. Currently, fat‐soluble vitamins (vitamins A, D, E and K) are routinely supplemented in CF to prevent deficiencies associated with fat malabsorption; however, the therapeutic use of antioxidants, such as vitamins C and E, β‐carotene, selenium and glutathione is limited. Vitamin A and beta‐carotene supplementation is the subject of a Cochrane Review, which aimed to establish whether supplementation reduced the frequency of vitamin A deficiency disorders, improved general and respiratory health or increased the frequency of vitamin A toxicity; the review identified a single study of beta‐carotene supplementation (de Vries 2018). Reviews of vitamin D, vitamin E and vitamin K supplementation have also been published (Ferguson 2014; Jagannath 2015; Okebukola 2017). The present review aims to establish whether antioxidant oral supplementation with micronutrients such as vitamins C and E, β‐carotene, selenium or with glutathione (and NAC as precursor to GSH) or inhalation supplementation with GSH are promising adjunct therapies in CF. This is an update of a previously published review (Ciofu 2014; Shamseer 2010).
Objectives
The objective of the review is to synthesise existing knowledge on the effect of antioxidants such as vitamin C, vitamin E, beta‐carotene, selenium and GSH (or N‐acetylcysteine as precursor of GSH) on lung function through inflammatory and oxidative stress markers in people with CF.
Methods
Criteria for considering studies for this review
Types of studies
Randomized controlled trials (RCTs) and quasi‐RCTs.
Types of participants
People of either gender diagnosed with CF and with all degrees of severity (Pellegrino 2005), including those who have undergone lung transplant.
Types of interventions
The interventions considered were antioxidants including vitamin E, vitamin C, β‐carotene, selenium and GSH or NAC (as a source of GSH) in more than a single administration, by any route of administration and solubility taken individually or in combination compared to placebo or standard medication or care.
Types of outcome measures
Primary outcomes
-
Lung function tests
-
forced expiratory volume in one second (FEV1) (% predicted or L)
-
forced vital capacity (FVC) (% predicted or L)
-
-
Quality of life (QoL) (using validated measurement tools only)
Secondary outcomes
-
Oxidative stress markers in serum, sputum or exhaled breath condensate
-
hydrogen peroxide (H2O2 exhalation)
-
lipid peroxidation (F2‐isoprostanes)
-
antioxidant enzyme function (post hoc change)
-
potency (post hoc change)
-
plasma antioxidant status
-
plasma fatty acids
-
-
Inflammation in serum or sputum
-
inflammatory markers (i.e. IL‐6, IL‐8, TNF‐α, IL‐1β)
-
hyperinflation of chest
-
-
Nutritional status (e.g. body mass index (BMI) or BMI percentile for children and weight or weight percentile)
-
Pulmonary exacerbations requiring intravenous antibiotic therapy or hospitalisation
-
Adverse events
Since measures of oxidative stress reported were not confined to those anticipated, a post hoc decision was made to include all reported markers of oxidative stress encountered. We categorized oxidative stress outcomes using the classification scheme defined by Dotan (Dotan 2004). Since multiple oxidative stress outcomes exist and within each outcome multiple measures have been identified to quantify the same outcome, oxidative stress was collected as follows.
-
Lipid peroxidation products (F2‐isoprostanes, malondialdehyde (MDA) or thiobarbutic acid reactive substances (TBARS, an unspecific measure of lipid peroxidation), organic hydroperoxides (H₂O₂))
-
Promoters (luminol)
-
Inhibitors (i.e. antioxidant micronutrients and enzymes)
-
Potency (i.e. trolox‐equivalent antioxidant capacity (TEAC))
-
Oxidizability (i.e. lag time, propagation)
We also decided to collect data for antioxidant enzymes as measured by erythrocyte glutathione peroxidase (GPX), which is a selenium‐dependent enzyme, and superoxide dismutase (SOD).
"Pulmonary exacerbations requiring intravenous antibiotic therapy or hospitalisation" was revised to "days of antibiotic therapy" after data extraction began and data were found to be presented in the latter manner rather than the former.
Search methods for identification of studies
We searched for all relevant published and unpublished studies without restrictions on language, year or publication status.
Electronic searches
Relevant studies were sought from the Cochrane Cystic Fibrosis and Genetic Disorders Group's CF Trials Register using the terms: antioxidants.
The Cystic Fibrosis Trials Register is compiled from electronic searches of the Cochrane Central Register of Controlled Trials (CENTRAL) (updated each new issue of the Cochrane Library), weekly searches of MEDLINE, a search of Embase to 1995 and the prospective handsearching of two journals ‐ Pediatric Pulmonology and the Journal of Cystic Fibrosis. Unpublished work is identified by searching through the abstract books of three major cystic fibrosis conferences: the International Cystic Fibrosis Conference; the European Cystic Fibrosis Conference and the North American Cystic Fibrosis Conference. For full details of all searching activities for the register, please see the relevant sections of the Cystic Fibrosis and Genetic Disorders Group website.
Date of the latest search of the CF Trials Register: 08 January 2019.
We also searched the following databases, trials registries and resources:
-
PubMed (1946 to 31 May 2016);
-
ISRCTN registry (www.isrctn.org, searched 16 July 2018);
-
US National Institutes of Health Ongoing Trials Register Clinicaltrials.gov (www.clinicaltrials.gov, searched 16 July 2018);
-
World Health Organization International Clinical Trials Registry Platform (WHO ICTRP) (apps.who.int/trialsearch, searched 16 July 2018).
See appendices for full search strategies (Appendix 1; Appendix 2).
The previous author team searched the following databases for earlier versions of this review. We were unable to search these for this update because of lack of access.
-
CINAHL Plus EBSCO (Cumulative Index to Nursing and Allied Health Literature; 1937 to December 2007);
-
AMED Ovid (Allied and Complementary Medicine; 1985 to December 2007).
See appendices for full search strategies for previous versions of this review (Appendix 3; Appendix 4).
Searching other resources
We reviewed the reference lists of all included articles and relevant systematic reviews to identify any additional studies. We also contacted investigators of included studies for possible references to previously unidentified RCTs.
Data collection and analysis
Selection of studies
The two authors (OC and JL) assessed studies independently for inclusion into the review. In the case of conflict of opinion between the two authors, they resolved this by discussions until they reached a common agreement. The first stage of screening included systematically screening electronic titles or abstracts (or both) of all studies according to the pre‐specified criteria. The authors then reviewed the full‐text hard copies, again applying selection criteria.
Data extraction and management
The two authors (OC and JL) extracted data independently for all outcomes of interest using pre‐developed extraction forms. In the case of conflict of opinion between the two authors, they resolved this by discussions until they reached a common agreement.
The authors presented different routes of administration as separate comparisons. If one study compared two arms of an antioxidant intervention to control, the authors combined the intervention arms using appropriate statistical methods (seeUnit of analysis issues).
The concentrations of vitamin E in two of the studies were expressed as mg/100 mL (Harries 1971; Levin 1961) and as µg/mL in two further studies (Visca 2015; Sagel 2018); in this review, the review authors have converted the data from these studies to μmol/L (standard units) by using a converter (http://unitslab.com/node/216).
One study reported separate data for a pediatric cohort and an adult cohort; in order to present these data separately we have generated two study IDs for one single study, one for the adult data (Calabrese 2015a) and one for the pediatric data (Calabrese 2015b).
The authors have reported data at two, three, four, five and six months. If they identify data from other time points for future updates of the review they will consider reporting these too.
Assessment of risk of bias in included studies
The two authors independently assessed the risk of bias of each study following the domain‐based evaluation as described in the Cochrane Handbook for Systematic Reviews of Interventions (Higgins 2011a). The tool for assessing risk of bias in each included study comprises a judgement and support for the judgement for each entry in a 'Risk of bias' table, where entry addresses a specific feature of the study. The judgement for each entry assesses the risk of bias as low, high or unclear risk, with the last category indicating either lack of information or uncertainty over the potential for bias. In the case of conflict of opinion between the two authors, they resolved this by discussions to lead to a common agreement.
They assessed the domains listed below.
-
Randomisation
-
Concealment of allocation
-
Blinding (of participants, personnel and outcome assessors)
-
Incomplete outcome data (whether investigators used an intention‐to‐treat analysis)
-
Selective outcome reporting
-
Other potential threats to validity
Measures of treatment effect
For binary outcomes (hyperinflation of the chest, number participants with pulmonary exacerbations and adverse events), the review authors planned to report relative risks (RR) and 95% confidence intervals (CIs). When possible, they reported the proportion of participants reporting adverse events for each treatment arm. As they expected adverse events to be rare, they analysed these outcomes using the Peto odds ratio (OR) statistic and 95% CIs.
The review authors recorded continuous outcomes (lung function, QoL, markers of oxidative stress, inflammatory markers and markers of nutritional status) as either mean relative changes from baseline or mean end‐point values and standard deviations (SD). Where studies reported standard errors (SE), the review authors converted these to SDs. They calculated the mean difference (MD) and 95% CI for most outcome measures except for outcomes of oxidative stress which combined multiple measures and for QoL in the comparison of oral antioxidants versus control (where studies used different questionnaires) for which they used standardized mean differences (SMDs) and 95% CI.
Unit of analysis issues
Cross‐over studies
If the review authors had been able to include cross‐over studies with sufficient data, they planned to analyse these by paired t‐test for continuous data, as long as there was no evidence of carry‐over or period effect (Elbourne 2002). Where papers reported cross‐over study data insufficiently, i.e. so that only first‐period data were available, the review authors treated data from the first period as a parallel study (Elbourne 2002).
Studies with multiple treatment arms
For studies reporting multiple intervention and placebo groups, the review authors combined all relevant intervention groups and placebo groups, each to be analysed as a single group as recommended in the Cochrane Handbook for Systematic Reviews of Interventions to avoid a unit of analysis error (Higgins 2011b).
Dealing with missing data
Review authors made up to two attempts to contact each of the investigators for each study from which information was missing. If the investigators did not respond, the review authors left out incomplete data.
The review authors received additional data from the investigators of six studies which they used in the analysis (Calabrese 2015a; Calabrese 2015b; Conrad 2015; Dauletbaev 2009; Griese 2013; Keljo 2000; Visca 2015).
Assessment of heterogeneity
Review authors planned to measure the inconsistency of study results using the Chi² test and the I² heterogeneity statistic to determine if variation in outcomes across studies was due study heterogeneity rather than chance (Higgins 2003). This Chi² test assesses whether observed differences in results are compatible with chance alone. A low P value (or a large Chi² statistic relative to its degree of freedom) provides evidence of heterogeneity of intervention effects (variation in effect estimates beyond chance). A P value of 0.10, rather than the conventional level of 0.05, is used to determine statistical significance.
The I² statistic, as defined by Higgins (Higgins 2011a), measures heterogeneity as a percentage where a value:
-
0% to 40%: might not be important;
-
30% to 60%: may represent moderate heterogeneity;
-
50% to 90%: may represent substantial heterogeneity;
-
75% to 100%: considerable heterogeneity.
The importance of the observed value of I² depends on (i) magnitude and direction of effects and (ii) strength of evidence for heterogeneity (e.g. P value from the Chi² test, or a confidence interval for I²).
Assessment of reporting biases
Using the method by Light, if the review authors had included a sufficient number of studies (at least 10, by convention) combined in a single meta‐analysis, they planned to assess publication bias using a funnel plot (Light 1994). A funnel plot is a graph that plots treatment effect for each study against a measure of precision (i.e. 1/standard error (SE)).
The review authors present information regarding selective reporting of outcomes within individual studies in the risk of bias assessment (Risk of bias in included studies).
Data synthesis
The main comparisons were between antioxidant supplementation and control (standard of care, other therapy, no treatment). The review authors have presented a forest plot for each outcome for which data are available. Where they have included more than one study for a single subgroup, they have pooled data into a single effect estimate. Since each antioxidant works by a different mechanism of action, they analysed each micronutrient or unique combination of micronutrients as a separate subgroup, as per the first originally planned subgroup analysis to explore methodological heterogeneity.
The review authors intended to use a fixed‐effect model for all analyses with a low degree of heterogeneity (I² less than 40%). They later decided to employ a random‐effects model for all analyses, since there were known differences (i.e. doses, duration and solubility of supplement) and unknown differences between studies that may potentially influence the size of the treatment effect.
The review authors analysed all studies using the Review Manager software (RevMan 2014).
Subgroup analysis and investigation of heterogeneity
Where the review authors included at least 10 studies per outcome (Deeks 2011), they planned the following a priori subgroup analyses to investigate both clinical and methodological heterogeneity.
Clinical heterogeneity
Planned clinical subgroups were:
-
age: pediatric (up to 18 years) versus adult (over 18 years);
-
disease severity as measured by FEV1 (70% to 80% considered mild; 60% to 70% moderate; 50% to 60% moderately severe; 34% to 50% severe; and less than 34% very severe as defined by American Thoracic Society guidelines (Pellegrino 2005)).
Methodological heterogeneity
Planned methodological subgroups were:
-
combined antioxidant supplementation and single antioxidant supplementation (i.e. each single micronutrient or combination thereof are listed separately);
-
antioxidant(s) alone versus antioxidant(s) alongside concurrent treatment;
-
timing of intervention: antioxidant(s) as prophylactic or therapeutic treatment.
Post hoc, the review authors decided that, regardless of the number of studies per outcome, individual supplements or unique combinations thereof should not be combined in a single meta‐analysis as it would not be appropriate due to the aforementioned differences between micronutrients. Therefore, the review authors presented results for different supplement interventions separately.
Sensitivity analysis
While the protocol for this review indicated that the review authors would base sensitivity analysis on only randomisation, allocation concealment, blinding, and intention‐to‐treat versus per‐protocol analysis, they later decided to evaluate risk of bias using the newly introduced risk of bias tool, therefore altering planned sensitivity analyses.
The review authors planned sensitivity analyses to evaluate treatment effect by excluding studies with an overall high risk of bias.
Summary of findings tables
In a post hoc change from protocol, the review authors have presented two summary of findings tables, one for oral antioxidants versus control and one for inhaled antioxidants versus control (summary of findings Table for the main comparison; summary of findings Table 2).
The following outcomes were reported in all tables (chosen based on relevance to clinicians and consumers):
-
FEV1 % predicted at three months (change from baseline);
-
FEV1 % predicted at six months (change from baseline);
-
QoL (change from baseline) at six months;
-
BMI (change from baseline) at six months;
-
mean time to next pulmonary exacerbation (at six months);
-
adverse effects.
We determined the quality of the evidence using the GRADE approach; and downgraded evidence in the presence of a high risk of bias in at least one study, indirectness of the evidence, unexplained heterogeneity or inconsistency, imprecision of results, high probability of publication bias. We downgraded evidence by one level if they considered the limitation to be serious and by two levels if very serious.
Results
Description of studies
Results of the search
Out of 360 unique studies yielded from the search strategy, 73 remained after title and abstract screening. After full text screening, 20 studies met the inclusion criteria (Bishop 2005; Calabrese 2015a; Calabrese 2015b; Conrad 2015; Dauletbaev 2009; Götz 1980; Griese 2013; Harries 1971; Homnick 1995b; Howatt 1966; Keljo 2000; Levin 1961; Mitchell 1982; Portal 1995a; Ratjen 1985; Renner 2001; Stafanger 1988; Stafanger 1989; Visca 2015; Wood 2003; Sagel 2018). Three studies remain listed under 'Characteristics of studies awaiting classification' as they are only currently available in abstract format and, if included, may compromise the validity of results due to unavailability of a complete set of data (Tirouvanziam 2005; Tirouvanziam 2006; Wong 1988). A total of 52 studies were excluded with reasons as detailed below (Excluded studies).
The flow of studies through the screening process of the review is shown in the figures (Figure 2); this process uses the Preferred Reporting Items for Systematic Reviews and Meta‐Analyses (PRISMA) flow diagram (Moher 2009). During full‐text screening, three study reports were translated but did not meet final inclusion criteria.
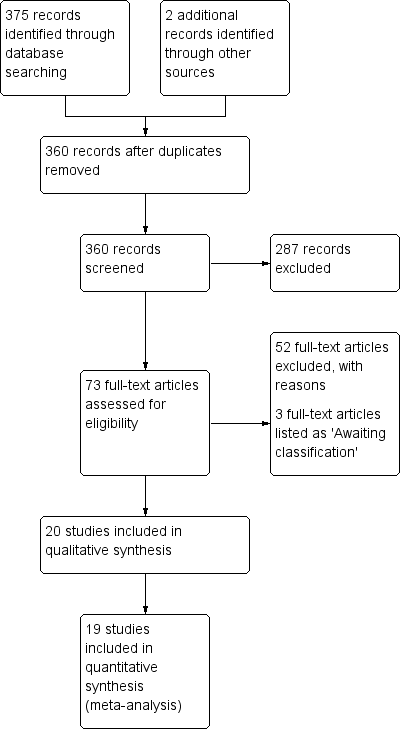
Study flow diagram.
We have received additional data from the authors of five studies (six data sets) (Calabrese 2015a; Calabrese 2015b; Conrad 2015; Dauletbaev 2009; Griese 2013; Keljo 2000; Visca 2015); these data have been used in the analyses.
Included studies
Six of the included studies were represented by single articles (Dauletbaev 2009; Götz 1980; Howatt 1966; Keljo 2000; Mitchell 1982; Wood 2003) and one report represented two studies, one of which was included and one excluded (Homnick 1995a; Homnick 1995b). Several of the included studies had multiple papers linked to them. Two reports (an article and a conference abstract) represented each of the Griese, the Harries, the Ratjen and both Stafanger studies (Griese 2013; Harries 1971; Ratjen 1985; Stafanger 1988; Stafanger 1989); two reports represented the Portal study (Portal 1995a) and there were also two reports (an article and a letter) for the Levin study (Levin 1961). There are three reports on the Visca study, two conference abstracts (one poster) and a published paper (Visca 2015). There are three abstracts and one full report representing each of the Bishop, the Calabrese and the Conrad studies (Bishop 2005; Calabrese 2015a; Calabrese 2015b; Conrad 2015). There were four reports for the Sagel study, a record on ClinicalTrials.gov, two abstracts and a full paper (Sagel 2018). There were three reports and four abstracts representing the Renner study (Renner 2001).
Oral antioxidant supplements were given in 16 studies (Conrad 2015; Dauletbaev 2009; Götz 1980; Harries 1971; Homnick 1995b; Keljo 2000; Levin 1961; Mitchell 1982; Portal 1995a; Ratjen 1985; Renner 2001; Sagel 2018; Stafanger 1988; Stafanger 1989; Visca 2015; Wood 2003) and four used nebulised supplements (Bishop 2005; Calabrese 2015a; Calabrese 2015b; Griese 2013; Howatt 1966). We present the characteristics of these studies separately below.
Study characteristics
Oral supplementation
Five studies were conducted in the USA (Conrad 2015; Homnick 1995b; Keljo 2000; Levin 1961; Sagel 2018), one in Australia (Wood 2003), one in New Zealand (Mitchell 1982); the remaining nine studies were conducted in Europe (one in France (Portal 1995a), one in Italy (Visca 2015), one in Great Britain (Harries 1971), two in Austria (Götz 1980; Renner 2001), two in Germany (Dauletbaev 2009; Ratjen 1985) and two in Denmark (Stafanger 1988; Stafanger 1989)). One study did not contain any information regarding sequence generation or allocation concealment has been interpreted as a controlled clinical study (Homnick 1995b); the remaining 15 studies were RCTs.
There are 11 studies of parallel design (Conrad 2015; Dauletbaev 2009; Harries 1971; Homnick 1995b; Keljo 2000; Levin 1961; Ratjen 1985; Renner 2001; Sagel 2018; Visca 2015; Wood 2003) and the remaining five are of cross‐over design (Götz 1980; Mitchell 1982; Portal 1995a; Stafanger 1988; Stafanger 1989). In the Portal study each arm lasted five months with a two‐month washout period between treatment periods (Portal 1995a). A two‐week washout period between the three‐month treatment periods was reported in the Mitchell study (Mitchell 1982). In the remaining three studies, no washout period between the periods of placebo and treatment administration were reported (Götz 1980; Stafanger 1988; Stafanger 1989).
Time points for reporting data in the included studies ranged from one month to 12 months (see Table 1).
| Study | Time point reported | |||||||
| 1 month | 2 months | 3 months | 4 months | 5 months | 6 months | 9 months | 12 months | |
| ✓ | ✓ | |||||||
| ✓ | ||||||||
| ✓ | ||||||||
| ✓ | ||||||||
| ✓ | ||||||||
| ✓ | ||||||||
| ✓ | ✓ | |||||||
| ✓ | ||||||||
| ✓ | ||||||||
| ✓ | ||||||||
| ✓ | ✓ | |||||||
| ✓ | ✓ | |||||||
| ✓ | ||||||||
| ✓ | ||||||||
| ✓ | ✓ | |||||||
| ✓ | ||||||||
The source of funding was reported in 12 out of the 16 studies of oral supplements; of these, one author (DPRM) on the Harries study was supported by Roche Products Ltd (Harries 1971), Stafanger was supported by ASTRA A/S Copenhagen (Stafanger 1988; Stafanger 1989) and Dauletbaev by Hexal AG, Germany (Dauletbaev 2009). In none of the remaining eight studies reporting funding sources did authors receive funding from industry (Conrad 2015; Griese 2013; Homnick 1995b; Keljo 2000; Portal 1995a; Sagel 2018; Visca 2015; Wood 2003). However, it should also be noted that four of the co‐authors on the Conrad study are listed as inventors on a provisional patent application covering NAC as a therapeutic agent for CF (Conrad 2015).
Inhaled supplementation
Two studies were conducted in the USA (Bishop 2005; Howatt 1966) and two were conducted in Europe (one in Germany (Griese 2013) and one in Italy (Calabrese 2015a; Calabrese 2015b)). All four studies were RCTs (Bishop 2005; Calabrese 2015a; Calabrese 2015b; Griese 2013; Howatt 1966). Three studies were of parallel design (Bishop 2005; Calabrese 2015a; Calabrese 2015b; Griese 2013) and one was of cross‐over design (Howatt 1966). The cross over study did not report any washout period between treatments.
Time points for reporting data in the included studies ranged from one month to 12 months (see Table 2).
| Study | Time point reported | |||||||
| 1 month | 2 months | 3 months | 4 months | 5 months | 6 months | 9 months | 12 months | |
| ✓ | ||||||||
| ✓ | ✓ | ✓ | ✓ | ✓ | ||||
| ✓ | ✓ | ✓ | ||||||
| ✓ | ||||||||
The source of funding was reported in two out of the four included studies of inhaled supplements, but funding was not from industry (Bishop 2005; Calabrese 2015a; Calabrese 2015b).
Participants
Oral supplementation
The 16 studies of oral supplementation represent 639 participants and sample size ranged from 20 participants (Homnick 1995b; Mitchell 1982) to 70 participants (Conrad 2015). Four studies reported the use of power calculations in determining sample size (Conrad 2015; Keljo 2000; Sagel 2018; Visca 2015), and three of these related these calculations to their primary outcome (Conrad 2015; Keljo 2000; Sagel 2018). The age of participants was not consistently reported in all studies, but the minimum reported age for inclusion was six months (Harries 1971) and maximum was 59 years (Conrad 2015). Of the 16 included studies of oral antioxidant supplementation, one did not report the age of participants (Homnick 1995b); six included just children, but with a large range of ages from 18 months to 16 years (Götz 1980; Harries 1971; Levin 1961; Mitchell 1982; Visca 2015; Wood 2003); and eight included a mixture of children and adults (Conrad 2015; Keljo 2000; Portal 1995a; Renner 2001; Ratjen 1985; Stafanger 1988; Stafanger 1989; Sagel 2018) and one only adults (Dauletbaev 2009).
The gender of the participants was reported by 14 studies (Conrad 2015; Dauletbaev 2009; Götz 1980; Keljo 2000; Levin 1961; Mitchell 1982; Portal 1995a; Ratjen 1985; Renner 2001; Sagel 2018; Stafanger 1988; Stafanger 1989; Wood 2003; Visca 2015). Details of gender split were not reported by the two remaining studies (Harries 1971; Homnick 1995b). There were approximately equal numbers of males and females in 10 studies (Conrad 2015; Götz 1980; Keljo 2000; Mitchell 1982; Portal 1995a; Ratjen 1985; Sagel 2018; Stafanger 1988; Stafanger 1989; Visca 2015). Although in the Visca study there were more females (58%) than males in the treatment group, but more males (57%) than females in the placebo group (Visca 2015); in the Conrad study, there were 56% males in the treatment group and 44% males in the control group (Conrad 2015). In two studies there were more males than females; in the Levin study overall there were 57% male (68% in the placebo group but only 45% in the treatment group) (Levin 1961) and in the Dauletbaev study, there were nine out of the 11 participants in the 700 mg daily NAC group were male and seven out of 10 participants in the 2800 mg daily NAC were male (Dauletbaev 2009). In two studies there were more females than males overall; Wood reported 45% of participants overall were male, 59% males in the treatment group but only 33% in the placebo group (Wood 2003). There were also significantly fewer males (25%) than females reported in the Renner study (Renner 2001).
Given the small number of studies included in the review, we were not able to split data by clinical subgroups.
Inhaled supplementation
The four studies of inhaled supplementation included in this review represent 285 participants and sample sizes ranged from eight (Howatt 1966) to 153 participants (Griese 2013). Two studies reported the use of power calculations in determining sample size related to their primary outcome (Calabrese 2015a; Calabrese 2015b; Griese 2013). For the four studies of nebulised supplements, one included people with CF with a mean age of 23 years (Griese 2013), one included a pediatric group with a mean (SD) age of 12.8 (3.1) years and an adult group with a mean (SD) age of 27.66 (8.25) years (Calabrese 2015a; Calabrese 2015b), one included people with CF aged 6 to 19 years with a mean age of 13 years (Bishop 2005) and the remaining study included people with CF ranging in age from six years to 23 years (Howatt 1966).
All four studies reported the gender of the participants (Bishop 2005; Calabrese 2015a; Calabrese 2015b; Griese 2013; Howatt 1966). There were approximately equal numbers of males and females in three studies (Calabrese 2015a; Calabrese 2015b; Griese 2013; Howatt 1966), but there were more males than females in the Bishop study: 67% in the treatment group and 60% in the placebo group (Bishop 2005).
Given the small number of studies included in the review, we were not able to split data by clinical subgroups.
Interventions
Oral antioxidant supplements were given in 16 studies (Conrad 2015; Dauletbaev 2009; Götz 1980; Harries 1971; Homnick 1995b; Keljo 2000; Levin 1961; Mitchell 1982; Portal 1995a; Ratjen 1985; Renner 2001; Sagel 2018; Stafanger 1988; Stafanger 1989; Visca 2015; Wood 2003) and four used nebulised supplements (Bishop 2005; Calabrese 2015a; Calabrese 2015b; Griese 2013; Howatt 1966). There were not enough data to examine other planned methodological subgroups. Data were grouped according to combined and single supplementation such that each unique micronutrient or combination thereof were presented separately. Since at least 10 studies are thought to be necessary for meaningful subgroup analysis (Deeks 2011), the subgroup analyses presented are meant to be exploratory.
Oral supplementation
Participants in all studies received standard pancreatic enzymes and vitamin supplements in addition to the study interventions.
Three studies evaluated supplementation with vitamin E (α‐tocopherol) (Harries 1971; Keljo 2000; Levin 1961). Harries compared supplementation with vitamin E (10 mg/kg/day D,L‐α‐tocopheryl acetate) in a single daily dose to control group without vitamin E supplement; both a fat‐soluble and a water‐miscible preparation were assessed (Harries 1971). The second study compared supplementation with vitamin E (naturally occurring RRR‐α‐tocopherol) in tablet form to placebo; doses of the supplement were determined according to weight ‐ 600 IU/day for participants under 20 kg and 1200 IU/day for participants who weighed over 20 kg (1 IU is the biological equivalent of 0.45 mg of D,L‐α‐tocopheryl acetate) (Keljo 2000). Levin compared supplementation with vitamin E in a dose of 10 mg/kg/day of D,L‐α‐tocopheryl acetate in a water‐miscible dispersion divided in two or three doses to placebo (Levin 1961).
Two studies examined β‐carotene supplementation (Homnick 1995b; Renner 2001). Homnick reports on a comparison of participants in the β‐carotene group who received 30 mg β‐carotene twice a day (60 mg/day) to a control group (Homnick 1995b). The β‐carotene dose was increased individually and periodically during the study in an attempt to obtain plasma concentrations of 0.37 to 0.74 μM/L believed to be consistent with baseline concentrations in normal people. Eight participants in the control and five in the β‐carotene group finished the study, but there are no data reported from the control group (Homnick 1995b). In the Renner study, investigators compared a weight‐dependent dose of β‐carotene (1 mg/kg of body weight/day up to a maximum of 50 mg/day) to placebo for three months, after which point the β‐carotene was supplemented in a standard, non‐weight‐dependent dose (10 mg/day) for all participants for another three months (Renner 2001). Since the average weight‐dependent dose during the first part of the study was not reported, measurements at this time point were not meaningful and only endpoint data (i.e. change from baseline to six months) were included for meta‐analysis.
A further study examined selenium supplementation in a cross‐over study (Portal 1995a). The investigators examined a 2.8 mg/kg of body weight/day dose of selenium compared to placebo (Portal 1995a).
One study evaluated a combination of 200 mg vitamin E, 300 mg vitamin C, 25 mg β‐carotene, 90 μg selenium and 500 μg vitamin A compared to routine vitamin treatment (10 mg vitamin E and 500 μg of vitamin A) (Wood 2003). The vitamin E supplement was administered as RRR‐α‐tocopherol.
One study examined a mixed supplementation (AquADEKs‐2) containing standard amounts of fat‐soluble vitamins (A, D, E, K) that are contained in typical CF multivitamin supplements plus several antioxidants including β‐carotene, mixed tocopherols (different forms of vitamin E), co‐enzyme Q10 (CoQ10), mixed carotenoids (lutein, lycopene and zeaxanthin), and the minerals zinc and selenium (Sagel 2018). This treatment was compared to a control multivitamin containing standard amounts of vitamins A, B, D, E, and K for CF but without added antioxidants.
The remaining eight studies assessed oral supplementation with L‐glutathione or NAC as a source of GSH (Conrad 2015; Dauletbaev 2009; Götz 1980; Mitchell 1982; Ratjen 1985; Stafanger 1988; Stafanger 1989; Visca 2015). Just one study evaluated oral supplementation with L‐glutathione (65 mg/kg/day) divided into three doses per day compared to placebo (calcium citrate 65 mg/kg/day) (Visca 2015). Seven studies evaluated different dose regimens of NAC compared to placebo. One study administered 900 mg NAC as effervescent tablets three times daily (2700 mg/day) for 24 weeks compared to placebo (Conrad 2015). Four studies used doses of oral NAC of 200 mg three times daily (600 mg/day) (Mitchell 1982; Ratjen 1985; Stafanger 1988; Stafanger 1989). In both Stafanger studies the dose was increased to 400 mg three times daily (1200 mg/day) if the body weight of the participants was over 30 kg. In the Götz study NAC was given twice daily with an average dosage of 9.5 mg/kg and compared to placebo (Götz 1980). The remaining study compared NAC 700 mg/day (one tablet with NAC 700 mg and three placebo tablets) to NAC 2800 mg/day (four tablets each containing NAC 700 mg) in two groups of participants; additional data from this study have been obtained after contacting the author (Dauletbaev 2009).
Inhaled supplementation
Four studies reported on the supplementation with nebulised GSH compared to placebo (Bishop 2005; Calabrese 2015a; Calabrese 2015b; Griese 2013; Howatt 1966). In the Bishop study, participants inhaled buffered GSH 66 mg/kg distributed across four inhalation sessions per day (spaced three to four hours apart) for eight weeks, full dose in the last six weeks (Bishop 2005). In a second study, the participants inhaled GSH twice daily at a dose of 10 mg/kg body weight (maximum dose 600 mg) (Calabrese 2015a; Calabrese 2015b). Likewise, in the Griese study, GSH was inhaled twice daily but at a dose of 646 mg every 12 hours via an eFlow nebulizer (Griese 2013). In the fourth study, Howatt compared 5 mL of NAC at two different concentrations, 20% and 2% (placebo), three times daily (Howatt 1966).
Outcomes
Outcomes for the different interventions are reported and analysed separately.
Oral supplementation
A total of 11 studies reported on lung function, a primary outcome of this review (Conrad 2015; Dauletbaev 2009; Götz 1980; Mitchell 1982; Ratjen 1985; Renner 2001; Sagel 2018; Stafanger 1988; Stafanger 1989; Visca 2015; Wood 2003). Of these, one study reported peak expiratory flow values, a parameter not included in the analysis (Mitchell 1982). The remaining 10 studies reported FEV1, but data for the change from baseline values, as stated in our analysis plan, were only available from seven studies (Conrad 2015; Dauletbaev 2009; Ratjen 1985; Sagel 2018; Stafanger 1989; Wood 2003;Renner 2001); three studies reported narrative information for FEV1 (Götz 1980; Mitchell 1982; Stafanger 1988). Six studies additionally reported FVC as % predicted (Conrad 2015; Dauletbaev 2009; Stafanger 1988; Stafanger 1989; Visca 2015; Wood 2003). Visca reported the spirometry data only as poster results and these data were not included in the published article (Visca 2015).
Two studies reported QoL using a validated measures ‐ CF Quality of Life Questionnaire respiratory domain scale (CFQ‐R) (Conrad 2015) and quality of well‐being (QoWB) (Wood 2003).
For markers of oxidative stress, four studies reported lipid peroxidation measures: one reported F2‐isoprostanes in plasma (Wood 2003); one reported urine 8‐iso‐PGF2 (Sagel 2018) one reported organic peroxides measurements (Portal 1995a), two studies reported thiobarbituric acid reactive substances (TBARS) (Portal 1995a; Sagel 2018) and one reported malondialdehyde (MDA) levels measured by HPLC (Renner 2001). However, TBAR levels in (mcM) units reported by the Sagel study were not compatible with the other reported data and were not used in the analysis (Sagel 2018). Two studies reported glutathione peroxidase (GPX) function (Portal 1995a; Wood 2003) and one reported superoxide dismutase (SOD) activity (Wood 2003). One study reported oxidative stress potential by trolox‐equivalent antioxidant capacity (TEAC) (Renner 2001) and two reported total antioxidant capacity (Renner 2001; Sagel 2018), though measured by different methods; either by a photometric method according to Rice‐Evans and Miller (Renner 2001) or by copper reduction‐colorimetric assay (CRE) (Sagel 2018). Conrad reported sputum neutrophil elastase activity, sputum neutrophil count, sputum and plasma IL‐8 (Conrad 2015). Dauletbaev reported sputum neutrophil counts, TNF‐α and IL‐8 in induced sputum (Dauletbaev 2009) and a further study reported on levels of sputum myeloperoxidase, as a measure of neutrophil activity (Sagel 2018).
Five studies reported changes in the plasma levels of α‐tocopherol (vitamin E) (Harries 1971; Keljo 2000; Levin 1961; Sagel 2018; Visca 2015). However, in the Visca study participants received oral supplementation with GSH and therefore the effect on the level of vitamin E is indirect (Visca 2015). As stated above, the concentrations of vitamin E in the studies were expressed as either mg/100 mL (Harries 1971; Levin 1961) or as µg/mL (Sagel 2018; Visca 2015) and have been converted to µmol/L by the review authors. One study of NAC supplementation measured the GSH in whole blood (Conrad 2015), while another study of NAC supplementation measured extracellular levels of GSH in induced sputum (Dauletbaev 2009). One study measured the plasma fatty acid status of 17 plasma fatty acids; since we did not pre‐specify which to analyse, only data for total plasma fatty acid status were included in our analysis (Wood 2003). One study reported plasmid total lipids as a correction factor for α‐tocopherol levels and could not be included in the analysis (Sagel 2018).
Four studies measured β‐carotene antioxidant status (Homnick 1995b; Portal 1995a; Renner 2001; Sagel 2018). However, one of these did not completely report endpoints for the control group; as such, we did not have complete data to enter into a meta‐analysis or report in the text narratively (Homnick 1995b).
Four studies measured BMI (Conrad 2015; Renner 2001; Visca 2015;Sagel 2018); one of these reported both percentile and z scores (Visca 2015). Two studies did not provide complete outcome data (Renner 2001; Sagel 2018). Five studies reported weight (Conrad 2015; Levin 1961; Mitchell 1982; Visca 2015,Sagel 2018); three studies measured this outcome in kg (Conrad 2015; Levin 1961; Mitchell 1982), one reported both percentile and z scores (Visca 2015) and one reported z scores (Sagel 2018).
Three studies reported the number of days of antibiotic therapy (Mitchell 1982; Renner 2001; Wood 2003). Two studies reported the number of pulmonary exacerbations; one also reported the number of hospitalizations (Conrad 2015), while the second additionally reported the time to first pulmonary exacerbation (Sagel 2018).
Data on death during the studies or adverse events were reported in eight studies (Conrad 2015; Dauletbaev 2009; Keljo 2000; Levin 1961; Portal 1995a; Renner 2001; Sagel 2018; Visca 2015). Conrad particularly assessed the development of pulmonary hypertension in light of a study by Palmer which reported that chronic, systemic administration of either NAC or S‐nitroso‐acetylcysteine caused hypoxia‐mimetic pulmonary hypertension in mice (Palmer 2007).
Keljo measured cytokines as the primary outcome measure of the study (Keljo 2000). Sagel measured sputum myeloperoxidase as the primary outcome (Sagel 2018).
Inhaled supplementation
All the studies assessing GSH or NAC inhalation reported on lung function, the primary outcome of this review, but used a range of measures (Bishop 2005; Calabrese 2015a; Calabrese 2015b; Griese 2013; Howatt 1966). Bishop reported the MDs (post‐baseline) between GSH and placebo groups for FEV1, FVC and FEF25‐75 in % predicted compared to normal values and peak flow measures (Bishop 2005). The second study reported MDs (post‐baseline) for FEV1 and FEF25‐75 in both % predicted and L; the study authors were contacted and have provided values for FVC in L and % predicted (Calabrese 2015a; Calabrese 2015b). The Griese study presents data on changes in the absolute FEV1; after contacting the author, data for mean differences (post‐baseline) in FEV1, FVC and FEF25‐75 in % predicted have been also obtained (Griese 2013). The Howatt study reported only qualitative data, such as "improve" or "worse" compared to baseline (Howatt 1966).
Three of the four studies reported on QoL, but used different methods impeding the meta‐analysis (Bishop 2005; Calabrese 2015a; Calabrese 2015b; Griese 2013); Bishop used self‐reported parameters, Calabrese used version 2.0 of the Italian validated questionnaire (CFQoL) (Monti 2008) and Griese used a validated measurement tool (Wenninger 2003).
One study reported markers of oxidative stress, measurements of GSH and its metabolites in both sputum and blood (Griese 2013). Both reduced GSH and reduced forms of its metabolites (named free GSH or free forms) and the sum of reduced and oxidized GSH and that of its metabolites (named total GSH or total forms) were measured. The intracellular levels of GSH in neutrophils from sputum and blood were also measured in a small subgroup of participants. Lipid mediators (isoprostanes) and protein carbonyls were reported in sputum (Griese 2013). A second study reported H2O2 in exhaled breath condensate and serum (Calabrese 2015a; Calabrese 2015b). Griese also reported cytokines (IL‐10, IL‐8) in the sputum in a subgroup of participants from the intervention group compared to placebo (Griese 2013).
Three studies reported changes in nutritional status (Bishop 2005; Calabrese 2015a; Calabrese 2015b; Griese 2013). Bishop reported the average difference in BMI between baseline and after two months (Bishop 2005); while Calabrese reported the mean BMI at baseline and after 12 months in each group of adults and children (Calabrese 2015a; Calabrese 2015b); Griese measured weight (Griese 2013).
Two studies reported the number of exacerbations per participant (Calabrese 2015a; Calabrese 2015b; Griese 2013).
Three studies reported adverse events (Bishop 2005; Calabrese 2015a; Calabrese 2015b; Griese 2013).
Excluded studies
Upon title and abstract screening 287 studies were excluded and a further 52 were excluded after full‐text screening (seeCharacteristics of excluded studies). We excluded 12 studies described as controlled studies from this review (Cobanoglu 2002; Congden 1981; Farrell 1977; Knopfle 1975; Lancellotti 1996; Lepage 1996; Madarasi 2000; Portal 1995b; Underwood 1972b; Winklhofer‐Roob 1995; Winklhofer‐Roob 1996c; Winklhofer‐Roob 1997a). In a further four studies, the antioxidant intervention was compared to an active control arm, therefore not meeting the pre‐specified selection criteria for the review (Nasr 1993; Papas 2007; Peters 1996; Winklhofer‐Roob 1996b); in one study, a micronutrient mix was compared to placebo; however, the intervention contained a mixture of micronutrients in addition to those being studied and the sole effects of those of interest could not be obtained (Oudshoorn 2007); seven studies did not include any of the interventions under consideration (Abdulhamid 2008; Best 2004; Khorasani 2009; Mischler 1991; Powell 2010; Sharma 2016; Wojewodka 2015). We also excluded 12 prospective cohort studies (Bines 2005; Ekvall 1978; Kauf 1995; Kawchak 1999; Kelleher 1987; Munck 2010; Rawal 1974; Rettammel 1995; Richard 1990; Sokol 1989; Sung 1980; Wood 2002), seven review articles (Anonymous 1975; Beddoes 1981; Goodchild 1986; Oermann 2001; van der Vliet 1997; Winklhofer‐Roob 2003; Zoirova 1983), three concerned letters (Winklhofer‐Roob 1996a; Winklhofer‐Roob 1997b; Winklhofer‐Roob 1997c), two studies reporting on single‐dose administration for tolerance investigations (Homnick 1995a; Jacquemin 2009), two case‐reports (Hoogenraad 1989; Hubbard 1980), one retrospective cohort study (Underwood 1972a) and one study in people with chronic pancreatitis (Uden 1990).
Out of the excluded studies, two were represented by three separate reports (Winklhofer‐Roob 1996c; Wojewodka 2015) and two were represented by a report and an abstract (Abdulhamid 2008; Winklhofer‐Roob 1996b). The remaining studies were each represented by a single report.
Studies awaiting classification
A total of three studies are listed as 'Awaiting classification' as to date they are only available in abstract form and their inclusion may compromise the validity of results due to unavailability of a complete set of data (Tirouvanziam 2005; Tirouvanziam 2006; Wong 1988).
Two studies employed NAC as the intervention (Tirouvanziam 2005; Tirouvanziam 2006). The first was a phase I parallel study which randomised 18 participants with CF to one of three different doses (1.8 g/day, 2.4 g/day and 3.0 g/day) given three times daily for four weeks (Tirouvanziam 2005). This study measured mainly adverse effects, QoL and GSH levels in blood, cells and sputum. Following on from this study, the same team undertook a phase 2 parallel, placebo‐controlled study of NAC at a dose of 2.7 g/day given over three doses for a duration of 12 weeks (Tirouvanziam 2006). This initial 12‐week phase randomised 21 participants with CF and was followed by a further 12‐week open‐label drug‐only phase, the results of which will not be eligible for inclusion in this review. However, if we are able to obtain results from the first randomised 12‐week phase we will included these data. Outcomes assessed included lIve neutrophil count in sputum, pulmonary function tests, adverse events, CF QoL, complete blood count, serum chemistries and intracellular GSH.
The third study listed as awaiting classification pending further information is of fat‐soluble vitamin E (Wong 1988). The study describes a parallel study with three arms, but the method of randomisation is not described. The study recruited 30 people with CF admitted to hospital with a pulmonary exacerbation, hence the duration of treatment is between 10 and 14 days. The three treatment arms are oral fat‐soluble vitamin E (10 mg/kg/day), or oral water‐miscible vitamin E (10 mg/kg/day) or no supplement. The outcomes measured were serum vitamin E levels and three‐day fecal fat excretion.
Risk of bias in included studies
As can be seen from the risk of bias summaries none of the 20 included studies was free of bias and when each of the domains are considered across studies, none of the domains were apparently free of bias (Figure 3; Figure 4). Of those studies that had assessable (i.e. not unclear) domains (green and red dots), there were 18 instances of studies being judged to have a high risk of bias and 42 instances of a low risk of bias assessment. Most studies failed to adequately describe allocation concealment and blinding, resulting in an unclear risk of bias with respect to these domains (yellow dots). Each domain is individually described below.
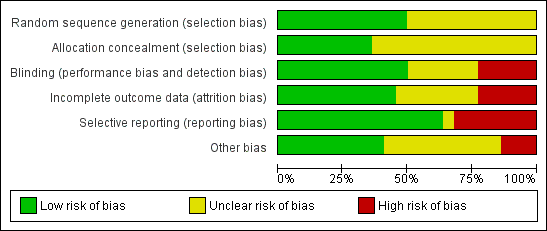
Risk of bias graph: review authors' judgements about each methodological quality item presented as percentages across all included studies.
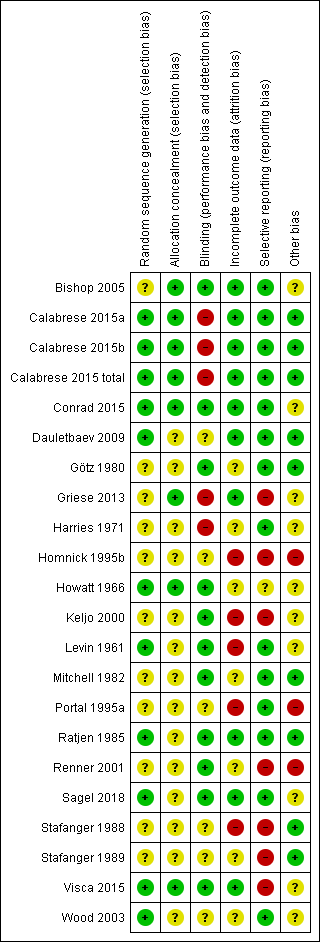
Risk of bias summary: review authors' judgements about each methodological domain for each included study.
Allocation
Sequence generation
Eight studies adequately described sequence generation and were judged to have a low risk of bias (Calabrese 2015a; Calabrese 2015b; Conrad 2015; Dauletbaev 2009; Howatt 1966; Levin 1961; Ratjen 1985; Visca 2015; Wood 2003). Three studies stated that computer‐generated randomisation lists were used to assign participants groups (Calabrese 2015a; Calabrese 2015b; Ratjen 1985; Wood 2003). Conrad used a secure randomisation system by PPD, Inc. to generate assignments which were then distributed to each participating centre (Conrad 2015). Dautlebaev also used a computerized system (Random 1.0 software) to generate the randomisation sequence in a ratio of 1:1 for the different NAC doses (Dauletbaev 2009). Visca used a random number generator to randomly assigned participants to treatment or placebo as specified in the protocol (supplementary data available online) (Visca 2015). In the Howatt study the order of treatment arms was determined by making two slips of paper for each of the six possible combinations and having the participant draw its schedule from an envelope (Howatt 1966). In the Levin study, cards labelled 1 or 2 were individually placed in sealed envelopes in groups of four, two for each mixture number. Envelopes were divided into three groups, according to the age of the participants: less than 5 years, between 5 and 10 years and 10 years or older (Levin 1961). In Sagel study (Sagel 2018), participants were randomised 1:1 to receive either the antioxidant‐enriched multivitamin ("treated" group) or continue on control multivitamin ("control" group). An adaptive randomisation algorithm was employed based on stratification factors for: age (10 to 17 years, over 18 years), FEV1 % predicted (40% to 70%, over 70% and up to 100%), chronic use of inhaled antibiotics, and chronic use of azithromycin.
We judged there to be an unclear risk of bias for the remaining 11 studies (Bishop 2005; Götz 1980; Griese 2013; Harries 1971; Homnick 1995b; Keljo 2000; Mitchell 1982; Portal 1995a; Renner 2001; Stafanger 1988; Stafanger 1989). In the Bishop study, it is stated that participants were first paired by age and sex, and then each member of the pair was randomly assigned to the treatment or placebo group, but the actual method of randomisation is not described (Bishop 2005). Similarly, Griese randomised participants by central telephone block randomisation at 1:1 ratio within each age group to receive study medication or placebo but did not describe how the sequence was generated (Griese 2013). The remaining studies did not give any description of how the randomisation sequence was generated.
Allocation concealment
We judged six studies to have a low risk of selection bias (Bishop 2005; Calabrese 2015a; Calabrese 2015b; Conrad 2015; Griese 2013; Howatt 1966; Visca 2015). In the Bishop study, no member of the clinical team was involved in the coding or assignment to treatment or placebo; non‐clinical researchers involved in the study were only provided with participant identification numbers, not names (Bishop 2005). In the Calabrese study, the randomisation list was generated by a person not otherwise involved in the study (Calabrese 2015a; Calabrese 2015b). Two studies generated the randomisation numbers centrally and used a telephone system to inform clinicians of participant allocation (Conrad 2015; Griese 2013). In the Howatt study, the drugs were supplied in 10 mL vials labelled with a letter code in a sealed envelope which was not opened until the study was completed (Howatt 1966). In the Visca study, the drug containers were labelled 'A' or 'B' by the pharmaceutical supplier and the blind was removed only after the study had concluded and data analysis begun (Visca 2015).
The risk of bias with respect to allocation concealment is unclear for the remaining 14 studies as it was generally not discussed in the publications (Dauletbaev 2009; Götz 1980; Harries 1971; Homnick 1995b; Keljo 2000; Levin 1961; Mitchell 1982; Portal 1995a; Ratjen 1985; Renner 2001; Sagel 2018; Stafanger 1988; Stafanger 1989; Wood 2003). Levin does state that they concealed the allocation schedules in sealed envelopes, but does not state if these envelopes were opaque, thus the risk of bias is unclear (Levin 1961).
Blinding
We judged there to be a low risk of bias with respect to blinding for 11 studies (Bishop 2005; Conrad 2015; Götz 1980; Howatt 1966; Keljo 2000; Levin 1961; Mitchell 1982; Ratjen 1985; Renner 2001; Sagel 2018; Visca 2015). Six studies matched the taste and smell of treatment and placebo medications to ensure that both participants and the clinical team were blinded (Bishop 2005; Götz 1980; Howatt 1966; Levin 1961; Ratjen 1985; Sagel 2018). Goetz clarified that both substances had a similar taste of orange and were packed in neutral sachets (Götz 1980); Ratjen additionally stated that the colour of the granules was also matched (Ratjen 1985). Three studies stated that the capsules were of identical appearance (Mitchell 1982; Renner 2001; Sagel 2018). In the Conrad study the NAC and the placebo effervescent tablets were packed identically and supplied by BioAdvantex Pharma, Inc. so that all study personnel and participants were blinded to treatment assignment; the codes for each participant were only revealed when data analysis was completed (Conrad 2015). In the Visca study the capsules for both treatments were identical in appearance and in containers labelled 'A' or 'B' by the pharmaceutical supplier (Visca 2015). In the study by Keljo, treatment (naturally occurring RRR‐α‐tocopherol) and placebo were both provided in vegetable oil (Keljo 2000).
The Dauletbaev study stated that the placebo phase was single‐blinded (participants) while the NAC treatment phase was double‐blinded (participants and clinicians); it is not clear how this has affected the risk of bias (Dauletbaev 2009). Five studies did not describe the blinding process in enough detail in order to allow a proper assessment of this domain; therefore, the risk of bias with respect to blinding is unclear for these studies (Homnick 1995b; Portal 1995a; Stafanger 1988; Stafanger 1989; Wood 2003).
Three studies were judged to have a high risk of bias from blinding (Calabrese 2015a; Calabrese 2015b; Griese 2013; Harries 1971). The Calabrese study was described by the author as single‐blinded because GSH has a distinct taste and smell that is difficult to reproduce as placebo (Calabrese 2015a; Calabrese 2015b). Similarly, although the Griese study was a double‐blind study with respect to the packaging of the vials and visual appearance of the medication, those participants treated with GSH could recognize its smell; the authors provide this bias as explanation for the significantly higher dropout rate due to early termination by participant request in the placebo group compared to the treatment group (Griese 2013). In the Harries study, the control group did not receive a placebo but rather no treatment; moreover, the two active interventions used were physically different (tablet versus liquid preparations) (Harries 1971).
Incomplete outcome data
Eight out of 20 studies are judged to have a low risk of attrition bias as the number of withdrawals from the studies as well as the reasons are described in detail for each group (Bishop 2005; Calabrese 2015a; Calabrese 2015b; Conrad 2015; Dauletbaev 2009; Griese 2013; Ratjen 1985; Sagel 2018; Visca 2015).
A further seven studies did not provide a description of withdrawals or dropouts and are judged to have an unclear risk of bias (Götz 1980; Harries 1971; Howatt 1966; Mitchell 1982; Renner 2001; Stafanger 1989; Wood 2003).
The remaining five studies reported incomplete data for the outcomes of interest and have a high risk of bias (Homnick 1995b; Keljo 2000; Levin 1961; Portal 1995a; Stafanger 1988). One study did not described which study arm participants withdrew from; furthermore, the authors of this study did not provide control group data, thereby preventing a comparison between groups in a meta‐analysis (Homnick 1995b). Authors were contacted but unable to provide further information because the original data were on a computer they no longer had access to (Homnick 2008 [per comms]). In the paper by Keljo, there are inconsistencies in the number of participants included in each group between the tables of data reporting and the table describing inclusion criteria (Keljo 2000). Furthermore, data from one subgroup of participants are not reported at all due to the very limited number of participants (Keljo 2000). The Levin study, reports that there were 45 participants in the final analysis who had been followed for at least two months and 37 participants who completed the six‐month study period (18 in the tocopherol group and 19 in the placebo group); serum tocopherol was reported at two and six months in 18 out of 20 participants initially included in the study and 15 out of 20 participants, respectively (Levin 1961). While the remaining study did not explicitly state the number of participants originally randomised to each group, it is the only study which states the reasons for participant withdrawal (Portal 1995a). In the 1988 Stafanger study, 41 out of 44 participants completed the study, but lung function was only reported for 23 participants (Stafanger 1988).
Selective reporting
Data were reported for all outcomes measured in 12 studies which are judged to have a low risk of bias (Bishop 2005; Calabrese 2015a; Calabrese 2015b; Conrad 2015; Dauletbaev 2009; Götz 1980; Harries 1971; Levin 1961; Mitchell 1982; Portal 1995a; Ratjen 1985; Sagel 2018; Wood 2003).
One study was judged to have an unclear bias due to a lack of information (Howatt 1966).
Seven studies appeared to have a high risk of bias in this domain (Griese 2013; Homnick 1995b; Keljo 2000; Renner 2001; Stafanger 1988; Stafanger 1989; Visca 2015). Griese reported data on cellular and biochemical markers such as GSH and its metabolites in an exploratory manner in a very limited number of participants (Griese 2013). In the Homnick study, authors reported taking measurements at least monthly for 56 weeks, but only present data for baseline and week 50 (Homnick 1995b). In a third study, actual data for BMI were not reported and the difference between groups only described as non‐significant; when contacted, the author was unable to provide further data due to relocation of the study statistician (Renner 2001). Stafanger only reports FEV1 for the 10 participants with baseline peak expiratory flow less than 70% of predicted for sex, age and height (out of 31 participants completing the study) (Stafanger 1989) and lung function results in only 23 out of 41 participants with CF (Stafanger 1988). In the Keljo study, the full paper does not state in the 'Methods' section what the authors planned to report on and the protocol is not available (Keljo 2000). The remaining study does not report spirometry data in the published paper and these data are only available from a poster presentation (Visca 2015). Upon contact for clarification, the corresponding author, Dr. Clark Bishop, has confirmed that the two main reasons were that the pulmonary function was available only for participants over five years of age (representing about half of the treated population) and the lack of a clear physiopathological link between oral supplementation with GSH and improved lung function.
Other potential sources of bias
Two studies included in this review appear to be subject to duplicate publication (Portal 1995a; Renner 2001). In the case of Portal, authors describe the same study in full‐length manuscripts, published two years apart (Portal 1995a). The journals in which they are published appear related, but are independent – Clinical Chemistry andClinica Chimica Acta (International Journal of Clinical Chemistry). Although the two reports appear to describe different outcomes of the same study based on their titles (the 1993 paper reports on biological indices of selenium status and the 1995 paper reports on lipid peroxidation markers), the later paper does not reference the methods already reported in the earlier report. Although the earlier report assesses two outcomes not later described and the latter report describes two not previously described, there is an overlap of two outcomes; neither of which is referred to as having already been reported. As such, the two studies were taken as one here since the outcomes of interest were contained in both studies and the authors of this review did not want to ‘double count’ participants (Portal 1995a). Another study appeared in the literature in seven different instances ‐ three full‐text reports and four abstracts (Renner 2001). At the screening stage of this review, one full‐text report was included and the other two were excluded on the basis of unstated diagnostic criteria. Eventually, data from all reports were included for meta‐analysis according to Cochrane policy. None of the full‐text reports referenced the others and all are reported as 'original' publications.
There is an unclear risk of bias for the Keljo study which has not been published in a peer‐reviewed journal; an abstract was presented at the North American Cystic Fibrosis Conference and additional data presented in this review were supplied directly by the authors (Keljo 2000).
With the exception of two studies which include 153 (Griese 2013) and 105 participants (Calabrese 2015a; Calabrese 2015b), most studies in this review suffer from relatively small sample sizes, ranging from eight (Howatt 1966) to 70 participants (Conrad 2015).
Another source of potential bias occurs in one of the cross‐over studies included in this review, where the authors described a proper cross‐over regimen, with each arm lasting five months with a two‐month washout period between treatment periods (Portal 1995a). However, they failed to measure and report baseline measurements for all outcomes after the washout period and before the start of the second period (Portal 1995a). This prevented the authors of this review from assessing whether a ‘carry‐over’ effect occurred; data from the second period were incomplete and hence could not be included for analysis in this review. In a further cross‐over study, a two‐week washout period between the three‐month treatment periods was registered (Mitchell 1982). In four cross‐over studies no washout period between the periods of placebo and treatment administration were reported, but the participants were assessed before and after each treatment period (Howatt 1966; Götz 1980; Stafanger 1988; Stafanger 1989).
In the Griese study which compares the effect of inhaled GSH to placebo, a number of participants were allowed to continue the oral administration of NAC, which is a precursor of GSH and these participants could not be identified from the report. We are therefore unable to assess the possible influence of this treatment on the results (Griese 2013).
Conrad includes 70 participants with CF who belong to two different cohorts; the Stanford cohort of 16 participants who initially entered the study for the safety investigation with a focus on pulmonary arterial hypertension and a second cohort of 54 participants from 10 other CF centres who were enrolled at a later stage after the safety study showed no signs of pulmonary hypertension at eight weeks of NAC treatment (Conrad 2015).
In the study by Visca, there were more participants homozygous for delta F508 (known to have a more severe disease manifestation than heterozygotes) in the placebo group (27.7%) compared to the GSH group (13.6%) (Visca 2015).
We judge the Homnick study to be at a high risk of bias since the authors do not describe baseline demographics and do not state a sample size calculation. Furthermore, investigators did not systematically control dose levels throughout the study (Homnick 1995b).
Effects of interventions
See: Summary of findings for the main comparison Summary of findings: oral antioxidants (NAC/GSH) compared to placebo; Summary of findings 2 Summary of findings: oral vitamin E supplementation versus placebo or no treatment; Summary of findings 3 Summary of findings: oral β‐carotene compared to placebo; Summary of findings 4 Summary of findings: oral antioxidant combination compared to control; Summary of findings 5 Summary of findings: oral antioxidant mixed supplement compared with control; Summary of findings 6 Summary of findings: inhaled antioxidants compared with placebo
In the summary of findings tables, the quality of the evidence has been graded for pre‐defined outcomes (see above) and definitions of these gradings provided (summary of findings Table for the main comparison; summary of findings Table 2; summary of findings Table 3; summary of findings Table 4; summary of findings Table 5; summary of findings Table 6).
Oral antioxidant supplementation versus control
Primary outcomes
1. Lung function tests
a. FEV1
Eight studies (n = 322) reported FEV1 (% predicted) compared to baseline at a range of time points up to six months (Conrad 2015; Dauletbaev 2009; Ratjen 1985; Renner 2001; Sagel 2018; Stafanger 1989; Visca 2015; Wood 2003). Results are presented in the graphs, but we were not able to generate a total summary statistic as one study contributed data at more than one time point (Analysis 1.1).
After two months of a combined supplement, Wood reported a significant difference in favour of control, MD ‐4.30% (95% CI ‐5.64 to ‐2.96) (Wood 2003).
Four studies comparing GSH or NAC to control reported data at three months (Conrad 2015; Dauletbaev 2009; Ratjen 1985; Stafanger 1989). When data were combined, the intervention group showed a better lung function compared to placebo, though no statistical significance was achieved, MD 2.83% (95% CI ‐2.16 to 7.83). However, I² was 49% (moderate heterogeneity) and it should be underlined that the dosage of NAC in two studies was 600 mg/daily divided in three doses (Ratjen 1985; Stafanger 1989), while in the remaining studies the doses were 2700 mg daily (Conrad 2015) and 2800 mg daily (Dauletbaev 2009) divided in three and four doses, respectively. The quality of evidence for this outcome was deemed to be very low (summary of findings Table for the main comparison).
After four months of an antioxidant‐enriched vitamin supplement or the vitamin supplement alone, Sagel reported no difference between groups, MD 1.44% (95% CI ‐2.23 to 5.11) (Sagel 2018).
Three studies report FEV1 (% predicted) at six months; one evaluating NAC (Conrad 2015), one evaluating oral GSH (Visca 2015) and one evaluating β‐carotene (Renner 2001). Both Conrad and Visca individually showed a positive effect of NAC, MD 4.38% (95% CI 0.89 to 7.87) and GSH administered as L‐glutathione, MD 17.40% (95% CI 13.97 to 20.83). The different bioavailabilities of NAC and GSH do not support the combination of results from these two studies. The quality of evidence for the effect of NAC was deemed to be moderate and only downgraded because of small number of participants (summary of findings Table for the main comparison). At six months, Renner showed no statistical difference between the β‐carotene and control groups (Renner 2001); but the quality of this evidence was found to be very low (summary of findings Table 3).
Three further studies of oral NAC reported information for FEV1 which could not be included in the meta‐analysis (Götz 1980; Mitchell 1982; Stafanger 1988). Two studies reported a non‐significant improvement of FEV1 during oral administration of NAC (Götz 1980; Mitchell 1982). The third study, however, reported a significant improvement of the FEV1 after oral administration of NAC, but this was in a subgroup of participants treated during autumn, when infections are more common (Stafanger 1988).
b. FVC
Five studies (n = 208) reported on FVC (% predicted) compared to baseline at two, three and six months (Conrad 2015; Dauletbaev 2009; Stafanger 1989; Visca 2015; Wood 2003). Results are presented in the graphs, but we were not able to generate a total summary statistic as one study contributed data at more than one time point (Analysis 1.2).
After two months, there was no statistical difference between the combined supplement and control, MD ‐4.20% (95% CI ‐11.28 to 2.88) (Wood 2003).
Three studies provided data for NAC versus control at three months and showed a result in favour of NAC, although this was not statistically significant, MD 3.34% (95% CI ‐4.30 to 10.97) (Conrad 2015; Dauletbaev 2009; Stafanger 1989).
Two studies reported FVC (% predicted) at six months (Conrad 2015; Visca 2015). When GSH was administered as L‐glutathione the result significantly favoured GSH, MD 14.80% (95% CI 10.07 to 19.53); however, when administered as NAC the result was non‐significant, MD 3.75% (95% CI ‐0.13 to 7.63).
2. QoL
Data for this outcome were available from two studies (n = 108); one study assessed QoL using the Quality of Wellbeing scale (QoWB) (Wood 2003) and the second used the CF Quality of Life Questioannaire respiratory domain scale CFQ‐R (Conrad 2015). We present the results from both studies on the same graph and have therefore analysed the data using the SMD. Results from the Wood study significantly favoured control over antioxidant supplementation at two months, SMD ‐0.66 points (95% CI ‐1.26 to ‐0.07) (Analysis 1.3). In the second study, the CFQ‐R was used and reported no significant difference in results between NAC and placebo groups at three months, SMD 0.33 (95% CI ‐0.17 to 0.83) and at six months, SMD ‐0.03 (95% CI ‐0.53 to 0.47) (Conrad 2015). This evidence at six months was of moderate quality but was downgraded due to imprecision from the small number of participants (summary of findings Table for the main comparison).
Secondary outcomes
1. Oxidative stress
a. Lipid peroxidation
Four studies reported this outcome (n = 170), one comparing selenium to control (Portal 1995a), one comparing β‐carotene to control (Renner 2001), one comparing a combined supplement to control (Wood 2003) and one comparing antioxidant‐enriched multivitamins with multivitamins alone (Sagel 2018). These studies reported different measures of lipid peroxidation:
-
H2O2 (Portal 1995a);
-
plasma 8‐iso‐prostoglandin F2α (Wood 2003);
-
malondialdehyde either as TBARS (Portal 1995a; Sagel 2018) or by HPLC (Renner 2001); and
-
urine and sputum 8‐iso‐PGF2α and sputum 8‐hydroxydeoxyguanosine (8 ‐OHdG) (Sagel 2018).
When the data were analysed there was no significant difference at any time point between groups for H2O2, MD 15.90 (95% CI ‐13.16 to 44.96) (Analysis 1.4); plasma F2‐isoprostanes, MD 1.00 (95% CI ‐23.94 to 25.94) (Analysis 1.5); malondialdehyde, MD ‐0.10 (95% CI ‐0.45 to 0.25) (Analysis 1.6); urine and sputum 8‐iso‐PGF2α, MD 0.09 (CI 95% ‐0.10 to 0.28) and MD 0.02 (95% CI ‐0.12 to 0.16), respectively (Analysis 1.7; Analysis 1.8); or sputum 8 ‐OHdG, MD ‐0.07 (95% CI ‐0.24 to 0.10) (Analysis 1.9). Due to different measurement units TBARS data from the Sagel study could not be used in the meta‐analysis (Sagel 2018).
b. Antioxidant enzyme function
Two studies contributed data for this outcome (n = 73); one of combined supplementation with data reported at two months (Wood 2003) and one of selenium supplementation reported at five months (Portal 1995a). There was a significant improvement in GPX for both combined supplementation, MD 1.60 units per gram of haemoglobin (U/g Hb) (95% CI 0.30 to 2.90) and for selenium supplementation, MD 10.20 U/g Hb (95% CI 2.22 to 18.18) (Analysis 1.10). This was not significant when combined, MD 4.96 U/g Hb (95% CI ‐3.26 to 13.19), and there was considerable heterogeneity (I² = 77%), probably due to the different supplements.
Only the study of combined supplements reported on superoxide dismutase (SOD) at two months and analysis showed that there was no significant difference between groups, MD 0.27 (95% CI ‐1.24 to 1.78) (Analysis 1.11).
c. Potency
One study of β‐carotene supplementation reported on antioxidant potency using trolox equivalent antioxidant capacity (TEAC) as an outcome measure (Renner 2001). At six months, there was no significant different found between supplement and placebo groups, MD 0.04 (95% CI ‐0.17 to 0.25) (Analysis 1.12).Two studies reported on total plasma antioxidant capacity, though by different methods which did not allow combined analysis; neither study found a significant difference between intervention and control groups at any time point (Renner 2001; Sagel 2018). Renner reported plasma total antioxidant capacity at three and six months after supplementation with β‐carotene, MD 0.10 nmol (95% CI ‐0.18 to 0.38) and MD 0.04 nmol (95% CI ‐0.30 to 0.38), respectively (Analysis 1.13). Sagel reported at one and four months after supplementation with a multivitamin with an additional antioxidant or just a multivitamin: at one month, MD 0.00 (log (10) CRE) (95% CI ‐0.02 to 0.02); and at four months, MD ‐0.01 (log (10) CRE) (95% CI ‐0.04 to 0.02) (Analysis 1.14).
d. Plasma and sputum antioxidant status
i. Vitamin E
Five studies (n = 224) provided data for this outcome (Harries 1971; Levin 1961; Sagel 2018; Visca 2015; Wood 2003). Two studies supplemented antioxidants in form of vitamin E as D,L‐α‐tocopheryl acetate (Harries 1971; Levin 1961); Harries supplemented with both fat‐soluble and water‐miscible forms of vitamin E (Harries 1971). Wood supplemented vitamin E as RRR‐α‐tocopherol as part of a combined antioxidant supplement (Wood 2003) and Sagel supplemented vitamin E together with other antioxidants in a multivitamin supplement (Sagel 2018). A further study supplemented with oral GSH (Visca 2015). In the blood, vitamin E binds to lipoproteins and therefore reporting the ratio between the vitamin E levels and total lipids is more accurate than the plasma vitamin E levels, However, only the measurement of plasma vitamin E levels was common to all the included studies.
The supplementation led to significantly increased plasma levels of vitamin E in favour of treatment for all supplements at all time points as follows (Analysis 1.15); however, please note that the control group in the Harries study is the same group of participants in the comparison of fat‐soluble vitamin E versus control and water‐miscible vitamin E versus control (Harries 1971) (see Table 3). The difference between oral GSH and control groups was less than the supplements containing vitamin E; however, the effect of oral GSH supplementation on the serum levels of vitamin E is indirect (increase regeneration of the oxidized vitamin E) compared to the direct supplementation with vitamin E.
| Supplement | Time point | Result |
| Fat‐soluble vitamin E | 1 month | MD 13.47 μmol/L (95% CI 9.05 to 17.89) |
| Water‐miscible vitamin E | 1 month | MD 26.7μmol/L (95% CI 15.90 to 37.50) |
| 2 months | MD 11.61 μmol/L (95% CI 4.31 to 18.91) | |
| 6 months | MD 19.73 μmol/L (95% CI 12.48 to 26.98) | |
| Combined supplement | 2 months | MD 10.20 μmol/L (95% CI 5.21 to 15.19) |
| Oral GSH | 6 months | MD 4.26 μmol/L (95% CI 2.03 to 6.49) |
| Antioxidant‐enriched multivitamin | 1 month | MD ‐3.48 μmol/L (95% CI ‐8.01 to 1.05) |
| 4 months | MD ‐1.86 μmol/L (95% CI ‐6.36 to 2.64) |
CF: cystic fibrosis
CI: confidence interval
GSH: glutathione
MD: mean difference
One study included in the review reported changes in the serum vitamin E levels without SDs which make them unsuitable for the meta‐analysis (Keljo 2000). The study reported that levels increased from 28.2 to 35 μM/L with vitamin E treatment and from 25.4 to 28.6 μM/L in the placebo group. Baseline serum vitamin E levels were not reported and the paper states "the baseline serum α‐tocopherol level did not differ between the placebo and α‐tocopherol groups, and there was no difference in the baseline α‐tocopherol levels between subgroups (data not shown)".
ii. β‐carotene
One study (n = 46) included β‐carotene as part of a combined antioxidant supplement (Wood 2003), two studies included it as a single supplement (Homnick 1995b; Renner 2001) and one study investigating an antioxidant‐enriched multivitamin supplement containing mixed carotenoids (lutein, zeaxanthin and lycopene) also reported on β‐carotene levels (Sagel 2018). However, only two studies (n = 70) presented data suitable for analysis (Renner 2001; Wood 2003). There was a significant improvement in β‐carotene levels in favour of both combined supplementation at two months, MD 0.10 μmol/L (95% CI 0.02 to 0.18) and single β‐carotene supplementation at six months, MD 0.24 μmol/L (95% CI 0.02 to 0.46) (Analysis 1.16). When combined, the results from all supplements were also significant, MD 0.13 (95% CI 0.02 to 0.25) with only low heterogeneity (I² = 27%).
Sagel reported a significantly higher level of β‐carotene was reported at four months with a mean change from baseline of 0.04 μg/mL in the group taking the antioxidant‐enriched multivitamin supplement (Sagel 2018). Homnick reported that the mean (SD) serum levels of β‐carotene increased significantly from baseline 0.09 (0.02) μmol/L to 0.62 (0.19) μmol/L during supplementation with β‐carotene; however, no data are available for the β‐carotene serum levels in the control group and therefore these results could not be included in the analysis (Homnick 1995b). It is stated in the paper that "no control patient had a significant increase in β‐carotene levels throughout the duration of the study" and a mean (SD) baseline of 0.12 (0.05) μmol/L is given, but it is not clear which participants are included.
iii. Selenium
Two studies (n = 73) supplemented selenium (Portal 1995a; Wood 2003). Both the combined supplementation at two months, MD 0.60 μmol/L (95% CI 0.39 to 0.81) (Wood 2003) and the single supplementation at five months, MD 0.39 μmol/L (95% CI 0.27 to 0.51) (Portal 1995a) showed a significant improvement in plasma selenium status in favour of antioxidant supplementation (Analysis 1.17). The combined results from the two studies were also significant, MD 0.48 μmol/L (95% CI 0.27 to 0.68) but with substantial heterogeneity (I² = 65%).
iv. Vitamin C
One study (n = 46) supplemented vitamin C as part of a combined antioxidant supplementation (Wood 2003); there was no significant difference in improvement between antioxidant and control, MD 8.00 μmol/L (95% CI ‐15.05 to 31.05) (Analysis 1.18).
v. GSH in plasma and sputum
One study (n = 61) comparing oral NAC to placebo reported on the change from baseline in GSH in whole blood which we are reporting here (Conrad 2015); there was no difference found between groups at either three months, MD 19.00 μmol/L (95% CI ‐183.58 to 221.58) or at six months, MD 64.10 (95% CI ‐170.05 to 298.25) (Analysis 1.19). In a further study (n = 21) NAC was administered in a high dose of 2800 mg for 12 weeks and the authors reported on extracellular glutathione in induced sputum and blood plasma compared to baseline (Dauletbaev 2009). The median (range) value of total glutathione in induced sputum increased from 18.6 μM (2.8 to 32.14) to 31.3 μM (0.2 to 44.3) but this difference did not reach statistical significance. Concentrations of extracellular total glutathione in blood plasma were measured using medians (range) at baseline 1 μM (0.9 to 1.3) and end of treatment 1.4 μM (1 to 1.9). Due to the lack of clarity of the measurements (extracellular total glutathione in blood plasma in the paper and total blood glutathione in the additional data received from the author), as well as due to apparently a different measurement method, these data have not been used in the analysis.
e. Plasma fatty‐acid status
One study (n = 46) of a combined antioxidant supplementation examined this outcome (Wood 2003); at two months the data showed no significant difference between groups, MD 166.00 mg/L (95% CI ‐61.38 to 393.38) (Analysis 1.20).
2. Inflammation
a. Inflammatory markers (i.e. IL‐6, IL‐8, TNF‐α, IL‐1β)
Keljo measured plasma levels of IL‐6 and TNF‐α at three months in three subgroups of participants defined according to lung function and treatment with dornase alfa (DNase) (Keljo 2000). The results from our analyses (Analysis 1.21; Analysis 1.22) are summarised in the additional tables (Table 4). Only the result for TNF‐α (pg/mL) in 11 participants with FEV1 measurements between 70% and 85% taking DNase was statistically significant (in favour of the antioxidant) (Analysis 1.22).
| Subgroup | IL‐6 (pg/mL) | TNF‐α (pg/mL) |
| FEV1 > 85% and no DNase | MD ‐2.02 (95% CI ‐4.63 to 0.59) | MD ‐1.37 (95% CI ‐3.61 to 0.87) |
| FEV1 > 85% and no DNase | MD ‐0.31 (95% CI ‐4.03 to 3.41) | MD 0.33 (95% CI ‐0.49 to 1.15) |
| FEV1 range 70% ‐ 85% and DNase | MD ‐0.24 (95% CI ‐3.80to 3.32) | MD ‐0.94 (95% CI ‐1.61 to ‐0.26) |
CI: confidence interval
FEV1: forced expiratory volume in 1 second
MD: mean difference
Conrad reported on the change from baseline in plasma IL‐8 pg/mL (log 10) and found no difference between groups at three months, MD 0.01 pg/mL (log 10) (95% CI ‐0.19 to 0.21) or six months, MD ‐0.09 pg/mL (log 10) (95% CI ‐0.32 to 0.14) (Analysis 1.23).
Three studies reported on sputum levels of IL‐8 (pg/mL) (Conrad 2015; Dauletbaev 2009; Sagel 2018). Two studies compared oral NAC to control at three months (Conrad 2015; Dauletbaev 2009); data showed no significant difference between groups at this time point, MD ‐0.01 pg/mL (95% CI ‐0.15 to 0.14) (Analysis 1.24). Sagel (multivitamin enriched with antioxidant versus a multivitamin alone) also found no difference between groups at four months, MD ‐0.06 pg/mL (95% CI ‐0.24 to 0.12), as did Conrad at six months, MD 0.19 (95% CI ‐0.03 to 0.41) (Analysis 1.24).
Conrad also assessed sputum neutrophil count and found no difference between oral NAC or control groups at either three months, MD 1.90 (95% CI ‐8.08 to 11.88) or six months, MD 2.60 (95% CI ‐11.85 to 17.05) (Analysis 1.26). Dauletbaev assessed the number of leukocytes in induced sputum at three months and reported that the number of leukocytes (which were predominantly neutrophils) did not change significantly during NAC treatment (Dauletbaev 2009). The total number (median (range)) of leukocytes was 31.5 (20 to 113.7) x 106 at the start of the treatment with NAC 2800 mg/daily, 48.6 (42.6 to 186.2) x 106 after three weeks of treatment and 36.8 (19.9 to 110.8) x 106 after additional nine weeks of high‐dose oral NAC. The results from these two studies were though not suitable for combination due to different units of measurement.
Conrad reported the change from baseline in sputum human neutrophil elastase (log 10) (mg/mg) per weight at three months, MD ‐0.04 (95% CI ‐0.24 to 0.16) and six months, MD 0.11 (95% CI ‐0.11 to 0.33); neither result was statistically significant (Analysis 1.25).
The study comparing a multivitamin enriched with an antioxidant and a control multivitamin preparation reported sputum myeloperoxidase (MPO) levels at four months, but found no difference between groups, MD ‐0.13 (log 10) (ng/mL) (95% CI ‐0.48 to 0.22) (Analysis 1.27).
b. Hyperinflation of chest
No studies examined this outcome.
3. Nutritional status
a. BMI
One study comparing NAC to placebo reported the change from baseline in BMI at three and six months (Conrad 2015). There were no differences between groups at either three months, MD 0.30 (95% CI ‐0.02 to 0.62), or at six months, MD 0.20 (95% CI ‐0.23 to 0.63) (Analysis 1.28). The evidence for this outcome at six months is of moderate quality and was only downgraded due to imprecision from the small number of participants (summary of findings Table for the main comparison).
One study measured the effects of supplementing β‐carotene on BMI, but only reported baseline values and stated that there was a non‐significant effect of supplementation on this outcome (Renner 2001). We were unable to obtain full data for this outcome from the study investigators.
b. BMI percentile
One study reported on the change in BMI percentile after three and six months of oral supplementation with GSH (Visca 2015). BMI percentile increased significantly more with GSH supplementation than control after both three months, MD 9.20% (95% CI 6.22 to 12.18) and after six months, MD 17.20% (95% CI 14.35 to 20.05) (Analysis 1.29). The quality of this evidence was found to be moderate and was downgraded due to imprecision from the small number of participants (summary of findings Table for the main comparison).
c. Weight
Three studies reported on the change in weight from baseline measured in kg at three and six months (Conrad 2015; Levin 1961; Mitchell 1982). Combined data from the Conrad and Mitchell studies (both comparing NAC to control) at three months showed no significant difference between groups, MD 0.24 kg (95% CI ‐0.73 to 1.22); but there was substantial heterogeneity (I² = 66%). This is probably due to differences in the standard of CF care in 1982 and 2015 (Conrad 2015; Mitchell 1982). The Conrad study also showed no significant difference between NAC treatment and placebo at six months, MD 0.60 kg (95% CI ‐0.51 to 1.71). Additionally, Levin showed no difference between vitamin E supplementation and placebo at six months, MD ‐0.30 kg (95% CI ‐7.19 to 6.59) (Analysis 1.30).
d. Weight percentile
One study reported on the change in weight percentile from baseline after three and six months of GSH supplementation (Visca 2015). Weight percentile increased significantly more with GSH than control at three months, MD 8.10% (95% CI 5.64 to 10.56) and also at six months, MD 17.00% (95% CI 14.64 to 19.36) (Analysis 1.31).
Sagel reported that at four months there was no difference in weight z scores between the intervention and control group; the 16‐week difference in unadjusted weight z score was 0.07 (95% CI ‐0.10 to 0.25; P = 0.41) (Sagel 2018).
4. Antibiotic days
The number of antibiotic days per participant in both treatment groups was reported in two studies (n = 70) (Renner 2001; Wood 2003). No significant difference between groups was found either after two months of a combined supplement, MD 4.00 (95% CI ‐14.06 to 22.06), or after six months of β‐carotene supplementation, MD ‐8.00 (95% CI ‐18.78 to 2.78) (Analysis 1.32). The combined result was also not significant, MD ‐4.28 (95% CI ‐15.16 to 6.60).
Two studies reported the number of participants with pulmonary exacerbations requiring antibiotics (Conrad 2015; Sagel 2018). There was no difference in the comparison of multivitamins with antioxidant to multivitamin alone at four months, RR 0.78 (95% CI 0.53 to 1.14), or in the comparison of NAC to control at six months, RR 0.83 (95% CI 0.50 to 1.390, or when combined, RR 0.80 (95% CI 0.59 to 1.09) (Analysis 1.33). Conrad also reported no difference in the number of participants hospitalised, RR 0.94 (95% CI 0.49 to 1.81) (Analysis 1.34). Sagel analysed the risk of first pulmonary exacerbation using a co‐variate‐adjusted hazard ratio (adjusted to account for a higher number of participants over the age of 30 in the control group); we present the result directly from the paper. There was a significantly lower risk of first pulmonary exacerbation in the antioxidant group than the control group at four months, HR 0.5 (95% CI 0.25 to 0.98) (P = 0.04) (Sagel 2018). This evidence was deemed to be low quality due to risk of bias within the study and low event rates.
5. Adverse events
While it was possible to identify specific adverse events, the rates of specific events were not calculable due to inadequate reporting. A total of 11 studies reported on adverse events or deaths during the study (Conrad 2015; Dauletbaev 2009; Götz 1980; Keljo 2000; Levin 1961; Mitchell 1982; Portal 1995a; Renner 2001; Sagel 2018; Stafanger 1989; Visca 2015).
Adverse events
Two parallel studies reported that no side‐effects were noticed in either the placebo or the active treatment (both of which were NAC) (Götz 1980; Mitchell 1982) and one cross‐over study of β‐carotene reported that no adverse events occurred (Renner 2001); but we deemed the quality of this evidence to be very low.
We were able to analyse adverse event data from three studies; one three‐month study assessing a form of vitamin E (Keljo 2000; low‐quality evidence (summary of findings Table 2)), one four‐month study assessing a multivitamin enriched with an antioxidant (Sagel 2018; low‐quality evidence; summary of findings Table 5) and one six‐month study assessing NAC (Conrad 2015; moderate‐quality evidence; summary of findings Table for the main comparison). None of the results were statistically significant (Analysis 1.35). All three studies reported on sinusitis, OR 1.58 (95% CI 0.38 to 6.55), distal intestinal obstruction syndrome, OR 0.47 (95% CI 0.09 to 2.34) and diarrhoea, OR 1.76 (95% CI 0.58 to 5.32). Two studies reported on pulmonary exacerbations, OR 0.57 (95% CI 0.23 to 1.41) (Keljo 2000; Sagel 2018); and two studies reported on elevated liver enzymes, OR 3.04 (95% CI 0.31 to 30.19) (Conrad 2015; Keljo 2000). Conrad reported a lack of signs of pulmonary hypertension, which was the focus of the safety study in the first eight weeks of the study and which included a subset of 16 participants from the Stanford CF Center. Additional data obtained after contacting the author presented various adverse effects, especially gastrointestinal, that have been used in the analysis (Analysis 1.35)
Dauletbaev reported comparable numbers of mild to moderate adverse effects in both groups (NAC 700 mg/daily or 2800 mg NAC/daily) most of which were exacerbations of CF lung disease. There were three adverse effects rated as serious, but these were not considered to be related to the study medication (two polypectomia and one haemoptysis during common cold) (Dauletbaev 2009). One adverse effect (gastrointestinal bleeding) was considered to have a "possible" relationship to the medication (Dauletbaev 2009).
In the 1989 study, Stafanger reported the number of people with adverse events which led to them being excluded from the study (Stafanger 1989). Investigators reported that one individual in the NAC group developed Quincke's oedema and one developed exanthema; in both cases symptoms disappeared when the treatment was stopped. Two participants complained of abdominal pain, one from the NAC group and one from the placebo group. One participant complained of more frequent coughing that was less productive while taking NAC (Stafanger 1989).
The Visca study presented participants' self‐reported qualitative gastrointestinal symptoms (abdominal pain, belching, flatulence, lack of appetite, bloating, nausea. vomiting, heartburn, diarrhoea and bowel movements (more than twice‐daily or less than twice‐weekly)) during the course of the study and divided the participants in groups with improved symptoms, no change or worsened symptoms (Visca 2015). The investigators reported a trend towards improvement of the symptoms in participants treated with GSH.
Deaths
Keljo reported there were no deaths during the study (Keljo 2000). One of the cross‐over studies stated that one death occurred in the group which received selenium first followed by placebo; however, investigators did not state a time point or period during which the death occurred, other than to say that only baseline data were used in the analysis (Portal 1995a). Another study of vitamin E reported three deaths, all of which were in the control group (Levin 1961).
Inhaled antioxidant supplementation versus control
One study reported separate data for a pediatric cohort and an adult cohort; in order to present these data separately we have generated two study IDs for one single study, one for the adult data (Calabrese 2015a) and one for the pediatric data (Calabrese 2015b).
Primary outcomes
1. Lung function tests
a. FEV1
Four out of five studies of inhaled GSH and NAC report data on FEV1 (Bishop 2005; Calabrese 2015a; Calabrese 2015b; Griese 2013).
i. Change from baseline FEV1 (L)
Two studies provided data for this outcome (Calabrese 2015a; Calabrese 2015b; Griese 2013). Calabrese reported data at one, three, six and nine months separately for adults (18 years and older) and children (age between 6 and 18 years) and these have been entered separately in our analysis (Calabrese 2015a; Calabrese 2015b). Based on the mean age of the participants included in the study of Calabrese, the data of the adult group (mean (SD) age 28.9 (9.4) years) were chosen to be combined to the data from the study of Griese (mean (SD) age 23.1 (9.8) years) in a secondary analysis to assess the effect of age on the results. In the original paper, Griese reported graphically the change from baseline in FEV1 (L) at one, three and six months (Griese 2013).
At one month, the combined data from all participants reporting on the change from baseline FEV1 (L) showed no significant difference between groups, MD 0.05 L (95% CI ‐0.01 to 0.11). This remained non‐significant when the pediatric data were removed and just the adult data combined, MD 0.05 L (95% CI ‐0.02 to 0.11). At three months, results for all participants significantly favoured the inhaled GSH group, MD 0.09 L (95% CI 0.03 to 0.15) and remained so when the pediatric data were removed, MD 0.09 L (95% CI 0.02 to 0.16). At six months, data for all participants just significantly favoured the antioxidant group, MD 0.07 L (95% CI 0.00 to 0.14), but became non‐significant when the pediatric data were removed, MD 0.06 L (95% CI ‐0.01 to 0.14). At nine months, only Calabrese reported data for this outcome; results were not significant for either the adult population or the pediatric population or combined data, MD 0.03 L (95% CI ‐0.14, 0.20). Similarly at 12 months, only Calabrese reported data for this outcome; and again results were not significant for either the adult population or the pediatric population or combined data, MD ‐0.00 (95% CI ‐0.13 to 0.12) (Analysis 2.1).
ii. Change from baseline FEV1 (% predicted)
Two studies provided data for the change from baseline (% predicted) in the published papers (Bishop 2005; Calabrese 2015a; Calabrese 2015b). The first author of the Griese paper provided values for FEV1 % predicted on request (Griese 2013).
At one month, data from all participants in the Calabrese and Griese studies were not statistically significant, MD 1.91% (95% CI ‐0.07 to 3.88); this was also true when the data from just the adult participants from the Calabrese study were combined with the Griese study, MD 1.66% (95% CI ‐0.41 to 3.72) (Analysis 2.2). There were also no differences between groups in the Bishop study at two months, MD 0.90% (95% CI ‐6.45 to 8.25). At three months data from all participants in the Calabrese and Griese studies significantly favoured the antioxidant group, MD 3.50% (95% CI 1.38 to 5.62), which remained when the pediatric data were removed, MD 3.68 (95% CI 1.17 to 6.19). We rated the quality of this evidence to be moderate; downgraded once due to risk of bias in the included studies (summary of findings Table 6). Combined six‐month data for all ages showed no difference between groups, MD 2.30% (95% CI ‐0.12 to 4.71), nor did the combined data from Calabrese adult population and the Griese study, MD 2.17% (95% CI ‐1.07 to 5.41) (Analysis 2.2). Again, we deemed the quality of this evidence to be moderate (summary of findings Table 6). Only Calabrese reported data at nine and 12 months; data for the combined adult and pediatric populations showed no difference between treatment and control, at nine months, MD 2.52% (95% CI ‐4.61 to 9.65) and at 12 months, MD 2.96% (95% CI ‐2.54 to 8.46). However, results were significantly in favour of GSH for the adult population at both nine months, MD 5.47% (95% CI 0.97 to 9.97) and 12 months, MD 5.45% (95% CI 0.46 to 10.44) (Analysis 2.2).
b. FVC
Three studies provided data for FVC (Bishop 2005; Calabrese 2015a; Calabrese 2015b; Griese 2013). Investigators on the Calabrese study provided values for FVC in L and % predicted upon request (Calabrese 2015a; Calabrese 2015b); likewise values for FVC % predicted were obtained from the first author of the Griese study after contact (Griese 2013).
i. Change from baseline FVC (L)
Data from the Calabrese (whole population) and Griese studies showed no differences between groups in FVC (L) at one month, MD 0.05 L (95% CI ‐0.01 to 0.12), results were also non‐significant when we analysed just the adult population from Calabrese with the Griese data (Calabrese 2015a; Griese 2013). At three months, results for the whole population were just significant in favour of antioxidant supplementation, MD 0.08 L (95% CI 0.01 to 0.16), but non‐significant when the pediatric data were removed, MD 0.07 L (95% CI ‐0.01 to 0.15). At six months, there was no difference between groups for the whole population, MD 0.05 L (95% CI ‐0.03 to 0.13) or for the adult population only, MD 0.02 L (95% CI ‐0.07 to 0.12) (Analysis 2.3). Only Calabrese reported data at nine and 12 months and again there were no differences for the whole cohort at either time point; nine months, MD 0.01 L (95% CI ‐0.17 to 0.19) and 12 months, MD ‐0.01 L (95% CI ‐0.10 to 0.09); results were also non‐significant for the individual age groups (Analysis 2.3).
ii. Change from baseline FVC (% predicted)
All three studies provided data for the change from baseline in FVC % predicted (Bishop 2005; Calabrese 2015a; Calabrese 2015b; Griese 2013). At one month, results from Calabrese (whole population) and Griese showed no difference between groups, MD 2.12% (95% CI ‐0.23 to 4.47); this was also true when the paediatric results from the Calabrese study were removed from the analysis, MD 3.02% (95% CI ‐1.89 to 7.92) (Analysis 2.4). Only Bishop reported data at two months and this result was also not statistically significant, MD 0.60% (95% CI ‐6.53 to 7.73). However, at three months data from Calabrese and Griese showed a significant difference in favour of the antioxidant for all participants, MD 3.60% (95% CI 1.33 to 5.88). When we considered the different age groups from the Calabrese study, the paediatric data, MD 5.06% (95% CI ‐0.28 to 10.40) were non‐significant, but the adult data (both studies) did show a difference, MD 3.28% (95% CI 0.77 to 5.79) (Analysis 2.4). At six months, results were again non‐significant both with the pediatric data, MD 3.33% (95% CI ‐0.62 to 7.27) and when just considering the adult data, MD 2.71% (95% CI ‐2.64 to 8.07) and also for all participants combined, MD 3.33% (95% CI ‐0.62 to 7.27). Only Calabrese reported data at nine months when the overall result and the pediatric data were non‐significant, MD 5.48% (95% CI ‐1.76 to 12.73) and MD 1.46% (95% CI ‐6.45 to 9.38) respectively; however, the adult‐only data were statistically significant, MD 8.88% (95% CI 2.18 to 15.59). At 12 months again only Calabrese provided data; these were not statistically significant when combined, MD 4.27% (95% CI ‐0.00 to 8.54), results for both age groups were also not statistically significant (Analysis 2.4).
2. QoL
Three studies reported on QoL (Bishop 2005; Calabrese 2015a; Calabrese 2015b; Griese 2013). Two studies used different versions of the validated CFQoL ‐ Calabrese used the Italian version (Calabrese 2015a; Calabrese 2015b) and Griese used the German version (Griese 2013).
Griese reported the change from baseline in total score and found no significant differences between groups at one month, MD 2.20 (95% CI ‐0.23 to 4.63), three months, MD 1.20 (95% CI ‐1.46 to 3.86) and six months, MD 0.80 (95% CI ‐1.63 to 3.23) (Analysis 2.5). Griese also reported the change from baseline in respiratory score and likewise found no significant differences between groups at one month, MD 2.70 (95% CI ‐2.15 to 7.55), three months, MD ‐0.50 (95% CI ‐4.80 to 3.80) and six months, MD ‐3.30 (95% CI ‐8.05 to 1.45) (Analysis 2.5). We rated the quality of this evidence to be moderate and being downgraded due to risk of bias from lack of blinding (summary of findings Table 6).
Calabrese reported CF QoL as mean (SD) in GSH and placebo groups at baseline and after 12 months for a range of age groups and found no statistical significant difference (Table 5). As the German and Italian questionnaires assess QoL in different ways and the number of participants in each age group were not provided, the data from Calabrese study could not be used in the meta‐analysis.
| Study ID | Age | GSH | Placebo | ||
| Baseline mean (SD) | At 12 months mean (SD) | Baseline mean (SD) | At 12 months mean (SD) | ||
| Over 18 years | 882.75 (147.63) | 891.69 (165.09) | 871.18 (124.56) | 879.47 (139.9) | |
| 14 to 18 years | 949.23 (82.94) | 955.34 (94.95) | 1044.5 (65.53) | 1049.12 (76.87) | |
| 12 ‐ 13 years | 506.12 (34.15) | 527.39 (132.25) | 679.24 (55.79) | 705.55 (40.93) | |
| 12 ‐ 13 years (parents) | 634.93 (122.59) | 643.06 (75.86) | 975.34 (57.05) | 959.79 (130.95) | |
| 6 to 11 years | 544.21 (127.59) | 925.16 (104.95) | 573.64 (103.19) | 574.95 (107.73) | |
| 6 to 11 years (parents) | 771.79 (231.05) | 779.59 (222.27) | 745.23 (164.84) | 767.59 (154.02) | |
GSH: glutathione
SD: standard deviation
Bishop used a self‐reported scale (not validated), which we do not present in the analysis (Bishop 2005).
Secondary outcomes
1. Oxidative stress
a. hydrogen peroxide (H2O2) exhalation
Only one study reported this parameter at 12 months (Calabrese 2015a; Calabrese 2015b). No significant difference between the groups was observed at 12 months, MD ‐0.16 (95% CI ‐0.40 to 0.09) (Analysis 2.7).
b. lipid peroxidation (8‐isoprostanes) in sputum
Griese measured 8‐isoprostane in the sputum of a small number of participants and reported data at three and six months (Griese 2013). Neither result was significant, but the level of lipid peroxidation was lower in the group treated with antioxidants at both three months, MD ‐51.30 (95% CI ‐128.22 to 25.62) and six months, MD ‐5.60 (95% CI ‐95.70 to 84.50) (Analysis 2.8).
c. antioxidant enzyme function (post hoc change)
None of the studies reported this parameter (Bishop 2005; Calabrese 2015a; Calabrese 2015b; Griese 2013; Howatt 1966).
d. potency (post hoc change)
None of the studies reported this parameter (Bishop 2005; Calabrese 2015a; Calabrese 2015b; Griese 2013; Howatt 1966).
e. sputum and plasma antioxidant status
One study measured levels of free and total GSH and its metabolites in sputum (Griese 2013). At both one month and three months, there was no statistically significant difference in free GSH between groups, MD 131.30 pM (95% CI ‐36.81 to 299.41) and MD 81.40 pM (95% CI ‐8.01, 170.81), respectively; however, data did show a significant difference in free GSH at six months in favour of the GSH group, MD 59.10 pM (95% CI 3.68 to 114.52) (Analysis 2.9). Conversely, results for total GSH were significant in favour of the GSH group at one and three months, MD 405.30 pM (95% CI 105.27 to 705.33) and MD 329.20 pM (95% CI 167.04 to 491.36) respectively, while the results at six months were not statistically significant, MD 273.50 pM (95% CI ‐19.52 to 566.52) (Analysis 2.10).
Griese also measured intracellular levels of GSH in neutrophils in the sputum in a small subgroup of participants (eight out of 73 in the GSH group and eight out of 80 in the placebo group) at one, three and six months (Griese 2013). No difference between groups was seen at one month, MD 0.80 mean fluorescence intensity (MFI) (95% CI ‐0.06 to 1.66), but statistically significant differences between the two groups were found for GSH levels at three and six months, MD 3.70 MFI (95% CI 0.27 to 7.13) and MD 4.40 MFI (95% CI 1.52 to 7.28) respectively (Analysis 2.11).
Griese also measured levels of free and total GSH and its metabolites in plasma, but only at six months (Griese 2013). No statistically significant differences between the two groups were found for either of these levels; free GSH, MD 2.20 pM (95% CI ‐1.44 to 5.84) and total GSH, MD 0.80 pM (95% CI ‐2.07 to 3.67) (Analysis 2.12; Analysis 2.13).
The intracellular levels of GSH in neutrophils in the blood were reported by Griese at the six‐month time point for a subset of participants (four out of 73 participants in the GSH group and nine out of 80 participants in the placebo group) (Griese 2013). Results were not statistically significant, ‐2.90 MFI (95% CI ‐12.39 to 6.59) (Analysis 2.14).
f. plasma fatty acid status
None of the studies reported this outcome (Bishop 2005; Calabrese 2015a; Calabrese 2015b; Griese 2013).
g. Carbonylated proteins
One study measured carbonylated proteins in the sputum of a subgroup of participants as a marker of oxidative stress (Griese 2013). No statistical significant difference was found for the change from baseline in levels of protein carbonyls in the sputum at one, MD 4.20 U (95% CI ‐7.92 to 16.32), three, MD ‐0.10 U (95% CI ‐13.20 to 13.00), or six months, MD 10.70 U (95% CI ‐2.63 to 24.03) (Analysis 2.15).
2. Inflammation
a. inflammatory markers (i.e. IL‐6, IL‐8, IL‐10,TNF‐α, IL‐1β)
One study analysed levels of these cytokines and chemokines in the sputum of a subgroup of participants (24 out of 73 participants in the GSH group and 29 out of 80 participants in the placebo group) at six months (Griese 2013). No statistically significant differences between the two groups in change in levels from baseline were found: IL‐8, MD ‐478.30 pg/mL (95% CI ‐1536.75 to 580.15) (Analysis 2.16); IL‐10, MD ‐0.20 pg/mL (95% CI ‐10.12 to 9.72) (Analysis 2.17); and TNF‐α, MD 19.80 pg/mL (95% CI ‐50.33 to 89.93) (Analysis 2.18).
b. hyperinflation of chest
None of the studies reported this outcome (Bishop 2005; Calabrese 2015a; Calabrese 2015bGriese 2013).
3. Nutritional status
a. BMI
Two studies reported analysable data for the change in BMI from baseline to the end of the study (Bishop 2005; Calabrese 2015a; Calabrese 2015b). At two months, no statistically significant difference was found between groups, MD 0.10 (95% CI ‐0.74 to 0.94) (Bishop 2005) (Analysis 2.19). At 12 months investigators found no difference in BMI between the placebo group compared to the GSH group for the total population, MD 0.04 (95% CI ‐8.20 to 8.27); this was also true for the separate adult and pediatric populations (Analysis 2.19).
b. Weight
A third study measured the change in weight from baseline to one, three and six months (Griese 2013). There was a statistically significant gain in weight in the GSH group after three months, MD 1.00 kg (95% CI 0.39 to 1.61), but results at one and six months were not significant, MD 0.10 kg (95% CI ‐0.23 to 0.43) and MD 0.30 kg (95% CI ‐0.37 to 0.97), respectively (Analysis 2.20).
4. Pulmonary exacerbations requiring intravenous antibiotic therapy or hospitalisation
Two studies reported data on the number of pulmonary exacerbations during the study and also the mean number of days until the first pulmonary exacerbation (Calabrese 2015a; Calabrese 2015b; Griese 2013). There was no difference between groups in the number of exacerbations recorded in the Griese study at six months, MD ‐0.09 (95% CI ‐0.30 to 0.12) or in the Calabrese study (total cohort) at 12 months, MD ‐0.18 (95% CI ‐0.60 to 0.23) (Analysis 2.21).
The six‐month study reported no significant difference between groups in the time to the next exacerbation or the number of exacerbations. The data were skewed and the study authors used an appropriate analysis in their paper; we are unable to reproduce their results without individual patient data (Griese 2013). In the 12‐month study (Calabrese 2015a; Calabrese 2015b), there was no statistical difference observed between groups, MD ‐6.74 days (95% CI ‐48.76 to 35.27) (Analysis 2.22).
5. Adverse events
The number of participants with specific adverse events were reported by all three studies (Bishop 2005; Calabrese 2015a; Calabrese 2015b; Griese 2013), but only 'rhinitis/sinusitis or upper respiratory tract infection', 'headache' and 'haemoptysis' were reported by all the three studies (Analysis 2.23). Two of the studies reported on each of the events cough, pharyngitis, stomach pain, chest pain, and nose bleed (Bishop 2005; Griese 2013), but the remainder of the adverse events reported by one study only. None of the adverse reactions showed a statistically significant difference between groups inhaling GSH compared to placebo.
Regarding severity of adverse events, Bishop reported no serious adverse events (Bishop 2005). Calabrese reported that none of the reported adverse events led to discontinuation of the drug and that no death occurred (Calabrese 2015a; Calabrese 2015b). Griese reported that the number of serious adverse events were similar between the group treated with GSH inhalations and the placebo group (11% and 10%, respectively) (Griese 2013).
We assessed the quality of this evidence to be low because of risk of bias within the underlying studies in the blinding domain and low event rates (summary of findings Table 6).
Sensitivity Analysis
Since there were so few studies contributing data to the primary outcomes (which we could combine), a sensitivity analysis with regards to risk of bias was not conducted. However, this may be a useful analysis in the future, especially with respect to the high risk of incomplete data and selective reporting which plagues the current review. Sensitivity analyses excluding studies with industry funding was planned but not conducted.
Due to inadequacies of reporting numbers of enrolled participants, completed participants and analysed participants in most studies, an intention‐to‐treat analysis was not possible.
Publication bias
A funnel plot was not generated, since we were not able to include and combine a sufficient number of studies in this review (Light 1994). Also, only limited data were available for analysis from those included studies.
Discussion
Summary of main results
In the revised version of this review, we chose to extend the list of oral antioxidant micronutrients (vitamin E, vitamin C, β‐carotene and selenium) with GSH and NAC (as a precursor of GSH) administered orally. Both NAC or GSH can also be inhaled by people with CF and the effects of the two routes of administration are presented separately. Although NAC and GSH may work as both mucolytics as well as antioxidants, due to the fast hepatic metabolization of oral NAC, the main effect is presumably due to its antioxidant properties.
Oral supplementation
There appears to be conflicting evidence regarding the clinical effectiveness of oral supplementation with antioxidants in CF; however only a small number of studies contributed with data towards meta‐analysis. Of the eight studies reporting lung function measured by FEV1 (Conrad 2015; Dauletbaev 2009; Ratjen 1985; Renner 2001; Sagel 2018; Stafanger 1989; Visca 2015; Wood 2003), four (136 people with CF) provided data on the effect of NAC supplementation on the change from baseline in FEV1 % predicted at three months which could be combined; results showed no significant improvement (Conrad 2015; Dauletbaev 2009; Ratjen 1985; Stafanger 1989). However, it is important to mention that in these four studies the participants received NAC in differed dosages. In addition, the studies were conducted over 30 years from 1985 (Ratjen 1985) through to 2015 (Conrad 2015). In this period of time, both the standard of CF care and the life expectancy of people with CF have changed dramatically, making the comparison difficult to interpret. At six months, one study showed a significant improvement in FEV1 % predicted after supplementation with NAC (Conrad 2015) and a further study after supplementation with GSH (Visca 2015). Data from three other studies investigating oral antioxidant supplementation with combined antioxidants, β‐carotene or antioxidant‐enriched multivitamins did not show an improvement in lung function as reported at two months (Wood 2003), four months (Sagel 2018) or six months (Renner 2001). Due to the short half‐life of GSH (Reed 2008), repeated daily dosing for relatively extended time periods (six months) is essential for the effect. One two‐month study with 46 participants assessed QoL, and showed that an improvement in QoL actually favoured the control group (Wood 2003). However, no significant differences in CF Quality of Life Questionnaire ‐ Respiratory Domain were reported between NAC and placebo in the Conrad study at either three or six months (Conrad 2015). There was a significant difference between antioxidants and control in both improvement of glutathione peroxidase (GPX) and plasma antioxidant status for all antioxidants except vitamin C. There was an improvement in the blood levels of vitamin E in all studies that used supplementation with this vitamin, as well as in the study with oral GSH supplementation (Visca 2015), although vitamin E was administered in different forms and for different periods of time (Harries 1971; Levin 1961; Sagel 2018; Wood 2003). One study reported significant improvement in the nutritional status (weight percentile and BMI percentile) of children after oral supplementation with GSH (Visca 2015). No study showed any difference between treatment and control in terms of any measure of antibiotic use or pulmonary exacerbations. Adverse events were not adequately reported; there was only one death in a study of 27 participants reported, but this was not clearly attributable to the supplement (selenium) or placebo (Portal 1995a).
Inhaled supplementation
Three studies contributed to the analysis of supplementation with inhaled GSH (Bishop 2005; Calabrese 2015a; Calabrese 2015b; Griese 2013). The sizes of the Calabrese (n = 105) and the Griese (n = 153) studies are much larger than the Bishop study, which only randomised 19 participants. All studies reported the primary outcome of this review (lung function) at different time points and with a variety of units of measurement. An effect on the change from baseline in FEV1 % predicted in favour of the antioxidant supplementation was observed at three months by combining results from two studies, which were similar in relation to the included CF population and regimen of administration (Calabrese 2015a; Calabrese 2015b; Griese 2013). However, It has been shown that the final outcome of GSH inhalation therapy might be influenced by the sputum levels of gamma‐glutamyltransferase, an enzyme secreted by activated phagocytes that can rapidly degrade endogenous GSH as well as GSH exogenously administered by inhalations (Corti 2017). All studies in this comparison reported on QoL (Bishop 2005; Calabrese 2015a; Calabrese 2015b; Griese 2013). Although both Griese and Calabrese reported using validated methods, the methods and the units of measurements were different and therefore, unfortunately not comparable; when analysed individually neither study showed any difference in QoL between treatment and control. The levels of GSH, both the oxidized and reduced form, in the sputum, as well as the intracellular levels in sputum neutrophils were higher in those participants inhaling GSH compared to controls. No differences between the two groups were observed in levels of GSH in the blood (Griese 2013). Three studies reported on different measures of nutritional status (Bishop 2005; Calabrese 2015a; Calabrese 2015b; Griese 2013). In general there were no differences between treatment or control, but Griese did report a significant increase in weight in the antioxidant group at three months, which was not maintained at six months (Griese 2013). There were no differences in the number of pulmonary exacerbations in two studies, but one of these, a six‐month study, did report a significantly longer time frame until the first exacerbation occurred in the antioxidant group (Griese 2013). A wide range of adverse events were reported by three studies (Bishop 2005; Calabrese 2015a; Calabrese 2015b; Griese 2013), the most common being cough, pharyngitis, headache and hemoptysis; there was no difference between treatment or control groups in any adverse event.
Overall completeness and applicability of evidence
Based on the natural history of lung function changes in CF, power calculations demonstrate that approximately 400 participants would need to be enrolled and studied over a six‐month period of time if lung function decline, as the primary outcome, was to be halved over the course of the study (Konstan 2010). However, such studies needed to obtain an appropriate power are very difficult to conduct. In addition, a range of different doses of antioxidants have been used in the included studies that have been conducted over a considerable time‐span (from 1980s to 2017) characterized by highly different standards of CF care. All these confounders challenge the interpretation of the results.
For oral supplements, eight studies examined the primary outcome of lung function, but relatively few data contributed to the meta‐analysis: at three months (four studies). The absence of reporting of methods used to determine sample size in all of the included studies yields questions regarding minimum important difference of outcomes, possibly because these data do not exist for many of the biological markers used as primary outcomes.
There was one cross‐over RCT, from which complete data were only reported from the first period, thereby halving the intended sample size and yielding an underpowered study, which makes a significant difference undetectable (Portal 1995a). A completely reported sufficiently‐powered study is necessary before concluding that antioxidant supplementation had no effect on lung function. Specifically, investigators did not present baseline measurements for the second treatment period following the wash‐out period making assessment of carryover effect unfeasible. The authors of this review acknowledge that since only half of the intended population was included in meta‐analysis, issues of reduced power may prevent the study results from revealing true differences between intervention and control. This also contributed to the decision not to pool the treatment effect.
There was evidence that antioxidant supplementation improved plasma status for the respective micronutrient being supplemented. However, the correlation of plasma antioxidant status to clinically important outcome measures in CF has not been adequately explored.
For inhaled supplements, three studies contributed to the analysis and an effect on lung function in favour of the supplements was observed after three months of supplementation (based on two large studies, which used similar inhalation doses and regimen).
A common draw‐back of these studies is that the participants are intensively treated with inhaled antibiotics and other treatments that lead to a significant improvement of their lung function making further improvements by addition of antioxidants difficult to assess without very large number of participants.
Quality of the evidence
The quality of the evidence for the clinically important outcomes is presented in the summary of findings tables (summary of findings Table for the main comparison; summary of findings Table 2; summary of findings Table 3; summary of findings Table 4; summary of findings Table 5; summary of findings Table 6).
Oral supplementation
For the comparison of oral antioxidants versus comparator, the quality of evidence is affected by the fact that several different agents were included and could not be combined and so the resulting quality of evidence is lower due to small numbers of studies and few participants contributing to the outcome.
The overall quality of the evidence for the comparison of NAC or GSH was very low to moderate across all of the outcomes. Whilst four studies contributed data to the primary outcome of change in FEV1 at three months and no significant improvement was seen, the quality of the evidence was graded as being very low because of risk of bias in the underlying studies, particularly around the domains of allocation concealment and blinding, inconsistency of results and imprecision from low event rates. Although only one study contributed data to the change in FEV1 at six months, there was moderate quality of evidence in favour of the antioxidant (either NAC or GSH supplement) which was downgraded only due to a small sample size. For the same reasons, the quality of evidence for the remaining outcomes was also moderate (summary of findings Table for the main comparison). The remaining comparisons of oral supplementation included only one study in each and so the quality of the evidence reflected that of the underlying studies. The quality of the evidence for vitamin E compared to placebo was graded as low due to risk of bias in the study across several domains and only reporting on one of our selected outcomes (adverse events) (summary of findings Table 2). Similarly, the comparison of β‐carotene only reported on two of our primary and secondary outcomes, FEV1 % predicted at six months and adverse events, however the quality of this evidence was deemed to be very low due to unclear risk of bias across most domains in the underlying study, imprecision from a small sample size and publication bias (summary of findings Table 3). The comparisons of two different mixed combinations of antioxidants versus placebo did not report on any of our clinically important outcomes at the specified time points (summary of findings Table 4; summary of findings Table 5).
Inhaled supplementation
The quality of the evidence across most of the outcomes for inhaled antioxidants was low or moderate and was downgraded due to the risk of bias within the included studies, particularly around blinding caused by the intervention having a distinctive taste and smell. We found the quality of evidence for adverse events to be low due to low event rates for many of the reported adverse events (summary of findings Table 6).
Potential biases in the review process
No articles on the Cochrane Cystic Fibrosis and Genetic Disorders Group's CF Trials Register have been recorded as containing the terms 'vitamin C' or 'glutathione', hence these terms were not searchable keywords in that register. Previously, additional searches of other databases were conducted using these terms (seeAppendices).
Two studies reported data for the number of antibiotic days (Renner 2001; Wood 2003). Of those, one reported a range rather than a SD (Wood 2003). As such, the SD was imputed using the range yielding an inaccurate estimate, since ranges are distorted by outliers in the data. If the data from this study were to be excluded, the MD between groups would be ‐23.00 days (95% CI ‐34.71 to ‐11.29) (or 23 less days) in favour of antioxidants based on the remaining study (Renner 2001) and may better represent antioxidant effect on this outcome.
Agreements and disagreements with other studies or reviews
The data presented within this systematic review have not been previously synthesized. During the screening phase of this review, numerous case‐control and cohort studies on this topic were identified (seeCharacteristics of excluded studies) and such studies have been the basis for clinical trials in this area. Previous studies suggest that antioxidant micronutrients are likely to play a role in the oxidative stress that occurs in CF lung disease and have shown beneficial results (Winklhofer‐Roob 1994; Winklhofer‐Roob 1997a; Winklhofer‐Roob 2003; Wood 2002). However, the aim of this review was to obtain the most rigorous studies on which to base conclusion that have been asserted by multiple cohort and case‐control studies to date. In accordance with a previous review on the topic, oral supplementation with antioxidants does not show a beneficial effect on clinical outcomes, but does show an improvement in the laboratory measurements of the supplements (Galli 2012). According to results summarized in this review the administration of inhaled GSH seems to stop the deterioration in lung function in people with CF. This is in contrast to conclusions of a previous Cochrane Review analysing the use of nebulized and oral thiol derivatives, including NAC and glutathione, in people with CF (Tam 2013).

Peroxide chain reaction characterized by initiation, propagation and termination. (RH: PUFA; R·: free radical; ROO·: peroxide; ROOH: hydroxyl peroxide; AH: vitamin E; A·: oxidized Vitamin E. Adapted from: Tappel AL. Vitamin E and free radical peroxidation of lipids. Annals of the New York Academy of Sciences. 1972; 203(1):12‐28.

Study flow diagram.

Risk of bias graph: review authors' judgements about each methodological quality item presented as percentages across all included studies.

Risk of bias summary: review authors' judgements about each methodological domain for each included study.

Comparison 1 Oral antioxidants versus control, Outcome 1 Lung function: FEV1 (% predicted) (mean change from baseline).

Comparison 1 Oral antioxidants versus control, Outcome 2 Lung function: FVC (% predicted) mean change from baseline.

Comparison 1 Oral antioxidants versus control, Outcome 3 QoL: Quality of Well Being Scale.

Comparison 1 Oral antioxidants versus control, Outcome 4 Oxidative stress: lipid peroxidation (H2O2) (μmol/L).

Comparison 1 Oral antioxidants versus control, Outcome 5 Oxidative stress: lipid peroxidation (F2‐isoprostanes) (ng/L).

Comparison 1 Oral antioxidants versus control, Outcome 6 Oxidative stress: lipid peroxidation (malondialdehyde) (μmol/L) mea difference to baseline).

Comparison 1 Oral antioxidants versus control, Outcome 7 Oxidative stress: urine 8‐iso‐PGF2α log 10 (pg/mL).

Comparison 1 Oral antioxidants versus control, Outcome 8 Oxidative stress: sputum 8‐iso‐PGF2α log10 (pg/mL).

Comparison 1 Oral antioxidants versus control, Outcome 9 Oxidative stress: sputum 8‐OHdG (log10) ng/ml.
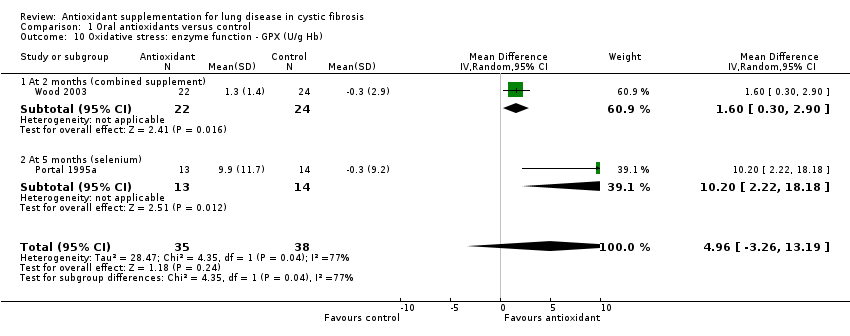
Comparison 1 Oral antioxidants versus control, Outcome 10 Oxidative stress: enzyme function ‐ GPX (U/g Hb).

Comparison 1 Oral antioxidants versus control, Outcome 11 Oxidative stress: enzyme function ‐ SOD (U/mg Hb).

Comparison 1 Oral antioxidants versus control, Outcome 12 Oxidative stress: potency (TEAC) (mmol/L).

Comparison 1 Oral antioxidants versus control, Outcome 13 Plasma total antioxidant capacity (nmol) (change from baseline).

Comparison 1 Oral antioxidants versus control, Outcome 14 Plasma total antioxidant capacity (log10) (CRE).

Comparison 1 Oral antioxidants versus control, Outcome 15 Plasma antioxidant status: vitamin E (μmol/L).
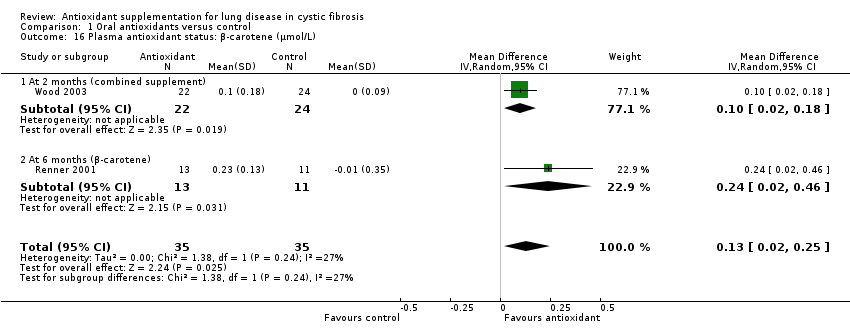
Comparison 1 Oral antioxidants versus control, Outcome 16 Plasma antioxidant status: β‐carotene (μmol/L).

Comparison 1 Oral antioxidants versus control, Outcome 17 Plasma antioxidant status: selenium (μmol/L).

Comparison 1 Oral antioxidants versus control, Outcome 18 Plasma antioxidant status: vitamin C (μmol/L).

Comparison 1 Oral antioxidants versus control, Outcome 19 Plasma antioxidant status: whole blood GSH (μmol/L) (change from baseline).

Comparison 1 Oral antioxidants versus control, Outcome 20 Plasma antioxidant status: plasma fatty acid status (mg/L).

Comparison 1 Oral antioxidants versus control, Outcome 21 Plasma inflammation: IL‐6 (pg/mL) at 3 months (vitamin E).

Comparison 1 Oral antioxidants versus control, Outcome 22 Plasma inflammation: TNF‐α (pg/mL) at 3 months (vitamin E).

Comparison 1 Oral antioxidants versus control, Outcome 23 Plasma IL‐8 pg/mL (log 10) (change from baseline).

Comparison 1 Oral antioxidants versus control, Outcome 24 Sputum IL‐8 pg/ml (log 10) (per volume).

Comparison 1 Oral antioxidants versus control, Outcome 25 Sputum human neutrophil elastase (log 10) (mg/mg) per weight (change from baseline).

Comparison 1 Oral antioxidants versus control, Outcome 26 Sputum neutrophil count (logarithm).

Comparison 1 Oral antioxidants versus control, Outcome 27 Sputum myeloperoxidase (MPO) levels (log 10) (ng/mL).

Comparison 1 Oral antioxidants versus control, Outcome 28 Nutritional status: BMI (change from baseline).

Comparison 1 Oral antioxidants versus control, Outcome 29 Nutritional status: BMI percentile (change from baseline).

Comparison 1 Oral antioxidants versus control, Outcome 30 Nutritional status: weight (kg) (change from baseline).

Comparison 1 Oral antioxidants versus control, Outcome 31 Nutritional status: weight percentile (change from baseline).

Comparison 1 Oral antioxidants versus control, Outcome 32 Antibiotic days per participant.

Comparison 1 Oral antioxidants versus control, Outcome 33 Number of participants with at least one exacerbation.

Comparison 1 Oral antioxidants versus control, Outcome 34 Number of hospitalizations.
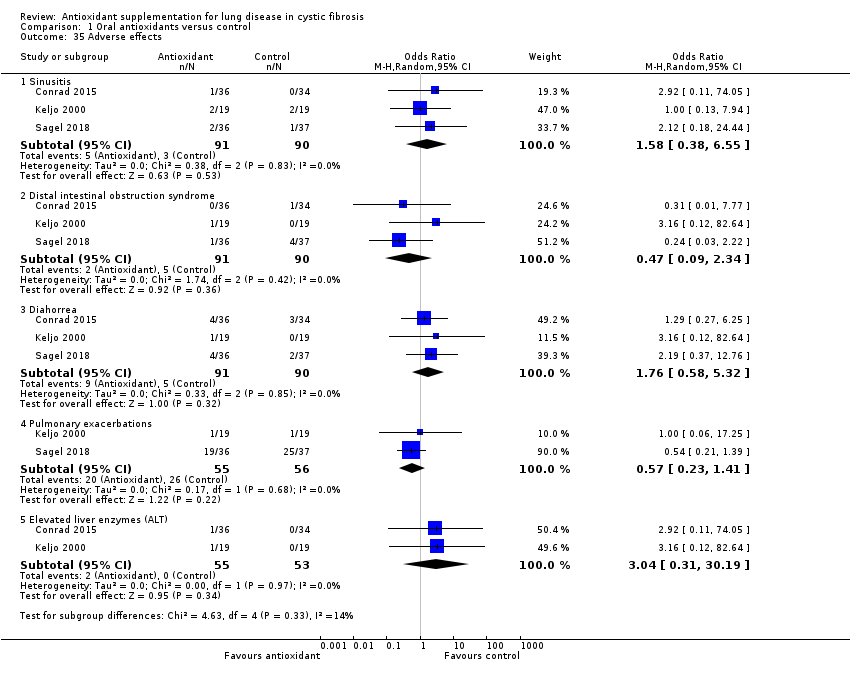
Comparison 1 Oral antioxidants versus control, Outcome 35 Adverse effects.

Comparison 2 Inhaled antioxidant (glutathione) versus control, Outcome 1 Lung function: FEV1 (L) (change from baseline).

Comparison 2 Inhaled antioxidant (glutathione) versus control, Outcome 2 Lung function: FEV1 (% predicted) (change from baseline).

Comparison 2 Inhaled antioxidant (glutathione) versus control, Outcome 3 Lung function FVC (L) (change from baseline).

Comparison 2 Inhaled antioxidant (glutathione) versus control, Outcome 4 Lung function FVC (% predicted) (change from baseline).

Comparison 2 Inhaled antioxidant (glutathione) versus control, Outcome 5 QoL total score (change from baseline).

Comparison 2 Inhaled antioxidant (glutathione) versus control, Outcome 6 QoL respiratory score (change from baseline).

Comparison 2 Inhaled antioxidant (glutathione) versus control, Outcome 7 Oxidative stress markers in exhaled breath condensate: H2O2 (μM).

Comparison 2 Inhaled antioxidant (glutathione) versus control, Outcome 8 Sputum oxidative stress: lipid peroxidation (8‐isoprostan).

Comparison 2 Inhaled antioxidant (glutathione) versus control, Outcome 9 Sputum antioxidant status: free glutathione in sputum (pM).

Comparison 2 Inhaled antioxidant (glutathione) versus control, Outcome 10 Sputum antioxidant status: total glutathione in sputum (pM).

Comparison 2 Inhaled antioxidant (glutathione) versus control, Outcome 11 Sputum antioxidant status: glutathione in sputum neutrophils (MFI).

Comparison 2 Inhaled antioxidant (glutathione) versus control, Outcome 12 Plasma antioxidant status: free glutathione (pM).

Comparison 2 Inhaled antioxidant (glutathione) versus control, Outcome 13 Plasma antioxidant status: total glutathione (pM).

Comparison 2 Inhaled antioxidant (glutathione) versus control, Outcome 14 Plasma antioxidant status: glutathione in blood neutrophils (MFI).

Comparison 2 Inhaled antioxidant (glutathione) versus control, Outcome 15 Sputum oxidative stress: protein carbonyls (U).

Comparison 2 Inhaled antioxidant (glutathione) versus control, Outcome 16 Local inflammation: cytokines in sputum IL‐8 (pg/mL).

Comparison 2 Inhaled antioxidant (glutathione) versus control, Outcome 17 Local inflammation: cytokines in sputum IL‐10 (pg/mL).

Comparison 2 Inhaled antioxidant (glutathione) versus control, Outcome 18 Local inflammation: cytokines in sputum TNF‐α (pg/mL).
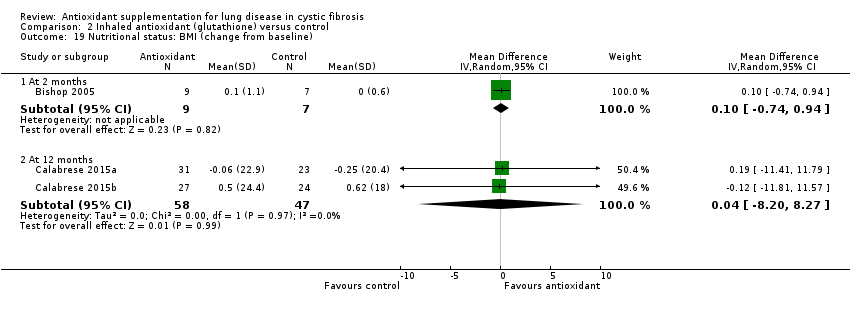
Comparison 2 Inhaled antioxidant (glutathione) versus control, Outcome 19 Nutritional status: BMI (change from baseline).

Comparison 2 Inhaled antioxidant (glutathione) versus control, Outcome 20 Nutritional status: weight (kg).

Comparison 2 Inhaled antioxidant (glutathione) versus control, Outcome 21 Number of pulmonary exacerbations during the study.

Comparison 2 Inhaled antioxidant (glutathione) versus control, Outcome 22 Time to first pulmonary exacerbation (days).

Comparison 2 Inhaled antioxidant (glutathione) versus control, Outcome 23 Adverse events.
| Oral antioxidants (NAC/GSH) compared to placebo for cystic fibrosis | ||||||
| Patient or population: adults and children with cystic fibrosis Settings: outpatients Intervention: oral antioxidants NAC/GSH Comparison: placebo | ||||||
| Outcomes | Illustrative comparative risks* (95% CI) | Relative effect | No of participants | Quality of the evidence | Comments | |
| Assumed risk | Corresponding risk | |||||
| Placebo | NAC/GSH | |||||
| Lung function: FEV1 % predicted mean change from baseline Follow‐up: 3 months | The mean change in FEV1 % predicted ranged across control groups from ‐8.6% to ‐1.64%. | The mean change in FEV1 % predicted in the intervention groups was 2.83% higher (2.16% lower to 7.83% higher). | NA | 125 | ⊕⊝⊝⊝ | The studies included in this analysis looked at different dosages of NAC. In 2 studies (n = 67), 600 mg/daily was divided in 3 doses (Ratjen 1985; Stafanger 1989), while in the remaining studies the doses were 2700 mg daily (n = 70) (Conrad 2015) and 2800 mg daily (n = 21) (Dauletbaev 2009) divided in 3 and 4 doses, respectively. |
| Lung function: FEV1 % predicted mean change from baseline Follow‐up: 6 months | Change in FEV1 was significantly higher in the intervention group compared to the control group, MD 4.38 (95% CI 0.89 to 7.87). | NA | 62 | ⊕⊕⊕⊝ | Results from the only included study favour NAC (2700 mg daily). A further study (n = 47) reported FEV1 % predicted at 6 months of GSH (administered as L‐glutathione), MD 17.40% (95% CI 13.97 to 20.83) (Visca 2015), but the studies were not combined due to the different action of the intervention. Both studies reported in favour of the antioxidant treatment. | |
| Quality of life: change in mean CFQ‐R score from baseline Follow‐up: 6 months | There was no significant difference in the change from from baseline in either group for CFQ‐R score at 6 months, MD ‐0.03 (95% CI ‐0.53 to 0.47). | NA | 61 | ⊕⊕⊕⊝ | Both groups showed a non‐significant decrease in CFQ‐R score (quality of life worsened) (P = 0.91). | |
| Nutritional status: change from baseline in BMI Follow‐up: 6 months | There was no significant difference from baseline in either group for BMI score at 6 months, MD 0.20 (95% CI ‐0.23 to 0.63). | NA | 62 | ⊕⊕⊕⊝ | There was no difference in the change in BMI between the intervention and control group. A further study (n = 47) reported on the change in BMI percentile after 6 months of oral supplementation with GSH (Visca 2015); BMI percentile increased significantly more with GSH supplementation than control, MD 17.20% (95% CI 14.35 to 20.05). | |
| Pulmonary exacerbations: mean time to next exacerbation Follow‐up: 6 months | Outcome not reported. | Although time to exacerbation was not reported, the Conrad study (n = 70) reported no difference in the number of participants with pulmonary exacerbations requiring antibiotics between NAC and control at 6 months, RR 0.83 (95% CI 0.50 to 1.390) and also reported no difference in the number of participants hospitalised, RR 0.94 (95% CI 0.49 to 1.81) (Conrad 2015). | ||||
| Adverse events Follow‐up: 6 months | Reported adverse effects were more common in the intervention group for: sinusitis, OR 2.92 (95% CI 0.11 to 74.05); diarrhoea, OR 1.29 (95% CI 0.27 to 6.25); and elevated liver enzymes, OR 2.92 (95% CI 0.11 to 74.05); but were more common in the control group for distal intestinal obstruction syndrome, OR 0.31 (95% CI 0.01 to 7.77). | 70 (1) | ⊕⊕⊕⊝ | Two further studies (n = 41) reported no adverse events in either control or intervention group (Götz 1980; Mitchell 1982). One study (n = 21) reported an adverse effect (gastrointestinal bleeding) which was considered to have a "possible" relationship to the medication (Dauletbaev 2009). | ||
| *The basis for the assumed risk (e.g. the median control group risk across studies) is provided in footnotes. The corresponding risk (and its 95% confidence interval) is based on the assumed risk in the comparison group and the relative effect of the intervention (and its 95% CI). | ||||||
| GRADE Working Group grades of evidence | ||||||
| 1. Downgraded once due to risk of bias across the included studies for this outcome; 1 study had a low risk of bias overall, but the remaining 3 had an unclear or high risk of bias across some of the domains particularly around allocation concealment and blinding. 2. Downgraded once due to inconsistency of results. There was heterogeneity with an I² value of 49% across the studies; this may be due to the different doses of NAC given and the quality of the underlying studies. 3. Downgraded once due to imprecision from small participant numbers. | ||||||
| Oral antioxidant vitamin E supplement compared with placebo or no treatment for cystic fibrosis | ||||||
| Patient or population: children and adults with cystic fibrosis Settings: outpatients Intervention: oral antioxidant vitamin E supplement Comparison: placebo or no treatment | ||||||
| Outcomes | Illustrative comparative risks* (95% CI) | Relative effect | No of participants | Quality of the evidence | Comments | |
| Assumed risk | Corresponding risk | |||||
| Placebo/no treatment | Vitamin E supplement | |||||
| Lung function: FEV1 % predicted mean change from baseline Follow‐up: 3 months | Outcome not reported. | |||||
| Lung function: FEV1 % predicted mean change from baseline Follow‐up: 6 months | Outcome not reported. | |||||
| Quality of life Follow‐up: 6 months | Outcome not reported. | |||||
| Nutritional status: change from baseline in BMI Follow‐up: 6 months | Outcome not reported. | |||||
| Pulmonary exacerbations: mean time to next exacerbation Follow‐up: 6 months | Outcome not reported. | |||||
| Adverse events Follow‐up: 3 months | No difference was found in the number of adverse events due to: sinusitis, OR 1.00 (95% CI 0.13 to 7.94); or exacerbations OR 1.00 (95% CI 0.06 to 17.25). Reported adverse effects were more common in the intervention group for: distal intestinal obstruction syndrome, OR 3.16 ( 95% CI 0.12 to 82.64); diarrhoea, OR 3.16 (95% CI 0.12 to 82.64); and elevated liver enzymes, OR 3.16 (95% CI 0.12 to 82.64). | 38 | ⊕⊕⊝⊝ | |||
| *The basis for the assumed risk (e.g. the median control group risk across studies) is provided in footnotes. The corresponding risk (and its 95% confidence interval) is based on the assumed risk in the comparison group and the relative effect of the intervention (and its 95% CI). | ||||||
| GRADE Working Group grades of evidence | ||||||
| 1. Downgraded once due to risk of bias within the included study across the domains of randomisation, allocation concealment, incomplete outcome reporting and selective reporting. 2. Downgraded due to low numbers of participants and small number of participants. | ||||||
| Oral antioxidant β‐carotene compared to placebo for cystic fibrosis | ||||||
| Patient or population: children and adults with cystic fibrosis Settings: outpatients Intervention: oral antioxidant β‐carotene Comparison: placebo | ||||||
| Outcomes | Illustrative comparative risks* (95% CI) | Relative effect | No of participants | Quality of the evidence | Comments | |
| Assumed risk | Corresponding risk | |||||
| Placebo | β‐carotene | |||||
| Lung function: FEV1 % predicted mean change from baseline Follow‐up: 3 months | Outcome not reported. | |||||
| Lung function: FEV1 % predicted mean change from baseline Follow‐up: 6 months | There was no significant difference from baseline in either group for FEV1 % predicted at 6 months, MD 0.90 (‐20.09 to 21.89). | NA | 24 (1) | ⊕⊝⊝⊝ | P = 0.93 | |
| Quality of life Follow‐up: 6 months | Outcome not reported. | |||||
| Nutritional status: change from baseline in BMI Follow‐up: 6 months | Outcome not reported. | |||||
| Pulmonary exacerbations: mean time to next exacerbation Follow‐up: 6 months | Outcome not reported. | |||||
| Adverse events Follow‐up: 6 months | The study reported no adverse events in either group. | NA | 24 | ⊕⊝⊝⊝ | ||
| *The basis for the assumed risk (e.g. the median control group risk across studies) is provided in footnotes. The corresponding risk (and its 95% confidence interval) is based on the assumed risk in the comparison group and the relative effect of the intervention (and its 95% CI). | ||||||
| GRADE Working Group grades of evidence | ||||||
| 1. Downgraded once due to unclear or high risk of bias across most domains, particularly randomisation, allocation concealment and publication bias. 2. Downgraded once due to imprecision from a small sample size. 3. Downgraded once because of a high risk of publication bias with the study being published multiple times without reference to other publications. | ||||||
| Oral antioxidant combination compared with control for cystic fibrosis | ||||||
| Patient or population: children with cystic fibrosis Settings: outpatients Intervention: oral antioxidant combination (vitamins E, C, A, β‐carotene and selenium) Comparison: control (continuation of a low‐dose supplement) | ||||||
| Outcomes | Illustrative comparative risks* (95% CI) | Relative effect | No of participants | Quality of the evidence | Comments | |
| Assumed risk | Corresponding risk | |||||
| Control (continuation of low dose supplement) | Combination of oral antioxidants | |||||
| Lung function: FEV1 % predicted mean change from baseline Follow‐up: 3 months | Outcome not reported at this time point. | After 2 months of a combined supplement, a single study reported a significant difference in favour of control, MD ‐4.30% (95% CI ‐5.64 to ‐2.96). | ||||
| Lung function: FEV1 % predicted mean change from baseline Follow‐up: 6 months | Outcome not reported. | |||||
| Quality of life: Quality of Well Being score change from baseline Follow‐up: six months | Outcome not reported at this time point. | Results significantly favoured control over antioxidant supplementation at 2 months, SMD ‐0.66 points (95% CI ‐1.26 to ‐0.07). A higher score indicates better quality of life. | ||||
| Nutritional status: change from baseline in BMI Follow‐up: 6 months | Outcome not reported. | |||||
| Pulmonary exacerbations: mean time to next exacerbation Follow‐up: 6 months | Outcome not reported. | |||||
| Adverse events Follow‐up: 6 months | Outcome not reported. | |||||
| *The basis for the assumed risk (e.g. the median control group risk across studies) is provided in footnotes. The corresponding risk (and its 95% confidence interval) is based on the assumed risk in the comparison group and the relative effect of the intervention (and its 95% CI). | ||||||
| GRADE Working Group grades of evidence | ||||||
| Oral antioxidant mixed supplement compared with control for cystic fibrosis | ||||||
| Patient or population: adults and children with cystic fibrosis Settings: outpatients Intervention: AquADEKs‐2 containing standard amounts of fat‐soluble vitamins (A, D, E, K) as in typical CF multivitamin supplements plus several antioxidants including β‐carotene, mixed tocopherols (different forms of vitamin E), CoQ10, mixed carotenoids (lutein, lycopene and zeaxanthin), and the minerals zinc and selenium Comparison: control multivitamin softgel capsules | ||||||
| Outcomes | Illustrative comparative risks* (95% CI) | Relative effect | No of participants | Quality of the evidence | Comments | |
| Assumed risk | Corresponding risk | |||||
| Control capsules | Mixed supplement | |||||
| Lung function: FEV1 % predicted mean change from baseline Follow‐up: 3 months | Outcome not reported at this time point. | At 4 months the MD between the groups was 1.44 higher (95% CI ‐2.23 to 5.11) favouring the mixed supplement. The effect was not significant P = 0.44. | ||||
| Lung function: FEV1 % predicted mean change from baseline Follow‐up: 6 months | Outcome not reported. | |||||
| Quality of life: Quality of Well Being score change from baseline Follow‐up: 6 months | Outcome not reported. | |||||
| Nutritional status: change from baseline in BMI Follow up: 6 months | Outcome not reported at this time point. | The study did however report that at 4 months there was no difference in weight z scores between the intervention and control group (Sagel 2018). | ||||
| Pulmonary exacerbations: mean time to next exacerbation Follow‐up: 6 months | There was a significantly lower risk of first pulmonary exacerbation in the antioxidant group than the control group at 4 months, HR 0.5 (95% CI 0.25 to 0.98) (P = 0.04). | NA | 69 | ⊕⊕⊝⊝ | This result was reported directly from the paper. | |
| Adverse events Follow‐up: 6 months | No significant differences were found in the number of adverse events due to: sinusitis, OR 2.12 (95% CI 0.18 to 24.44); DIOS, OR 0.24 (95% CI 0.03 to 2.22); diarrhoea, OR 2.19 (95% CI 0.37 to 12.76); or pulmonary exacerbations, OR 0.54 (95% CI 0.21 to 1.39). | NA | 69 | ⊕⊕⊝⊝ | Although not statistically significant, adverse events were more common in the intervention group for sinusitis and diarrhoea whilst they were more common in the control group for DIOS and pulmonary exacerbations. | |
| *The basis for the assumed risk (e.g. the median control group risk across studies) is provided in footnotes. The corresponding risk (and its 95% confidence interval) is based on the assumed risk in the comparison group and the relative effect of the intervention (and its 95% CI). | ||||||
| GRADE Working Group grades of evidence | ||||||
| 1. Downgraded once due to risk of bias within the single study. There were concerns about allocation concealment and also because the enrolment number was not reached. 2. Downgraded once due to imprecision from low event rates. | ||||||
| Inhaled antioxidants compared with placebo for cystic fibrosis | ||||||
| Patient or population: children and adults with cystic fibrosis Settings: outpatients Intervention: nebulised GSH Comparison: placebo | ||||||
| Outcomes | Illustrative comparative risks* (95% CI) | Relative effect | No of participants | Quality of the evidence | Comments | |
| Assumed risk | Corresponding risk | |||||
| Placebo | Nebulised GSH | |||||
| Lung function: FEV1 % predicted mean change from baseline Follow‐up: 3 months | The mean change in FEV1 % predicted ranged across control groups from | The mean change in FEV1 % predicted in the intervention groups was 3.5% higher | NA | 258 | ⊕⊕⊕⊝ | Data significantly favoured the antioxidant group (P = 0.001). This effect remained when the pediatric data were removed from the analysis. |
| Lung function: FEV1 % predicted mean change from baseline Follow‐up: 6 months | The mean change in FEV1 % predicted ranged across control groups from | The mean FEV1 % predicted in the intervention groups was 2.3% higher (0.12% lower to 4.71% higher). | NA | 258 | ⊕⊕⊕⊝ | These results include adult and pediatric data. The adult‐only data were also analysed, but there was no significant difference between groups, MD 2.17% (95% CI ‐1.07 to 5.41). |
| Quality of life: change in CFQoL score from baseline Follow‐up: 6 months | There was no difference between groups MD 0.80 (95% CI ‐1.63 to 3.23) (P = 0.52). | NA | 153 | ⊕⊕⊕⊝ | 2 further studies found no significant difference between groups at 12 months (data taken from the papers) (Calabrese 2015a; Calabrese 2015b). | |
| Nutritional status: change from baseline in BMI Follow‐up: 6 months | Outcome not reported at this time point. See comment. | No statistically significant difference was found between groups with regard to BMI either at 2 months, MD 0.10 (95% CI ‐0.74 to 0.94) or at 12 months, MD 0.04 (95% CI ‐8.20 to 8.27). | ||||
| Pulmonary exacerbations: mean time to next exacerbation Follow‐up: 6 months | Outcome not reported at this time point. See comment. | The time to first exacerbation was 163 days in the GSH treated group and 141 days in the control group. This difference was reported as not statistically significant by the authors using Wilcoxon rank sum test; not directly analysed in this review due to skewed data. | ||||
| Adverse events Follow‐up: 6 months | No significant differences were seen between groups for any adverse events. | NA | 223 (3) | ⊕⊕⊝⊝ | 1 study reported no serious adverse events (Bishop 2005). 2 studies reported that none of the reported adverse events led to discontinuation of the drug and that no death occurred (Calabrese 2015a; Calabrese 2015b). A further study reported that the number of serious adverse events were similar between the group treated with GSH inhalations and the placebo group (11% and 10%, respectively) (Griese 2013). | |
| *The basis for the assumed risk (e.g. the median control group risk across studies) is provided in footnotes. The corresponding risk (and its 95% confidence interval) is based on the assumed risk in the comparison group and the relative effect of the intervention (and its 95% CI). | ||||||
| GRADE Working Group grades of evidence | ||||||
| 1. Downgraded once due to risk of bias in the included studies, particularly through lack of blinding caused by the intervention having a distinctive taste and smell. 2. Downgraded once due to risk of bias within the single included study for this outcome. The study was at high risk of bias in the blinding domain as the intervention has a distinctive taste and smell. The participants were also allowed to continue oral N‐acetylcysteine (NAC) (a precursor of GSH). 3. Downgraded once due to imprecision caused by low event rates for many of the reported adverse events. | ||||||
| Study | Time point reported | |||||||
| 1 month | 2 months | 3 months | 4 months | 5 months | 6 months | 9 months | 12 months | |
| ✓ | ✓ | |||||||
| ✓ | ||||||||
| ✓ | ||||||||
| ✓ | ||||||||
| ✓ | ||||||||
| ✓ | ||||||||
| ✓ | ✓ | |||||||
| ✓ | ||||||||
| ✓ | ||||||||
| ✓ | ||||||||
| ✓ | ✓ | |||||||
| ✓ | ✓ | |||||||
| ✓ | ||||||||
| ✓ | ||||||||
| ✓ | ✓ | |||||||
| ✓ | ||||||||
| Study | Time point reported | |||||||
| 1 month | 2 months | 3 months | 4 months | 5 months | 6 months | 9 months | 12 months | |
| ✓ | ||||||||
| ✓ | ✓ | ✓ | ✓ | ✓ | ||||
| ✓ | ✓ | ✓ | ||||||
| ✓ | ||||||||
| Supplement | Time point | Result |
| Fat‐soluble vitamin E | 1 month | MD 13.47 μmol/L (95% CI 9.05 to 17.89) |
| Water‐miscible vitamin E | 1 month | MD 26.7μmol/L (95% CI 15.90 to 37.50) |
| 2 months | MD 11.61 μmol/L (95% CI 4.31 to 18.91) | |
| 6 months | MD 19.73 μmol/L (95% CI 12.48 to 26.98) | |
| Combined supplement | 2 months | MD 10.20 μmol/L (95% CI 5.21 to 15.19) |
| Oral GSH | 6 months | MD 4.26 μmol/L (95% CI 2.03 to 6.49) |
| Antioxidant‐enriched multivitamin | 1 month | MD ‐3.48 μmol/L (95% CI ‐8.01 to 1.05) |
| 4 months | MD ‐1.86 μmol/L (95% CI ‐6.36 to 2.64) | |
| CF: cystic fibrosis | ||
| Subgroup | IL‐6 (pg/mL) | TNF‐α (pg/mL) |
| FEV1 > 85% and no DNase | MD ‐2.02 (95% CI ‐4.63 to 0.59) | MD ‐1.37 (95% CI ‐3.61 to 0.87) |
| FEV1 > 85% and no DNase | MD ‐0.31 (95% CI ‐4.03 to 3.41) | MD 0.33 (95% CI ‐0.49 to 1.15) |
| FEV1 range 70% ‐ 85% and DNase | MD ‐0.24 (95% CI ‐3.80to 3.32) | MD ‐0.94 (95% CI ‐1.61 to ‐0.26) |
| CI: confidence interval | ||
| Study ID | Age | GSH | Placebo | ||
| Baseline mean (SD) | At 12 months mean (SD) | Baseline mean (SD) | At 12 months mean (SD) | ||
| Over 18 years | 882.75 (147.63) | 891.69 (165.09) | 871.18 (124.56) | 879.47 (139.9) | |
| 14 to 18 years | 949.23 (82.94) | 955.34 (94.95) | 1044.5 (65.53) | 1049.12 (76.87) | |
| 12 ‐ 13 years | 506.12 (34.15) | 527.39 (132.25) | 679.24 (55.79) | 705.55 (40.93) | |
| 12 ‐ 13 years (parents) | 634.93 (122.59) | 643.06 (75.86) | 975.34 (57.05) | 959.79 (130.95) | |
| 6 to 11 years | 544.21 (127.59) | 925.16 (104.95) | 573.64 (103.19) | 574.95 (107.73) | |
| 6 to 11 years (parents) | 771.79 (231.05) | 779.59 (222.27) | 745.23 (164.84) | 767.59 (154.02) | |
| GSH: glutathione | |||||
| Outcome or subgroup title | No. of studies | No. of participants | Statistical method | Effect size |
| 1 Lung function: FEV1 (% predicted) (mean change from baseline) Show forest plot | 8 | Mean Difference (IV, Random, 95% CI) | Subtotals only | |
| 1.1 At 2 months (combined supplement) | 1 | 46 | Mean Difference (IV, Random, 95% CI) | ‐4.3 [‐5.64, ‐2.96] |
| 1.2 At 3 months (NAC) | 4 | 125 | Mean Difference (IV, Random, 95% CI) | 2.83 [‐2.16, 7.83] |
| 1.3 at 4 months (multivitamins with antioxidants versus multivitamin alone | 1 | 69 | Mean Difference (IV, Random, 95% CI) | 1.44 [‐2.23, 5.11] |
| 1.4 At 6 months (NAC) | 1 | 62 | Mean Difference (IV, Random, 95% CI) | 4.38 [0.89, 7.87] |
| 1.5 At 6 months (GSH) | 1 | 47 | Mean Difference (IV, Random, 95% CI) | 17.4 [13.97, 20.83] |
| 1.6 At 6 months (β‐carotene) | 1 | 24 | Mean Difference (IV, Random, 95% CI) | 0.9 [‐20.09, 21.89] |
| 2 Lung function: FVC (% predicted) mean change from baseline Show forest plot | 5 | Mean Difference (IV, Random, 95% CI) | Subtotals only | |
| 2.1 At 2 months (combined supplement) | 1 | 46 | Mean Difference (IV, Random, 95% CI) | ‐4.2 [‐11.28, 2.88] |
| 2.2 At 3 months (NAC) | 3 | 115 | Mean Difference (IV, Random, 95% CI) | 3.34 [‐4.30, 10.97] |
| 2.3 At 6 months (NAC) | 1 | 62 | Mean Difference (IV, Random, 95% CI) | 3.75 [‐0.13, 7.63] |
| 2.4 At 6 months (GSH) | 1 | 47 | Mean Difference (IV, Random, 95% CI) | 14.80 [10.07, 19.53] |
| 3 QoL: Quality of Well Being Scale Show forest plot | 2 | Std. Mean Difference (IV, Random, 95% CI) | Subtotals only | |
| 3.1 At 2 months (combined supplement) | 1 | 46 | Std. Mean Difference (IV, Random, 95% CI) | ‐0.66 [‐1.26, ‐0.07] |
| 3.2 at 3 months (NAC) CF‐Q respiratory domain scale | 1 | 62 | Std. Mean Difference (IV, Random, 95% CI) | 0.33 [‐0.17, 0.83] |
| 3.3 at 6 months (NAC) CF‐Q respiratory domain scale | 1 | 61 | Std. Mean Difference (IV, Random, 95% CI) | ‐0.03 [‐0.53, 0.47] |
| 4 Oxidative stress: lipid peroxidation (H2O2) (μmol/L) Show forest plot | 1 | Mean Difference (IV, Random, 95% CI) | Subtotals only | |
| 4.1 At 5 months (selenium) | 1 | 27 | Mean Difference (IV, Random, 95% CI) | 15.90 [‐13.16, 44.96] |
| 5 Oxidative stress: lipid peroxidation (F2‐isoprostanes) (ng/L) Show forest plot | 1 | Mean Difference (IV, Random, 95% CI) | Subtotals only | |
| 5.1 At 2 months (combined supplement) | 1 | 46 | Mean Difference (IV, Random, 95% CI) | 1.0 [‐23.94, 25.94] |
| 6 Oxidative stress: lipid peroxidation (malondialdehyde) (μmol/L) mea difference to baseline) Show forest plot | 2 | 51 | Mean Difference (IV, Random, 95% CI) | ‐0.10 [‐0.45, 0.25] |
| 6.1 At 5 months (selenium) | 1 | 27 | Mean Difference (IV, Random, 95% CI) | ‐0.26 [‐0.67, 0.15] |
| 6.2 At 6 months (β‐carotene) | 1 | 24 | Mean Difference (IV, Random, 95% CI) | 0.10 [‐0.38, 0.58] |
| 7 Oxidative stress: urine 8‐iso‐PGF2α log 10 (pg/mL) Show forest plot | 1 | Mean Difference (IV, Random, 95% CI) | Subtotals only | |
| 7.1 At 4 months | 1 | 69 | Mean Difference (IV, Random, 95% CI) | 0.09 [‐0.10, 0.28] |
| 8 Oxidative stress: sputum 8‐iso‐PGF2α log10 (pg/mL) Show forest plot | 1 | Mean Difference (IV, Random, 95% CI) | Subtotals only | |
| 8.1 at 4 months | 1 | 65 | Mean Difference (IV, Random, 95% CI) | 0.02 [‐0.12, 0.16] |
| 9 Oxidative stress: sputum 8‐OHdG (log10) ng/ml Show forest plot | 1 | Mean Difference (IV, Random, 95% CI) | Subtotals only | |
| 9.1 At 4 months | 1 | 65 | Mean Difference (IV, Random, 95% CI) | ‐0.07 [‐0.24, 0.10] |
| 10 Oxidative stress: enzyme function ‐ GPX (U/g Hb) Show forest plot | 2 | 73 | Mean Difference (IV, Random, 95% CI) | 4.96 [‐3.26, 13.19] |
| 10.1 At 2 months (combined supplement) | 1 | 46 | Mean Difference (IV, Random, 95% CI) | 1.6 [0.30, 2.90] |
| 10.2 At 5 months (selenium) | 1 | 27 | Mean Difference (IV, Random, 95% CI) | 10.20 [2.22, 18.18] |
| 11 Oxidative stress: enzyme function ‐ SOD (U/mg Hb) Show forest plot | 1 | Mean Difference (IV, Random, 95% CI) | Subtotals only | |
| 11.1 At 2 months (combined supplement) | 1 | 46 | Mean Difference (IV, Random, 95% CI) | 0.27 [‐1.24, 1.78] |
| 12 Oxidative stress: potency (TEAC) (mmol/L) Show forest plot | 1 | Mean Difference (IV, Random, 95% CI) | Subtotals only | |
| 12.1 At 6 months (β‐carotene) | 1 | 24 | Mean Difference (IV, Random, 95% CI) | 0.04 [‐0.17, 0.25] |
| 13 Plasma total antioxidant capacity (nmol) (change from baseline) Show forest plot | 1 | Mean Difference (IV, Random, 95% CI) | Subtotals only | |
| 13.1 At 3 months (β‐carotene) | 1 | 24 | Mean Difference (IV, Random, 95% CI) | 0.1 [‐0.18, 0.38] |
| 13.2 At 6 months (β‐carotene) | 1 | 24 | Mean Difference (IV, Random, 95% CI) | 0.04 [‐0.30, 0.38] |
| 14 Plasma total antioxidant capacity (log10) (CRE) Show forest plot | 1 | Mean Difference (IV, Random, 95% CI) | Subtotals only | |
| 14.1 At 1 month | 1 | 66 | Mean Difference (IV, Random, 95% CI) | 0.0 [‐0.02, 0.02] |
| 14.2 At 4 months | 1 | 72 | Mean Difference (IV, Random, 95% CI) | ‐0.01 [‐0.04, 0.02] |
| 15 Plasma antioxidant status: vitamin E (μmol/L) Show forest plot | 5 | Mean Difference (IV, Random, 95% CI) | Subtotals only | |
| 15.1 At 1 month (water‐miscible vitamin E) | 1 | 18 | Mean Difference (IV, Random, 95% CI) | 26.7 [15.90, 37.50] |
| 15.2 At 1 month (fat‐soluble vitamin E) | 1 | 19 | Mean Difference (IV, Random, 95% CI) | 13.47 [9.05, 17.89] |
| 15.3 At 1 month (antioxidant‐enriched multivitamin) | 1 | 66 | Mean Difference (IV, Random, 95% CI) | ‐3.48 [‐8.01, 1.05] |
| 15.4 At 2 months (water‐miscible vitamin E and combined supplement | 2 | 83 | Mean Difference (IV, Random, 95% CI) | 10.65 [6.53, 14.77] |
| 15.5 at 4 month (antioxidant ‐enriched multivitamin) | 1 | 72 | Mean Difference (IV, Random, 95% CI) | ‐1.86 [‐6.36, 2.64] |
| 15.6 At 6 months (water‐miscible vitamin E) | 1 | 33 | Mean Difference (IV, Random, 95% CI) | 19.73 [12.48, 26.98] |
| 15.7 At 6 months (oral GSH) | 1 | 44 | Mean Difference (IV, Random, 95% CI) | 4.26 [2.03, 6.49] |
| 16 Plasma antioxidant status: β‐carotene (μmol/L) Show forest plot | 2 | 70 | Mean Difference (IV, Random, 95% CI) | 0.13 [0.02, 0.25] |
| 16.1 At 2 months (combined supplement) | 1 | 46 | Mean Difference (IV, Random, 95% CI) | 0.1 [0.02, 0.18] |
| 16.2 At 6 months (β‐carotene) | 1 | 24 | Mean Difference (IV, Random, 95% CI) | 0.24 [0.02, 0.46] |
| 17 Plasma antioxidant status: selenium (μmol/L) Show forest plot | 2 | 73 | Mean Difference (IV, Random, 95% CI) | 0.48 [0.27, 0.68] |
| 17.1 At 2 months (combined supplement) | 1 | 46 | Mean Difference (IV, Random, 95% CI) | 0.6 [0.39, 0.81] |
| 17.2 At 5 months (selenium) | 1 | 27 | Mean Difference (IV, Random, 95% CI) | 0.39 [0.27, 0.51] |
| 18 Plasma antioxidant status: vitamin C (μmol/L) Show forest plot | 1 | Mean Difference (IV, Random, 95% CI) | Subtotals only | |
| 18.1 At 2 months (combined supplement) | 1 | 46 | Mean Difference (IV, Random, 95% CI) | 8.0 [‐15.05, 31.05] |
| 19 Plasma antioxidant status: whole blood GSH (μmol/L) (change from baseline) Show forest plot | 1 | Mean Difference (IV, Random, 95% CI) | Subtotals only | |
| 19.1 at 3 months | 1 | 61 | Mean Difference (IV, Random, 95% CI) | 19.00 [‐183.58, 221.58] |
| 19.2 at 6 months | 1 | 60 | Mean Difference (IV, Random, 95% CI) | 64.10 [‐170.05, 298.25] |
| 20 Plasma antioxidant status: plasma fatty acid status (mg/L) Show forest plot | 1 | Mean Difference (IV, Random, 95% CI) | Subtotals only | |
| 20.1 At 2 months (combined supplement) | 1 | 46 | Mean Difference (IV, Random, 95% CI) | 166.0 [‐61.38, 393.38] |
| 21 Plasma inflammation: IL‐6 (pg/mL) at 3 months (vitamin E) Show forest plot | 1 | Mean Difference (IV, Random, 95% CI) | Subtotals only | |
| 21.1 FEV1 > 85% and no DNase | 1 | 12 | Mean Difference (IV, Random, 95% CI) | ‐2.02 [‐4.63, 0.59] |
| 21.2 FEV1 > 85% and DNase | 1 | 9 | Mean Difference (IV, Random, 95% CI) | ‐0.31 [‐4.03, 3.41] |
| 21.3 FEV1 range 70% ‐ 85% and DNase | 1 | 11 | Mean Difference (IV, Random, 95% CI) | ‐0.24 [‐3.80, 3.32] |
| 22 Plasma inflammation: TNF‐α (pg/mL) at 3 months (vitamin E) Show forest plot | 1 | Mean Difference (IV, Random, 95% CI) | Subtotals only | |
| 22.1 FEV1 > 85% and no DNase | 1 | 12 | Mean Difference (IV, Random, 95% CI) | ‐1.37 [‐3.61, 0.87] |
| 22.2 FEV1 > 85% and DNase | 1 | 14 | Mean Difference (IV, Random, 95% CI) | 0.33 [‐0.49, 1.15] |
| 22.3 FEV1 range 70% ‐ 85% and DNase | 1 | 11 | Mean Difference (IV, Random, 95% CI) | ‐0.94 [‐1.61, ‐0.26] |
| 23 Plasma IL‐8 pg/mL (log 10) (change from baseline) Show forest plot | 1 | Mean Difference (IV, Random, 95% CI) | Subtotals only | |
| 23.1 At 3 months | 1 | 61 | Mean Difference (IV, Random, 95% CI) | 0.01 [‐0.19, 0.21] |
| 23.2 At 6 months | 1 | 56 | Mean Difference (IV, Random, 95% CI) | ‐0.09 [‐0.32, 0.14] |
| 24 Sputum IL‐8 pg/ml (log 10) (per volume) Show forest plot | 3 | Mean Difference (IV, Random, 95% CI) | Subtotals only | |
| 24.1 At 3 months (NAC) | 2 | 92 | Mean Difference (IV, Random, 95% CI) | ‐0.01 [‐0.15, 0.14] |
| 24.2 At 4 months ( antioxidant enriched vitamins) | 1 | 65 | Mean Difference (IV, Random, 95% CI) | ‐0.06 [‐0.24, 0.12] |
| 24.3 At 6 months (NAC) | 1 | 56 | Mean Difference (IV, Random, 95% CI) | 0.19 [‐0.03, 0.41] |
| 25 Sputum human neutrophil elastase (log 10) (mg/mg) per weight (change from baseline) Show forest plot | 1 | Mean Difference (IV, Random, 95% CI) | Subtotals only | |
| 25.1 At 3 months | 1 | 61 | Mean Difference (IV, Random, 95% CI) | ‐0.04 [‐0.24, 0.16] |
| 25.2 At 6 months | 1 | 56 | Mean Difference (IV, Random, 95% CI) | 0.11 [‐0.11, 0.33] |
| 26 Sputum neutrophil count (logarithm) Show forest plot | 1 | Mean Difference (IV, Random, 95% CI) | Subtotals only | |
| 26.1 at 3 months | 1 | 63 | Mean Difference (IV, Random, 95% CI) | 1.90 [‐8.08, 11.88] |
| 26.2 at 6 months | 1 | 61 | Mean Difference (IV, Random, 95% CI) | 2.60 [‐11.85, 17.05] |
| 27 Sputum myeloperoxidase (MPO) levels (log 10) (ng/mL) Show forest plot | 1 | Mean Difference (IV, Random, 95% CI) | Subtotals only | |
| 27.1 At 4 months (multivitamins with antioxidants versus multivitamin alone | 1 | 65 | Mean Difference (IV, Random, 95% CI) | ‐0.13 [‐0.48, 0.22] |
| 28 Nutritional status: BMI (change from baseline) Show forest plot | 1 | Mean Difference (IV, Random, 95% CI) | Subtotals only | |
| 28.1 At 3 months (NAC) | 1 | 64 | Mean Difference (IV, Random, 95% CI) | 0.30 [‐0.02, 0.62] |
| 28.2 At 6 months (NAC) | 1 | 62 | Mean Difference (IV, Random, 95% CI) | 0.2 [‐0.23, 0.63] |
| 29 Nutritional status: BMI percentile (change from baseline) Show forest plot | 1 | Mean Difference (IV, Random, 95% CI) | Subtotals only | |
| 29.1 At 3 months (GSH) | 1 | 40 | Mean Difference (IV, Random, 95% CI) | 9.2 [6.22, 12.18] |
| 29.2 At 6 months (GSH) | 1 | 40 | Mean Difference (IV, Random, 95% CI) | 17.20 [14.35, 20.05] |
| 30 Nutritional status: weight (kg) (change from baseline) Show forest plot | 3 | Mean Difference (IV, Random, 95% CI) | Subtotals only | |
| 30.1 At 3 months (NAC) | 2 | 84 | Mean Difference (IV, Random, 95% CI) | 0.24 [‐0.73, 1.22] |
| 30.2 At 6 months (NAC) | 1 | 62 | Mean Difference (IV, Random, 95% CI) | 0.60 [‐0.51, 1.71] |
| 30.3 At 6 months (water‐miscible vitamin E) | 1 | 36 | Mean Difference (IV, Random, 95% CI) | ‐0.30 [‐7.19, 6.59] |
| 31 Nutritional status: weight percentile (change from baseline) Show forest plot | 1 | Mean Difference (IV, Random, 95% CI) | Subtotals only | |
| 31.1 At 3 months (GSH) | 1 | 44 | Mean Difference (IV, Random, 95% CI) | 8.1 [5.64, 10.56] |
| 31.2 At 6 months (GSH) | 1 | 44 | Mean Difference (IV, Random, 95% CI) | 17.0 [14.64, 19.36] |
| 32 Antibiotic days per participant Show forest plot | 2 | 70 | Mean Difference (IV, Random, 95% CI) | ‐4.28 [‐15.16, 6.60] |
| 32.1 At 2 months (combined supplement) | 1 | 46 | Mean Difference (IV, Random, 95% CI) | 4.0 [‐14.06, 22.06] |
| 32.2 At 6 months (β‐carotene) | 1 | 24 | Mean Difference (IV, Random, 95% CI) | ‐8.0 [‐18.78, 2.78] |
| 33 Number of participants with at least one exacerbation Show forest plot | 2 | 143 | Risk Ratio (M‐H, Random, 95% CI) | 0.80 [0.59, 1.09] |
| 33.1 At 4 months (multivitamins with antioxidants versus multivitamin alone | 1 | 73 | Risk Ratio (M‐H, Random, 95% CI) | 0.78 [0.53, 1.14] |
| 33.2 At 6 months (NAC) | 1 | 70 | Risk Ratio (M‐H, Random, 95% CI) | 0.83 [0.50, 1.39] |
| 34 Number of hospitalizations Show forest plot | 1 | Risk Ratio (M‐H, Random, 95% CI) | Subtotals only | |
| 34.1 At 6 months (NAC) | 1 | 70 | Risk Ratio (M‐H, Random, 95% CI) | 0.94 [0.49, 1.81] |
| 35 Adverse effects Show forest plot | 3 | Odds Ratio (M‐H, Random, 95% CI) | Subtotals only | |
| 35.1 Sinusitis | 3 | 181 | Odds Ratio (M‐H, Random, 95% CI) | 1.58 [0.38, 6.55] |
| 35.2 Distal intestinal obstruction syndrome | 3 | 181 | Odds Ratio (M‐H, Random, 95% CI) | 0.47 [0.09, 2.34] |
| 35.3 Diahorrea | 3 | 181 | Odds Ratio (M‐H, Random, 95% CI) | 1.76 [0.58, 5.32] |
| 35.4 Pulmonary exacerbations | 2 | 111 | Odds Ratio (M‐H, Random, 95% CI) | 0.57 [0.23, 1.41] |
| 35.5 Elevated liver enzymes (ALT) | 2 | 108 | Odds Ratio (M‐H, Random, 95% CI) | 3.04 [0.31, 30.19] |
| Outcome or subgroup title | No. of studies | No. of participants | Statistical method | Effect size |
| 1 Lung function: FEV1 (L) (change from baseline) Show forest plot | 3 | Mean Difference (IV, Random, 95% CI) | Subtotals only | |
| 1.1 At 1 month | 3 | 258 | Mean Difference (IV, Random, 95% CI) | 0.05 [‐0.01, 0.11] |
| 1.2 At 3 months | 3 | 258 | Mean Difference (IV, Random, 95% CI) | 0.09 [0.03, 0.15] |
| 1.3 At 6 months | 3 | 258 | Mean Difference (IV, Random, 95% CI) | 0.07 [0.00, 0.14] |
| 1.4 At 9 months | 2 | 105 | Mean Difference (IV, Random, 95% CI) | 0.03 [‐0.14, 0.20] |
| 1.5 At 12 months | 2 | 105 | Mean Difference (IV, Random, 95% CI) | ‐0.00 [‐0.13, 0.12] |
| 2 Lung function: FEV1 (% predicted) (change from baseline) Show forest plot | 4 | Mean Difference (IV, Random, 95% CI) | Subtotals only | |
| 2.1 At 1 month | 3 | 258 | Mean Difference (IV, Random, 95% CI) | 1.91 [‐0.07, 3.88] |
| 2.2 At 2 months | 1 | 16 | Mean Difference (IV, Random, 95% CI) | 0.90 [‐6.45, 8.25] |
| 2.3 At 3 months | 3 | 258 | Mean Difference (IV, Random, 95% CI) | 3.50 [1.38, 5.62] |
| 2.4 At 6 months | 3 | 258 | Mean Difference (IV, Random, 95% CI) | 2.30 [‐0.12, 4.71] |
| 2.5 At 9 months | 2 | 105 | Mean Difference (IV, Random, 95% CI) | 2.52 [‐4.61, 9.65] |
| 2.6 At 12 months | 2 | 105 | Mean Difference (IV, Random, 95% CI) | 2.96 [‐2.54, 8.46] |
| 3 Lung function FVC (L) (change from baseline) Show forest plot | 3 | Mean Difference (IV, Random, 95% CI) | Subtotals only | |
| 3.1 At 1 month | 3 | 258 | Mean Difference (IV, Random, 95% CI) | 0.05 [‐0.01, 0.12] |
| 3.2 At 3 months | 3 | 258 | Mean Difference (IV, Random, 95% CI) | 0.08 [0.01, 0.16] |
| 3.3 At 6 months | 3 | 258 | Mean Difference (IV, Random, 95% CI) | 0.05 [‐0.03, 0.13] |
| 3.4 At 9 months | 2 | 105 | Mean Difference (IV, Random, 95% CI) | 0.01 [‐0.17, 0.19] |
| 3.5 At 12 months | 2 | 105 | Mean Difference (IV, Random, 95% CI) | ‐0.01 [‐0.10, 0.09] |
| 4 Lung function FVC (% predicted) (change from baseline) Show forest plot | 4 | Mean Difference (IV, Random, 95% CI) | Subtotals only | |
| 4.1 At 1 month | 3 | 258 | Mean Difference (IV, Random, 95% CI) | 2.12 [‐0.23, 4.47] |
| 4.2 At 2 months | 1 | 16 | Mean Difference (IV, Random, 95% CI) | 0.60 [‐6.53, 7.73] |
| 4.3 At 3 months | 3 | 258 | Mean Difference (IV, Random, 95% CI) | 3.60 [1.33, 5.88] |
| 4.4 At 6 months | 3 | 258 | Mean Difference (IV, Random, 95% CI) | 3.33 [‐0.62, 7.27] |
| 4.5 At 9 months | 2 | 105 | Mean Difference (IV, Random, 95% CI) | 5.48 [‐1.76, 12.73] |
| 4.6 At 12 months | 2 | 105 | Mean Difference (IV, Random, 95% CI) | 4.27 [‐0.00, 8.54] |
| 5 QoL total score (change from baseline) Show forest plot | 1 | Mean Difference (IV, Random, 95% CI) | Subtotals only | |
| 5.1 at 1 month | 1 | 153 | Mean Difference (IV, Random, 95% CI) | 2.2 [‐0.23, 4.63] |
| 5.2 at 3 months | 1 | 153 | Mean Difference (IV, Random, 95% CI) | 1.20 [‐1.46, 3.86] |
| 5.3 at 6 months | 1 | 153 | Mean Difference (IV, Random, 95% CI) | 0.8 [‐1.63, 3.23] |
| 6 QoL respiratory score (change from baseline) Show forest plot | 1 | Mean Difference (IV, Random, 95% CI) | Subtotals only | |
| 6.1 at 1 month | 1 | 153 | Mean Difference (IV, Random, 95% CI) | 2.7 [‐2.15, 7.55] |
| 6.2 at 3 months | 1 | 153 | Mean Difference (IV, Random, 95% CI) | ‐0.5 [‐4.80, 3.80] |
| 6.3 at 6 months | 1 | 153 | Mean Difference (IV, Random, 95% CI) | ‐3.3 [‐8.05, 1.45] |
| 7 Oxidative stress markers in exhaled breath condensate: H2O2 (μM) Show forest plot | 2 | Mean Difference (IV, Random, 95% CI) | Subtotals only | |
| 7.1 At 12 months | 2 | 105 | Mean Difference (IV, Random, 95% CI) | ‐0.16 [‐0.40, 0.09] |
| 8 Sputum oxidative stress: lipid peroxidation (8‐isoprostan) Show forest plot | 1 | Mean Difference (IV, Random, 95% CI) | Subtotals only | |
| 8.1 At 3 months | 1 | 42 | Mean Difference (IV, Random, 95% CI) | ‐51.3 [‐128.22, 25.62] |
| 8.2 At 6 months | 1 | 42 | Mean Difference (IV, Random, 95% CI) | ‐5.6 [‐95.70, 84.50] |
| 9 Sputum antioxidant status: free glutathione in sputum (pM) Show forest plot | 1 | Mean Difference (IV, Random, 95% CI) | Subtotals only | |
| 9.1 At 1 month | 1 | 55 | Mean Difference (IV, Random, 95% CI) | 131.3 [‐36.81, 299.41] |
| 9.2 At 3 months | 1 | 47 | Mean Difference (IV, Random, 95% CI) | 81.4 [‐8.01, 170.81] |
| 9.3 At 6 months | 1 | 50 | Mean Difference (IV, Random, 95% CI) | 59.1 [3.68, 114.52] |
| 10 Sputum antioxidant status: total glutathione in sputum (pM) Show forest plot | 1 | Mean Difference (IV, Random, 95% CI) | Subtotals only | |
| 10.1 At 1 month | 1 | 54 | Mean Difference (IV, Random, 95% CI) | 405.3 [105.27, 705.33] |
| 10.2 At 3 months | 1 | 48 | Mean Difference (IV, Random, 95% CI) | 329.2 [167.04, 491.36] |
| 10.3 At 6 months | 1 | 50 | Mean Difference (IV, Random, 95% CI) | 273.5 [‐19.52, 566.52] |
| 11 Sputum antioxidant status: glutathione in sputum neutrophils (MFI) Show forest plot | 1 | Mean Difference (IV, Random, 95% CI) | Subtotals only | |
| 11.1 At 1 month | 1 | 14 | Mean Difference (IV, Random, 95% CI) | 0.8 [‐0.06, 1.66] |
| 11.2 At 3 months | 1 | 15 | Mean Difference (IV, Random, 95% CI) | 3.70 [0.27, 7.13] |
| 11.3 At 6 months | 1 | 16 | Mean Difference (IV, Random, 95% CI) | 4.4 [1.52, 7.28] |
| 12 Plasma antioxidant status: free glutathione (pM) Show forest plot | 1 | Mean Difference (IV, Random, 95% CI) | Subtotals only | |
| 12.1 At 6 months | 1 | 57 | Mean Difference (IV, Random, 95% CI) | 2.20 [‐1.44, 5.84] |
| 13 Plasma antioxidant status: total glutathione (pM) Show forest plot | 1 | Mean Difference (IV, Random, 95% CI) | Subtotals only | |
| 13.1 At 6 months | 1 | 57 | Mean Difference (IV, Random, 95% CI) | 0.8 [‐2.07, 3.67] |
| 14 Plasma antioxidant status: glutathione in blood neutrophils (MFI) Show forest plot | 1 | Mean Difference (IV, Random, 95% CI) | Subtotals only | |
| 14.1 At 6 months | 1 | 13 | Mean Difference (IV, Random, 95% CI) | ‐2.9 [‐12.39, 6.59] |
| 15 Sputum oxidative stress: protein carbonyls (U) Show forest plot | 1 | Mean Difference (IV, Random, 95% CI) | Subtotals only | |
| 15.1 At 1 month | 1 | 49 | Mean Difference (IV, Random, 95% CI) | 4.20 [‐7.92, 16.32] |
| 15.2 At 3 months | 1 | 44 | Mean Difference (IV, Random, 95% CI) | ‐0.10 [‐13.20, 13.00] |
| 15.3 At 6 months | 1 | 41 | Mean Difference (IV, Random, 95% CI) | 10.70 [‐2.63, 24.03] |
| 16 Local inflammation: cytokines in sputum IL‐8 (pg/mL) Show forest plot | 1 | Mean Difference (IV, Random, 95% CI) | Subtotals only | |
| 16.1 At 6 months | 1 | 53 | Mean Difference (IV, Random, 95% CI) | ‐478.3 [‐1536.75, 580.15] |
| 17 Local inflammation: cytokines in sputum IL‐10 (pg/mL) Show forest plot | 1 | Mean Difference (IV, Random, 95% CI) | Subtotals only | |
| 17.1 At 6 months | 1 | 53 | Mean Difference (IV, Random, 95% CI) | ‐0.20 [‐10.12, 9.72] |
| 18 Local inflammation: cytokines in sputum TNF‐α (pg/mL) Show forest plot | 1 | Mean Difference (IV, Random, 95% CI) | Subtotals only | |
| 18.1 At 6 months | 1 | 53 | Mean Difference (IV, Random, 95% CI) | 19.8 [‐50.33, 89.93] |
| 19 Nutritional status: BMI (change from baseline) Show forest plot | 3 | Mean Difference (IV, Random, 95% CI) | Subtotals only | |
| 19.1 At 2 months | 1 | 16 | Mean Difference (IV, Random, 95% CI) | 0.10 [‐0.74, 0.94] |
| 19.2 At 12 months | 2 | 105 | Mean Difference (IV, Random, 95% CI) | 0.04 [‐8.20, 8.27] |
| 20 Nutritional status: weight (kg) Show forest plot | 1 | Mean Difference (IV, Random, 95% CI) | Subtotals only | |
| 20.1 At 1 month | 1 | 153 | Mean Difference (IV, Random, 95% CI) | 0.1 [‐0.23, 0.43] |
| 20.2 At 3 months | 1 | 153 | Mean Difference (IV, Random, 95% CI) | 1.0 [0.39, 1.61] |
| 20.3 At 6 months | 1 | 153 | Mean Difference (IV, Random, 95% CI) | 0.30 [‐0.37, 0.97] |
| 21 Number of pulmonary exacerbations during the study Show forest plot | 3 | Mean Difference (IV, Random, 95% CI) | Subtotals only | |
| 21.1 At 6 months | 1 | 153 | Mean Difference (IV, Random, 95% CI) | ‐0.09 [‐0.30, 0.12] |
| 21.2 At 12 months | 2 | 105 | Mean Difference (IV, Random, 95% CI) | ‐0.18 [‐0.60, 0.23] |
| 22 Time to first pulmonary exacerbation (days) Show forest plot | 2 | Mean Difference (IV, Random, 95% CI) | Subtotals only | |
| 22.1 At 12 months | 2 | 105 | Mean Difference (IV, Random, 95% CI) | ‐6.74 [‐48.76, 35.27] |
| 23 Adverse events Show forest plot | 4 | Peto Odds Ratio (Peto, Fixed, 95% CI) | Subtotals only | |
| 23.1 Hospitalization for non‐acute pulmonary exacerbations | 1 | 19 | Peto Odds Ratio (Peto, Fixed, 95% CI) | 0.42 [0.04, 4.63] |
| 23.2 Rhinitis/sinusitis or upper respiratory tract infection | 3 | 223 | Peto Odds Ratio (Peto, Fixed, 95% CI) | 1.04 [0.43, 2.55] |
| 23.3 Cough | 2 | 172 | Peto Odds Ratio (Peto, Fixed, 95% CI) | 1.14 [0.63, 2.08] |
| 23.4 Pharyngitis | 2 | 172 | Peto Odds Ratio (Peto, Fixed, 95% CI) | 1.12 [0.61, 2.06] |
| 23.5 Stomach pain/cramps | 2 | 70 | Peto Odds Ratio (Peto, Fixed, 95% CI) | 0.71 [0.19, 2.56] |
| 23.6 Headache | 3 | 223 | Peto Odds Ratio (Peto, Fixed, 95% CI) | 1.08 [0.55, 2.13] |
| 23.7 Chest tightness/bronchospasm | 2 | 70 | Peto Odds Ratio (Peto, Fixed, 95% CI) | 0.41 [0.08, 2.28] |
| 23.8 Nose bleed | 2 | 70 | Peto Odds Ratio (Peto, Fixed, 95% CI) | 0.31 [0.06, 1.59] |
| 23.9 Shortness of breath | 1 | 19 | Peto Odds Ratio (Peto, Fixed, 95% CI) | 0.42 [0.04, 4.63] |
| 23.10 Sputum increase | 1 | 153 | Peto Odds Ratio (Peto, Fixed, 95% CI) | 1.13 [0.55, 2.32] |
| 23.11 Pyrexia | 1 | 153 | Peto Odds Ratio (Peto, Fixed, 95% CI) | 1.76 [0.69, 4.49] |
| 23.12 Haemoptysis | 3 | 258 | Peto Odds Ratio (Peto, Fixed, 95% CI) | 0.94 [0.49, 1.79] |
| 23.13 Lung disorder | 1 | 153 | Peto Odds Ratio (Peto, Fixed, 95% CI) | 0.98 [0.38, 2.57] |
| 23.14 Sputum abnormal | 1 | 153 | Peto Odds Ratio (Peto, Fixed, 95% CI) | 1.59 [0.61, 4.14] |
| 23.15 Infection | 1 | 153 | Peto Odds Ratio (Peto, Fixed, 95% CI) | 1.42 [0.53, 3.80] |
| 23.16 Rales | 1 | 153 | Peto Odds Ratio (Peto, Fixed, 95% CI) | 1.11 [0.39, 3.11] |
| 23.17 Oropharyngeal pain | 1 | 153 | Peto Odds Ratio (Peto, Fixed, 95% CI) | 0.48 [0.17, 1.35] |
| 23.18 Condition aggravated | 1 | 153 | Peto Odds Ratio (Peto, Fixed, 95% CI) | 1.06 [0.52, 2.16] |
| 23.19 Pancreatitis | 1 | 51 | Peto Odds Ratio (Peto, Fixed, 95% CI) | 0.12 [0.00, 6.06] |
| 23.20 Constipation | 1 | 51 | Peto Odds Ratio (Peto, Fixed, 95% CI) | 6.61 [0.13, 335.50] |
| 23.21 Pityriasis | 1 | 51 | Peto Odds Ratio (Peto, Fixed, 95% CI) | 6.61 [0.13, 335.50] |
| 23.22 Impaired glucose tolerance | 1 | 51 | Peto Odds Ratio (Peto, Fixed, 95% CI) | 6.61 [0.13, 335.50] |
| 23.23 Distal intestinal obstruction | 2 | 105 | Peto Odds Ratio (Peto, Fixed, 95% CI) | 6.14 [0.62, 60.94] |