| 1 Lung function: FEV1 (% predicted) (mean change from baseline) Show forest plot | 8 | | Mean Difference (IV, Random, 95% CI) | Subtotals only |
|
| 1.1 At 2 months (combined supplement) | 1 | 46 | Mean Difference (IV, Random, 95% CI) | ‐4.3 [‐5.64, ‐2.96] |
| 1.2 At 3 months (NAC) | 4 | 125 | Mean Difference (IV, Random, 95% CI) | 2.83 [‐2.16, 7.83] |
| 1.3 at 4 months (multivitamins with antioxidants versus multivitamin alone | 1 | 69 | Mean Difference (IV, Random, 95% CI) | 1.44 [‐2.23, 5.11] |
| 1.4 At 6 months (NAC) | 1 | 62 | Mean Difference (IV, Random, 95% CI) | 4.38 [0.89, 7.87] |
| 1.5 At 6 months (GSH) | 1 | 47 | Mean Difference (IV, Random, 95% CI) | 17.4 [13.97, 20.83] |
| 1.6 At 6 months (β‐carotene) | 1 | 24 | Mean Difference (IV, Random, 95% CI) | 0.9 [‐20.09, 21.89] |
| 2 Lung function: FVC (% predicted) mean change from baseline Show forest plot | 5 | | Mean Difference (IV, Random, 95% CI) | Subtotals only |
|
| 2.1 At 2 months (combined supplement) | 1 | 46 | Mean Difference (IV, Random, 95% CI) | ‐4.2 [‐11.28, 2.88] |
| 2.2 At 3 months (NAC) | 3 | 115 | Mean Difference (IV, Random, 95% CI) | 3.34 [‐4.30, 10.97] |
| 2.3 At 6 months (NAC) | 1 | 62 | Mean Difference (IV, Random, 95% CI) | 3.75 [‐0.13, 7.63] |
| 2.4 At 6 months (GSH) | 1 | 47 | Mean Difference (IV, Random, 95% CI) | 14.80 [10.07, 19.53] |
| 3 QoL: Quality of Well Being Scale Show forest plot | 2 | | Std. Mean Difference (IV, Random, 95% CI) | Subtotals only |
|
| 3.1 At 2 months (combined supplement) | 1 | 46 | Std. Mean Difference (IV, Random, 95% CI) | ‐0.66 [‐1.26, ‐0.07] |
| 3.2 at 3 months (NAC) CF‐Q respiratory domain scale | 1 | 62 | Std. Mean Difference (IV, Random, 95% CI) | 0.33 [‐0.17, 0.83] |
| 3.3 at 6 months (NAC) CF‐Q respiratory domain scale | 1 | 61 | Std. Mean Difference (IV, Random, 95% CI) | ‐0.03 [‐0.53, 0.47] |
| 4 Oxidative stress: lipid peroxidation (H2O2) (μmol/L) Show forest plot | 1 | | Mean Difference (IV, Random, 95% CI) | Subtotals only |
|
| 4.1 At 5 months (selenium) | 1 | 27 | Mean Difference (IV, Random, 95% CI) | 15.90 [‐13.16, 44.96] |
| 5 Oxidative stress: lipid peroxidation (F2‐isoprostanes) (ng/L) Show forest plot | 1 | | Mean Difference (IV, Random, 95% CI) | Subtotals only |
|
| 5.1 At 2 months (combined supplement) | 1 | 46 | Mean Difference (IV, Random, 95% CI) | 1.0 [‐23.94, 25.94] |
| 6 Oxidative stress: lipid peroxidation (malondialdehyde) (μmol/L) mea difference to baseline) Show forest plot | 2 | 51 | Mean Difference (IV, Random, 95% CI) | ‐0.10 [‐0.45, 0.25] |
|
| 6.1 At 5 months (selenium) | 1 | 27 | Mean Difference (IV, Random, 95% CI) | ‐0.26 [‐0.67, 0.15] |
| 6.2 At 6 months (β‐carotene) | 1 | 24 | Mean Difference (IV, Random, 95% CI) | 0.10 [‐0.38, 0.58] |
| 7 Oxidative stress: urine 8‐iso‐PGF2α log 10 (pg/mL) Show forest plot | 1 | | Mean Difference (IV, Random, 95% CI) | Subtotals only |
|
| 7.1 At 4 months | 1 | 69 | Mean Difference (IV, Random, 95% CI) | 0.09 [‐0.10, 0.28] |
| 8 Oxidative stress: sputum 8‐iso‐PGF2α log10 (pg/mL) Show forest plot | 1 | | Mean Difference (IV, Random, 95% CI) | Subtotals only |
|
| 8.1 at 4 months | 1 | 65 | Mean Difference (IV, Random, 95% CI) | 0.02 [‐0.12, 0.16] |
| 9 Oxidative stress: sputum 8‐OHdG (log10) ng/ml Show forest plot | 1 | | Mean Difference (IV, Random, 95% CI) | Subtotals only |
|
| 9.1 At 4 months | 1 | 65 | Mean Difference (IV, Random, 95% CI) | ‐0.07 [‐0.24, 0.10] |
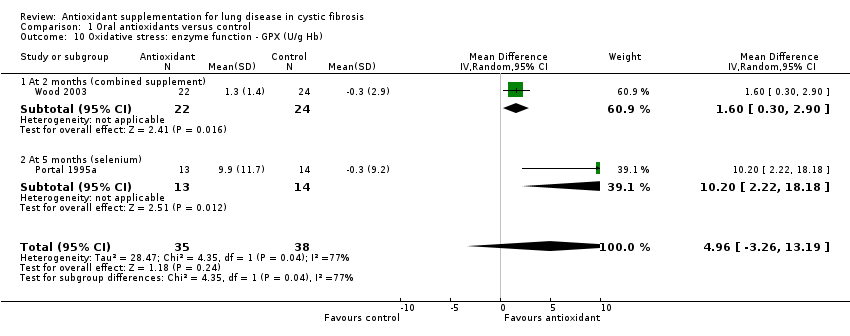
| 10 Oxidative stress: enzyme function ‐ GPX (U/g Hb) Show forest plot | 2 | 73 | Mean Difference (IV, Random, 95% CI) | 4.96 [‐3.26, 13.19] |
|
| 10.1 At 2 months (combined supplement) | 1 | 46 | Mean Difference (IV, Random, 95% CI) | 1.6 [0.30, 2.90] |
| 10.2 At 5 months (selenium) | 1 | 27 | Mean Difference (IV, Random, 95% CI) | 10.20 [2.22, 18.18] |
| 11 Oxidative stress: enzyme function ‐ SOD (U/mg Hb) Show forest plot | 1 | | Mean Difference (IV, Random, 95% CI) | Subtotals only |
|
| 11.1 At 2 months (combined supplement) | 1 | 46 | Mean Difference (IV, Random, 95% CI) | 0.27 [‐1.24, 1.78] |
| 12 Oxidative stress: potency (TEAC) (mmol/L) Show forest plot | 1 | | Mean Difference (IV, Random, 95% CI) | Subtotals only |
|
| 12.1 At 6 months (β‐carotene) | 1 | 24 | Mean Difference (IV, Random, 95% CI) | 0.04 [‐0.17, 0.25] |
| 13 Plasma total antioxidant capacity (nmol) (change from baseline) Show forest plot | 1 | | Mean Difference (IV, Random, 95% CI) | Subtotals only |
|
| 13.1 At 3 months (β‐carotene) | 1 | 24 | Mean Difference (IV, Random, 95% CI) | 0.1 [‐0.18, 0.38] |
| 13.2 At 6 months (β‐carotene) | 1 | 24 | Mean Difference (IV, Random, 95% CI) | 0.04 [‐0.30, 0.38] |
| 14 Plasma total antioxidant capacity (log10) (CRE) Show forest plot | 1 | | Mean Difference (IV, Random, 95% CI) | Subtotals only |
|
| 14.1 At 1 month | 1 | 66 | Mean Difference (IV, Random, 95% CI) | 0.0 [‐0.02, 0.02] |
| 14.2 At 4 months | 1 | 72 | Mean Difference (IV, Random, 95% CI) | ‐0.01 [‐0.04, 0.02] |
| 15 Plasma antioxidant status: vitamin E (μmol/L) Show forest plot | 5 | | Mean Difference (IV, Random, 95% CI) | Subtotals only |
|
| 15.1 At 1 month (water‐miscible vitamin E) | 1 | 18 | Mean Difference (IV, Random, 95% CI) | 26.7 [15.90, 37.50] |
| 15.2 At 1 month (fat‐soluble vitamin E) | 1 | 19 | Mean Difference (IV, Random, 95% CI) | 13.47 [9.05, 17.89] |
| 15.3 At 1 month (antioxidant‐enriched multivitamin) | 1 | 66 | Mean Difference (IV, Random, 95% CI) | ‐3.48 [‐8.01, 1.05] |
| 15.4 At 2 months (water‐miscible vitamin E and combined supplement | 2 | 83 | Mean Difference (IV, Random, 95% CI) | 10.65 [6.53, 14.77] |
| 15.5 at 4 month (antioxidant ‐enriched multivitamin) | 1 | 72 | Mean Difference (IV, Random, 95% CI) | ‐1.86 [‐6.36, 2.64] |
| 15.6 At 6 months (water‐miscible vitamin E) | 1 | 33 | Mean Difference (IV, Random, 95% CI) | 19.73 [12.48, 26.98] |
| 15.7 At 6 months (oral GSH) | 1 | 44 | Mean Difference (IV, Random, 95% CI) | 4.26 [2.03, 6.49] |
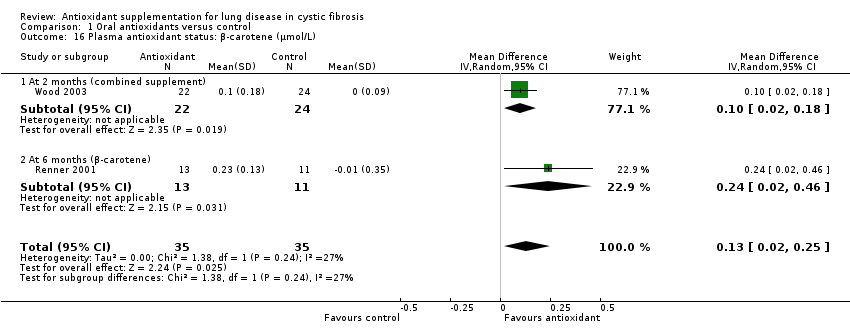
| 16 Plasma antioxidant status: β‐carotene (μmol/L) Show forest plot | 2 | 70 | Mean Difference (IV, Random, 95% CI) | 0.13 [0.02, 0.25] |
|
| 16.1 At 2 months (combined supplement) | 1 | 46 | Mean Difference (IV, Random, 95% CI) | 0.1 [0.02, 0.18] |
| 16.2 At 6 months (β‐carotene) | 1 | 24 | Mean Difference (IV, Random, 95% CI) | 0.24 [0.02, 0.46] |
| 17 Plasma antioxidant status: selenium (μmol/L) Show forest plot | 2 | 73 | Mean Difference (IV, Random, 95% CI) | 0.48 [0.27, 0.68] |
|
| 17.1 At 2 months (combined supplement) | 1 | 46 | Mean Difference (IV, Random, 95% CI) | 0.6 [0.39, 0.81] |
| 17.2 At 5 months (selenium) | 1 | 27 | Mean Difference (IV, Random, 95% CI) | 0.39 [0.27, 0.51] |
| 18 Plasma antioxidant status: vitamin C (μmol/L) Show forest plot | 1 | | Mean Difference (IV, Random, 95% CI) | Subtotals only |
|
| 18.1 At 2 months (combined supplement) | 1 | 46 | Mean Difference (IV, Random, 95% CI) | 8.0 [‐15.05, 31.05] |
| 19 Plasma antioxidant status: whole blood GSH (μmol/L) (change from baseline) Show forest plot | 1 | | Mean Difference (IV, Random, 95% CI) | Subtotals only |
|
| 19.1 at 3 months | 1 | 61 | Mean Difference (IV, Random, 95% CI) | 19.00 [‐183.58, 221.58] |
| 19.2 at 6 months | 1 | 60 | Mean Difference (IV, Random, 95% CI) | 64.10 [‐170.05, 298.25] |
| 20 Plasma antioxidant status: plasma fatty acid status (mg/L) Show forest plot | 1 | | Mean Difference (IV, Random, 95% CI) | Subtotals only |
|
| 20.1 At 2 months (combined supplement) | 1 | 46 | Mean Difference (IV, Random, 95% CI) | 166.0 [‐61.38, 393.38] |
| 21 Plasma inflammation: IL‐6 (pg/mL) at 3 months (vitamin E) Show forest plot | 1 | | Mean Difference (IV, Random, 95% CI) | Subtotals only |
|
| 21.1 FEV1 > 85% and no DNase | 1 | 12 | Mean Difference (IV, Random, 95% CI) | ‐2.02 [‐4.63, 0.59] |
| 21.2 FEV1 > 85% and DNase | 1 | 9 | Mean Difference (IV, Random, 95% CI) | ‐0.31 [‐4.03, 3.41] |
| 21.3 FEV1 range 70% ‐ 85% and DNase | 1 | 11 | Mean Difference (IV, Random, 95% CI) | ‐0.24 [‐3.80, 3.32] |
| 22 Plasma inflammation: TNF‐α (pg/mL) at 3 months (vitamin E) Show forest plot | 1 | | Mean Difference (IV, Random, 95% CI) | Subtotals only |
|
| 22.1 FEV1 > 85% and no DNase | 1 | 12 | Mean Difference (IV, Random, 95% CI) | ‐1.37 [‐3.61, 0.87] |
| 22.2 FEV1 > 85% and DNase | 1 | 14 | Mean Difference (IV, Random, 95% CI) | 0.33 [‐0.49, 1.15] |
| 22.3 FEV1 range 70% ‐ 85% and DNase | 1 | 11 | Mean Difference (IV, Random, 95% CI) | ‐0.94 [‐1.61, ‐0.26] |
| 23 Plasma IL‐8 pg/mL (log 10) (change from baseline) Show forest plot | 1 | | Mean Difference (IV, Random, 95% CI) | Subtotals only |
|
| 23.1 At 3 months | 1 | 61 | Mean Difference (IV, Random, 95% CI) | 0.01 [‐0.19, 0.21] |
| 23.2 At 6 months | 1 | 56 | Mean Difference (IV, Random, 95% CI) | ‐0.09 [‐0.32, 0.14] |
| 24 Sputum IL‐8 pg/ml (log 10) (per volume) Show forest plot | 3 | | Mean Difference (IV, Random, 95% CI) | Subtotals only |
|
| 24.1 At 3 months (NAC) | 2 | 92 | Mean Difference (IV, Random, 95% CI) | ‐0.01 [‐0.15, 0.14] |
| 24.2 At 4 months ( antioxidant enriched vitamins) | 1 | 65 | Mean Difference (IV, Random, 95% CI) | ‐0.06 [‐0.24, 0.12] |
| 24.3 At 6 months (NAC) | 1 | 56 | Mean Difference (IV, Random, 95% CI) | 0.19 [‐0.03, 0.41] |
| 25 Sputum human neutrophil elastase (log 10) (mg/mg) per weight (change from baseline) Show forest plot | 1 | | Mean Difference (IV, Random, 95% CI) | Subtotals only |
|
| 25.1 At 3 months | 1 | 61 | Mean Difference (IV, Random, 95% CI) | ‐0.04 [‐0.24, 0.16] |
| 25.2 At 6 months | 1 | 56 | Mean Difference (IV, Random, 95% CI) | 0.11 [‐0.11, 0.33] |
| 26 Sputum neutrophil count (logarithm) Show forest plot | 1 | | Mean Difference (IV, Random, 95% CI) | Subtotals only |
|
| 26.1 at 3 months | 1 | 63 | Mean Difference (IV, Random, 95% CI) | 1.90 [‐8.08, 11.88] |
| 26.2 at 6 months | 1 | 61 | Mean Difference (IV, Random, 95% CI) | 2.60 [‐11.85, 17.05] |
| 27 Sputum myeloperoxidase (MPO) levels (log 10) (ng/mL) Show forest plot | 1 | | Mean Difference (IV, Random, 95% CI) | Subtotals only |
|
| 27.1 At 4 months (multivitamins with antioxidants versus multivitamin alone | 1 | 65 | Mean Difference (IV, Random, 95% CI) | ‐0.13 [‐0.48, 0.22] |
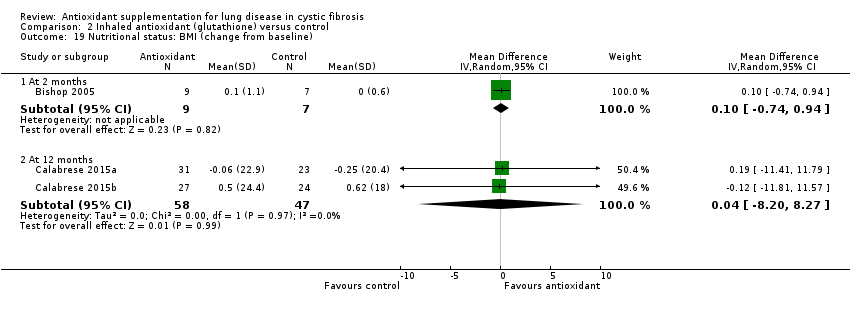
| 28 Nutritional status: BMI (change from baseline) Show forest plot | 1 | | Mean Difference (IV, Random, 95% CI) | Subtotals only |
|
| 28.1 At 3 months (NAC) | 1 | 64 | Mean Difference (IV, Random, 95% CI) | 0.30 [‐0.02, 0.62] |
| 28.2 At 6 months (NAC) | 1 | 62 | Mean Difference (IV, Random, 95% CI) | 0.2 [‐0.23, 0.63] |
| 29 Nutritional status: BMI percentile (change from baseline) Show forest plot | 1 | | Mean Difference (IV, Random, 95% CI) | Subtotals only |
|
| 29.1 At 3 months (GSH) | 1 | 40 | Mean Difference (IV, Random, 95% CI) | 9.2 [6.22, 12.18] |
| 29.2 At 6 months (GSH) | 1 | 40 | Mean Difference (IV, Random, 95% CI) | 17.20 [14.35, 20.05] |
| 30 Nutritional status: weight (kg) (change from baseline) Show forest plot | 3 | | Mean Difference (IV, Random, 95% CI) | Subtotals only |
|
| 30.1 At 3 months (NAC) | 2 | 84 | Mean Difference (IV, Random, 95% CI) | 0.24 [‐0.73, 1.22] |
| 30.2 At 6 months (NAC) | 1 | 62 | Mean Difference (IV, Random, 95% CI) | 0.60 [‐0.51, 1.71] |
| 30.3 At 6 months (water‐miscible vitamin E) | 1 | 36 | Mean Difference (IV, Random, 95% CI) | ‐0.30 [‐7.19, 6.59] |
| 31 Nutritional status: weight percentile (change from baseline) Show forest plot | 1 | | Mean Difference (IV, Random, 95% CI) | Subtotals only |
|
| 31.1 At 3 months (GSH) | 1 | 44 | Mean Difference (IV, Random, 95% CI) | 8.1 [5.64, 10.56] |
| 31.2 At 6 months (GSH) | 1 | 44 | Mean Difference (IV, Random, 95% CI) | 17.0 [14.64, 19.36] |
| 32 Antibiotic days per participant Show forest plot | 2 | 70 | Mean Difference (IV, Random, 95% CI) | ‐4.28 [‐15.16, 6.60] |
|
| 32.1 At 2 months (combined supplement) | 1 | 46 | Mean Difference (IV, Random, 95% CI) | 4.0 [‐14.06, 22.06] |
| 32.2 At 6 months (β‐carotene) | 1 | 24 | Mean Difference (IV, Random, 95% CI) | ‐8.0 [‐18.78, 2.78] |
| 33 Number of participants with at least one exacerbation Show forest plot | 2 | 143 | Risk Ratio (M‐H, Random, 95% CI) | 0.80 [0.59, 1.09] |
|
| 33.1 At 4 months (multivitamins with antioxidants versus multivitamin alone | 1 | 73 | Risk Ratio (M‐H, Random, 95% CI) | 0.78 [0.53, 1.14] |
| 33.2 At 6 months (NAC) | 1 | 70 | Risk Ratio (M‐H, Random, 95% CI) | 0.83 [0.50, 1.39] |
| 34 Number of hospitalizations Show forest plot | 1 | | Risk Ratio (M‐H, Random, 95% CI) | Subtotals only |
|
| 34.1 At 6 months (NAC) | 1 | 70 | Risk Ratio (M‐H, Random, 95% CI) | 0.94 [0.49, 1.81] |
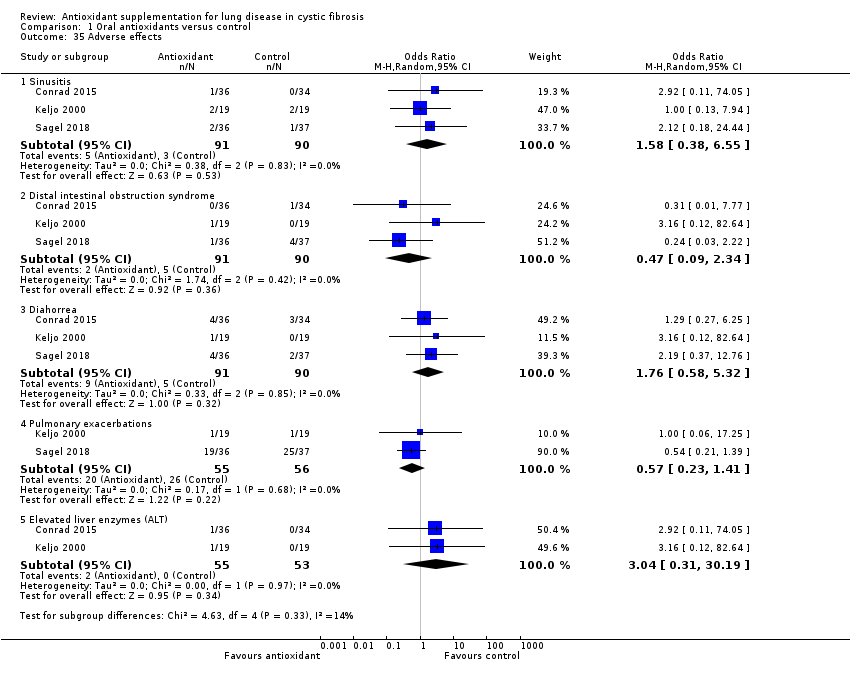
| 35 Adverse effects Show forest plot | 3 | | Odds Ratio (M‐H, Random, 95% CI) | Subtotals only |
|
| 35.1 Sinusitis | 3 | 181 | Odds Ratio (M‐H, Random, 95% CI) | 1.58 [0.38, 6.55] |
| 35.2 Distal intestinal obstruction syndrome | 3 | 181 | Odds Ratio (M‐H, Random, 95% CI) | 0.47 [0.09, 2.34] |
| 35.3 Diahorrea | 3 | 181 | Odds Ratio (M‐H, Random, 95% CI) | 1.76 [0.58, 5.32] |
| 35.4 Pulmonary exacerbations | 2 | 111 | Odds Ratio (M‐H, Random, 95% CI) | 0.57 [0.23, 1.41] |
| 35.5 Elevated liver enzymes (ALT) | 2 | 108 | Odds Ratio (M‐H, Random, 95% CI) | 3.04 [0.31, 30.19] |