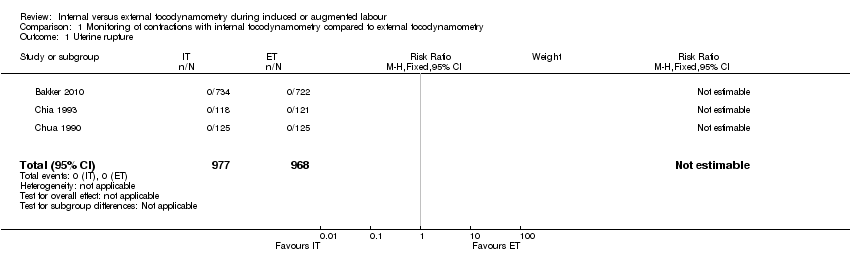
| 1 Uterine rupture Show forest plot | 3 | 1945 | Risk Ratio (M‐H, Fixed, 95% CI) | 0.0 [0.0, 0.0] |
|
| 2 Hyperstimulation Show forest plot | 2 | 489 | Risk Ratio (M‐H, Fixed, 95% CI) | 1.21 [0.78, 1.88] |
|
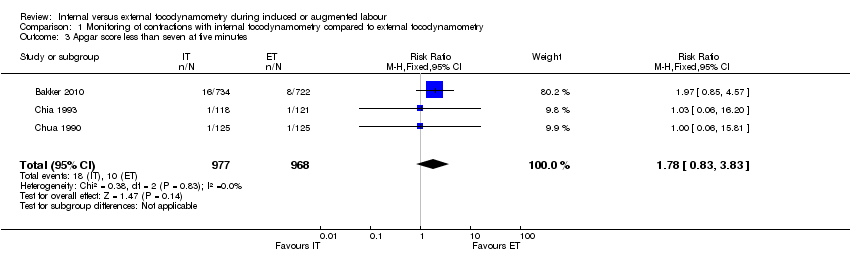
| 3 Apgar score less than seven at five minutes Show forest plot | 3 | 1945 | Risk Ratio (M‐H, Fixed, 95% CI) | 1.78 [0.83, 3.83] |
|
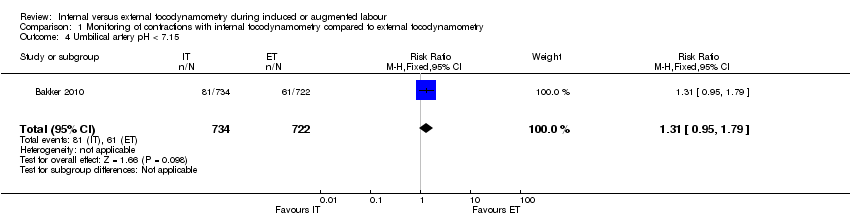
| 4 Umbilical artery pH < 7.15 Show forest plot | 1 | 1456 | Risk Ratio (M‐H, Fixed, 95% CI) | 1.31 [0.95, 1.79] |
|
| 5 Umbilical artery pH < 7.05 Show forest plot | 1 | 1456 | Risk Ratio (M‐H, Fixed, 95% CI) | 0.90 [0.40, 2.03] |
|
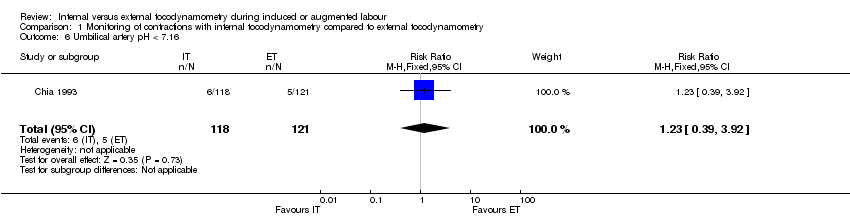
| 6 Umbilical artery pH < 7.16 Show forest plot | 1 | 239 | Risk Ratio (M‐H, Fixed, 95% CI) | 1.23 [0.39, 3.92] |
|
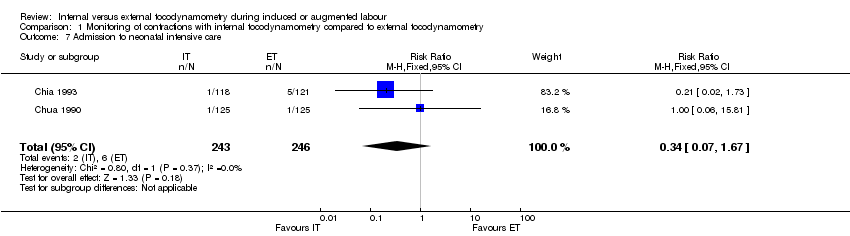
| 7 Admission to neonatal intensive care Show forest plot | 2 | 489 | Risk Ratio (M‐H, Fixed, 95% CI) | 0.34 [0.07, 1.67] |
|
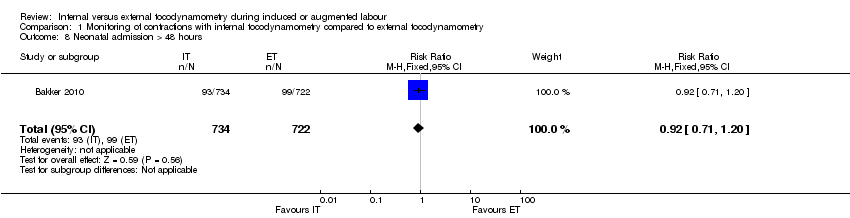
| 8 Neonatal admission > 48 hours Show forest plot | 1 | 1456 | Risk Ratio (M‐H, Fixed, 95% CI) | 0.92 [0.71, 1.20] |
|
| 9 Perinatal mortality Show forest plot | 3 | 1945 | Risk Ratio (M‐H, Fixed, 95% CI) | 0.0 [0.0, 0.0] |
|
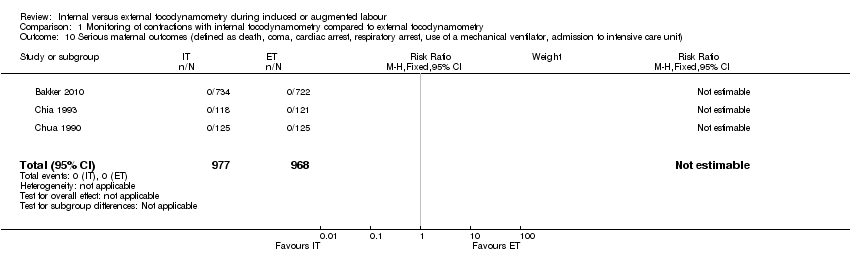
| 10 Serious maternal outcomes (defined as death, coma, cardiac arrest, respiratory arrest, use of a mechanical ventilator, admission to intensive care unit) Show forest plot | 3 | 1945 | Risk Ratio (M‐H, Fixed, 95% CI) | 0.0 [0.0, 0.0] |
|
| 11 Instrumental delivery Show forest plot | 3 | 1945 | Risk Ratio (M‐H, Fixed, 95% CI) | 1.05 [0.91, 1.21] |
|
| 11.1 Induced labour | 2 | 1195 | Risk Ratio (M‐H, Fixed, 95% CI) | 0.91 [0.75, 1.10] |
| 11.2 Augmented labour | 2 | 750 | Risk Ratio (M‐H, Fixed, 95% CI) | 1.25 [1.02, 1.53] |
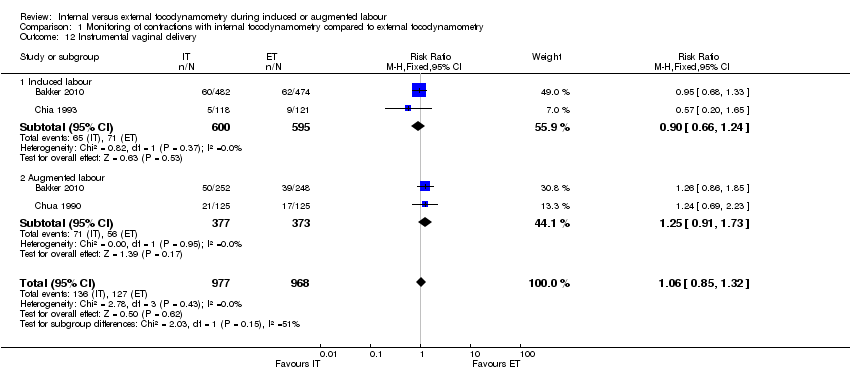
| 12 Instrumental vaginal delivery Show forest plot | 3 | 1945 | Risk Ratio (M‐H, Fixed, 95% CI) | 1.06 [0.85, 1.32] |
|
| 12.1 Induced labour | 2 | 1195 | Risk Ratio (M‐H, Fixed, 95% CI) | 0.90 [0.66, 1.24] |
| 12.2 Augmented labour | 2 | 750 | Risk Ratio (M‐H, Fixed, 95% CI) | 1.25 [0.91, 1.73] |
| 13 Caesarean section Show forest plot | 3 | 1945 | Risk Ratio (M‐H, Fixed, 95% CI) | 1.04 [0.85, 1.29] |
|
| 13.1 Induced labour | 2 | 1195 | Risk Ratio (M‐H, Fixed, 95% CI) | 0.91 [0.68, 1.21] |
| 13.2 Augmented labour | 2 | 750 | Risk Ratio (M‐H, Fixed, 95% CI) | 1.25 [0.91, 1.71] |
| 14 Mean time to delivery Show forest plot | 1 | 1456 | Mean Difference (IV, Fixed, 95% CI) | ‐15.60 [‐40.99, 9.79] |
|
| 14.1 induced labour | 1 | 956 | Mean Difference (IV, Fixed, 95% CI) | ‐25.78 [‐58.57, 7.01] |
| 14.2 Augmented labour | 1 | 500 | Mean Difference (IV, Fixed, 95% CI) | ‐0.35 [‐40.47, 39.77] |
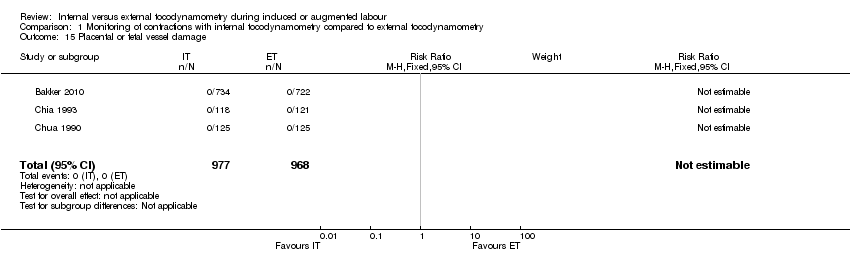
| 15 Placental or fetal vessel damage Show forest plot | 3 | 1945 | Risk Ratio (M‐H, Fixed, 95% CI) | 0.0 [0.0, 0.0] |
|
| 16 Indication of infection up to three weeks postpartum in mother or child Show forest plot | 1 | 1435 | Risk Ratio (M‐H, Fixed, 95% CI) | 0.84 [0.61, 1.16] |
|
| 17 Signs intrauterine infection during labor Show forest plot | 1 | 1456 | Risk Ratio (M‐H, Fixed, 95% CI) | 0.69 [0.44, 1.08] |
|