| 1 Loss of 3+ ETDRS lines at 12 months Show forest plot | 1 | | Risk Ratio (M‐H, Fixed, 95% CI) | Totals not selected |
|
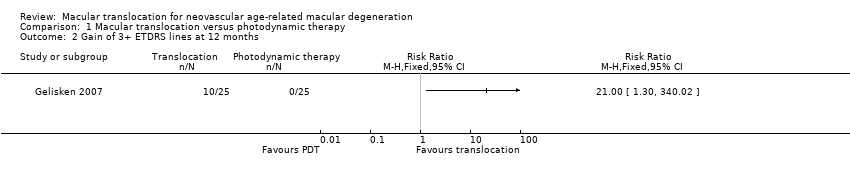
| 2 Gain of 3+ ETDRS lines at 12 months Show forest plot | 1 | | Risk Ratio (M‐H, Fixed, 95% CI) | Totals not selected |
|
| 3 Mean change of visual acuity at 12 months Show forest plot | 1 | | Mean Difference (IV, Fixed, 95% CI) | Totals not selected |
|
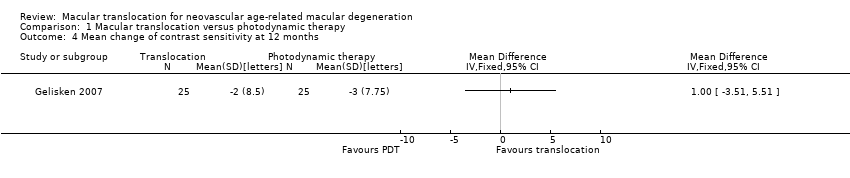
| 4 Mean change of contrast sensitivity at 12 months Show forest plot | 1 | | Mean Difference (IV, Fixed, 95% CI) | Totals not selected |
|
| 5 Mean change of near visual acuity scores at 12 months Show forest plot | 1 | | Mean Difference (IV, Fixed, 95% CI) | Totals not selected |
|
| 6 CNV recurrence at 12 months Show forest plot | 1 | | Risk Ratio (M‐H, Fixed, 95% CI) | Totals not selected |
|
| 7 NEI‐VFQ subscale: General Health (mean change at 12 months) Show forest plot | 1 | | Mean Difference (IV, Fixed, 95% CI) | Totals not selected |
|
| 8 NEI‐VFQ subscale: Distance Activity (mean change at 12 months) Show forest plot | 1 | | Mean Difference (IV, Fixed, 95% CI) | Totals not selected |
|
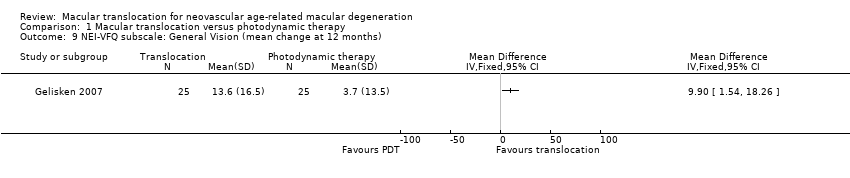
| 9 NEI‐VFQ subscale: General Vision (mean change at 12 months) Show forest plot | 1 | | Mean Difference (IV, Fixed, 95% CI) | Totals not selected |
|
| 10 NEI‐VFQ subscale: Ocular Pain (mean change at 12 months) Show forest plot | 1 | | Mean Difference (IV, Fixed, 95% CI) | Totals not selected |
|
| 11 NEI‐VFQ subscale: Near Activity (mean change at 12 months) Show forest plot | 1 | | Mean Difference (IV, Fixed, 95% CI) | Totals not selected |
|
| 12 NEI‐VFQ subscale: Social Functioning (mean change at 12 months) Show forest plot | 1 | | Mean Difference (IV, Fixed, 95% CI) | Totals not selected |
|
| 13 NEI‐VFQ subscale: Mental Health (mean change at 12 months) Show forest plot | 1 | | Mean Difference (IV, Fixed, 95% CI) | Totals not selected |
|
| 14 NEI‐VFQ subscale: Role Difficulties (mean change at 12 months) Show forest plot | 1 | | Mean Difference (IV, Fixed, 95% CI) | Totals not selected |
|
| 15 NEI‐VFQ subscale: Colour Vision (mean change at 12 months) Show forest plot | 1 | | Mean Difference (IV, Fixed, 95% CI) | Totals not selected |
|
| 16 NEI‐VFQ subscale: Peripheral Vision (mean change at 12 months) Show forest plot | 1 | | Mean Difference (IV, Fixed, 95% CI) | Totals not selected |
|