สิ่งแทรกแซงทางดนตรีเพื่อปรับปรุงผลลัพธ์ทางด้านจิตใจและทางกายภาพในผู้ป่วยโรคมะเร็ง
บทคัดย่อ
บทนำ
การเป็นโรคมะเร็งอาจส่งผลให้เกิดความทุกข์ทรมานทางด้านอารมณ์ ร่างกายและทางด้านสังคม การแทรกแซงทางดนตรีถูกนำมาใช้เพื่อบรรเทาอาการและผลข้างเคียงในผู้ป่วยโรคมะเร็ง
วัตถุประสงค์
เพื่อประเมินและเปรียบเทียบผลของดนตรีบำบัดและเวชศาสตร์ดนตรีสำหรับผลลัพธ์ทางด้านจิตใจและกายภาพในผู้ป่วยโรคมะเร็ง
วิธีการสืบค้น
เราสืบค้นใน the Cochrane Central Register of Controlled Trials (CENTRAL) (2016, Issue 1), MEDLINE, Embase, CINAHL, PsycINFO, LILACS, Science Citation Index, CancerLit, CAIRSS, Proquest Digital Dissertations, ClinicalTrials.gov, การทดลองที่มีการควบคุมในปัจจุบัน the RILM Abstracts of Music Literature,http://www.wfmt.info/Musictherapyworld/1 และ the National Research Register เราสืบค้นในทุกฐานข้อมูล ยกเว้นสองฐานสุดท้าย ตั้งแต่เริ่มก่อตั้งจนถึงเดือนมกราคม 2016 อีกสองฐานที่ไม่มีบริการอีกต่อไป ดังนั้นเราจึงสืบค้นจนถึงวันที่สิ้นสุดบริการ เราสืบค้นด้วยมือเกี่ยวกับวารสารด้านดนตรีบำบัด ทบทวนรายการเอกสารอ้างอิงและติดต่อกับผู้เชี่ยวชาญ ไม่จำกัดเรื่องภาษา
เกณฑ์การคัดเลือก
เรารวบรวม randomized และ quasi‐randomized controlled trials เกี่ยวกับสิ่งแทรกแซงด้านดนตรีเพื่อปรับปรุงผลลัพธ์ทางด้านจิตใจและกายภาพในผู้ป่วยโรคมะเร็งทั้งผู้ใหญ่และเด็ก เราไม่รวมผู้เข้าร่วมการศึกษาที่ได้รับการตรวจชิ้นเนื้อและผู้ที่ได้รับการเจาะเพื่อวัตถุประสงค์ในการวินิจฉัย
การรวบรวมและวิเคราะห์ข้อมูล
ผู้ทบทวนสองคนดึงข้อมูลและประเมินความเสี่ยงของการมีอคติอย่างอิสระต่อกัน ซึ่งเป็นไปได้ เรานำเสนอผลลัพธ์จากการวิเคราะห์เมตต้าโดยใช้ผลต่างค่าเฉลี่ยและผลต่างค่าเฉลี่ยมาตรฐาน เราใช้ผลคะแนนหลังการทดสอบ ในกรณีที่มีความแตกต่างของลักษณะพื้นฐานอย่างมีนัยสำคัญ เราใช้ผลคะแนนที่เปลี่ยนแปลงไป
ผลการวิจัย
เราจำแนกการศึกษาใหม่ 22 เรื่องสำหรับการนำเข้าในการปรับปรุงใหม่นี้ โดยรวมแล้ว หลักฐานจากการทบทวนครั้งนี้นำเข้าการศึกษาทั้งสิ้น 52 เรื่อง ประกอบด้วยผู้เข้าร่วมการศึกษา 3731 คน เรานำเข้าการศึกษาเกี่ยวกับสิ่งแทรกแซงทางดนตรีที่เสนอแนะโดยนักดนตรีบำบัดที่ได้รับการอบรม รวมทั้งเวชศาสตร์ดนตรี ซึ่งหมายถึงการฟังดนตรีที่บันทึกไว้ล่วงหน้าโดยเจ้าหน้าที่ทางการแทย์ เราจัดหมวดหมู่ได้เป็นการทดลองที่เป็นดนตรีบำบัด 23 เรื่อง และการทดลองที่เป็นเวชศาสตร์ดนตรี 29 เรื่อง
ผลการวิจัยชี้ให้เห็นว่าสิ่งแทรกแซงทางดนตรีอาจมีผลที่เป็นประโยชน์ต่อความวิตกกังกวลในผู้ป่วยโรคมะเร็ง โดยค่าเฉลี่ยความวิตกกังวลลดลง 8.54 หน่วย (ช่วงเชื่อมั่น 95% ‐12.04 ถึง ‐5.05, P < 0.0001) คะแนนการวัดความวิตกกังวลตามสถานการณ์ของ Spielberger (the Spielberger State Anxiety Inventory ‐ State Anxiety (STAI‐S)) (ช่วง 20 ถึง 80) และ หน่วยมาตรฐาน ‐0.71 (การศึกษา 13 เรื่อง ผู้เข้าร่วม 1028 คน; 95% CI ‐0.98 ถึง ‐0.43, P<0.00001; หลักฐานคุณภาพต่ำ) ส่วนคะแนนความเครียดอื่นๆ ผลอยู่ในระดับปานกลางถึงมาก ผลการศึกษายังแสดงให้เห็นถึงผลกระทบในเชิงบวกต่อภาวะซึมเศร้าในระดับรุนแรงปานกลาง (การศึกษา 7 เรื่อง ผู้เข้าร่วม 723 คน; ผลต่างค่าเฉลี่ยมาตรฐาน (SMD): ‐0.40, 95% CI ‐0.74 ถึง ‐0.06, P = 0.02; หลักฐานคุณภาพต่ำมาก) แต่เนื่องจากคุณภาพของหลักฐานที่ต่ำมากสำหรับผลลัพธ์นี้ ดังนั้นจำเป็นต้องมีการอธิบายผลลัพธ์นี้ด้วยความระมัดระวัง เราไม่พบการสนับสนุนสำหรับผลของสิ่งแทรกแซงด้านดนตรีต่ออารมณ์หรือความทุกข์
สิ่งแทรกแซงด้านดนตรีอาจนำไปสู่การลดลงเพียงเล็กน้อยของอัตราการเต้นของหัวใจ อัตราการหายใจ และความดันโลหิต แต่ไม่ส่งผลต่อระดับความอิ่มตัวของออกซิเจนในเลือด เราพบว่ามีผลต่อการลดความเจ็บปวดอย่างมาก (การศึกษา 7 เรื่อง ผู้เข้าร่วม 528 คน; SMD: ‐0.91, 95% CI ‐1.46 ถึง ‐0.36, P = 0.001, หลักฐานคุณภาพต่ำ) นอกจากนี้ สิ่งแทรกแซงทางดนตรีมีผลการรักษาในระดับเล็กน้อยถึงปานกลางต่อความเมื่อยล้า (การศึกษา 6 เรื่อง ประกอบด้วยผู้เข้าร่วม 253 คน; SMD: ‐0.38, 95% CI ‐0.72 ถึง ‐0.04, P = 0.03; หลักฐานคุณภาพต่ำ) แต่เราไม่พบหลักฐานที่น่าเชื่อถือพอสำหรับการปรับปรุงการทำงานของร่างกาย
ผลการศึกษาชี้ให้เห็นถึงผลขนาดใหญ่ของสิ่งแทรกแซงทางดนตรีต่อคุณภาพชีวิตของผู้ป่วย (QoL) แต่ผลการศึกษาไม่สอดคล้องกันอย่างมากระหว่างการศึกษาและขนาดผลลัพธ์รวมสำหรับการศึกษาเรื่องเวชศาสตร์ดนตรี และดนตรีบำบัดมีช่วงความเชื่อมั่นกว้าง (SMD: 098, 95% CI ‐0.36 ถึง 2.33, P = 0.15, หลักฐานคุณภาพต่ำ) การเปรียบเทียบระหว่างดนตรีบำบัดและเวชศาสตร์ดนตรี ชี้ให้เห็นผลในระดับปานกลางของดนตรีบำบัดต่อคุณภาพชีวิตของผู้ป่วย (QoL) (การศึกษา 3 เรื่อง ประกอบด้วยผู้เข้าร่วม 132 คน; SMD: 0.42, 95% CI 0.06 ถึง 0.78, P = 0.02; หลักฐานคุณภาพต่ำมาก) แต่เราไม่พบหลักฐานของผลลัพธ์ในเรื่องเวชศาสตร์ดนตรี การเปรียบเทียบระหว่างการศึกษาดนตรีบำบัดและเวชศาสตร์ดนตรียังเป็นไปได้สำหรับผลลัพธ์เรื่องความวิตกกังวล ความซึมเศร้าและอารมณ์ แต่เราไม่พบความแตกต่างระหว่างสิ่งแทรกแซง 2 ชนิดสำหรับผลลัพธ์เหล่านี้
ผลจากการศึกษาเดี่ยวๆ ชี้ให้เห็นว่าการฟังดนตรีอาจลดความจำเป็นในการใช้ยาชาและยาระงับปวดตลอดจนลดเวลาในการฟื้นฟูและระยะเวลาอยู่โรงพยาบาล แต่ยังต้องการงานวิจัยเพิ่มเติมสำหรับผลลัพธ์เหล่านี้
เราไม่สามารถหาข้อสรุปเกี่ยวกับผลของสิ่งแทรกแซงด้านดนตรีต่อการทำงานของภูมิคุ้มกัน วิธีการปรับตัว การหายจากโรค หรือผลลัพธ์ด้านการสื่อสารเนื่องจากเราไม่สามารถรวมผลลัพธ์ของการศึกษาเหล่านี้ที่ถูกนำเข้ามา หรือเราสามารถระบุได้เเพียงหนึ่งการทดลองเท่านั้น สำหรับเรื่องชีวิตความเป็นอยู่ เราไม่พบหลักฐาว่ามีผลต่อวันรุ่น หรือวัยหนุ่มสาว และเราไม่สามารถหาข้อสรุปได้สำหรับวัยผู้ใหญ่
การศึกษาส่วนใหญ่ที่นำเข้าในการปรับปรุงการทบทวนนี้มีความเสี่ยงของการมีอคติสูง ดังนั้นคุณภาพของหลักฐานจึงต่ำ
ข้อสรุปของผู้วิจัย
การทบทวนวรรณกรรมอย่างเป็นระบบเรื่องนี้แสดงให้เห็นว่าการแทรกแซงด้านดนตรีอาจมีผลที่เป็นประโยชน์ต่อความวิตกกังวล ความเจ็บปวด ความเมื่อยล้า และ QoL ในผู้ป่วยโรคมะเร็ง นอกจากนี้ดนตรีอาจมีผลเล็กน้อยต่ออัตราการเต้นของหัวใจ อัตราการหายใจและความดันโลหิต การทดลองส่วนใหญ่มีความเสี่ยงของการมีอคติสูง ดังนั้นผลลัพธ์นี้จำเป็นต้องอธิบายด้วยความระมัดระวัง
PICO
ข้้อสรุปภาษาธรรมดา
สิ่งแทรกแซงทางดนตรีเป็นประโยชน์ต่อผู้ป่วยโรคมะเร็งหรือไม่
ประเด็นปัญหา
โรคมะเร็งอาจส่งผลให้เกิดความทุกข์ทรมานทางอารมณ์ ร่างกายและสังคม การดูแลรักษาโรคมะเร็งในปัจจุบันประกอบด้วยการแทรกแซงทางด้านจิตสังคมเพื่อปรับปรุงคุณภาพชีวิต ดนตรีบำบัดและเวชศาสตร์ดนตรีถูกนำมาใช้เพื่อบรรเทาอาการและผลข้างเคียงจากการรักษาและตอบสนองความต้องการด้านจิตสังคมในผู้ป่วยโรคมะเร็ง สำหรับเวชศาสตร์ดนตรี ผู้ป่วยเพียงแค่ฟังเพลงที่บันทึกไว้ล่วงหน้าที่เสนอแนะโดยแพทย์ผู้เชี่ยวชาญ ดนตรีบำบัดจำเป็นต้องใช้การแทรกแซงทางด้านดนตรีโดยนักดนตรีบำบัดที่ได้รับการฝึกฝน กระบวนการบำบัดที่มีอยู่และการใช้ประสบการณ์ด้านดนตรีปรับปรุงให้เหมาะกับบุคคล
วัตถุประสงค์ของการทบทวน
การทบทวนนี้เป็นการปรับปรุง Cochrane review ฉบับก่อนหน้าจากปี 2011 ซึ่งนำเข้าการศึกษา 30 เรื่องและพบการสนับสนุนผลการแทรกแซงทางด้านดนตรีต่อผลลัพธ์ทางจิตใจและกายภาพหลายประการ สำหรับการปรับปรุงการทบทวนเรื่องนี้ เราสืบค้นการทดลองเพิ่มเติมที่เป็นการศึกษาผลของสิ่งแทรกแซงทางดนตรีต่อผลลัพธ์ทางจิตใจและกายภาพในผู้ป่วยโรคมะเร็ง เราสืบค้นการศึกษาที่ตีพิมพ์และกำลังอยู่ในขั้นตอนการดำเนินการจนถึงเดือน มกราคม 2016 เราพิจารณาการศึกษาทั้งหมดที่เปรียบเทียบดนตรีบำบัดหรือเวชศาสตร์ดนตรีกับการรักษามาตรฐานอย่างเดียว หรือการดูแลมาตรฐานร่วมกับการรักษาอื่นๆหรือยาหลอก
อะไรคือผลลัพธ์หลัก
เราจำแนกได้เป็นการศึกษาใหม่ 22 เรื่อง ดังนั้นในการปรับปรุงหลักฐานในการทบทวนครั้งนี้มีการศึกษาทั้งสิ้น 52 เรื่อง ประกอบด้วยผู้เข้าร่วม 3731 คน ผลการศึกษาชี้ให้เห็นว่า ดนตรีบำบัดและเวชศาสตร์ดนตรีอาจมีผลที่เป็นประโยชน์ต่อความกังวล ความเจ็บปวด ความเมื่อยล้า อัตราการเต้นของหัวใจ และอัตราการหายใจ และความดันโลหิตในผู้ป่วยโรคมะเร็็ง เนื่องจากมีคุณภาพหลักฐานที่ต่ำมากในเรื่องความซึมเศร้า ยังไม่ชัดเจนว่าสิ่งแทรกแซงทางดนตรีอาจมีผลกระทบหรือไม่ ดนตรีบำบัดเท่านั้นไม่รวมเวชศาสตร์ดนตรี ที่อาจช่วยปรับปรุงคุณภาพชีวิตของผู้ป่วย เราไม่พบหลักฐานที่ว่าสิ่งแทรกแซงทางดนตรีช่วยปรับปรุงเรื่องอารมณ์ ความทุกข์ หรือการทำงานของร่างกาย แต่มีการทดลองเพียงเล็กน้อยที่ศึกษาเกี่ยวกับผลลัพธ์เหล่านี้ เราไม่สามารถหาข้อสรุปเกี่ยวกับผลของสิ่งแทรกแซงทางดนตรีต่อการทำงานของภูมิคุ้มกัน วิธีการปรับตัว การหายจากโรคหรือผลลัพธ์ด้านการสื่อสารเนื่องจากมีการศึกษาไม่เพียงพอที่จะพิจารณาประเด็นเหล่านี้ ดังนั้นจำเป็นต้องมีการศึกษาเพิ่มเติม
ไม่มีการรายงานถึงผลข้างเคียงของสิ่งแทรกแซงทางดนตรี
คุณภาพของหลักฐาน
การทดลองส่วนใหญ่มีความเสี่ยงของการมีอคติสูง ดังนั้นจำเป็นต้องอธิบายผลลัพธ์ด้วยความระมัดระวัง เราไม่ได้พิจารณาเรื่องผลประโยชน์ทับซ้อนของการศึกษาที่นำเข้า
อะไรคือข้อสรุป
เราสรุปได้ว่าสิ่งแทรกแซงทางดนตรีอาจมีผลที่เป็นประโยชน์ต่อความวิตกกังวล ความเจ็บปวด ความเมื่อยล้า และคุณภาพชีวิต (Qol) ในผู้ป่วยโรคมะเร็ง นอกจากนี้ดนตรีอาจมีผลเชิงบวกเล็กน้อยต่ออัตราการเต้นของหัวใจ อัตราการหายใจและความดันโลหิต การลดความวิตกกังวล ความเมื่อยล้า และความเจ็บปวดเป็นผลลัพธ์ที่สำคัญสำหรับผู้ป่วยโรคมะเร็งเนื่องจากมีผลต่อสุขภาพและ QoL โดยรวม ดังนั้นเราขอแนะนำให้พิจารณาเรื่องการรวมดนตรีบำบัดและเวชศาสตร์ดนตรีเข้าไปในการดูแลรักษาด้านจิตใจของผู้ป่วยโรคมะเร็ง
Authors' conclusions
Summary of findings
| Music interventions versus standard care for psychological and physical outcomes in cancer patients | ||||
| Patient or population: cancer patients | ||||
| Outcomes | Relative effect (95% CI) | No of participants | Quality of the evidence | Comments |
| Anxiety | The mean anxiety in the music intervention group was 8.54 units less (12.04 less to 5.05 less) than in the standard care group | 1028 | ⊕⊕⊝⊝ | — |
| Depression | The mean depression in the music intervention group was 0.40 standard deviations less (0.74 less to 0.06 less) than in the standard care group | 723 | ⊕⊝⊝⊝ | An SMD of 0.40 is considered a low to moderate effect size |
| Mood | The mean mood in the music intervention group was 0.47 standard deviations better (0.02 worse to 0.97 better) than in the standard care group | 236 | ⊕⊕⊝⊝ | An SMD of 0.47 is considered a moderate effect size |
| Pain | The mean pain in the intervention group was 0.91 standard deviations less (1.46 less to 0.36 less) than in the standard care group | 528 | ⊕⊕⊝⊝ | An SMD of 0.91 is considered a large effect size |
| Fatigue | The mean fatigue in the music intervention group was 0.38 standard deviations less (0.72 less to 0.04 less) than in the standard care group | 253 | ⊕⊕⊝⊝ | An SMD of 0.38 is considered a small to moderate effect size |
| Quality of life | The mean quality of life in the music intervention group was 0.98 standard deviations more (0.36 less to 2.33 more) than in the standard care group | 545 | ⊕⊕⊝⊝ | An SMD of 0.98 is considered a large effect size |
| *The risk in the intervention group (and its 95% confidence interval) is based on the assumed risk in the comparison group and the relative effect of the intervention (and its 95% CI). | ||||
| GRADE Working Group grades of evidence | ||||
| a The majority of the trials were at high risk of bias. | ||||
Background
Description of the condition
The lifetime risk of developing any type of cancer is 44% for men and 38% for women (NCI 2010), and a diagnosis of cancer may result in extensive emotional, physical and social suffering. Many symptoms and treatment side effects have an impact on cancer patients' physical well‐being and quality of life (QoL), including appetite disturbance, difficulty swallowing, nausea, vomiting, constipation, diarrhea, dyspnea or difficulty breathing, fatigue, insomnia, muscle weakness and numbness (King 2003). In addition, study findings clearly indicate that people with cancer experience elevated levels of psychological distress and depression in response to diagnosis and treatment (van't Spijker 1997; Massie 2004; Norton 2004; Parle 1996; Raison 2003; Sellick 1999). The actual experience of chemotherapy‐induced side effects, such as nausea and vomiting, and their influence on psychological well‐being varies widely in patients receiving the same cytotoxic agents. This suggests that non‐pharmacological factors possibly play an important role in how patients experience or interpret physical symptoms during the treatment phase (Montgomery 2000; Thune‐Boyle 2006). It is therefore important that cancer care incorporates services that help meet patients' psychological, social and spiritual needs.
Description of the intervention
The use of music in cancer care can be situated along a continuum of care, namely from music listening initiated by patients, to pre‐recorded music offered by medical personnel, to music psychotherapy interventions offered by a trained music therapist. Therefore, when examining the efficacy of music interventions with cancer patients, it is important to make a clear distinction between music interventions administered by medical or healthcare professionals (music medicine) and those implemented by trained music therapists (music therapy). A substantive body of evidence suggests that music therapy interventions provided by medical professionals are significantly more effective than music medicine interventions for a wide variety of outcomes (Dileo 2005). This difference might be attributed to the fact that music therapists individualize their interventions to meet patients' specific needs, more actively engage the patients in music making, and employ a systematic therapeutic process including assessment, treatment and evaluation. Dileo 1999 categorizes interventions as music medicine when medical personnel offer pre‐recorded music for passive listening. For example, they may offer people a CD for relaxation or distraction; however, no systematic therapeutic process is present, nor is there a systematic assessment of the elements and suitability of the music stimulus. In contrast, music therapy requires the implementation of a music intervention by a trained music therapist, the presence of a therapeutic process and the use of personally tailored music experiences.
These music experiences include:
-
listening to live, improvised or pre‐recorded music;
-
performing music on an instrument;
-
improvising music spontaneously using voice, instruments or both;
-
composing music;
-
combining music with other therapeutic modalities (e.g. movement, imagery, art) (Dileo 2007).
How the intervention might work
Music interventions have been used in different medical fields to meet patients' psychological, physical, social and spiritual needs. Research on the effects of music and music therapy for medical patients has burgeoned over the past 20 years, examining a variety of outcome measures in a wide range of specialty areas (Dileo 2005). For both adult and pediatric cancer patients, music has been used to decrease anxiety prior to or during surgical procedures (Burns 1999; Haun 2001; Pfaff 1989), to decrease stress during chemotherapy or radiation therapy (Clark 2006; Weber 1996), to lessen treatment side effects (Bozcuk 2006; Ezzone 1998; Frank 1985), to improve mood (Bailey 1983Barrera 2002; Burns 2001a; Cassileth 2003), to enhance pain management (Akombo 2006; Beck 1989), to improve immune system functioning (Burns 2001a; Camprubi 1999), and to improve quality of life (QoL) (Burns 2001a; Hilliard 2003).
There are inherent elements of music—such as rhythm and tempo, mode, pitch, timbre, melody and harmony—that are known to influence physiological and psycho‐emotional responses in humans. For example, music has been found to arouse memory and association, stimulate imagery, evoke emotions, facilitate social interaction, and promote relaxation and distraction (Dileo 2006). In cancer settings, music therapists conduct ongoing assessments and utilize various individualized interventions in people with cancer and their families, including pertinent elements of music within the context of therapeutic relationships, to address prevailing biopsychosocial and spiritual issues, symptoms and needs (Magill 2009; McClean 2012). The following music therapy interventions are common: use of songs (singing, song writing, and lyric analysis); music improvisation (instrumental and vocal), music and imagery, music‐based reminiscence and life review, chanting and toning, music‐based relaxation, and instrumental participation (O'Callaghan 2015). Based on patient preferences and assessment outcomes, music therapists adapt and modify music interventions to address symptoms and areas of difficulty; they utilize music and verbal strategies to provide opportunities for expression and communication, reminiscence, the processing of thoughts and emotions and improvement of symptom management (Magill 2011). Therapist‐supported music therapy environments often provide the space and time through which patients and families may experience social connection, improve self fulfilment and acquire effective coping strategies (Magill 2015).
Why it is important to do this review
Several research studies on the use of music with cancer patients have reported positive results (Beck 1989; Cassileth 2003; Harper 2001; Hilliard 2003; Robb 2008). The majority of these studies, however, are compromised by small sample size and lack of statistical power. In addition, differences in factors such as methods of interventions and type and intensity of treatment have led to varying results. A systematic review is needed to more accurately gauge the efficacy of music interventions in cancer patients as well as to identify variables that may moderate its effects.
Objectives
To assess and compare the effects of music therapy and music medicine interventions for psychological and physical outcomes in people with cancer.
Methods
Criteria for considering studies for this review
Types of studies
All randomized controlled trials (RCTs) and studies with quasi‐randomized methods of treatment allocation (e.g. alternate allocation of treatments) were eligible for inclusion.
Types of participants
This review included participants diagnosed with any type of cancer. There were no restrictions as to age, sex, ethnicity or type of setting. We did exclude participants undergoing biopsy, bone marrow biopsy and aspiration for diagnostic purposes. This review did not include studies with cancer survivors.
Types of interventions
The review included all trials comparing standard treatment plus music therapy or music medicine interventions with:
-
standard care alone;
-
standard care plus alternative intervention (e.g. music therapy versus music medicine);
-
standard care plus placebo.
Placebo treatment can involve the use of headphones for the patient without provision of music stimuli or with another type of auditory stimulus (e.g. audiobooks, white noise (hiss), pink noise (sound of ocean waves) or nature sounds).
Types of outcome measures
Primary outcomes
-
Psychological outcomes (e.g. depression, anxiety, anger, hopelessness, helplessness)
-
Physical symptoms (e.g. fatigue, nausea, pain)
Secondary outcomes
-
Physiological outcomes (e.g. heart rate, respiratory rate, immunoglobulin A (IgA) levels)
-
Social and spiritual support (e.g. family support, spirituality, social activity, isolation)
-
Communication (e.g. verbalization, facial affect, gestures)
-
Quality of life (QoL)
Search methods for identification of studies
There were no language restrictions for either searching or trial inclusion.
Electronic searches
We searched the following electronic databases and trials registers.
-
Cochrane Central Register of Controlled Trials (CENTRAL) (The Cochrane Library, 2016, Issue 1) (Appendix 1);
-
MEDLINE (OvidSp) (1950 to January, week 2, 2016) (Appendix 2);
-
Embase (OvidSp) (1980 to 2016, week 4) (Appendix 3);
-
CINAHL (EbscoHost)(1982 to 23 January 2016) (Appendix 4);
-
5. PsycINFO (OvidSp) (1967 to January 15 2016) (Appendix 5);
-
LILACS (Virtual Health Library) (1982 to January 2016) (Appendix 6).
-
The Science Citation Index (ISI) (inception to January 2016) (Appendix 7).
-
CancerLit (1983 to 2003) (http://www.cancer.gov) (Appendix 8).
-
CAIRSS for Music (inception to January 2016) (http://ucairss.utsa.edu/) (Appendix 9).
-
Proquest Digital Dissertations (Proquest) (inception to January 2016) (Appendix 10).
-
ClinicalTrials.gov (http://www.clinicaltrials.gov/) (inception to January 2016) (Appendix 11).
-
Current Controlled Trials (http://www.controlled‐trials.com/) (inception to January 2016) (Appendix 12).
-
National Research Register (http://www.update‐software.com/National/) (inception to September 2010; the NRR is no longer active) (Appendix 13).
-
http://www.wfmt.info/Musictherapyworld/ (database is no longer functional) (inception to March 2008) .
-
RILM Abstracts of Music Literature (EbscoHost) (1969 to January 2016) (Appendix 14).
Searching other resources
We handsearched the following journals from first available date to January 2016
-
Australian Journal of Music Therapy.
-
Australian Music Therapy Association Bulletin.
-
Canadian Journal of Music Therapy.
-
The International Journal of the Arts in Medicine.
-
Journal of Music Therapy.
-
Musik‐,Tanz‐, und Kunsttherapie (Journal for Art Therapies in Education, Welfare and Health Care).
-
Musiktherapeutische Umschau.
-
Music Therapy.
-
Music Therapy Perspectives.
-
Nordic Journal of Music Therapy;
-
Music Therapy Today (online journal of music therapy).
-
Voices (online international journal of music therapy).
-
New Zealand Journal of Music Therapy.
-
The Arts in Psychotherapy.
-
British Journal of Music Therapy.
-
Music and Medicine.
-
Approaches.
In an effort to identify further published, unpublished and ongoing trials, we searched the bibliographies of relevant trials and reviews, contacted experts in the field, and searched available proceedings of music therapy conferences. We consulted music therapy association websites to help identify music therapy practitioners and conference information (e.g. the American Music Therapy Association at www.musictherapy.org and the British Association for Music Therapy at http://www.bamt.org). We also handsearched the website of the Deutsches Zentrum fur Musiktherapieforschung (www.dzm‐heidelberg.de/forschung/publikationen/) and the research pages of the PhD programs that are listed on the website of the European Music Therapy Confederation (emtc‐eu.com/music‐therapy‐research/).
Data collection and analysis
Selection of studies
We divided the responsibility of the searches, as outlined in the search strategy, amongst JB, AT and research assistants. JB, AT and research assistants scanned titles and abstracts of each record retrieved from the search and deleted obviously irrelevant references. When we could not reject a title or abstract with certainty, we consulted the other review authors. We used an inclusion criteria form to assess the trial's eligibility for inclusion (Appendix 15). We kept a record of all excluded trials that initially appeared eligible and the reason for exclusion.
Data extraction and management
JB and AT independently extracted data from the selected trials using a standardized coding form. We discussed differences in data extraction until reaching a consensus. We extracted the following data.
General information
-
Author
-
Year of publication
-
Title
-
Journal (title, volume, pages)
-
If unpublished, source
-
Duplicate publications
-
Country
-
Language of publication
Intervention information
-
Type of intervention (e.g. singing, song‐writing, music listening, music improvisation)
-
Music selection (detailed information on music selection in case of music listening)
-
Music preference (patient‐preferred versus researcher‐selected in case of music listening)
-
Level of intervention (music therapy versus music medicine, as defined by the authors in the Background)
-
Length of intervention
-
Frequency of intervention
-
Comparison intervention
Participant information
-
Total sample size
-
Number in experimental group
-
Number in control group
-
Sex
-
Age
-
Ethnicity
-
Diagnosis
-
Illness stage
-
Setting
-
Inclusion criteria
Outcomes
We extracted pre‐test means, post‐test means, standard deviations and sample sizes for the treatment group and the control group for the following outcomes (if applicable). For some trials only change scores, instead of post‐test scores, were available.
1. Psychological outcomes (e.g. depression, anxiety, anger, hopelessness, helplessness)
2. Physical symptoms (e.g. fatigue, nausea, pain)
3. Physiological outcomes (e.g. heart rate, respiratory rate, immunoglobulin A (IgA) levels)
4. Social and spiritual support (e.g. family support, spirituality, social activity, isolation)
5. Communication (e.g. verbalization, facial affect, gestures)
6. Quality of life
Assessment of risk of bias in included studies
Two review authors (JB and CD) assessed all included trials for risk of bias for the original review. CD and LM conducted the 'Risk of bias' assessment for new studies included in this update. All authors were blinded to each other's assessments. We resolved any disagreements by discussion. The authors used the following criteria for quality assessment.
Random sequence generation
-
Low risk
-
Unclear risk
-
High risk
We rated trials to be at low risk for random sequence generation if every participant had an equal chance to be selected for either condition and the investigator was unable to predict which treatment the participant would be assigned to. Use of date of birth, date of admission or alternation resulted in a a judgement of high risk of bias.
Allocation concealment
-
Low risk methods to conceal allocation include:
-
-
central randomization;
-
serially numbered, opaque, sealed envelopes;
-
other descriptions with convincing concealment.
-
-
Unclear risk ‐ authors did not adequately report on method of concealment
-
High risk (e.g. trials used alternation methods)
Blinding of participants and personnel
-
Low risk
-
Unclear risk
-
High risk
Since participants cannot be blinded in a music intervention trial, we did not downgrade studies for not blinding the participants. As for personnel, in music therapy studies music therapists cannot be blinded because they are actively making music with the patients. In contrast, in music medicine studies blinding of personnel is possible by providing control group participants with headphones but no music (e.g. blank CD). Therefore, downgrading for not blinding personnel was only applied in studies that used listening to pre‐recorded music.
Blinding of outcome assessors
-
Low risk
-
Unclear risk
-
High risk
When the study included no objective outcomes, we noted this in the Characteristics of included studies table, and we rated the trial as being at low risk of bias for outcome assessment of objective outcomes. The majority of the studies used self report measures for subjective outcomes. We rated these studies as being at high risk of bias for subjective outcomes, unless study participants were blinded to the study hypothesis (for comparative studies).
Incomplete outcome data
We recorded the proportion of participants whose outcomes were analyzed. We coded loss to follow‐up for each outcome as:
-
low risk: if fewer than 20% of patients were lost to follow‐up and reasons for loss to follow‐up were similar in both treatment arms;
-
unclear risk: if loss to follow‐up was not reported;
-
high risk: if more than 20% of patients were lost to follow‐up or reasons for loss to follow‐up differed between treatment arms.
Selective reporting
-
Low risk: reports of the study were free from suggestions of selective outcome reporting
-
Unclear risk
-
High risk: reports of the study suggest selective outcome reporting
Other sources of bias
-
Low risk
-
Unclear risk
-
High risk
We considered information on potential financial conflicts of interest to be a possible source of additional bias.
The above criteria were used to give each article an overall quality rating (based on section 8.7 of the Cochrane Handbook for Systematic Reviews of Interventions;Higgins 2011).
-
Low risk of bias ‐ all criteria met.
-
Moderate risk of bias ‐ one or more of the criteria only partly met.
-
High risk of bias ‐ one or more criteria not met.
Studies were not excluded based on a low quality score. We planned to use the overall quality assessment rating for sensitivity analysis. However, since most trials were at high risk of bias, we could not carry out this analysis.
Measures of treatment effect
We present all outcomes in this review as continuous variables. We calculated standardized mean differences with 95% confidence intervals (CI) for outcome measures using results from different scales. When there were sufficient data available from various studies using the same measurement instrument, we computed a mean difference (MD) with 95% CI.
Unit of analysis issues
In all studies included in this review, participants were individually randomized to the intervention or the standard care control group. Post‐test values or change values on a single measurement for each outcome from each participant were collected and analyzed.
Dealing with missing data
We did not impute missing outcome data. We analyzed data on an endpoint basis, including only participants for whom final data point measurement was available (available case analysis). We did not assume that participants who dropped out after randomization had a negative outcome.
Assessment of heterogeneity
We investigated heterogeneity using visual inspection of the forest plots as well as the I2 statistic (Higgins 2002).
Assessment of reporting biases
We tested for publication bias visually in the form of funnel plots (Higgins 2011).
Data synthesis
We present all outcomes in this review as continuous variables. We calculated standardized mean differences (SMD) for outcome measures using results from different scales. We used mean differences (MD) for results using the same scales. We anticipated that some individual trials would have used final scores and others change scores and even analysis of covariance (ANCOVA) in their statistical analyses of the results. We combined these different types of analyses as MDs. We determined not to pool the results in case of significant clinical heterogeneity. We calculated pooled estimates using the more conservative random‐effects model. We calculated 95% confidence intervals (CI) for each effect size estimate. We interpreted the magnitude of the SMDs using the interpretation guidelines put forth by Cohen 1988). Cohen suggested that an effect size of 0.2 be considered a small effect, an effect size of 0.5 medium, and an effect size of 0.8 large.
We made the following treatment comparisons in meta‐analyses.
-
Music interventions plus standard care versus standard care alone.
-
Music therapy versus music medicine interventions (this was only possible for anxiety).
-
Music interventions plus standard care versus standard care plus alternative relaxation interventions
-
Music interventions plus standard care versus standard care plus placebo (audiobook control).
Several studies compared music interventions with non‐music relaxation interventions. However, there was an insufficient number of trials to allow for a treatment comparison analysis. These studies are therefore included in the narrative under the third comparison (music intervention versus alternative intervention) but not in the meta‐analysis of this review.
Subgroup analysis and investigation of heterogeneity
We conducted the following subgroup analyses within the music interventions plus standard care versus standard care alone comparison for outcomes with a sufficient number of available studies.
-
Music medicine versus music therapy.
-
Type of intervention (e.g. music listening alone versus music‐guided relaxation).
-
Music preference (patient‐preferred music versus researcher‐selected music).
We planned the following subgroup analyses a priori, but we could not carry these out because of insufficient numbers of trials per outcome for age subgroup analysis and because no separate data were available according to stage of illness.
-
Different age groups.
-
Stages of illness.
We conducted subgroup analyses as described by Deeks 2001 and recommended in section 9.6 of Higgins 2011.
Sensitivity analysis
We examined the impact of sequence generation by comparing the results of including and excluding trials that used inadequate or unclear randomization methods.
Results
Description of studies
Results of the search
For the original review, the database searches and handsearching of conference proceedings, journals and reference lists resulted in 773 unique citations. One review author (JB) and a research assistant examined the titles and abstracts and identified 101 reports as potentially relevant, which we retrieved for further assessment. One review author (JB) and a research assistant then independently screened them. We included 30 trials, reported in 36 records, in the original review. Where necessary, we contacted principal investigators to obtain additional details on trials and data. We identified three ongoing trials (NCT02261558; NCT02583126; NCT02583139). We moved two ongoing studies from the original review to the 'awaiting assessment' classification (NCT00086762; O'Brien 2010). Unfortunately, we could not include them in this update as their results were not yet available for inclusion. We classified four additional studies as awaiting assessment because their results were not yet published, and the authors could not provide the results for inclusion in this review.
The 2016 update of the search resulted in 1187 unique citations. Two review authors (JB and AT) and one research assistant examined the titles and abstracts, retrieving full‐text articles where necessary. This resulted in the addition of 25 references reporting on 22 trials (Figure 1) and three new ongoing trials (NCT02261558; NCT02583126; NCT02583139).
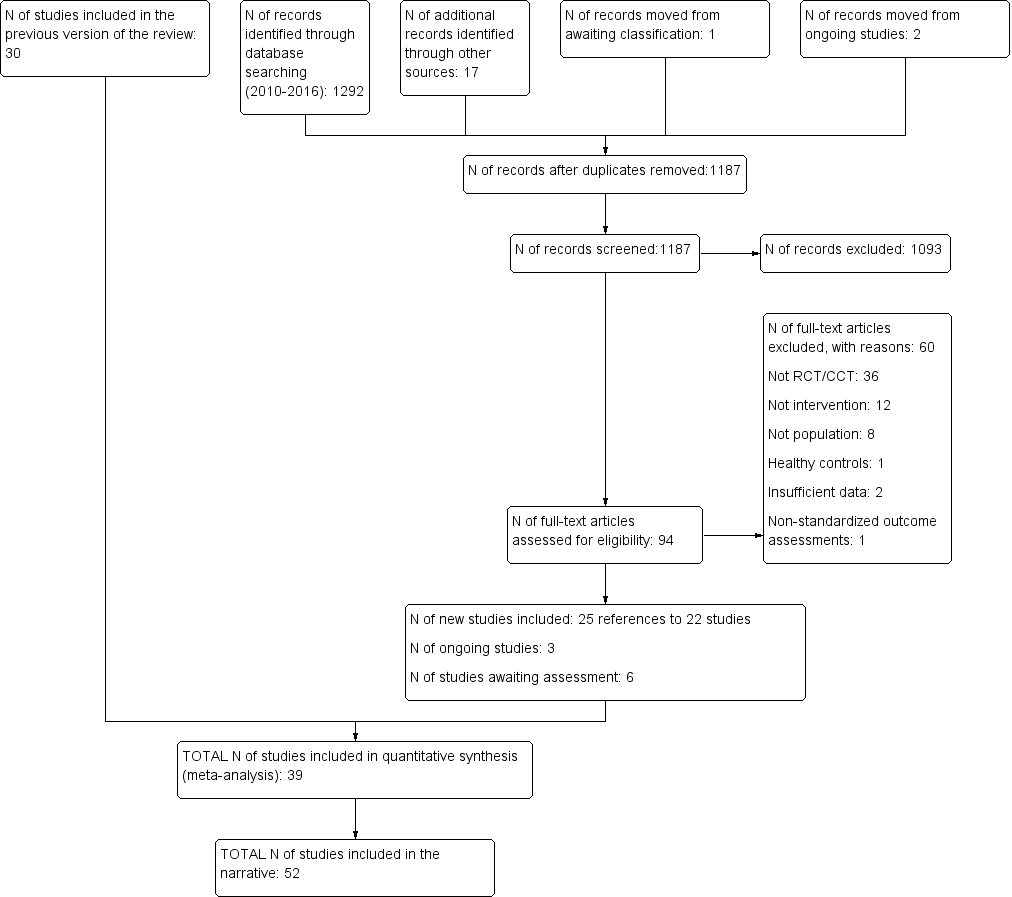
Study flow diagram.
Included studies
We included 52 trials with a total of 3731 participants. Seventeen trials included participants who underwent chemotherapy or radiation therapy (Bradt 2015; Bulfone 2009; Burrai 2014; Cai 2001; Chen 2013; Clark 2006; Ferrer 2005; Gimeno 2008; Jin 2011; Lin 2011; Moradian 2015; O'Callaghan 2012; Romito 2013; Smith 2001; Straw 1991; Xie 2001; Zhao 2008), 20 trials examined the effects of music during procedures or surgery (Binns‐Turner 2008; Bufalini 2009; Burns 2009;Cassileth 2003; Danhauer 2010; Fredenburg 2014a; Fredenburg 2014b; Kwekkeboom 2003;Li 2004;Li 2012; Nguyen 2010; Palmer 2015; Pinto 2012; Ratcliff 2014; Robb 2014; Rosenow 2014; Vachiramon 2013; Wang 2015; Yates 2015; Zhou 2015), and 14 trials included general cancer patients (Beck 1989; Burns 2001a; Burns 2008; Chen 2004; Cook 2013; Duocastella 1999; Hanser 2006; Harper 2001; Hilliard 2003; Huang 2006; Liao 2013; Robb 2008; Shaban 2006;Wan 2009). Five trials examined music interventions in pediatric patients (Bufalini 2009; Burns 2009; Duocastella 1999; Nguyen 2010; Robb 2014).
This review included 2090 females and 1171 males. Five trials did not provide information on the distribution between sexes (Danhauer 2010; Jin 2011; Robb 2008; Shaban 2006; Xie 2001). The average age of the participants was 54.67 years for adult trials and 10.93 years for pediatric trials. Seventeen studies did not report on the ethnicity of the participants (Burns 2001a; Burns 2008; Burrai 2014; Cassileth 2003; Chen 2013; Cook 2013; Duocastella 1999; Ferrer 2005; Lin 2011; Moradian 2015; O'Callaghan 2012; Robb 2008; Romito 2013; Straw 1991; Vachiramon 2013; Wang 2015; Zhou 2015). For trials that did provide information on ethnicity, the distribution was as follows: 50% white, 32% Asian, 7% black, 8% Latino, and 3% other. The trials took place in nine different countries: the United States (Bradt 2015; Beck 1989; Binns‐Turner 2008; Burns 2001a; Burns 2008; Burns 2009; Cassileth 2003; Clark 2006; Cook 2013; Danhauer 2010; Ferrer 2005; Fredenburg 2014a; Fredenburg 2014b; Hanser 2006; Harper 2001; Hilliard 2003; Kwekkeboom 2003; Gimeno 2008; Palmer 2015; Ratcliff 2014; Robb 2008; Robb 2014; Rosenow 2014; Smith 2001; Straw 1991; Vachiramon 2013; Yates 2015), China (Cai 2001; Chen 2004; Jin 2011; Li 2004; Li 2012; Liao 2013; Wan 2009; Xie 2001; Zhao 2008), Italy (Bufalini 2009; Bulfone 2009), Iran (Moradian 2015; Shaban 2006), Spain (Duocastella 1999), Taiwan (Chen 2013; Huang 2006; Lin 2011; Wang 2015; Zhou 2015), Brazil (Pinto 2012), Australia (O'Callaghan 2012) and Vietnam (Nguyen 2010). Trial sample size ranged from 8 to 260 participants.
We classified 23 trials as music therapy studies (Bradt 2015; Bufalini 2009; Burns 2001a; Burns 2008; Burns 2009; Cassileth 2003; Clark 2006; Cook 2013; Duocastella 1999; Ferrer 2005; Fredenburg 2014a; Fredenburg 2014b; Hanser 2006; Hilliard 2003; Gimeno 2008; Palmer 2015; Ratcliff 2014; Robb 2008; Robb 2014; Romito 2013; Rosenow 2014; Stordahl 2009; Yates 2015). Of these trials, nine used interactive music making with the participants, four used music‐guided imagery, two used music‐guided relaxation, six used live patient‐selected music performed by the music therapist and two used music video making. We classified 29 trials as music medicine studies, as defined by the authors in the background section, and used listening to pre‐recorded music as the intervention.
Frequency and duration of treatment sessions greatly varied among the trials. The total number of sessions ranged from 1 to 40 (e.g. multiple music listening sessions per day for length of hospital stay). Most sessions lasted 30 to 45 minutes. We report details on frequency and duration of sessions for each trial in the Characteristics of included studies table.
Forty‐nine trials used parallel group designs, whereas three trials used a cross‐over design (Bradt 2015; Beck 1989; Gimeno 2008). Not all trials measured all outcomes identified for this review.
We show details of the trials included in the review in the Characteristics of included studies table.
Excluded studies
In the original review, 27 of the 101 reports that we retrieved for further assessment turned out not to be outcome research studies. We identified 38 experimental research studies that appeared eligible for inclusion. However, we excluded these after closer examination or after receiving additional information from the principal investigators. Reasons for exclusions were: not a randomized or quasi‐randomized controlled trial (29 studies); insufficient data reporting (2 studies); unacceptable methodological quality (3 studies); not a music intervention (1 study); not exclusively cancer patients (1 study); and article could not be located (2 studies).
For the update, we retrieved 94 reports for further assessment. We excluded 60 studies for the following reasons: not a randomized or quasi‐randomized controlled trial (36 studies), insufficient data reporting (2 studies), not music intervention (12 studies), not population of interest (8 studies), use of healthy controls (1 study), and use of non‐standardized measurement tools (1 study).
For studies with insufficient data reporting or those that could not be located, we attempted to contact the authors on multiple occasions.
Details about reasons for exclusion are provided in the Characteristics of excluded studies table.
Risk of bias in included studies
We detail the risk of bias for each trial in the 'Risk of bias' tables included in the Characteristics of included studies table and the 'Risk of bias summary' (Figure 2). In addition, readers can consult an overall assessment of risk of bias in Figure 3.
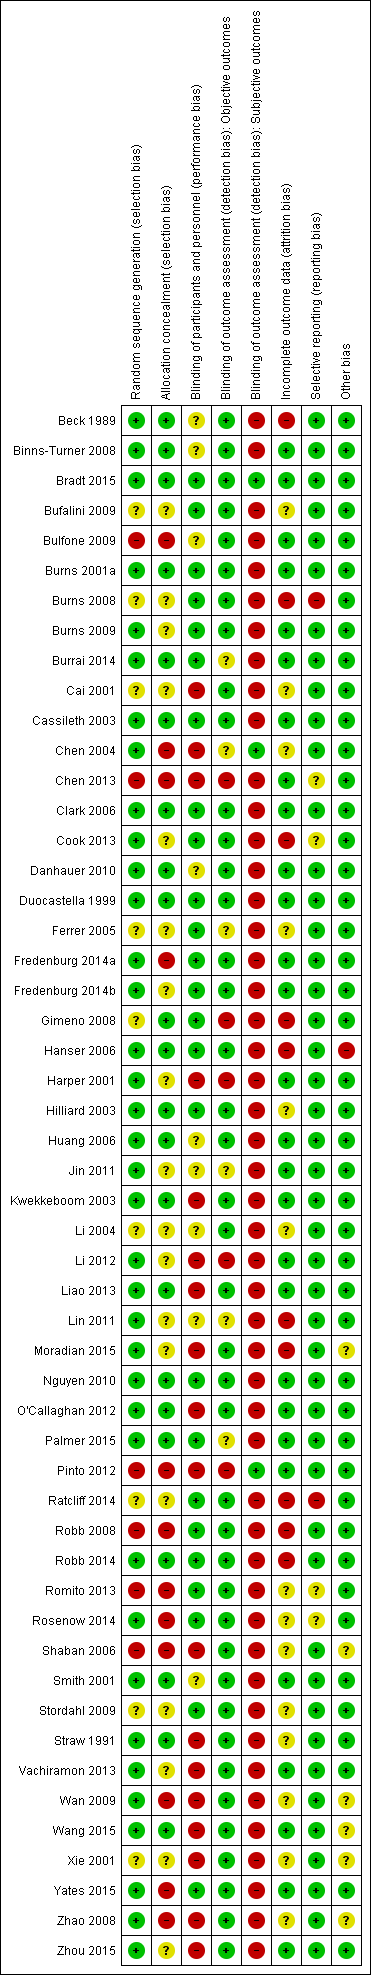
Risk of bias summary: review authors' judgements about each risk of bias item for each included study.

Risk of bias graph: review authors' judgements about each risk of bias item presented as percentages across all included studies.
Allocation
We included 37 trials that used appropriate methods of randomization (e.g. computer‐generated table of random numbers, drawing of lots, coin flip), 6 trials that used systematic methods of treatment allocation (e.g. alternate group assignment, date of birth), and 9 trials that reported using randomization but failed to state the randomization method.
Twenty‐two trials concealed allocation, whereas 12 trials did not. For the remainder of the trials, authors did not mention allocation concealment.
Blinding
Fifteen trials included objective outcomes, but only four of them reported blinding of the outcome assessors. For six trials, the use of blinding was unclear. The other trials did not use blinding. The majority of the trials included subjective outcomes only. It is important to point out that blinding of outcome assessors is not possible in the case of self report measurement tools for subjective outcomes (e.g. STAI; Spielberger 1983) unless the participants are blinded to the intervention. Blinding of the participants is often not feasible in music therapy and music medicine studies. This may introduce possible bias.
Incomplete outcome data
The dropout rate was small for most trials, falling between 0% and 17%. Ten trials reported dropout rates of more than 20%. For 14 trials, it was unclear whether there were any participant withdrawals. Most trials reported reasons for dropout. Detailed information on dropout rate and reasons is included in the Characteristics of included studies table.
Selective reporting
We did not find any evidence of selective reporting by the authors.
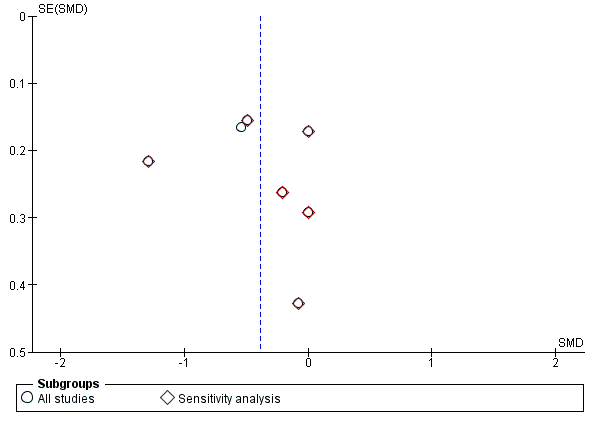
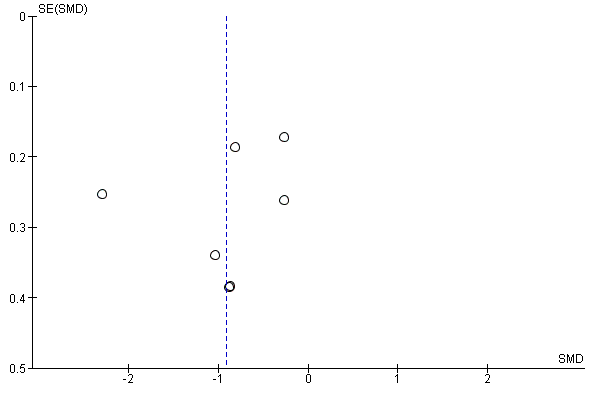
We examined publication bias visually in the form of funnel plots for several of the included outcomes. Visual inspection suggested that there was no publication bias for anxiety (Figure 4), depression (Figure 5), pain (Figure 6), and heart rate (Figure 7). We did detect a possible publication bias for fatigue (Figure 8), but this was based on a small number of trials. For this outcome, it is possible that studies that did not result in statistically significant findings may not have been published.

Funnel plot of comparison: 1 Music intervention plus standard care versus standard care alone, outcome: 1.1 Anxiety (STAI).
Funnel plot of comparison: 1 Music intervention plus standard care versus standard care alone, outcome: 1.6 Depression.
Funnel plot of comparison: 1 Music intervention plus standard care versus standard care alone, outcome: 1.11 Pain.

Funnel plot of comparison: 1 Music intervention plus standard care versus standard care alone, outcome: 1.15 Heart rate.

Funnel plot of comparison: 1 Music intervention plus standard care versus standard care alone, outcome: 1.13 Fatigue.
Other potential sources of bias
We did not identify any other potential sources of bias in the studies included in this review.
As a result, only one trial was at low risk of bias (Bradt 2015). Two additional trials were at low risk of bias for objective outcomes, as they satisfied all criteria used to assess risk of bias (Duocastella 1999; Nguyen 2010). Forty‐six trials were at high risk of bias. Three trials were at moderate risk of bias (Binns‐Turner 2008; Hilliard 2003; Palmer 2015). The main reason for receiving a high risk of bias rating was the lack of blinding. As pointed out above, blinding is often impossible in music therapy and music medicine studies that use subjective outcomes, unless the studies compare the music intervention with another active treatment intervention (e.g. progressive muscle relaxation). This is especially true for music therapy studies that use active music‐making. Therefore, it appears impossible for these types of studies to receive a low or even moderate risk of bias even if they have adequately addressed all other risk factors (e.g. randomization, allocation concealment, etc.).
It is worth noting that the Chinese trials were particularly problematic in terms of providing sufficient information regarding risk of bias. It is unclear, however, if this was due to incomplete translations or lack of detail in the original trial reports.
Effects of interventions
Comparison 1: Music intervention plus standard care versus standard care alone
Primary outcomes
Psychological outcomes
State anxiety
Twenty‐three trials examined the effects of music interventions plus standard care compared to standard care alone for anxiety in participants with cancer. Fifteen trials measured anxiety by means of the Spielberger State‐Trait Anxiety Inventory ‐ State Anxiety form (STAI‐S) (Binns‐Turner 2008; Bufalini 2009; Bulfone 2009; Chen 2013; Danhauer 2010; Harper 2001; Jin 2011; Kwekkeboom 2003; Li 2012; Lin 2011; O'Callaghan 2012; Smith 2001; Vachiramon 2013; Wan 2009; Zhou 2015); one trial used the STAI‐short form (Nguyen 2010); and eight trials reported mean anxiety measured by other scales, such as a numeric rating scale or a visual analogue scale (Cai 2001; Cassileth 2003; Ferrer 2005; Hanser 2006; Li 2004; Palmer 2015; Yates 2015; Zhao 2008). We could not include the data from Burns 2008 because it did not report post‐test or follow‐up scores. The author did provide follow‐up scores (4 weeks postintervention), but we could not combine these with the post‐test scores of the other trials. Moreover, Burns 2008 reported a large moderating effect of pre‐intervention affect state scores on post‐test scores and follow‐up scores. We also did not include the data from Kwekkeboom 2003 in the meta‐analysis because this study was affected by a serious flaw in the implementation of the intervention. Participants in this trial listened to music while undergoing painful medical procedures. However, they reported that the use of headphones prevented them from hearing the surgeon, increasing their anxiety. Finally, we report the data from Hanser 2006 narratively but do not include them in the meta‐analysis because of the high attrition rate (40%). In addition, the researchers experienced serious issues with intervention implementation within the predetermined implementation timeframe (three sessions were implemented over a 15‐week period), and the authors concluded that the intervention was significantly diluted because of this.
A meta‐analysis of 13 trials that used the full STAI‐S (score range: 20 to 80) to examine state anxiety in 1028 participants indicated a significantly lower state of anxiety in participants who received standard care combined with music interventions than those who received standard care alone ( MD: −8.54, 95% CI −12.04 to −5.05, P < 0.0001; Analysis 1.1). Statistical heterogeneity across the trials (I2 = 93%) was due to some trials reporting much larger beneficial effects of music interventions than others (Binns‐Turner 2008; Harper 2001; Wan 2009). In Kwekkeboom 2003, participants in the music listening group reported higher levels of anxiety at post‐test (mean: 33.45, standard deviation (SD) 1.77) than those in the standard care group (mean: 30.59, SD 1.93), but this difference was not statistically significant. A sensitivity analysis excluding the trials that used inadequate methods of randomization (Bulfone 2009; Chen 2013), or for which the method of randomization was unclear (Bufalini 2009), had minimal impact on the pooled effect size (MD: −8.64, 95% CI −12.50 to −4.79, P < 0.0001, I2 = 94%; Analysis 1.1).
The standardized mean difference (SMD) of trials that reported post‐test anxiety scores on measures other than the full‐form STAI‐S (N = 449) also suggested a moderate to large anxiety‐reducing effect of music (SMD: −0.71, 95% CI −0.98 to −0.43, P <.00001; Analysis 1.2; Cai 2001; Ferrer 2005; Li 2004; Nguyen 2010; Zhao 2008; Yates 2015). The results were consistent across the trials (I2 = 41%). We did not include the data of two trials in the meta‐analysis because change scores and final scores should not be combined for the computation of a SMD (Cassileth 2003; Palmer 2015). However, the data by Cassileth 2003 were consistent with the results of the meta‐analysis, reporting a greater effect of music therapy on anxiety (mean change score: −2.6, SD 2.5) than standard care alone (mean change score: −0.9, SD 3.0) on the POMS‐anxiety subscale (score range: 0 to 36). Likewise, the data from Palmer 2015 indicated a beneficial effect of music therapy (mean change score: −30.9, SD 36.3) versus standard care (mean change score: 0, SD 22.7) on the Global Anxiety‐VAS (score range: 0 to 100 mm). A sensitivity analysis to examine the impact of randomization method, excluding the data of Cai 2001, Ferrer 2005 and Li 2004, resulted in a larger SMD of −0.80 (95% CI −1.44 to −0.16, P = 0.01; Analysis 1.2), but the results were no longer consistent across studies (I2 = 66%).
Next, we conducted several a priori determined subgroup analyses as outlined in the Methods.
First, we compared the treatment benefits of music therapy versus music medicine studies for anxiety. We only included studies that reported post‐test scores in this analysis to allow for computation of a standardized mean difference across studies. The pooled effect of three music therapy studies (SMD: −0.62, 95% CI −1.01 to −0.24, P = 0.001, I2 = 0%; Bufalini 2009; Ferrer 2005; Yates 2015) was smaller than of the music medicine studies (SMD: −1.00, 95% CI −1.45 to −0.55, P < 0.0001, I2 = 93%; Binns‐Turner 2008;Bulfone 2009; Cai 2001; Danhauer 2010; Jin 2011; Li 2004; Li 2012; Lin 2011; Nguyen 2010; O'Callaghan 2012; Smith 2001; Vachiramon 2013; Wan 2009; Zhao 2008; Zhou 2015). However, this difference was not statistically significant (P = 0.21). It is worth noting that the results of the music therapy studies were consistent across studies, whereas the results of the music medicine studies were highly heterogeneous (Analysis 1.3).
Second, we compared studies that used patient‐preferred music with studies that used researcher‐selected music. For this comparison, we only included studies that used listening to pre‐recorded music as the intervention. Music preference did not appear to impact the treatment benefits for anxiety. The use of patient‐preferred music resulted in a SMD of −0.86 (95% CI −1.38 to −0.34, P = 0.001, I2 = 92%) whereas researcher‐selected music resulted in a SMD of −0.89 (95% CI −1.43 to −0.35, P = 0.001, I2 = 71%) (Analysis 1.4).
Finally, we compared the music medicine studies by type of intervention (e.g. music‐guided relaxation, music listening alone, etc.). We could not conduct this subgroup analysis for music therapy studies because of an insufficient number of trials. The majority of the music medicine studies used listening to pre‐recorded music. Four studies, however, embedded relaxation or imagery instructions within the pre‐recorded music (Jin 2011; Lin 2011; Wan 2009; Zhou 2015). The pooled effect of these four studies (SMD: −1.61, 95% CI −2.56 to −0.65, P = 0.0009, I2 = 95%) was much larger than that of music listening only studies (SMD: −0.71, 95% CI −1.16 to −0.26, P = 0.002, I2 = 89%) but because of the large heterogeneity, this difference was not statistically significant (P = 0.10) (Analysis 1.5).
Depression
Seven trials examined the effects of music plus standard care compared to standard care alone on depression in 723 participants (Cai 2001; Cassileth 2003; Clark 2006; Li 2012; Wan 2009; Yates 2015; Zhou 2015). Their pooled estimate indicated a moderate treatment effect of music (SMD: −0.40, 95% CI −0.74 to −0.06, P = 0.02; Analysis 1.6), but the results were inconsistent across trials (I2 = 77%). A sensitivity analysis examining the impact of randomization method did not have much impact on the pooled effect size (SMD: −0.37, 95% CI −0.79 to 0.05, P = 0.08, I2 = 81%; Analysis 1.6).
A subgroup analysis revealed that there was no statistically significant difference between music therapy and music medicine studies for the outcome of depression (P = 0.12) (Analysis 1.7). We also examined the impact of music preference in studies that used listening to pre‐recorded music. Although the difference between studies that used patient‐preferred versus researcher‐selected music was not statistically significant (P = 0.25), allowing patients to select music from a variety of styles offered by the researcher resulted in a large effect size that was statistically significant (SMD: −0.88, 95% CI −1.67 to −0.09, P = 0.003, I2 = 89%; Analysis 1.8). In contrast, the use of researcher‐selected music resulted in a small effect size that was not statistically significant (SMD: −0.32, 95% CI −0.84 to 0.19, P = 0.22, I2 = 61%).
Distress
Clark 2006 compared standard care plus music‐guided relaxation versus standard care alone and reported a reduction of −2.03 (SD 2.46) on a 0 to 10 numeric rating scale in the music therapy intervention group. Participants in the control group reported an average reduction in distress of −2.44 (SD 2.55).
Mood
The pooled estimate of five trials (N = 236) resulted in a moderate effect of music interventions for mood in participants with cancer (SMD: 0.47, 95% CI −0.02 to 0.97, P = 0.06; Analysis 1.9; Beck 1989; Burrai 2014; Cassileth 2003; Moradian 2015; Ratcliff 2014).The results were inconsistent across studies (I2 = 70%), with Burrai 2014 reporting much larger treatment benefits than the other studies. A sensitivity analysis based on randomization method slightly increased the pooled effect (SMD: 0.57, 95% CI −0.03 to 1.18, P = 0.06, I2 = 74%; Analysis 1.9). We could not include the data from Burns 2001a in the meta‐analysis because the authors did not use a constant in the computation of their scores, as recommended in the Profile of Mood States (POMS) scoring guide (McNair 1971). The results of the meta‐analysis were robust to Burns 2001a, which reported a mean post‐test score of −48.25 (SD 32.96) for the music therapy group and a mean post‐test score of 20.75 (SD 30.87) for the control group.
A subgroup analysis comparing music therapy (SMD: 0.37, 95% CI −0.13 to 0.87, P = 0.15) with music medicine (SMD: 0.55, 95% CI −0.37 to 1.47, P = 0.24) found no statistically significant differences between the two types of studies (P = 0.73), but the results of the music therapy studies were consistent across studies (I2 = 37%), whereas the music medicine studies were inconsistent across studies (I2 = 82%) (Analysis 1.10).
Resilience
One music therapy study in 80 adolescents and young adults undergoing hematopoietic stem cell transplant (HSCT) included resilience as an outcome and reported a small effect for the music therapy intervention (SMD: 0.21), although this effect was not statistically significant (P = 0.35) (Robb 2014). The authors reported that the study was underpowered to detect medium and small effect sizes.
Coping
Robb 2014 also examined the effect of music therapy on coping. They reported a moderate effect size for courageous coping immediately post‐transplant. At the same time, they found no change in the use of defensive coping strategies, suggesting that adolescents and youth in the music therapy treatment arm increased their use of positive coping strategies.
Physical symptoms
Pain
Eleven trials compared the effects of music versus standard care on pain (Beck 1989; Binns‐Turner 2008; Clark 2006; Danhauer 2010; Fredenburg 2014a; Huang 2006; Kwekkeboom 2003; Li 2012; Moradian 2015; Nguyen 2010; Wan 2009). We could not include the data from Beck 1989, Clark 2006 or Moradian 2015 in the meta‐analysis because of the use of change scores. Kwekkeboom 2003 compared the effects of music listening, audiotape and standard care on procedural pain and anxiety, finding that participants did not like wearing the headsets as it prevented them from hearing the surgeon, causing greater anxiety. The literature suggests that increased anxiety leads to increased pain perception (McCracken 2009); therefore, we excluded these data from the meta‐analysis. The pooled effect of the remaining seven studies with 528 participants resulted in a large effect for music on pain perception (SMD: −0.91, 95%CI −1.46 to −0.36, P = 0.001; Analysis 1.11; Cohen 1988). There was disagreement between the trials on the size of the effect (I2 = 88%), but this was due to Li 2012 reporting much larger treatment benefits than the other trials.
Using a 0 to 10 numeric rating scale, Clark 2006 found that music therapy resulted in greater pain reduction (mean change score: −0.44, SD 2.55) than standard care (mean change score: 0.45, SD 1.87). Likewise, Beck 1989 reported a greater pain reduction for the music listening group as measured by a 100mm VAS (mean change score: −9.27, SD 18.86) than for the control group (mean change score: −5.69, SD 17.9). In contrast, Moradian 2015 reported similar improvements in pain for the treatment (mean change score: −12.96, SD 24.16) and the control group (mean change score: −13.58, SD 28.51).
For this outcome, we were able to examine the impact of music preference on treatment effect (Analysis 1.12). Although the difference between the use of patient‐preferred music and researcher‐selected music was not statistically significant (P = 0.42), the use of patient‐preferred music led to a much larger and statistically significant pooled effect (SMD: −1.06, 95% CI −1.93 to −0.2, P = 0.02, I2 = 91%) than the use of researcher‐selected music (SMD: −0.59, 95% CI −1.34 to 0.15, P = 0.12, I2 = 75%). The large heterogeneity was due to some studies reporting a much larger beneficial effect than others.
Fatigue
Six trials examined the effects of music interventions on fatigue in 253 participants (Cassileth 2003; Clark 2006; Ferrer 2005; Fredenburg 2014b; Moradian 2015; Rosenow 2014). The pooled estimate of their change scores indicated a small to moderate effect for music interventions (SMD: −0.38, 95% CI −0.72 to −0.04, P = 0.03; Analysis 1.13), with consistent results across studies (I2 = 38%). Burns 2008 also collected data on fatigue; however, investigators did not report postintervention data. Burns 2008 also provided us with four‐week postintervention follow‐up scores, but could not provide the immediate post‐test scores. This prevented us from pooling their data with data from the other three studies. A sensitivity analysis based on randomization method suggested that use of proper methods of randomization resulted in a smaller pooled effect that was no longer statistically significant (SMD: −0.20, 95% CI −0.48 to 0.08, P = 0.16, I2 = 0%).
Physical functioning
Five trials examined the effects of music on participants' physical functioning (Hanser 2006; Hilliard 2003; Liao 2013; Moradian 2015; Xie 2001). We could not include the results of Hanser 2006 in the pooled estimate because of the use of change scores and the high attrition rate. The pooled estimate of the remaining studies indicated no evidence for an effect of music on physical status in 493 participants with cancer (SMD: 0.78, 95% CI −0.74 to 2.31, P = 0.31; Analysis 1.14). The results were highly inconsistent (I2 = 98%), with Xie 2001 reporting a much larger beneficial effect. In Hanser 2006, music therapy led to a greater improvement in physical well‐being (FACT‐G Physical Well‐Being Subscale, score range: 0 to 28)( mean change score: 2.0, SD 4.6) than standard care (mean change score: −0.4, SD 3.7), but this difference was not statistically significant.
Removing Xie 2001 because of improper randomization method resulted in a small effect that was consistent across studies (SMD: 0.08, 95% CI −0.18 to 0.34, P = 0.54, I2 = 0%; Analysis 1.14)
Anesthetic and analgesic intake
Two studies included use of anesthesia and analgesics as an outcome. Palmer 2015 examined the amount of propofol needed to reach a sedation score of 70 on the Bispectral Index (BIS) in women undergoing breast surgery. A BIS reading of 70 represents moderate sedation. The average propofol needed in the live music group (n = 67) was 67.2 mg (SD 53.7), 61.9 mg (SD 34.1) in the recorded music group (n = 65), and 70.5 mg (SD 35.2) in the usual care group (n = 62). However, the difference between the groups was not statistically significant. Wang 2015 examined the impact of music‐guided relaxation compared to standard care on postoperative consumption of the sufentanil, a narcotic medicine, and use of a patient‐controlled analgesia (PCA) pump. Participants in the music treatment arm consumed a significantly smaller amount of sufentanil (52.68 µg, SD 7.07) than the standard care treatment arm (82.65 µg, SD 6.19). PCA use was also significantly lower in the music treatment arm (19.06, SD 3.49) than in the control group (30.96, SD 4.0).
Length of hospital stay and recovery time
Palmer 2015 also examined the effect of music on recovery time following breast surgery. Recovery time was defined as the interval between surgery end time and the time when the patient had met all discharge criteria determined by the recovery nurse. The results indicated that there was no statistically significant difference in recovery time between the two types of music interventions (live music by a music therapist and listening to pre‐recorded music) and the usual care group, suggesting that the addition of music intervention did not increase patient time commitment. A statistically significant difference was found between the live music group (52.4 minutes, SD 21.6) and the recorded music group (64.8 minutes, SD 35.3), with the live music group getting discharged approximately 12 minutes faster than the recorded music group. However, the authors suggest a careful interpretation of these results as other factors could have contributed to this difference.
Li 2012 tracked the length of women's hospital stay after radical mastectomy. Women in the music listening treatment arm stayed an average of 13.62 days (SD 2.04), whereas women in the usual care control arm stayed an average of 15.53 days (SD 2.75). This difference between the treatment arms was statistically significant (P < 0.001).
Secondary outcomes
Physiological outcomes
Heart rate
Eight trials examined the effects of music on heart rate in 589 participants (Binns‐Turner 2008; Burrai 2014; Chen 2013; Ferrer 2005; Harper 2001; Jin 2011; Nguyen 2010; Zhao 2008). All of the studies except for Ferrer 2005 were music medicine studies.Their pooled estimate showed a decrease in heart rate, favoring music interventions over standard care (MD: −3.32, 95% CI −6.21 to −0.44, P = 0.02; Analysis 1.15). However, the results were inconsistent across studies (I2 = 73%). A sensitivity analysis excluding Ferrer 2005 and Chen 2013 because of an unknown randomization method and a lack of proper randomization, respectively, resulted in a larger effect with less heterogeneity (MD: −4.63, 95% CI −8.18 to −1.09, P = 0.01, I2 = 56%; Analysis 1.15).
A subgroup analysis for music preference indicated that researcher‐selected music led to greater reductions in heart rate (MD: −7.94, 95% CI −15.10 to −0.78, P = 0.03, I2 = 0%) than patient‐preferred music (MD: −3.13, 95% CI −6.54 to 0.27, P = 0.07, I2 = 82%; Analysis 1.16), but this difference was not statistically significant (P = 0.23).
One cross‐over trial compared the effect of music and imagery with imagery alone (Gimeno 2008). Both interventions resulted in statistically significant decreases in heart rate from pre‐test to post‐test: the music and imagery group's mean heart rate dropped from 89.58 beats per minute (bpm) (SD 17.32) at pre‐test to 78.84 bpm (SD 13.46) at post‐test; the imagery only group's mean heart rate dropped from 93.31 bpm (SD 15.76) to 81.05 bpm (SD 13.96), but the difference between the two interventions was not statistically significant.
Respiratory rate
The pooled estimate of four trials (N = 437) did not provide evidence of an effect for music interventions on respiratory rate (MD: −1.24, 95% CI −2.54 to 0.06, P = 0.06; Analysis 1.17; Chen 2013; Jin 2011; Nguyen 2010; Zhao 2008), and the studies did not agree on the size of effect (I2 = 80%). A sensitivity analysis excluding Chen 2013 because of failure to use a proper method of randomization resulted in a larger pooled effect that was statistically significant (MD: −1.83, 95% CI −3.36 to −0.30, P = 0.02, I2 = 52%; Analysis 1.17)
We could not conduct a subgroup analysis based on music preference for this outcome due to an insufficient number of trials differentiating music type.
Systolic blood pressure
We found a pooled estimate of −5.40 mmHg (95% CI −8.32 to −2.49, P = 0.0003; N = 559; Analysis 1.18) for systolic blood pressure (SBP), favoring music interventions (Burrai 2014; Chen 2013; Ferrer 2005; Harper 2001; Jin 2011; Nguyen 2010; Zhao 2008). The results were slightly inconsistent across studies (I2 = 54%). However, excluding Chen 2013 and Ferrer 2005 because of lack of proper randomization resulted in a larger effect that was consistent across studies (MD: −7.63 mmHg, 95% CI −10.75 to −4.52, P < 0.00001, I2 = 11%; Analysis 1.18). All of the studies except for Ferrer 2005 were music medicine studies.
We conducted a subgroup analysis based on music preference (Analysis 1.19), and in contrast to the findings for heart rate, this analysis suggested that patient‐preferred music led to greater SBP reduction (MD: −6.65, 95% CI −10.07 to −3.23, P = 0.0001, I2 = 64%) than researcher‐selected music (MD: −4.72, 95% CI −10.80 to 1.37, P = 0.13, I2 = 0%). This difference was not statistically significant (P = 0.59).
Diastolic blood pressure
We found a pooled estimate of −2.35 mmHg (95% CI −5.88 to 1.18; Analysis 1.20) for diastolic blood pressure (DBP) in 559 participants (Burrai 2014; Chen 2013; Ferrer 2005; Harper 2001; Jin 2011; Nguyen 2010; Zhao 2008).The results were inconsistent across studies (I2 = 91%). Similar to the SBP analysis, excluding Chen 2013 and Ferrer 2005 in a sensitivity analysis resulted in a larger MD of −4.94 mmHg (95% CI −7.78 to −2.09) that was statistically significant (P = 0.0007), and less heterogeneous (I2 = 60%; Analysis 1.20). All of the studies except for Ferrer 2005 were music medicine studies.
Patient‐preferred music resulted in somewhat greater reductions in DBP (MD: −4.10, 95% CI −8.78 to 0.59, P = 0.09, I2 = 95%; Analysis 1.21) than researcher‐selected music (MD: −2.01, 95% CI −6.26 to 2.25, P = 0.36, I2 = 0%), but this difference was not statistically significant (P = 0.52).
Mean arterial pressure
Binns‐Turner 2008 reported on the effects of music on mean arterial pressure (MAP) in 30 participants and found a large decrease in MAP for the music group (mean change score: −15.1 mmHg, SD 17.1, 95% CI −23.76 to −6.44). In contrast, participants in the standard care group experienced an increase in MAP (mean change score: 4.5 mmHg, SD 15.3, 95% CI −3.25 to 12.25).
Oxygen saturation level
Three trials with 292 participants reported no effects for music listening on oxygen saturation levels (MD: 0.50%, 95% CI −0.18 to 1.18, P = 0.15, I2 = 78%; Analysis 1.22; Burrai 2014; Chen 2013; Nguyen 2010).
Immune system functioning
Two trials examined the effects of music on immune system functioning. In one trial in 30 children, Duocastella 1999 found that live music making with children led to a greater increase in Immunoglobin A (IgA) levels (mean change score: 7.07 mg/l, SD 34.52) than engaging children in activities that did not involve music (mean change score: 4.13 mg/l, SD 41.02), but this difference was not statistically significant. Another trial compared music listening to standard care in 46 participants and found post‐test differences for the following indicators of immune system functioning: CD3 (music: mean 44, SD 12.62; control: mean 36.73, SD 11.01), CD4/CD8 (music: mean 1.67, SD 0.76; control: mean 1.32, SD 1.01), and natural killer (NK) cell activity (music: mean 25.23, SD 15.20; control: mean 21.36, SD 12.86), indicating a positive effect of music listening on the immune system in women with breast cancer (Chen 2004). CD3 and CD4/CD8 are proteins that play a role in immune system functioning.
Social and spiritual support
Spiritual well‐being
Two trials under this comparison assessed spiritual well‐being (Cook 2013; Hanser 2006). One trial compared music therapy to usual care using the Functional Assessment of Chronic Illness Therapy‐Spiritual Well‐Being subscale (FACIT‐Sp, score range: 0 to 48) (Hanser 2006). Results indicated no statistically significant difference between the two groups (music therapy mean change score: 2.5, SD 8.56; control group mean change score: 0.7, SD 6.95). Cook 2013 compared music therapy with standard care and reported a greater improvement in the music therapy treatment arm ( mean change score: 4.4, SD 4.84) than the control arm (mean change score: 2.0, SD 6.08) on the FACIT‐Sp.
Social support
Robb 2014 examined the effect of music therapy on perceived social support in adolescents and young adults during stem cell transplant. At 100 days post‐transplant, participants in the music therapy treatment arm reported significantly greater improvements in perceived social support (SMD: 0.54, P = 0.028) and family environment (i.e. family cohesion, family adaptation, family communication, and family strength) (SMD: 0.66, P = 0.008) than participants in the control group. Qualitative analysis of the music videos that accompanied the songs written by the participants revealed that study participants were "identifying peers (i.e., social integration), family members (i.e., family environment), and faith/spirituality (i.e., spiritual perspective) as important sources of support" (p 916).
Quality of life
Seven trials compared the impact of music interventions to standard care on QoL (Burns 2001a; Hanser 2006; Hilliard 2003; Liao 2013; Moradian 2015; Ratcliff 2014; Xie 2001). We did not include Hanser 2006 in the meta‐analysis for reasons discussed above. Meta‐analysis of the remaining six trials (N = 545) resulted in a heterogeneous SMD of 0.98 (95% CI −0.36 to 2.33, P = 0.15, I2 = 98%; Analysis 1.23; Burns 2001a; Hilliard 2003; Liao 2013; Moradian 2015; Ratcliff 2014; Xie 2001), with Xie 2001 reporting a much larger beneficial effect than the other trials. Removal of this outlier resulted in a small effect size that was homogeneous (SMD: 0.29, 95% CI 0.05 to 0.53, P = 0.02, I2 = 0%).
We conducted a sensitivity analysis removing all studies that used improper methods of randomization. This resulted in a moderate effect size that was statistically significant (SMD: 0.52, 95% CI 0.01 to 1.02, P = 0.04, I2 = 66%; Analysis 1.23).
A subgroup analysis per intervention type resulted in a homogeneous, moderate effect of music therapy on QoL (SMD: 0.42 , 95% CI 0.06 to 0.78, P = 0.02, I2 = 4%; Analysis 1.24) that was statistically significant and consistent across studies (Cohen 1988). In Hanser 2006, music therapy resulted in a greater improvement in QoL (FACT‐G, 0‐108) (mean change score: 3.5, SD 13.75) than standard care (mean change score: 0.9, SD 15.8), but this difference was not statistically significant. The pooled effect of the music medicine studies was large but very heterogeneous and not statistically significant (SMD: 1.33, 95% CI −0.96 to 3.63, P = 0.26, I2 = 99%). The large heterogeneity was due to the outlying values of Xie 2001; removing it from the analysis resulted in a small effect for the music medicine studies that was consistent across studies but not statistically significant (SMD: 0.20, 95% CI −0.11 to 0.51, P = 0.21, I2 = 0%). The difference in treatment effect between the music therapy studies and the music medicine studies was statistically significant when we excluded Xie 2001 from the analysis (P = 0.01). With the Xie study included, the difference was not statistically significant (P = 0.44).
Comparison 2: Music therapy plus standard care versus music medicine plus standard care
Only two studies reported on the direct comparison between music therapy and music medicine interventions.
Primary outcomes
Psychological outcomes
Anxiety
Two trials directly compared the effects of music therapy with music medicine on cancer patients' anxiety using a 100mm visual analogue scale (Bradt 2015; Palmer 2015). Both interventions resulted in reduction of anxiety. Whereas music therapy interventions resulted in a greater average anxiety reduction than music medicine intervention, this difference was not statistically significant (MD: −3.67, 95% CI −11.68 to 4.35, P = 0.37, I2 = 0%; Analysis 2.1). However, 77.4% of the participants in the cross‐over trial by Bradt 2015 expressed a preference for receiving music therapy sessions for the remainder of their cancer treatment or future treatments. The main reasons cited by participants for this preferences were that they felt cared for by the music therapist, enjoyed the interactive and creative music making, and valued the opportunity for emotional expression and processing.
Comparison 3: Music interventions plus standard care versus standard care plus alternative relaxation interventions
Several studies compared music interventions with other relaxation interventions such as progressive muscle relaxation, guided imagery and relaxation, and verbal relaxation instructions. At this time, only single studies were identified per outcome. This precluded meta‐analysis is results.
Primary outcomes
Psychological outcomes
Anxiety
Straw 1991 compared music listening to guided imagery and relaxation training and found that both interventions significantly reduced state anxiety as measured by the STAI‐S (score range 20 to 80) (guided imagery post‐test mean: 38.6, SD 10.01; music listening post‐test mean: 34.22, SD 10.12). An ANCOVA analysis with pre‐test anxiety scores as a co‐variate indicated that the difference in effect of the two interventions on state anxiety was not statistically significant.
Depression
Stordahl 2009 compared music‐assisted relaxation with verbal relaxation instructions in 20 women with breast cancer and reported a lower level of depression on the Center for Epidimiologic Diseases ‐ Depression Scale (CES‐D, score range 0 to 60) following treatment in the music‐assisted relaxation treatment arm (n = 10; post‐test mean: 6.6, SD 5.02) than in the verbal relaxation treatment arm (n = 10; post‐test mean: 9.20, SD 10.96).
Mood
Stordahl 2009 also compared the impact of music‐assisted relaxation with verbal relaxation instructions on mood in women with breast cancer and found that music‐assisted relaxation resulted in lower scores (i.e. better mood) on the POMS‐SF (score range 14 to 70 as reported in this thesis) (post‐test mean: 6.5, SD 5.19) than verbal relaxation instructions (post‐test mean = 8.64, SD 6.42).
Physical symptoms
Pain
Shaban 2006 compared the effects of progressive muscle relaxation (PMR) to music listening and found that PMR was more effective in reducing pain (100mm VAS) (mean post‐test score: 6.22, SD 2.45) than listening to pre‐recorded music (mean post‐test score: 4.96, SD 2.76) in 100 participants.
Secondary outcomes
Quality of life
Straw 1991 compared a guided imagery and relaxation intervention to music listening and found that music listening led to a greater increase in QoL (Functional Living Index, score range 22 to 154) (mean change score: 16.33, SD 20.73) than the guided imagery and relaxation group (mean change score: 4.6, SD 20.49).
Comparison 4: Music interventions plus standard care versus standard care plus placebo control
Only a few trials compared music therapy or music medicine to a placebo control, The trials examined a limited number of outcomes, which we describe below.
Primary outcomes
Psychological symptoms
Distress
Two trials examined the effects of music therapy on reduction of distress, comparing a music video intervention with an audiobook control condition in adolescents and young adults during stem cell transplantation (Burns 2009; Robb 2014). In the music video, participants wrote songs and created accompanying music videos in collaboration with a music therapist. The pooled effect of the two trials did not provide support for an effect of music therapy (SMD: −0.08, 95% CI −0.42 to 0.25, P = 0.62, I2 = 0%; Analysis 3.1). In Burns 2009, both groups reported an increase in distress post‐intervention scores, which were used in the meta‐analysis. However, follow‐up measures at 100 days after the stem‐cell transplantation indicated a lower mean distress score for the music therapy group (mean: 1.67, SD 0.55) than the audiobook group (mean: 2.00, SD 0.64).
Secondary outcomes
Social and spiritual support
Spiritual well‐being
Burns 2009 and Robb 2014 also examined the effect of a music video intervention versus audiobook control condition on spiritual well‐being in adolescents and young adults. Their pooled estimate did not find support for an effect of music therapy on spiritual well‐being (SMD: 0.31, 95% CI −0.11 to 0.73, P = 0.15, I2 = 0%; Analysis 3.2).
Communication
One trial in children with cancer compared the effects of one session of active music making to music listening and audio storybooks on levels of active engagement and initiation in 55 children (Robb 2008). Active music therapy sessions led to higher active engagement (post‐test mean: 26.03, SD 4.1) than music listening (post‐test mean: 15.65, SD 6.2, P < 0.0001) or audio storybooks (post‐test mean: 15.17, SD 4.9, P < 0.0001). These differences were statistically significant. Active music making (post‐test mean: 14.19, SD 8.3) and music listening (post‐test mean: 15.89, SD 11.2) also increased the child's initiation behaviour compared to the audio storybooks (post‐test mean: 7.43, SD 6.6). These differences were also statistically significant (P = 0.04 and P = 0.002, respectively).
Quality of life
Burns 2009 compared music therapy to an audiobook control, finding a small increase in QoL in the music therapy group (Index of Well‐Being, score range 9 ‐ 63) (mean change score: 0.31, SD 1.73, n = 7) and a small decrease in the control group (mean change score: −0.22, SD 1.24, n = 3). However, the sample size was too small to draw any meaningful conclusions.
Discussion
Summary of main results
The results of 19 trials suggest that music therapy and music medicine interventions may have a beneficial effect on anxiety in people with cancer, with a reported anxiety reduction of 8.54 units, on average, on the STAI‐S (score range: 20 to 80) scale and −0.71 standardized units on other anxiety scales which is considered a moderate to large effect. Although the magnitude of the effect differed across the studies, the trials agreed on the direction of the point estimates. These anxiety‐reducing results are consistent with the findings of three other Cochrane systematic reviews on the use of music with coronary heart disease patients (Bradt 2013a), with mechanically ventilated patients (Bradt 2014), and for pre‐operative anxiety (Bradt 2013b). A comparison of music therapy with music medicine trials for anxiety reduction in people with cancer suggest a moderate treatment effect for music therapy studies (SMD: −0.62) that was consistent across studies. Music medicine trials resulted in a larger effect (SMD: −1.0) but results were highly inconsistent across studies. Cohen 1988 suggested that an effect size of 0.20 be considered a small effect, an effect size of 0.50 medium, and an effect size of 0.80 large. A direct comparison of music therapy with music medicine interventions for anxiety reduction in two studies indicated greater anxiety reduction of music therapy interventions. It is noteworthy that a large majority of the patients in one of the comparative studies expressed a preference for the music therapy intervention.
The results of seven studies suggest that music intervention may reduce depression in people with cancer. The results of a single study suggest that music therapy may help adolescents and young adults employ positive coping strategies during stem cell transplant, a high risk and high intensity treatment. We found no evidence of effect for distress or mood.
As for the effect of music on physical symptoms, the results of seven trials suggest that music has a large pain‐reducing effect of −0.91 standardized units. The results of single studies suggest that music listening may reduce the need for anesthetics and analgesics. Music interventions also had a small to moderate effect on fatigue (−0.38 standardized units). We found no evidence for an effect of music on physical status. Reduction of anxiety, depression, fatigue and pain are important outcomes for people with cancer, as they have an impact on health and overall QoL.
It is important that careful consideration is given to the implementation of music listening interventions. The results of Kwekkeboom 2003 indicate that listening to music through headphones may be contraindicated during painful procedures because it prevents the patient from hearing the surgeon's instructions and comments. This may greatly increase patients' anxiety and, consequently, their perceived pain. In this case, it is better to listen to music without headphones.
Furthermore, results suggest that music interventions may have a beneficial effect on several physiological responses in patients with cancer. Listening to music may reduce heart rate by an average of three to four beats per minute and respiratory rate by an average of two breaths per minute. These results are consistent with the findings of a Cochrane systematic review on the use of music with coronary heart disease patients (Bradt 2013a), which reported a heart rate reduction of 3.4 bpm and a respiratory rate reduction of 2.5 breaths per minute. Similar results were reported in a Cochrane review on music interventions for mechanically ventilated patients (Bradt 2014), namely a mean heart rate reduction of 3.95 bpm and a mean respiratory rate reduction of 2.87 breaths per minute. In the case of a resting heart rate within normal range, a reduction of 4 bpm may not be clinically significant. However, it might be in the case of a tachycardiac rate. In a study examining the quantitative relationship between resting heart rate reduction and clinical benefit, Cucherat 2007 found that each 10 bpm reduction in heart rate is estimated to reduce the relative risk of cardiac death by 30%. The results of this review also indicate that listening to music may have a beneficial effect on SBP, although we found no evidence of an effect for DBP. Trials on music listening with cardiac patients and mechanically ventilated patients have also reported reductions in systolic blood pressure (Bradt 2013a; Bradt 2014). The reduction of heart rate, respiratory rate, and blood pressure corresponds with the anxiety‐reducing effects found by subjective outcome measures in this review.
No evidence of support was found for an effect of music interventions on oxygen saturation level. Single trials included in this review found support for a beneficial effect of music on mean arterial pressure and immunologic function.
Music therapy interventions had a moderate effect of 0.42 standardized units on quality of life, whereas we found no support for an effect for music medicine studies. Two studies that compared music therapy with audiobook control in adolescents and young adults did not find support for spiritual well‐being. Two music therapy studies with adults reported conflicting results for this outcome. Finally, a single study with adolescents and young adults during stem cell transplant reported beneficial effects of music therapy on perceived social support and the family environment.
Subgroup analyses of treatment effects between music therapy and music medicine studies was possible for four outcomes, namely anxiety, depression, mood and quality of life. There was a difference for quality of life, with music therapy studies contributing to a larger pooled treatment effect than music medicine studies; we found no difference between music therapy and music medicine studies for the other outcomes. However, it is worth noting that for all outcomes, music therapy interventions resulted in consistent findings across studies whereas the results of music medicine studies were highly heterogeneous for these outcomes.
We could examine the impact of music preference for anxiety, depression, pain, heart rate, systolic and diastolic blood pressure. Music preference did not impact the effect of music on anxiety. For the other outcomes, even though there was no difference between the use of patient‐preferred versus researcher‐selected music, the results show some interesting trends. For pain, the use of patient‐preferred music had a much larger impact on pain reduction. In contrast, no evidence of pain‐reducing effect was found for researcher‐selected music. For heart rate, researcher‐selected music resulted in a larger and more consistent treatment effect than patient‐preferred music. Interestingly, for blood pressure, patient‐preferred music resulted in a larger treatment effect, but the results were highly inconsistent across studies. In contrast, researcher‐selected music resulted in smaller effect.
For all outcomes, the sensitivity analyses were robust to the original conclusions.
The summary of findings Table for the main comparison provides a summary of the main results of this review with associated risks.
Overall completeness and applicability of evidence
This review included 52 randomized controlled trials and quasi‐randomized trials.
Seventeen trials used listening to pre‐recorded music, and 13 trials used music therapy interventions that actively engaged the patients (Characteristics of included studies). We were able to compare the treatment effects of music therapy studies with music medicine studies for four outcomes. For the other outcomes this was not possible due to insufficient number of music therapy and music medicine studies per outcome.
This review included both music therapy and music medicine studies, as defined in the Background. Music therapists who work with cancer patients do not limit their interventions to offering music listening for relaxation purposes. Music therapists are specially trained clinically and academically to carefully select music interventions to offer emotional and spiritual support, support communication with loved ones, enhance a sense of control, and improve physical well‐being in patients with cancer. Comparative analyses suggest that music therapy interventions are more effective than music medicine interventions in improving quality of life. We found no differences between music therapy and music medicine interventions for other outcomes, but it is worth noting that the results of music therapy studies were much less heterogeneous than those of music medicine studies. This is likely due to the fact that music therapists are trained to meet the individual needs of patients through music interventions (e.g. meeting the patient's in‐the‐moment needs when offering live music) rather than offering a limited selection of pre‐recorded music, which may not be suitable for all patients. Participants in a cross‐over trial who experienced both music therapy and music medicine interventions overwhelmingly preferred the music therapy sessions because of the personal attention and care, the creativity of the interactive music making, and the opportunity for emotional expression through singing and playing instruments.
In general, the trials that used listening to pre‐recorded music provided little information about the music selections used, except for mentioning general music styles (e.g. new age, classical music, easy listening, etc). Music within each of these styles can vary widely, and more detailed information would help clinicians make well‐informed decisions regarding music selections.
The frequency and duration of the interventions varied widely across the trials. Twelve trials offered a single music session. We would like to suggest that offering multiple music listening sessions allows for the patient to give feedback about the music, select different music if needed, and become more skilled in using music for relaxation purposes. In the case of music therapy interventions, multiple sessions allow for the development of a therapeutic relationship and deepening of the therapeutic process through the music. This may lead to greater health benefits. At this time, however, the relationship between the frequency and duration of treatment and treatment effect remains unclear. Further investigation into the optimal frequency and duration of music interventions for specific outcomes in people with cancer is needed.
Presently, we cannot provide data regarding cost or cost‐effectiveness of music therapy or music medicine applications in the care of cancer patients, as the reviewed trials did not provide these data.
Quality of the evidence
Because of the large number of trials at high risk of bias, readers should interpret the findings of this review with caution. Often blinding of participants is not possible in music medicine or music therapy studies unless a comparative design is used (e.g. Bradt 2015). Many of the trials in this review included subjective outcomes, such as anxiety, pain, mood and quality of life. When participants cannot be blinded to the intervention, there is definitely an opportunity for bias when they are asked to report on these subjective outcomes.
For many trials, the principal investigators needed to be contacted to provide additional methodological and statistical information, which improved the quality of evidence in the review.
For anxiety and pain, there were moderate to large effects across studies. For anxiety, the trials did not agree on the size of effect, with some reporting much larger beneficial effects than others, resulting in a large confidence interval. In summary, the quality of evidence was low for the outcomes (i.e. anxiety, mood, pain, fatigue and quality of life) and very low for depression (summary of findings Table for the main comparison).
Potential biases in the review process
The strength of our review is that we searched all available databases and a large number of music therapy journals (English, German, and French language), checked reference lists of all relevant trials, contacted relevant experts for identification of unpublished trials, and included publications without restricting language. We requested additional data where necessary for all trials we considered for inclusion. This allowed us to get accurate information on the trial quality and data for most trials and helped us make well‐informed trial selection decisions.
Although we cannot completely rule out the possibility that we missed some published and unpublished trials, we are confident that our detailed search strategy combined with extensive handsearching identified all relevant trials. It is possible that we did not identify some grey literature; however, it is doubtful that this would have had a significant impact on our results. Grey literature tends to include trials with relatively small numbers of participants and inconclusive results (McAuley 2000).
One of the included trials (Bradt 2015) was conducted by the lead author of this review. As for all new studies included in this update, the risk of bias was assessed by CD and LM. Data extraction was completed independently by AT.
Agreements and disagreements with other studies or reviews
The findings of this review are consistent with the results of a review (32 RCTs and controlled clinical trials) assessing the effect of music interventions on psychological and physical outcomes in cancer patients (Zhang 2012). Zhang and colleagues reported a mean difference of −12.3 for anxiety (STAI‐S, score range 20 to 80), −6.23 for depression (Self‐Rating Depression Scale, score range 20 to 80), −0.52 for pain (0 to 10 numeric rating scale) and 13.32 for quality of life (Quality of Life ‐ Cancer, score range 0‐100). The authors also reported that the effects of music on vital signs, especially blood pressure, were small. In contrast, Nightingale 2013 (a review of four RCT studies) evaluated the effects of music on anxiety in adult cancer patients, reporting no evidence of an effect for music on anxiety. This was likely due to the small number of studies included in this review. In addition, reviewers included Kwekkeboom 2003 in the meta‐analysis, which was a quite problematic trial in terms of the implementation of the music listening interventions, as discussed in the Results section of our review. Study participants reported that the use of headphones while undergoing painful medical procedures was anxiety‐provoking because it prevented them from hearing the surgeon. In addition, Nightingale 2013 included Hanser 2006 in the meta‐analysis, whereas we included this study in the narrative only. Our decision was based on a very high attrition rate (40%) and the inability to implement the music therapy intervention within the a priori set timeframe, thereby highly diluting the intervention, as reported by the authors.

Study flow diagram.

Risk of bias summary: review authors' judgements about each risk of bias item for each included study.

Risk of bias graph: review authors' judgements about each risk of bias item presented as percentages across all included studies.
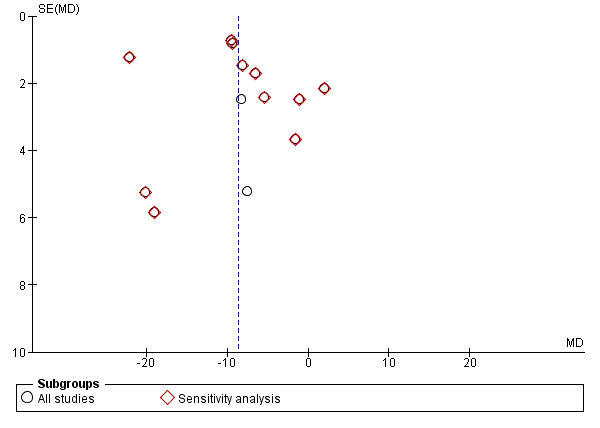
Funnel plot of comparison: 1 Music intervention plus standard care versus standard care alone, outcome: 1.1 Anxiety (STAI).

Funnel plot of comparison: 1 Music intervention plus standard care versus standard care alone, outcome: 1.6 Depression.

Funnel plot of comparison: 1 Music intervention plus standard care versus standard care alone, outcome: 1.11 Pain.

Funnel plot of comparison: 1 Music intervention plus standard care versus standard care alone, outcome: 1.15 Heart rate.

Funnel plot of comparison: 1 Music intervention plus standard care versus standard care alone, outcome: 1.13 Fatigue.
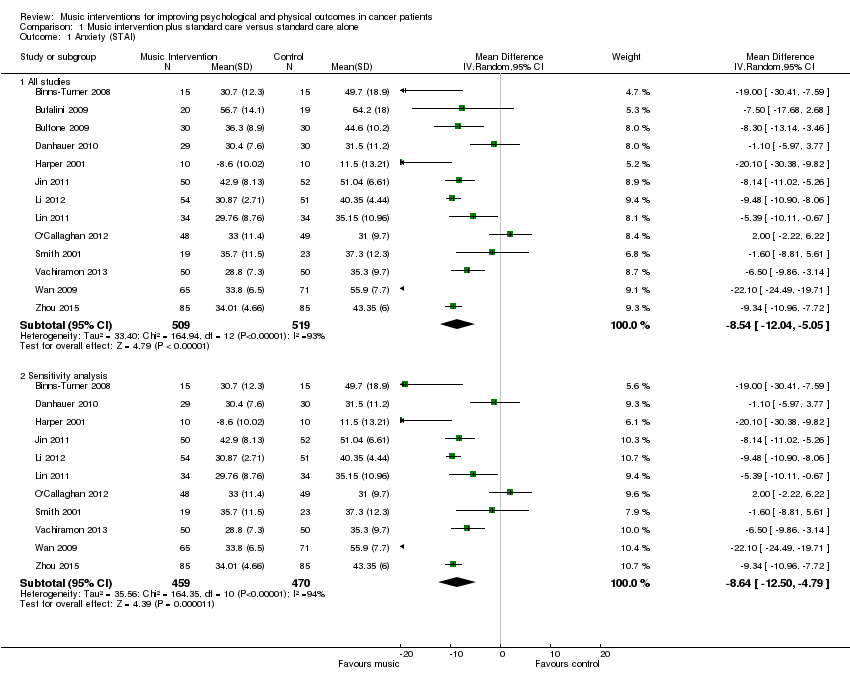
Comparison 1 Music intervention plus standard care versus standard care alone, Outcome 1 Anxiety (STAI).
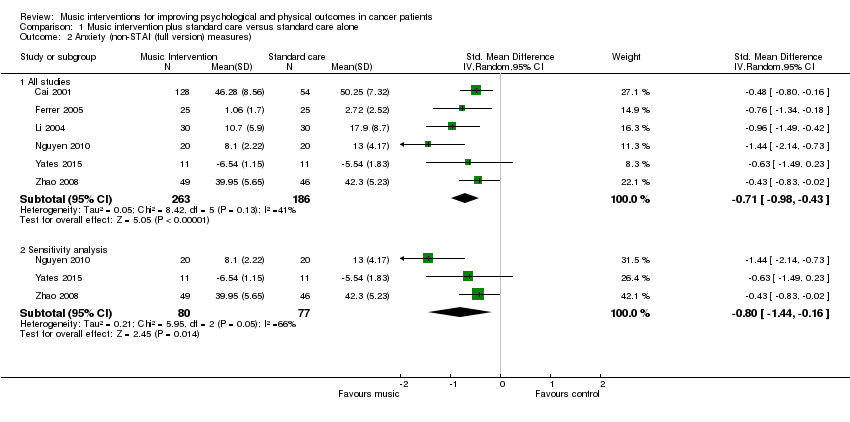
Comparison 1 Music intervention plus standard care versus standard care alone, Outcome 2 Anxiety (non‐STAI (full version) measures).

Comparison 1 Music intervention plus standard care versus standard care alone, Outcome 3 Anxiety (intervention subgroup).

Comparison 1 Music intervention plus standard care versus standard care alone, Outcome 4 Anxiety (music preference).

Comparison 1 Music intervention plus standard care versus standard care alone, Outcome 5 Anxiety (music‐guided relaxation).
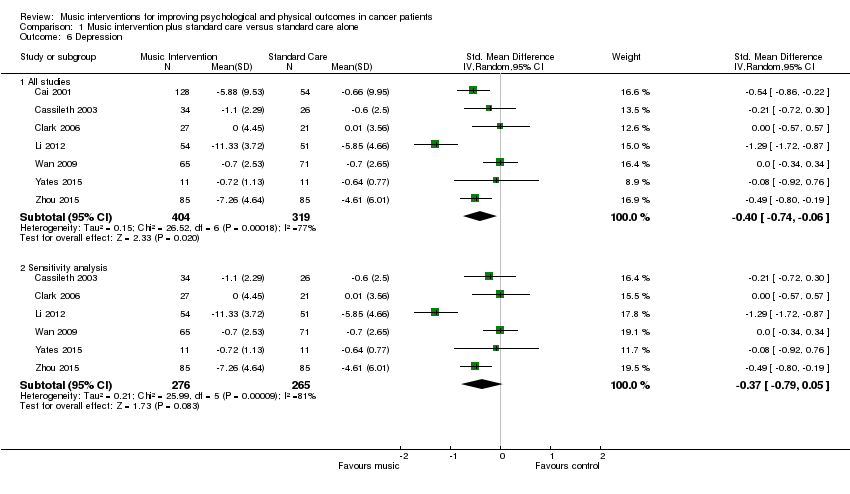
Comparison 1 Music intervention plus standard care versus standard care alone, Outcome 6 Depression.

Comparison 1 Music intervention plus standard care versus standard care alone, Outcome 7 Depression (intervention subgroup).

Comparison 1 Music intervention plus standard care versus standard care alone, Outcome 8 Depression (music preference).

Comparison 1 Music intervention plus standard care versus standard care alone, Outcome 9 Mood.

Comparison 1 Music intervention plus standard care versus standard care alone, Outcome 10 Mood (intervention subgroup).

Comparison 1 Music intervention plus standard care versus standard care alone, Outcome 11 Pain.

Comparison 1 Music intervention plus standard care versus standard care alone, Outcome 12 Pain (music preference).

Comparison 1 Music intervention plus standard care versus standard care alone, Outcome 13 Fatigue.

Comparison 1 Music intervention plus standard care versus standard care alone, Outcome 14 Physical functioning.

Comparison 1 Music intervention plus standard care versus standard care alone, Outcome 15 Heart rate.

Comparison 1 Music intervention plus standard care versus standard care alone, Outcome 16 Heart rate (music preference).

Comparison 1 Music intervention plus standard care versus standard care alone, Outcome 17 Respiratory rate.
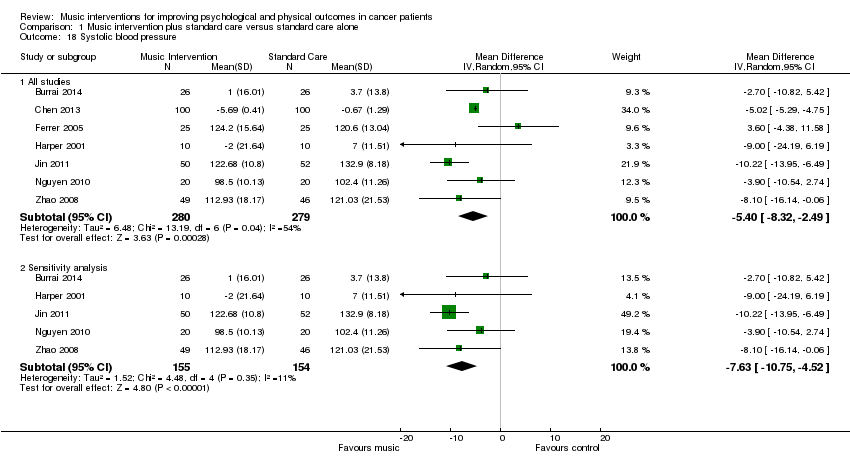
Comparison 1 Music intervention plus standard care versus standard care alone, Outcome 18 Systolic blood pressure.
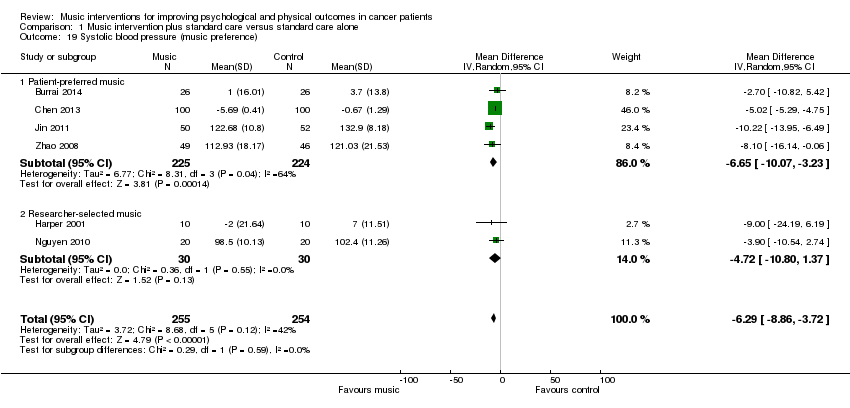
Comparison 1 Music intervention plus standard care versus standard care alone, Outcome 19 Systolic blood pressure (music preference).

Comparison 1 Music intervention plus standard care versus standard care alone, Outcome 20 Diastolic blood pressure.
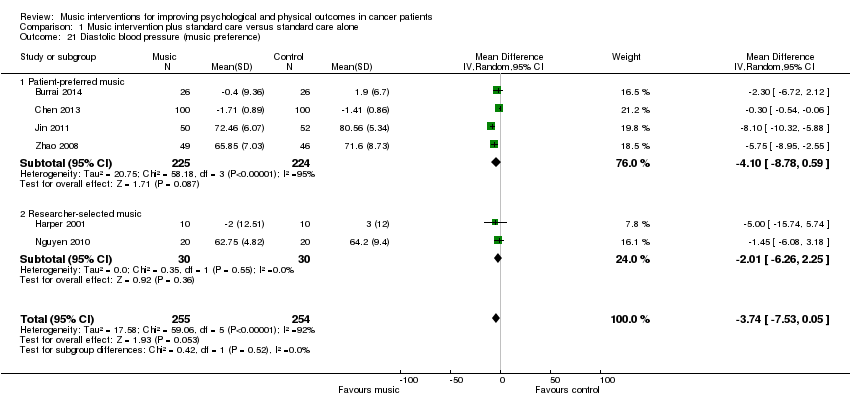
Comparison 1 Music intervention plus standard care versus standard care alone, Outcome 21 Diastolic blood pressure (music preference).

Comparison 1 Music intervention plus standard care versus standard care alone, Outcome 22 Oxygen Saturation.

Comparison 1 Music intervention plus standard care versus standard care alone, Outcome 23 Quality of Life.

Comparison 1 Music intervention plus standard care versus standard care alone, Outcome 24 Quality of life (intervention subgroup).

Comparison 2 Music therapy plus standard care versus music medicine plus standard care, Outcome 1 Anxiety.
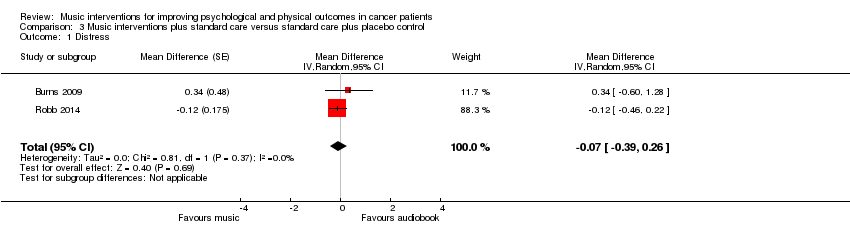
Comparison 3 Music interventions plus standard care versus standard care plus placebo control, Outcome 1 Distress.

Comparison 3 Music interventions plus standard care versus standard care plus placebo control, Outcome 2 Spiritual well‐being.
| Music interventions versus standard care for psychological and physical outcomes in cancer patients | ||||
| Patient or population: cancer patients | ||||
| Outcomes | Relative effect (95% CI) | No of participants | Quality of the evidence | Comments |
| Anxiety | The mean anxiety in the music intervention group was 8.54 units less (12.04 less to 5.05 less) than in the standard care group | 1028 | ⊕⊕⊝⊝ | — |
| Depression | The mean depression in the music intervention group was 0.40 standard deviations less (0.74 less to 0.06 less) than in the standard care group | 723 | ⊕⊝⊝⊝ | An SMD of 0.40 is considered a low to moderate effect size |
| Mood | The mean mood in the music intervention group was 0.47 standard deviations better (0.02 worse to 0.97 better) than in the standard care group | 236 | ⊕⊕⊝⊝ | An SMD of 0.47 is considered a moderate effect size |
| Pain | The mean pain in the intervention group was 0.91 standard deviations less (1.46 less to 0.36 less) than in the standard care group | 528 | ⊕⊕⊝⊝ | An SMD of 0.91 is considered a large effect size |
| Fatigue | The mean fatigue in the music intervention group was 0.38 standard deviations less (0.72 less to 0.04 less) than in the standard care group | 253 | ⊕⊕⊝⊝ | An SMD of 0.38 is considered a small to moderate effect size |
| Quality of life | The mean quality of life in the music intervention group was 0.98 standard deviations more (0.36 less to 2.33 more) than in the standard care group | 545 | ⊕⊕⊝⊝ | An SMD of 0.98 is considered a large effect size |
| *The risk in the intervention group (and its 95% confidence interval) is based on the assumed risk in the comparison group and the relative effect of the intervention (and its 95% CI). | ||||
| GRADE Working Group grades of evidence | ||||
| a The majority of the trials were at high risk of bias. | ||||
| Outcome or subgroup title | No. of studies | No. of participants | Statistical method | Effect size |
| 1 Anxiety (STAI) Show forest plot | 13 | Mean Difference (IV, Random, 95% CI) | Subtotals only | |
| 1.1 All studies | 13 | 1028 | Mean Difference (IV, Random, 95% CI) | ‐8.54 [‐12.04, ‐5.05] |
| 1.2 Sensitivity analysis | 11 | 929 | Mean Difference (IV, Random, 95% CI) | ‐8.64 [‐12.50, ‐4.79] |
| 2 Anxiety (non‐STAI (full version) measures) Show forest plot | 6 | Std. Mean Difference (IV, Random, 95% CI) | Subtotals only | |
| 2.1 All studies | 6 | 449 | Std. Mean Difference (IV, Random, 95% CI) | ‐0.71 [‐0.98, ‐0.43] |
| 2.2 Sensitivity analysis | 3 | 157 | Std. Mean Difference (IV, Random, 95% CI) | ‐0.80 [‐1.44, ‐0.16] |
| 3 Anxiety (intervention subgroup) Show forest plot | 18 | 1457 | Std. Mean Difference (IV, Random, 95% CI) | ‐0.94 [‐1.34, ‐0.55] |
| 3.1 Music therapy studies | 3 | 111 | Std. Mean Difference (IV, Random, 95% CI) | ‐0.62 [‐1.01, ‐0.24] |
| 3.2 Music medicine studies | 15 | 1346 | Std. Mean Difference (IV, Random, 95% CI) | ‐1.00 [‐1.45, ‐0.55] |
| 4 Anxiety (music preference) Show forest plot | 13 | 1142 | Std. Mean Difference (IV, Random, 95% CI) | ‐0.88 [‐1.28, ‐0.47] |
| 4.1 Patient‐preferred music | 10 | 860 | Std. Mean Difference (IV, Random, 95% CI) | ‐0.86 [‐1.38, ‐0.34] |
| 4.2 Researcher‐selected music | 3 | 282 | Std. Mean Difference (IV, Random, 95% CI) | ‐0.89 [‐1.43, ‐0.35] |
| 5 Anxiety (music‐guided relaxation) Show forest plot | 14 | 1306 | Std. Mean Difference (IV, Random, 95% CI) | ‐0.98 [‐1.44, ‐0.51] |
| 5.1 Music‐guided relaxation studies | 4 | 476 | Std. Mean Difference (IV, Random, 95% CI) | ‐1.61 [‐2.56, ‐0.65] |
| 5.2 Listening to music only | 10 | 830 | Std. Mean Difference (IV, Random, 95% CI) | ‐0.71 [‐1.16, ‐0.26] |
| 6 Depression Show forest plot | 7 | Std. Mean Difference (IV, Random, 95% CI) | Subtotals only | |
| 6.1 All studies | 7 | 723 | Std. Mean Difference (IV, Random, 95% CI) | ‐0.40 [‐0.74, ‐0.06] |
| 6.2 Sensitivity analysis | 6 | 541 | Std. Mean Difference (IV, Random, 95% CI) | ‐0.37 [‐0.79, 0.05] |
| 7 Depression (intervention subgroup) Show forest plot | 7 | 723 | Std. Mean Difference (IV, Random, 95% CI) | ‐0.40 [‐0.74, ‐0.06] |
| 7.1 Music therapy studies | 3 | 130 | Std. Mean Difference (IV, Random, 95% CI) | ‐0.11 [‐0.46, 0.24] |
| 7.2 Music medicine studies | 4 | 593 | Std. Mean Difference (IV, Random, 95% CI) | ‐0.57 [‐1.03, ‐0.10] |
| 8 Depression (music preference) Show forest plot | 4 | 505 | Std. Mean Difference (IV, Random, 95% CI) | ‐0.60 [‐1.04, ‐0.16] |
| 8.1 Patient‐preferred music | 2 | 275 | Std. Mean Difference (IV, Random, 95% CI) | ‐0.88 [‐1.67, ‐0.09] |
| 8.2 Researcher‐selected music | 2 | 230 | Std. Mean Difference (IV, Random, 95% CI) | ‐0.32 [‐0.84, 0.19] |
| 9 Mood Show forest plot | 5 | Std. Mean Difference (IV, Random, 95% CI) | Subtotals only | |
| 9.1 All studies | 5 | 236 | Std. Mean Difference (IV, Random, 95% CI) | 0.47 [‐0.02, 0.97] |
| 9.2 Sensitivity analysis | 4 | 192 | Std. Mean Difference (IV, Random, 95% CI) | 0.57 [‐0.03, 1.18] |
| 10 Mood (intervention subgroup) Show forest plot | 5 | 236 | Std. Mean Difference (IV, Random, 95% CI) | 0.47 [‐0.02, 0.97] |
| 10.1 Music therapy studies | 2 | 104 | Std. Mean Difference (IV, Random, 95% CI) | 0.37 [‐0.13, 0.87] |
| 10.2 Music medicine studies | 3 | 132 | Std. Mean Difference (IV, Random, 95% CI) | 0.55 [‐0.37, 1.47] |
| 11 Pain Show forest plot | 7 | 528 | Std. Mean Difference (IV, Random, 95% CI) | ‐0.91 [‐1.46, ‐0.36] |
| 12 Pain (music preference) Show forest plot | 6 | 496 | Std. Mean Difference (IV, Random, 95% CI) | ‐0.92 [‐1.53, ‐0.30] |
| 12.1 Patient‐preferred music | 4 | 320 | Std. Mean Difference (IV, Random, 95% CI) | ‐1.06 [‐1.93, ‐0.20] |
| 12.2 Researcher‐selected music | 2 | 176 | Std. Mean Difference (IV, Random, 95% CI) | ‐0.59 [‐1.34, 0.15] |
| 13 Fatigue Show forest plot | 6 | Std. Mean Difference (IV, Random, 95% CI) | Subtotals only | |
| 13.1 All studies | 6 | 253 | Std. Mean Difference (IV, Random, 95% CI) | ‐0.38 [‐0.72, ‐0.04] |
| 13.2 Sensitivity analysis | 5 | 203 | Std. Mean Difference (IV, Random, 95% CI) | ‐0.20 [‐0.48, 0.08] |
| 14 Physical functioning Show forest plot | 4 | Std. Mean Difference (IV, Random, 95% CI) | Subtotals only | |
| 14.1 All studies | 4 | 493 | Std. Mean Difference (IV, Random, 95% CI) | 0.78 [‐0.74, 2.31] |
| 14.2 Sensitivity analysis | 3 | 233 | Std. Mean Difference (IV, Random, 95% CI) | 0.08 [‐0.18, 0.34] |
| 15 Heart rate Show forest plot | 8 | Mean Difference (IV, Random, 95% CI) | Subtotals only | |
| 15.1 All studies | 8 | 589 | Mean Difference (IV, Random, 95% CI) | ‐3.32 [‐6.21, ‐0.44] |
| 15.2 Sensitivity analysis | 6 | 339 | Mean Difference (IV, Random, 95% CI) | ‐4.63 [‐8.18, ‐1.09] |
| 16 Heart rate (music preference) Show forest plot | 7 | 539 | Mean Difference (IV, Random, 95% CI) | ‐3.77 [‐6.97, ‐0.58] |
| 16.1 Patient‐preferred music | 5 | 479 | Mean Difference (IV, Random, 95% CI) | ‐3.13 [‐6.54, 0.27] |
| 16.2 Researcher‐selected music | 2 | 60 | Mean Difference (IV, Random, 95% CI) | ‐7.94 [‐15.10, ‐0.78] |
| 17 Respiratory rate Show forest plot | 4 | Mean Difference (IV, Random, 95% CI) | Subtotals only | |
| 17.1 All studies | 4 | 437 | Mean Difference (IV, Random, 95% CI) | ‐1.24 [‐2.54, 0.06] |
| 17.2 Sensitivity analysis | 3 | 237 | Mean Difference (IV, Random, 95% CI) | ‐1.83 [‐3.36, ‐0.30] |
| 18 Systolic blood pressure Show forest plot | 7 | Mean Difference (IV, Random, 95% CI) | Subtotals only | |
| 18.1 All studies | 7 | 559 | Mean Difference (IV, Random, 95% CI) | ‐5.40 [‐8.32, ‐2.49] |
| 18.2 Sensitivity analysis | 5 | 309 | Mean Difference (IV, Random, 95% CI) | ‐7.63 [‐10.75, ‐4.52] |
| 19 Systolic blood pressure (music preference) Show forest plot | 6 | 509 | Mean Difference (IV, Random, 95% CI) | ‐6.29 [‐8.86, ‐3.72] |
| 19.1 Patient‐preferred music | 4 | 449 | Mean Difference (IV, Random, 95% CI) | ‐6.65 [‐10.07, ‐3.23] |
| 19.2 Researcher‐selected music | 2 | 60 | Mean Difference (IV, Random, 95% CI) | ‐4.72 [‐10.80, 1.37] |
| 20 Diastolic blood pressure Show forest plot | 7 | Mean Difference (IV, Random, 95% CI) | Subtotals only | |
| 20.1 All studies | 7 | 559 | Mean Difference (IV, Random, 95% CI) | ‐2.35 [‐5.88, 1.18] |
| 20.2 Sensitivity analysis | 5 | 309 | Mean Difference (IV, Random, 95% CI) | ‐4.94 [‐7.78, ‐2.09] |
| 21 Diastolic blood pressure (music preference) Show forest plot | 6 | 509 | Mean Difference (IV, Random, 95% CI) | ‐3.74 [‐7.53, 0.05] |
| 21.1 Patient‐preferred music | 4 | 449 | Mean Difference (IV, Random, 95% CI) | ‐4.10 [‐8.78, 0.59] |
| 21.2 Researcher‐selected music | 2 | 60 | Mean Difference (IV, Random, 95% CI) | ‐2.01 [‐6.26, 2.25] |
| 22 Oxygen Saturation Show forest plot | 3 | 292 | Mean Difference (IV, Random, 95% CI) | 0.50 [‐0.18, 1.18] |
| 23 Quality of Life Show forest plot | 6 | Std. Mean Difference (IV, Random, 95% CI) | Subtotals only | |
| 23.1 All studies | 6 | 545 | Std. Mean Difference (IV, Random, 95% CI) | 0.98 [‐0.36, 2.33] |
| 23.2 Sensitivity analysis | 4 | 241 | Std. Mean Difference (IV, Random, 95% CI) | 0.52 [0.01, 1.02] |
| 24 Quality of life (intervention subgroup) Show forest plot | 5 | 568 | Std. Mean Difference (IV, Random, 95% CI) | 0.99 [‐0.34, 2.31] |
| 24.1 Music therapy studies | 3 | 132 | Std. Mean Difference (IV, Random, 95% CI) | 0.42 [0.06, 0.78] |
| 24.2 Music medicine studies | 2 | 436 | Std. Mean Difference (IV, Random, 95% CI) | 1.33 [‐0.96, 3.63] |
| Outcome or subgroup title | No. of studies | No. of participants | Statistical method | Effect size |
| 1 Anxiety Show forest plot | 2 | 166 | Mean Difference (IV, Fixed, 95% CI) | ‐3.67 [‐11.68, 4.35] |
| Outcome or subgroup title | No. of studies | No. of participants | Statistical method | Effect size |
| 1 Distress Show forest plot | 2 | Mean Difference (Random, 95% CI) | ‐0.07 [‐0.39, 0.26] | |
| 2 Spiritual well‐being Show forest plot | 2 | Std. Mean Difference (Fixed, 95% CI) | 0.31 [‐0.11, 0.73] | |