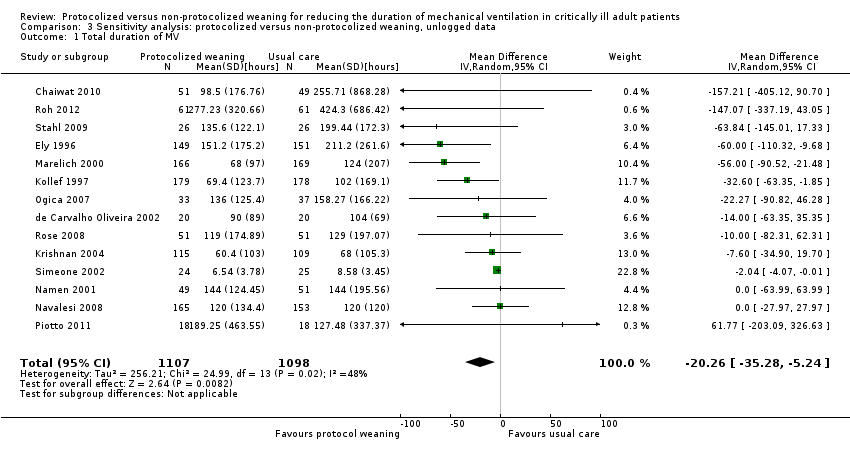
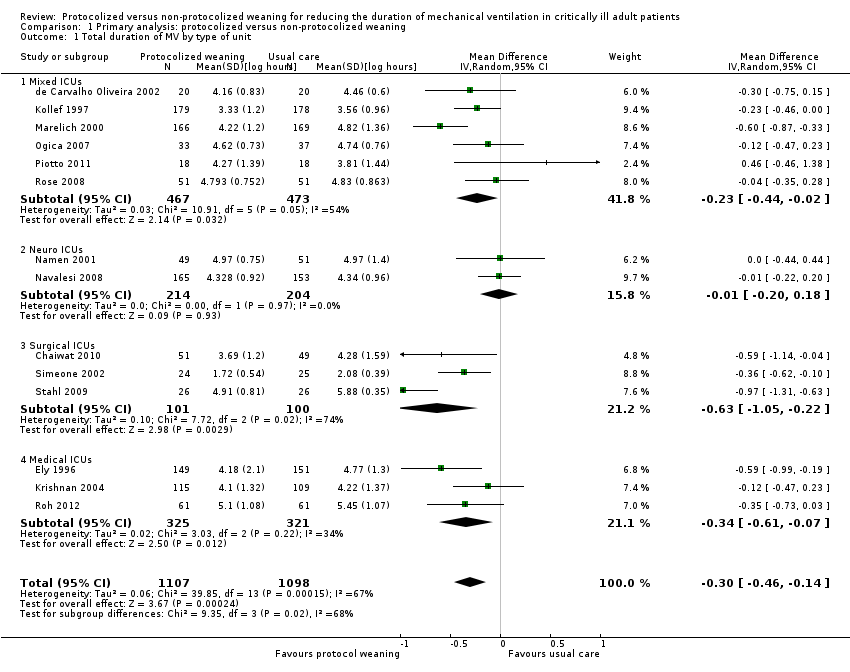
| 1 Total duration of MV by type of unit Show forest plot | 14 | 2205 | Mean Difference (IV, Random, 95% CI) | ‐0.30 [‐0.46, ‐0.14] |
|
| 1.1 Mixed ICUs | 6 | 940 | Mean Difference (IV, Random, 95% CI) | ‐0.23 [‐0.44, ‐0.02] |
| 1.2 Neuro ICUs | 2 | 418 | Mean Difference (IV, Random, 95% CI) | ‐0.01 [‐0.20, 0.18] |
| 1.3 Surgical ICUs | 3 | 201 | Mean Difference (IV, Random, 95% CI) | ‐0.63 [‐1.05, ‐0.22] |
| 1.4 Medical ICUs | 3 | 646 | Mean Difference (IV, Random, 95% CI) | ‐0.34 [‐0.61, ‐0.07] |
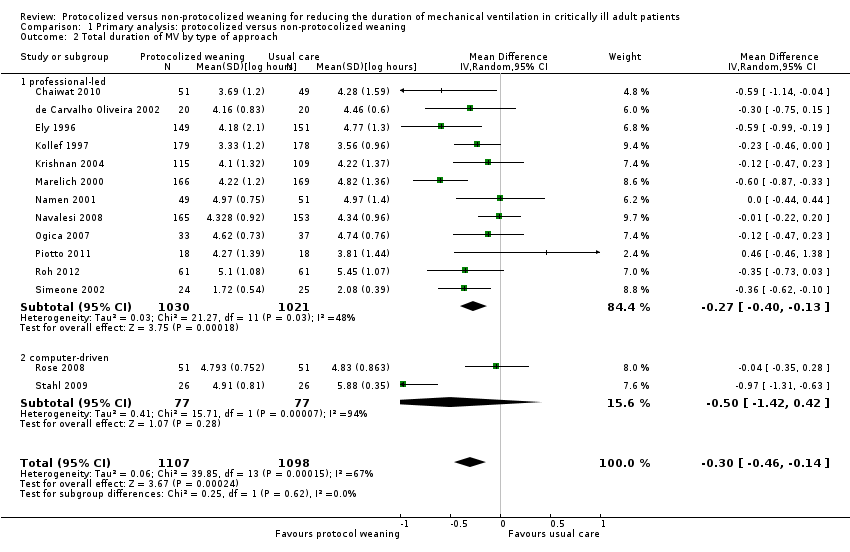
| 2 Total duration of MV by type of approach Show forest plot | 14 | 2205 | Mean Difference (IV, Random, 95% CI) | ‐0.30 [‐0.46, ‐0.14] |
|
| 2.1 professional‐led | 12 | 2051 | Mean Difference (IV, Random, 95% CI) | ‐0.27 [‐0.40, ‐0.13] |
| 2.2 computer‐driven | 2 | 154 | Mean Difference (IV, Random, 95% CI) | ‐0.50 [‐1.42, 0.42] |
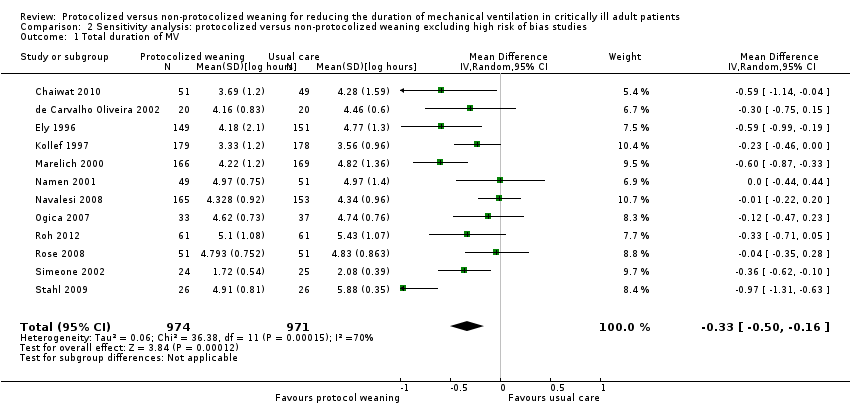
| 3 Total duration of MV by type of protocol [log hours] Show forest plot | 14 | 2205 | Mean Difference (IV, Random, 95% CI) | ‐0.30 [‐0.46, ‐0.14] |
|
| 3.1 SBT protocol | 8 | 1188 | Mean Difference (IV, Random, 95% CI) | ‐0.18 [‐0.36, 0.00] |
| 3.2 Stepwise reduction protocol | 6 | 1017 | Mean Difference (IV, Random, 95% CI) | ‐0.42 [‐0.66, ‐0.18] |
| 4 Mortality Show forest plot | 14 | 2234 | Odds Ratio (M‐H, Fixed, 95% CI) | 1.02 [0.82, 1.26] |
|
| 4.1 Hospital mortality | 8 | 1523 | Odds Ratio (M‐H, Fixed, 95% CI) | 1.04 [0.82, 1.32] |
| 4.2 ICU mortality | 7 | 711 | Odds Ratio (M‐H, Fixed, 95% CI) | 0.93 [0.58, 1.48] |
| 5 Reintubation Show forest plot | 11 | 1487 | Odds Ratio (M‐H, Random, 95% CI) | 0.74 [0.44, 1.23] |
|
| 6 Self extubation Show forest plot | 3 | 433 | Odds Ratio (M‐H, Random, 95% CI) | 0.43 [0.14, 1.34] |
|
| 7 Tracheostomy Show forest plot | 8 | 1346 | Odds Ratio (M‐H, Random, 95% CI) | 0.85 [0.51, 1.40] |
|
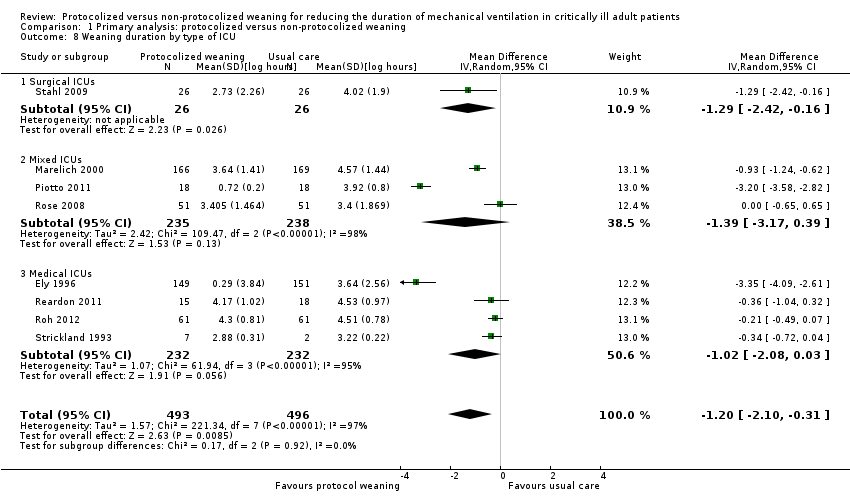
| 8 Weaning duration by type of ICU Show forest plot | 8 | 989 | Mean Difference (IV, Random, 95% CI) | ‐1.20 [‐2.10, ‐0.31] |
|
| 8.1 Surgical ICUs | 1 | 52 | Mean Difference (IV, Random, 95% CI) | ‐1.29 [‐2.42, ‐0.16] |
| 8.2 Mixed ICUs | 3 | 473 | Mean Difference (IV, Random, 95% CI) | ‐1.39 [‐3.17, 0.39] |
| 8.3 Medical ICUs | 4 | 464 | Mean Difference (IV, Random, 95% CI) | ‐1.02 [‐2.08, 0.03] |
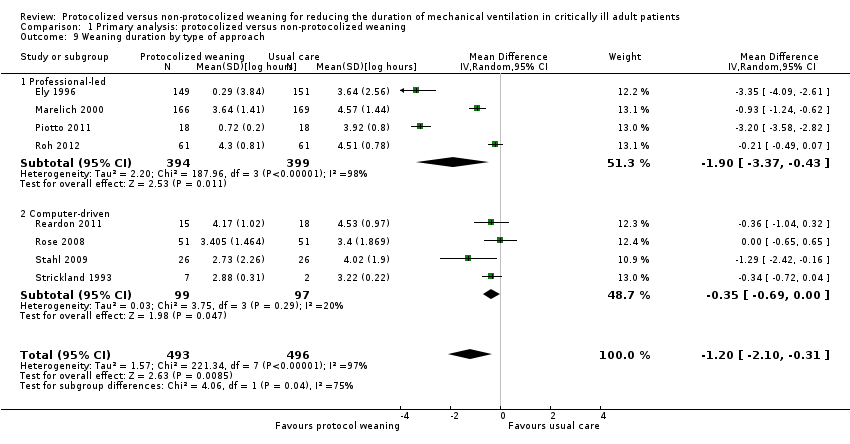
| 9 Weaning duration by type of approach Show forest plot | 8 | 989 | Mean Difference (IV, Random, 95% CI) | ‐1.20 [‐2.10, ‐0.31] |
|
| 9.1 Professional‐led | 4 | 793 | Mean Difference (IV, Random, 95% CI) | ‐1.90 [‐3.37, ‐0.43] |
| 9.2 Computer‐driven | 4 | 196 | Mean Difference (IV, Random, 95% CI) | ‐0.35 [‐0.69, ‐0.00] |
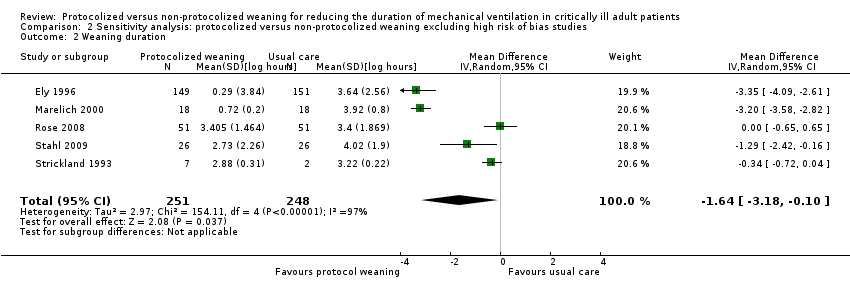
| 10 Weaning duration by type of protocol [log hours] Show forest plot | 8 | 989 | Mean Difference (IV, Random, 95% CI) | ‐1.20 [‐2.10, ‐0.31] |
|
| 10.1 SBT protocol | 2 | 336 | Mean Difference (IV, Random, 95% CI) | ‐3.23 [‐3.57, ‐2.89] |
| 10.2 Stepwise reduction protocol | 6 | 653 | Mean Difference (IV, Random, 95% CI) | ‐0.46 [‐0.81, ‐0.12] |
| 11 ICU length of stay Show forest plot | 9 | 1378 | Mean Difference (IV, Fixed, 95% CI) | ‐0.12 [‐0.21, ‐0.03] |
|
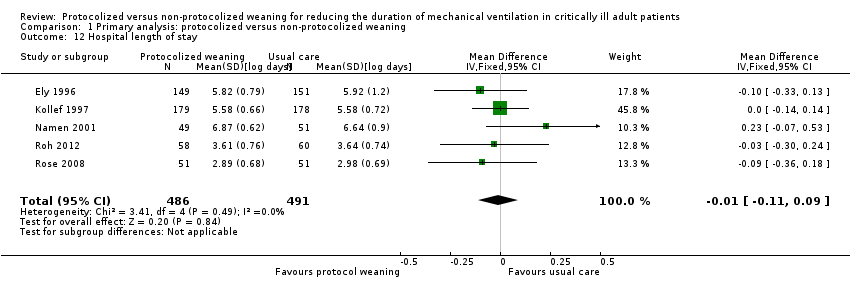
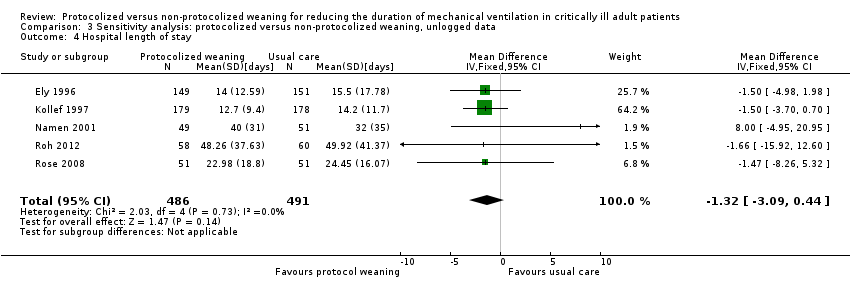
| 12 Hospital length of stay Show forest plot | 5 | 977 | Mean Difference (IV, Fixed, 95% CI) | ‐0.01 [‐0.11, 0.09] |
|
| 13 ICU costs Show forest plot | 2 | 400 | Mean Difference (IV, Random, 95% CI) | 3.37 [‐15.02, 21.76] |
|
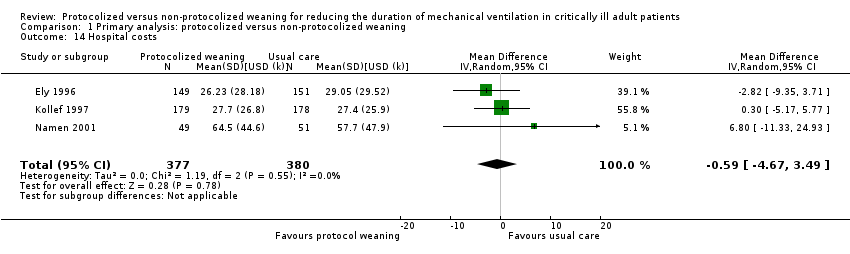
| 14 Hospital costs Show forest plot | 3 | 757 | Mean Difference (IV, Random, 95% CI) | ‐0.59 [‐4.67, 3.49] |
|


![Forest plot of comparison: 1 Primary analysis: protocolized versus non‐protocolized weaning, outcome: 1.3 Total duration of mechanical ventilation by type of protocol [log hours].](/es/cdsr/doi/10.1002/14651858.CD006904.pub3/media/CDSR/CD006904/image_n/nCD006904-AFig-FIG04.png)
![Forest plot of comparison: 1 Primary analysis: protocolized versus non‐protocolized weaning, outcome: 1.9 Weaning duration by type of approach [log hours].](/es/cdsr/doi/10.1002/14651858.CD006904.pub3/media/CDSR/CD006904/image_n/nCD006904-AFig-FIG05.png)
![Funnel plot of comparison: 1 Primary analysis: protocolized versus non‐protocolized weaning, outcome: 1.2 Total duration of MV by type of approach [log hours].](/es/cdsr/doi/10.1002/14651858.CD006904.pub3/media/CDSR/CD006904/image_n/nCD006904-AFig-FIG06.png)
![Comparison 1 Primary analysis: protocolized versus non‐protocolized weaning, Outcome 3 Total duration of MV by type of protocol [log hours].](/es/cdsr/doi/10.1002/14651858.CD006904.pub3/media/CDSR/CD006904/image_n/nCD006904-CMP-001-03.png)


![Comparison 1 Primary analysis: protocolized versus non‐protocolized weaning, Outcome 10 Weaning duration by type of protocol [log hours].](/es/cdsr/doi/10.1002/14651858.CD006904.pub3/media/CDSR/CD006904/image_n/nCD006904-CMP-001-10.png)