Scolaris Content Display Scolaris Content Display

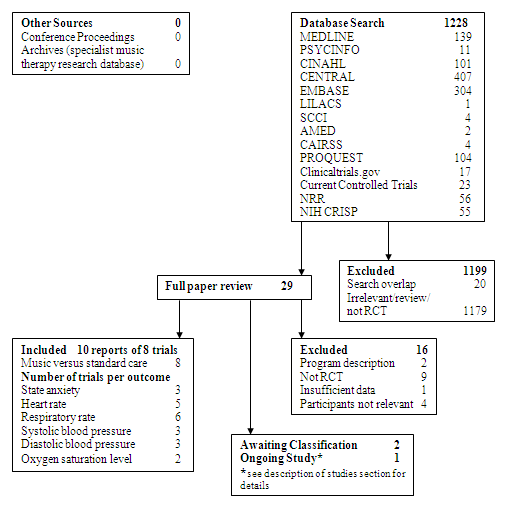
Study Flow Diagram ‐ Original Review.
Figuras y tablas -
Figure 1

Study Flow Diagram ‐ Original Review.

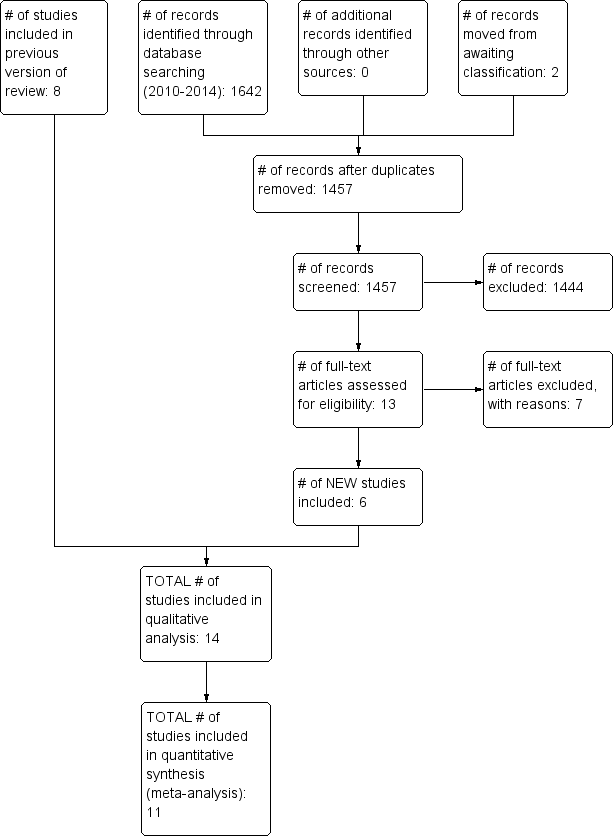
Study flow diagram ‐ updated review.
Figuras y tablas -
Figure 2

Study flow diagram ‐ updated review.

Funnel plot of comparison: 1 Music versus standard care, outcome: 1.4 Respiratory rate.
Figuras y tablas -
Figure 3

Funnel plot of comparison: 1 Music versus standard care, outcome: 1.4 Respiratory rate.

Risk of bias summary: review authors' judgements about each risk of bias item for each included study.
Figuras y tablas -
Figure 4

Risk of bias summary: review authors' judgements about each risk of bias item for each included study.

Risk of bias graph: review authors' judgements about each risk of bias item presented as percentages across all included studies.
Figuras y tablas -
Figure 5

Risk of bias graph: review authors' judgements about each risk of bias item presented as percentages across all included studies.

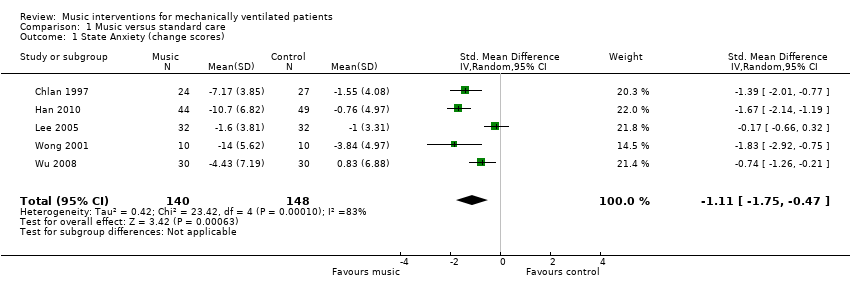
Comparison 1 Music versus standard care, Outcome 1 State Anxiety (change scores).
Figuras y tablas -
Analysis 1.1

Comparison 1 Music versus standard care, Outcome 1 State Anxiety (change scores).

Comparison 1 Music versus standard care, Outcome 2 Heart Rate.
Figuras y tablas -
Analysis 1.2

Comparison 1 Music versus standard care, Outcome 2 Heart Rate.

Comparison 1 Music versus standard care, Outcome 3 Heart Rate (adequate randomization).
Figuras y tablas -
Analysis 1.3

Comparison 1 Music versus standard care, Outcome 3 Heart Rate (adequate randomization).

Comparison 1 Music versus standard care, Outcome 4 Respiratory Rate.
Figuras y tablas -
Analysis 1.4

Comparison 1 Music versus standard care, Outcome 4 Respiratory Rate.

Comparison 1 Music versus standard care, Outcome 5 Respiratory Rate (adequate randomization).
Figuras y tablas -
Analysis 1.5

Comparison 1 Music versus standard care, Outcome 5 Respiratory Rate (adequate randomization).

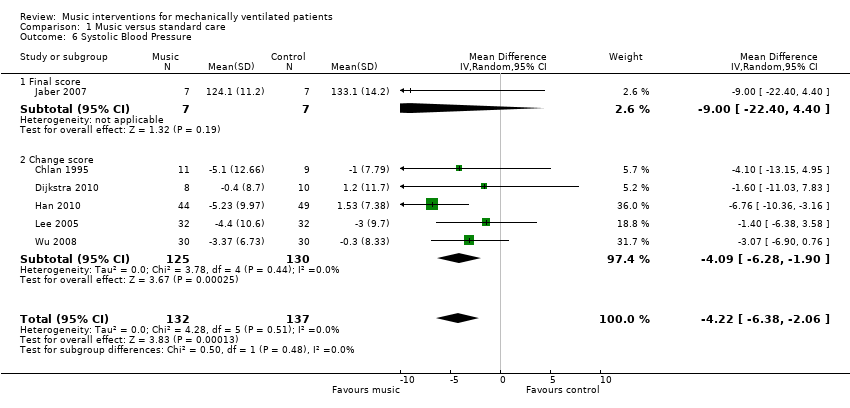
Comparison 1 Music versus standard care, Outcome 6 Systolic Blood Pressure.
Figuras y tablas -
Analysis 1.6

Comparison 1 Music versus standard care, Outcome 6 Systolic Blood Pressure.

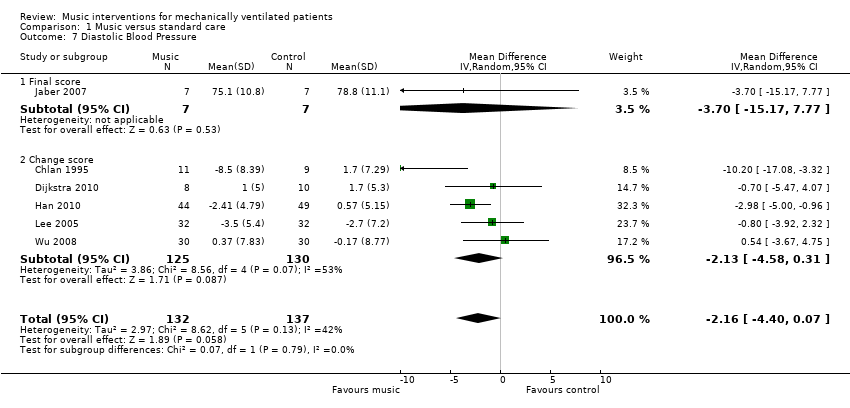
Comparison 1 Music versus standard care, Outcome 7 Diastolic Blood Pressure.
Figuras y tablas -
Analysis 1.7

Comparison 1 Music versus standard care, Outcome 7 Diastolic Blood Pressure.

Comparison 1 Music versus standard care, Outcome 8 Mean Arterial Pressure.
Figuras y tablas -
Analysis 1.8

Comparison 1 Music versus standard care, Outcome 8 Mean Arterial Pressure.

Comparison 1 Music versus standard care, Outcome 9 Oxygen Saturation Level (change scores).
Figuras y tablas -
Analysis 1.9

Comparison 1 Music versus standard care, Outcome 9 Oxygen Saturation Level (change scores).

Comparison 1 Music versus standard care, Outcome 10 Mortality.
Figuras y tablas -
Analysis 1.10

Comparison 1 Music versus standard care, Outcome 10 Mortality.

Summary of findings for the main comparison. Music compared to standard care for mechanically ventilated patients

Music compared to standard care for mechanically ventilated patients

Patient or population: mechanically ventilated patients
Settings: intensive care units
Intervention: music
Comparison: standard care

Outcomes

Relative effect
(95% CI)

No of participants
(studies)

Quality of the evidence
(GRADE)

State anxiety
STAI, VAS

The mean state anxiety in the intervention groups was
1.11 standard deviations lower
(1.75 to 0.47 lower)

288
(5 studies)

⊕⊕⊝⊝
low1,2,3,4

Heart rate
beats per minute

The mean heart rate in the intervention groups was
3.95 lower
(6.62 to 1.27 lower)

338
(8 studies)

⊕⊝⊝⊝
very low1,5,6

Respiratory rate
breaths per minute

The mean respiratory rate in the intervention groups was
2.87 lower
(3.64 to 2.10 lower)

357
(9 studies)

⊕⊝⊝⊝
very low1,6

Systolic blood pressure

mmHg

The mean systolic blood pressure in the intervention groups was
4.22 lower
(6.38 to 2.06 lower)

269
(6 studies)

⊕⊝⊝⊝
very low1,7

Diastolic blood pressure

mmHg

The mean diastolic blood pressure in the intervention groups was
2.16 lower
(4.4 lower to 0.07 higher)

269
(6 studies)

⊕⊝⊝⊝
very low1,7

Mean arterial pressure

mmHg

The mean arterial pressure in the intervention groups was
1.79 lower
(4.56 lower to 0.99 higher)

98
(3 studies)

⊕⊝⊝⊝
very low1,7

Oxygen saturation level

The mean oxygen saturation level in the intervention groups was
0.05 lower
(0.67 lower to 0.57 higher)

193
(4 studies)

⊕⊕⊝⊝
low1

CI: Confidence interval

GRADE Working Group grades of evidence
High quality: further research is very unlikely to change our confidence in the estimate of effect.
Moderate quality: further research is likely to have an important impact on our confidence in the estimate of effect and may change the estimate.
Low quality: further research is very likely to have an important impact on our confidence in the estimate of effect and is likely to change the estimate.
Very low quality: we are very uncertain about the estimate.

1 The majority of the trials were assessed as high risk of bias studies
2 All point estimates favour music although the magnitude of the effect differs across studies
3 Wide confidence interval, however, this is due to the fact that some studies reported very large beneficial effects of music on anxiety
4 Large reduction in anxiety as evidenced by SMD of 1.11
5 Results were inconsistent across studies as evidenced by I² = 62%
6 Somewhat wide confidence interval
7 Wide confidence interval

Figuras y tablas -
Summary of findings for the main comparison. Music compared to standard care for mechanically ventilated patients
Comparison 1. Music versus standard care

Outcome or subgroup title

No. of studies

No. of participants

Statistical method

Effect size

1 State Anxiety (change scores) Show forest plot

5

288

Std. Mean Difference (IV, Random, 95% CI)

‐1.11 [‐1.75, ‐0.47]

2 Heart Rate Show forest plot

8

338

Mean Difference (IV, Random, 95% CI)

‐3.95 [‐6.62, ‐1.27]

2.1 Final score

2

63

Mean Difference (IV, Random, 95% CI)

‐5.26 [‐13.56, 3.03]

2.2 Change score

6

275

Mean Difference (IV, Random, 95% CI)

‐3.82 [‐6.83, ‐0.82]

3 Heart Rate (adequate randomization) Show forest plot

7

318

Mean Difference (IV, Random, 95% CI)

‐4.01 [‐6.80, ‐1.22]

4 Respiratory Rate Show forest plot

9

357

Mean Difference (IV, Random, 95% CI)

‐2.87 [‐3.64, ‐2.10]

4.1 Final score

3

83

Mean Difference (IV, Random, 95% CI)

‐2.14 [‐4.06, ‐0.22]

4.2 Change score

6

274

Mean Difference (IV, Random, 95% CI)

‐3.01 [‐3.85, ‐2.17]

5 Respiratory Rate (adequate randomization) Show forest plot

8

337

Mean Difference (IV, Random, 95% CI)

‐2.87 [‐3.64, ‐2.09]

6 Systolic Blood Pressure Show forest plot

6

269

Mean Difference (IV, Random, 95% CI)

‐4.22 [‐6.38, ‐2.06]

6.1 Final score

1

14

Mean Difference (IV, Random, 95% CI)

‐9.0 [‐22.40, 4.40]

6.2 Change score

5

255

Mean Difference (IV, Random, 95% CI)

‐4.09 [‐6.28, ‐1.90]

7 Diastolic Blood Pressure Show forest plot

6

269

Mean Difference (IV, Random, 95% CI)

‐2.16 [‐4.40, 0.07]

7.1 Final score

1

14

Mean Difference (IV, Random, 95% CI)

‐3.70 [‐15.17, 7.77]

7.2 Change score

5

255

Mean Difference (IV, Random, 95% CI)

‐2.13 [‐4.58, 0.31]

8 Mean Arterial Pressure Show forest plot

3

98

Mean Difference (IV, Random, 95% CI)

‐1.79 [‐4.56, 0.99]

8.1 Final score

1

20

Mean Difference (IV, Random, 95% CI)

‐4.75 [‐17.81, 8.31]

8.2 Change score

2

78

Mean Difference (IV, Random, 95% CI)

‐1.65 [‐4.49, 1.20]

9 Oxygen Saturation Level (change scores) Show forest plot

4

193

Mean Difference (IV, Random, 95% CI)

‐0.05 [‐0.67, 0.57]

10 Mortality Show forest plot

2

271

Risk Ratio (M‐H, Random, 95% CI)

0.76 [0.38, 1.51]

Figuras y tablas -
Comparison 1. Music versus standard care