Valoración del riesgo para la prevención primaria de las enfermedades cardiovasculares
Referencias
Referencias de los estudios incluidos en esta revisión
Referencias de los estudios excluidos de esta revisión
Referencias de los estudios en espera de evaluación
Referencias de los estudios en curso
Referencias adicionales
Characteristics of studies
Characteristics of included studies [ordered by study ID]
| Study characteristics | ||
| Methods | Cluster‐randomised trial, parallel group (1:1) | |
| Participants | Patients from outpatient clinics in 9 European countries Unit of randomisation: primary care clinic Inclusion criteria: 45–64 years of age with a history of hypertension, systolic blood pressure ≥ 140 mmHg (or ≥ 130 mmHg if renal disease), and a 10‐year risk of coronary heart disease (CHD) ≥ 10% Exclusion criteria: individuals with a history of CHD, diabetes mellitus, fasting plasma glucose > 6.9 mmol/L, or practices that routinely used risk calculators 101 clinics randomised: n = 51 intervention, n = 50 usual care; 1 clinic excluded prior to participant recruitment 1103 participants randomised: n = 565 intervention, n = 538 usual care Mean (SD) age: 56.8 (5.1) years, 14% women, 96% white; no diabetes mellitus | |
| Interventions | Intervention group:
Comparison group: usual care (risk factor assessment but 10‐year CHD risk not provided) | |
| Outcomes | Primary outcome: Framingham 10‐year CHD risk at 6 months Secondary outcomes: changes in blood pressure and cholesterol levels; attainment of blood pressure and ATP‐III LDL‐C goals; knowledge; attitude; behaviour; adverse effects Number of clinics analysed: n = 50 intervention, n = 50 usual care Number of participants analysed for safety: n = 563 intervention, n = 533 usual care Number of participants analysed for efficacy: n = 524 intervention, n = 461 usual care Follow‐up: 6 months | |
| Study funding sources | "This study was sponsored by Pfizer Inc, who were involved in the study design, data collection, data analysis, manuscript preparation and publication decisions." | |
| Notes | Endpoints analysed using mixed effects models to account for clustering Did not meet recruitment target. 91 participants (n = 30 intervention, n = 61 usual care) were excluded from efficacy analyses due to failure of hand‐held electronic devices. | |
| Risk of bias | ||
| Bias | Authors' judgement | Support for judgement |
| Random sequence generation (selection bias) | Low risk | Computer based algorithm to assign study sites to allocation |
| Allocation concealment (selection bias) | Unclear risk | Method of allocation concealment not reported |
| Blinding of participants and personnel (performance bias) | High risk | Physicians unblinded |
| Blinding of outcome assessment (detection bias) | High risk | Risk factors in follow‐up were measured by the unblinded physicians |
| Incomplete outcome data (attrition bias) | High risk | > 10% excluded due to device failure or loss to follow‐up. Disproportionate loss to follow‐up in usual care and these individuals were excluded from analyses. ITT analysis not performed |
| Selective reporting (reporting bias) | Low risk | All outcomes from protocol were reported |
| Other bias | High risk | Pharmaceutical funding and several investigators had ties to industry |
| Study characteristics | ||
| Methods | Cluster‐randomised trial, parallel group (1:1) | |
| Participants | 66 primary care practices in North Carolina randomised (n = 32 intervention, n = 34 comparison). 5 practices withdrew before intervention started (3 intervention, 2 comparison). Medical records abstracted from 5057 participants at baseline (n = 2841 intervention, n = 2216 comparison). Inclusion criteria: self‐described primary care practices, staffed by internal medicine or family medicine providers, 3 h driving radius of research site in North Carolina. Exclusion criteria: direct affiliation to medical school or residency programme, practices providing subspecialty care, sites outside of North Carolina Mean age of participants: 46 years, 57% women, 62% non‐Hispanic white, 9% African American; 7% established CVD, 9% diabetes mellitus | |
| Interventions | Both groups received guideline dissemination, patient education materials, continuing medical education, feedback based on baseline chart audit, and 4 visits for intervention‐specific academic detailing. Intervention group:
Comparison group: no decision support, dissemination of JNC‐7 guidelines, blood pressure measurement devices provided to participants | |
| Outcomes | Primary outcome: proportion of participants treated appropriately to lipid‐lowering treatment 4 months after intervention Secondary outcomes: proportion of participants with appropriate lipid‐lowering treatment, inappropriate lipid‐lowering treatment, and lipid screening 61 practices analysed (n = 29 intervention; n = 32 comparison) Medical records abstracted from 3821 participants at follow‐up (n = 2010 intervention, n = 1811 comparison) Follow‐up: 1 year | |
| Study funding sources | Funded by that National Heart, Lung, and Blood Institute, USA | |
| Notes | Endpoints analysed using generalised estimating equations to account for clustering Analyses compared overall prescribing rates in randomly selected participants before and after the intervention but did not follow individual participants Analyses Trial reported a net improvement in appropriate management but this was due to a reduction in inappropriate lipid‐lowering treatment compared with the comparison group. | |
| Risk of bias | ||
| Bias | Authors' judgement | Support for judgement |
| Random sequence generation (selection bias) | Unclear risk | Method of random sequence generation not reported by authors "Randomization was stratified by practice type and size and blocked" |
| Allocation concealment (selection bias) | Unclear risk | Method of allocation concealment not reported by authors |
| Blinding of participants and personnel (performance bias) | High risk | "The intervention was not blinded." |
| Blinding of outcome assessment (detection bias) | Low risk | "Abstractors were not informed regarding the practice's intervention arm." |
| Incomplete outcome data (attrition bias) | High risk | 2 practices withdrew after randomisation and data were not collected |
| Selective reporting (reporting bias) | Low risk | All outcomes reported in clinical trial registration were reported |
| Other bias | Unclear risk | 46% of practices stopped using the clinical decision support tool |
| Study characteristics | ||
| Methods | Cluster‐randomised trial with internal and external comparators | |
| Participants | Men and women from 14 towns in the UK with 2 matched‐practices within each town. Unit of randomisation: general medical practice Inclusion criteria: all men aged 40‐59 years and their partners regardless of age Exclusion criteria: not specified The trial consisted of 2 comparison groups, an internal comparison and an external comparison. Regions were first randomised to the study or usual care (defined as the external comparison group). Within the study region, general medical practices were then randomised to the nurse‐led screening and the CVD risk score intervention or usual care (defined as the internal comparison). Total randomised: 28 practices (n = 14 intervention, n = 14 comparison). Authors did not specify how many practices were in the internal comparison group and how many were in the external comparison group Total participants (n = 12,924): intervention, 2011 men and 1425 women; internal comparison, 2174 men and 1402 women; external comparison, 3519 men and 2393 women Mean (SD) age: 51.5 (5.7) years for men and 49.1 (6.8) years for women; 42% women; 5.1% of men and 1.6% of women reported prior coronary heart disease; 1.8% of men and 0.5% of women reported diabetes mellitus | |
| Interventions | Intervention group: nurse‐led cardiovascular risk screening and lifestyle intervention:
Comparison group: usual care without nurse‐screening, lifestyle counselling, or communication of Dundee risk score (Note: for analyses, we used comparisons between the intervention group and the internal control group as this was the authors' primary outcome) | |
| Outcomes | Primary outcome: change in Dundee risk score Secondary outcome: distribution and means of cardiovascular risk factors (systolic blood pressure, diastolic blood pressure, total cholesterol, smoking prevalence); proportion of participants with risk factor levels above prespecified cut‐points Number analysed in follow‐up: 26 practices (13 intervention, 13 comparison) Participants analysed at 1‐year follow‐up: total, n = 12,472; intervention, 1767 men and 1217 women; internal comparison, 2174 men and 1402 women; external comparison, 3519 men and 2393 women Follow‐up: 1 year | |
| Study funding sources | Public and private sources. "The study was funded by the Family Heart Association with an educational grant from Merck Sharp and Dohme, the family health service authorities and Fife Health Board, Boehringer Mannheim UK, Wessex Regional Health Authority, the Health Education Authority, the Scottish Home and Health Department, and the Department of Health." | |
| Notes | Endpoints analysed using random effects models to account for clustering Data reported separately for men and women by the authors but combined for meta‐analyses in this review Protocol deviation identified by 1 nurse in an intervention practice. An executive committee decided (without sight of data) to discard all data from this intervention practice and therefore to disregard all data from the comparison practice. Authors did not perform a formal cost‐effectiveness analysis but the overall predicted risk reduction of 12% from the intervention was not felt to be cost‐effective. | |
| Risk of bias | ||
| Bias | Authors' judgement | Support for judgement |
| Random sequence generation (selection bias) | Unclear risk | "All men aged 40‐59 years in each intervention and comparison practice were randomly ordered at the same time within five year age groups. . . [and] randomly divided into two groups: intervention and an internal comparison group" |
| Allocation concealment (selection bias) | High risk | "[W]ithin each age group their households were approached in order" Participants were also recruited after individual practices were randomised. |
| Blinding of participants and personnel (performance bias) | High risk | Participants and personnel unblinded |
| Blinding of outcome assessment (detection bias) | Unclear risk | Method of outcome assessment not reported |
| Incomplete outcome data (attrition bias) | High risk | 14% lost to follow‐up in intervention group; those who did not return were more likely to be smokers and have higher risk factor levels |
| Selective reporting (reporting bias) | Low risk | All outcomes from protocol reported |
| Other bias | High risk | Protocol deviations by 1 nurse in intervention group. Executive committee decided to discard data from the entire practice and the comparator practice. No baseline measurements in comparison groups |
| Study characteristics | ||
| Methods | Cluster‐randomised trial, parallel group (1:1) | |
| Participants | Physicians in the Swiss HIV Cohort Study (SHCS) in Switzerland caring for HIV‐infected participants Unit of randomisation: physician Inclusion criteria: all physicians who were part of the SCHS were eligible. Eligible patients were those registered with the SHCS, not pregnant, aged ≥ 18 years, continuous ART for 90 days prior to baseline and with complete data on CHD risk factors at baseline Exclusion criteria: no additional criteria from above 165 physicians randomised at baseline (n = 80 intervention, n = 85 comparison) 117 physicians included (n = 57 intervention, n = 60 comparison) ‐ 45 physicians were excluded because they did not have any participants with risk factor assessment and 3 physicians did not have any eligible participants 4097 participants eligible at baseline (n = 2097 intervention, n = 2000 comparison) Mean age (IQR): 44 (39‐51) , 30% women, 5% diabetes mellitus, 26% with Framingham risk score (FRS) ≥ 10% | |
| Interventions | Intervention group: risk profile generated by the data centre for each participant randomised to the intervention group; profile consisted of 10‐year CHD risk as calculated by FRS. Study nurses added the FRS risk profile to the patient chart. Each risk profile also included individualised targets for LDL cholesterol, systolic/diastolic blood pressure. Comparison group: booklet of evidence‐based guidelines for management of CHD risk factors. Guidelines also gave directions on how to approach and motivate lifestyle modifications and how to calculate CHD risk from a website | |
| Outcomes | Primary outcome: total cholesterol Secondary outcomes: systolic and diastolic blood pressure, Framingham risk score Follow‐up: 12‐18 months 3362 participants analysed at follow‐up (n = 1680 intervention, n = 1682 comparison) | |
| Study funding sources | Public and private sources. "This trial was funded by a grant from the Swiss National Science Foundation for nested cohort projects. . . and an unrestricted educational grant from Bristol‐Myers Squibb, Baar, Switzerland." | |
| Notes | Primary and secondary outcomes analysed using generalised estimating equations to account for clustering Analyses reporting the effect of the intervention on medication prescribing and CVD events (not mentioned in methods, or in trial registration) | |
| Risk of bias | ||
| Bias | Authors' judgement | Support for judgement |
| Random sequence generation (selection bias) | Low risk | "Randomized groups were assigned according to a computerized list for each strata generated by a biostatistician not otherwise involved in the trial." |
| Allocation concealment (selection bias) | Low risk | See above |
| Blinding of participants and personnel (performance bias) | High risk | "This was an open intervention trial, that is, physicians knew whether they received the intervention or not but were not told what outcomes would be measured." |
| Blinding of outcome assessment (detection bias) | Unclear risk | Method used for outcome assessment not provided |
| Incomplete outcome data (attrition bias) | Low risk | 80% of participants had a final assessment with data recorded for the primary outcome; ITT analysis performed |
| Selective reporting (reporting bias) | High risk | Trial prospectively registered (NCT00264394). Primary and secondary outcomes reported but medication prescribing outcome not prespecified |
| Other bias | Unclear risk | Analyses for primary and secondary outcomes accounted for clustering but unclear if medication prescribing outcome accounted for clustering |
| Study characteristics | ||
| Methods | Randomised controlled, parallel group (1:1:1) trial | |
| Participants | 1507 middle‐aged (30‐49 years) participants registered in general practice clinics in the district of Ebeltoft, Denmark Inclusion criteria: aged 30‐49 years (by 1 January 1991); registered with a local general practitioner (GP) in Ebeltoft, Denmark Exclusion criteria: none reported Baseline characteristics not provided, 11% were high CVD risk | |
| Interventions | Participants were randomised into a control group and 2 intervention groups Intervention group 1: health screening + written feedback from GP + optional discussions with GP (n = 502) Intervention group 2: health screening + written feedback from GP + scheduled 45‐min discussion with GP annually (n = 504) Control group: usual care (n = 501) Among those randomised to intervention group 1, 89% (449/502) received a health screening. Among those randomised to intervention group 2, 90% (456/504) received health screening and 88% (443/504) received GP visit. In total, 90% of those in the 2 intervention groups received a cardiovascular risk score. Health screening was performed by laboratory assistants and consisted of cardiovascular risk calculation and categorisation into low, moderate, elevated, or high. Intervention groups were combined for analyses by the authors because there were no differences between the 2 groups. Results were compared to usual care participants who did not receive a CVD risk score | |
| Outcomes | Psychological distress, measured by GHQ‐12 – measured anxiety/insomnia, depression, social impairment/hypochondria, and social dysfunction Measured at baseline, 1 year, and 5 years Authors report 84.1% follow‐up at 1 year and 79.2% follow‐up at 5 years but few other details on the number of participants analysed in follow‐up | |
| Study funding sources | Study funded by a combination of Danish public organisations and private industry (i.e. Novo Nordisk, Bayer Denmark, Roche) | |
| Notes | Few trial details provided. No details on baseline characteristics. Psychological distress measured 1 and 5 years after participants received their CVD risk score | |
| Risk of bias | ||
| Bias | Authors' judgement | Support for judgement |
| Random sequence generation (selection bias) | Unclear risk | Method of random sequence generation not reported |
| Allocation concealment (selection bias) | Unclear risk | Method of allocation concealment not reported |
| Blinding of participants and personnel (performance bias) | High risk | Participants and personnel not blinded |
| Blinding of outcome assessment (detection bias) | Unclear risk | Method of outcome assessment not reported |
| Incomplete outcome data (attrition bias) | High risk | 20% missing data for GHQ‐12 at 1 year; 25% missing data for GHQ‐12 at 5 year; ITT analysis reported but not performed |
| Selective reporting (reporting bias) | Unclear risk | Protocol document not available |
| Other bias | High risk | Unlikely that measurement of psychological distress at 1 and 5 years after a CVD risk score intervention is meaningful |
| Study characteristics | ||
| Methods | Cluster‐randomised trial, parallel group (1:1) | |
| Participants | People with hypercholesterolemia recruited from primary care health practices in Catalonia region, Spain Unit of randomisation: primary care health practices Inclusion criteria: total cholesterol level > 200 mg/dL Exclusion criteria: triglycerides > 400 mg/dL or participating in another study within the medical centre 44 primary care health practices randomised (n = 22 intervention, n = 22 comparison). 2 practices withdrew before participants recruited 2191 participants recruited after selection criteria (n = 1046 intervention, n = 1145 comparison) Mean age: 60 years, 57% women, 16% with diabetes mellitus, and 12% with CHD; ~ 50% of participants were previously treated with lipid‐lowering drugs | |
| Interventions | Intervention group:
Control group: usual care with health promotion pamphlets but no calculation of CHD risk | |
| Outcomes | ITT analysis performed on the 2191 participants recruited (described above). Per‐protocol analyses also presented in the manuscript Primary outcomes: proportion of participants meeting LDL goals (for CHD, 10‐year CHD risk ≥ 20%, and 10‐year CHD risk < 20%); total direct costs Secondary outcomes: final lipid profile; healthcare resource consumption incurred during the study Mean follow‐up: 12 months | |
| Study funding sources | "Study supported by the Department of Outcomes Research & Disease Management, Novartis Farmaceutica SA, Spain" | |
| Notes | Endpoints analysed using generalised estimating equations to account for clustering Only 71% of physicians in the intervention group used the decision support tool | |
| Risk of bias | ||
| Bias | Authors' judgement | Support for judgement |
| Random sequence generation (selection bias) | Low risk | "The randomization table was prepared by the statistician, using blocks of four practices." |
| Allocation concealment (selection bias) | High risk | Randomisation performed using blocks of 4 practices |
| Blinding of participants and personnel (performance bias) | High risk | No blinding of personnel or participants |
| Blinding of outcome assessment (detection bias) | Unclear risk | Method for outcome assessment not reported |
| Incomplete outcome data (attrition bias) | Unclear risk | > 20% missing lipid levels in follow‐up; ITT analysis used but no imputation of missing values |
| Selective reporting (reporting bias) | Unclear risk | Protocol not available |
| Other bias | High risk | Study supported by Novartis and 1 author had industry ties. Approximately 71% of physicians in the intervention group did not use the decision support tool |
| Study characteristics | ||
| Methods | Randomised controlled trial, 2 × 2 factorial | |
| Participants | Participants with type 2 diabetes mellitus aged < 65 years managed in primary care setting Inclusion criteria: no additional criteria reported Exclusion criteria: people with myocardial infarction (MI) in preceding year, stroke, heart failure, angina, or terminal illness 344 participants randomised at baseline (n = 225 intervention, n = 119 for usual care group) Mean (SD) age: 61.7 (8.5), 44% women, > 90% white, 100% diabetes mellitus; high‐rate of baseline treatment (76% treated with statin) | |
| Interventions | Intervention group: decision aid for people with diabetes mellitus that provided individually‐tailored risk information and treatment options for multiple cardiovascular risk factors; the decision‐aid was offered to participants before a regular diabetes mellitus check‐up and to healthcare provider during the consultation Comparison group: usual care For this systematic review, groups randomised to the decision aid, which provided a CVD risk score, were compared to those in the usual care group (who did not receive a decision aid) | |
| Outcomes | Primary outcome: diabetes empowerment scale Secondary outcome: changes in drug prescription in those with high HbA1c, systolic blood pressure, or LDL; self‐efficacy; satisfaction; negative emotions; and general health status (EQ‐5D); smoking status 306 participants analysed for the study's primary outcome (n = 199 intervention, n = 107 comparison). Not explicitly stated how many were analysed for secondary outcomes obtained from the electronic health record Follow‐up: 6 months before and after intervention | |
| Study funding sources | Funded by Netherlands Organization for Health Research and Development | |
| Notes | 4 different formats of the decision aid were tested in exploratory analyses but outcomes for participants allocated to any decision aid were combined by the study authors in this manuscript and was similarly done for this systematic review | |
| Risk of bias | ||
| Bias | Authors' judgement | Support for judgement |
| Random sequence generation (selection bias) | Low risk | "A stratified computer generated allocation sequence was used." |
| Allocation concealment (selection bias) | Low risk | "We used a predefined computer algorithm with a blockwise scheme to conceal the allocation process from the healthcare provider." |
| Blinding of participants and personnel (performance bias) | High risk | Participants and personnel not blinded |
| Blinding of outcome assessment (detection bias) | Unclear risk | High‐risk for patient‐reported outcomes Low‐risk for clinical outcomes (automatic data extraction from database) |
| Incomplete outcome data (attrition bias) | Unclear risk | 31 participants excluded (22 intervention vs 9 control); excluded from analysis |
| Selective reporting (reporting bias) | Low risk | All outcomes from protocol reported |
| Other bias | High risk | Randomisation occurred within a practice, increasing the risk for contamination. Decision aid was accessed for 88% (198/225) of intervention participants but only 46% (103/225) of intervention participants received all basic elements of the intervention |
| Study characteristics | ||
| Methods | Cluster‐randomised trial, parallel group (1:1) | |
| Participants | Patients from 30 primary care practices in southeastern New England, USA Inclusion criteria: no additional criteria reported Exclusion criteria: no additional criteria reported in text but PRISMA flow diagram in the paper notes that participants were excluded if they were pregnant, died, or left the practice during the 1 year follow‐up 30 practices randomised (n = 15 intervention, n = 15 comparison) 4105 participants after exclusion criteria (n = 2100 intervention, n = 2000 comparison) Mean (SD) age: 54.0 years (1.1) in intervention group and 52.3 (1.1) in control group; 29% women; 96% white; 20% CHD; 10% diabetes mellitus | |
| Interventions | Both groups received a 1‐h academic detailing session where ATP‐III guidelines were discussed and pocket guidelines were given Intervention group:
Comparison group: personal digital assistant without decision support | |
| Outcomes | Primary outcome: proportion of participants screened and treated per 2001 guidelines Follow‐up: 1 year 30 practices analysed (n = 15 intervention, n = 15 comparison) 4105 participants analysed (n = 2100 intervention, n = 2000 comparison) | |
| Study funding sources | Not reported | |
| Notes | Endpoints analysed using generalised linear mixed models to account for clustering. Only 39% had a Heart Age calculated by clinicians. In post hoc analyses, physicians with above‐median use of the decision support tool were more likely to have their participants meet LDL goals (OR 1.23, 95% CI 1.04 to 1.06) | |
| Risk of bias | ||
| Bias | Authors' judgement | Support for judgement |
| Random sequence generation (selection bias) | Unclear risk | Method of random sequence generation not reported |
| Allocation concealment (selection bias) | Unclear risk | Method of allocation concealment not reported |
| Blinding of participants and personnel (performance bias) | High risk | Participants and personnel not blinded |
| Blinding of outcome assessment (detection bias) | Low risk | Chart outcome abstractors blinded to physician and practice |
| Incomplete outcome data (attrition bias) | Low risk | No practices lost to follow‐up and ITT analysis performed for primary outcome |
| Selective reporting (reporting bias) | Unclear risk | Protocol document unavailable |
| Other bias | High risk | Low uptake of both patient activation tool among patients and decision support tool among physicians |
| Study characteristics | ||
| Methods | Randomised controlled trial, parallel group (1:1) | |
| Participants | Adults ≥ 45 years without prevalent CVD Inclusion criteria: ≥ 1 cardiovascular risk factors (diabetes mellitus, HTN, dyslipidaemia, smoking, or elevated BMI) Exclusion criteria: history of MI, stroke, heart failure, terminal illness, pregnant women 154 adults enrolled and randomised (n = 77 intervention, n = 77 comparison) Mean (SD) age: 52.2 years (5.2) in intervention group, 53.4 years (4.8) in control group; 81% women, 76% white, 20% African American, 16% diabetes mellitus | |
| Interventions | Intervention group:
Comparison group: usual care, mailed health assessment (blood test values but CVD risk score not provided) | |
| Outcomes | Primary outcome: Framingham risk score Secondary outcome: BMI, waist circumference, blood pressure, fasting lipid profile, smoking status, exercise frequency, readiness to increase exercise Follow‐up: baseline, 5 months, and 10 months | |
| Study funding sources | Center for Medicare and Medicaid Services, Veterans Affairs Health Services Research & Development career development award | |
| Notes | Resource intensive intervention from health coaches with multiple follow‐up meetings | |
| Risk of bias | ||
| Bias | Authors' judgement | Support for judgement |
| Random sequence generation (selection bias) | Unclear risk | Method of random sequence generation not reported |
| Allocation concealment (selection bias) | Unclear risk | Method of allocation concealment not reported |
| Blinding of participants and personnel (performance bias) | High risk | Participants and personnel not blinded |
| Blinding of outcome assessment (detection bias) | Low risk | "A research assistant blinded to treatment arm assignment measured the data required to calculate FRS at baseline, 5 months, and 10 months." |
| Incomplete outcome data (attrition bias) | High risk | > 20% loss to follow‐up |
| Selective reporting (reporting bias) | Unclear risk | Protocol document not available for review |
| Other bias | Low risk | Other sources of bias not identified |
| Study characteristics | ||
| Methods | Randomised controlled trial, parallel group (1:1:1) | |
| Participants | Men and women aged 30‐49 years from primary care clinics in Ebeltoft, Denmark Inclusion criteria: additional criteria not reported Exclusion criteria: none reported 1507 participants randomised (n = 504 health screening + physician discussion, n = 502 health screening only, n = 501 comparison/usual care) Mean age: 40.5 years, 51% women, 100% Danish | |
| Interventions | Intervention groups: 2 health screenings or 2 health screenings + 45 min follow‐up consultation with general practitioner to discuss health‐related lifestyle goals Comparison group: usual care For the analyses in this review, the "health screening + physician discussion" and "health screening only" groups were combined since both groups received a personalised CVD risk score | |
| Outcomes | Primary outcome not specified; Danish CVD risk score, BMI, cholesterol level, systolic blood pressure, and diastolic blood pressure reported 1093 participants analysed at 5 years (n = 346 health screening + physician discussion, n = 378 health screening only, n = 369 usual care) Follow‐up: 1 year and 5 years | |
| Study funding sources | Funded by County Health Insurance office and other private/public sponsors, including Novo Nordisk, ASTRA‐Denmark, Bayer, and Roche | |
| Notes | — | |
| Risk of bias | ||
| Bias | Authors' judgement | Support for judgement |
| Random sequence generation (selection bias) | Unclear risk | Method of random sequence generation not reported |
| Allocation concealment (selection bias) | Low risk | "An employee of Aarhus County who was not otherwise involved in the study carried out the randomization." |
| Blinding of participants and personnel (performance bias) | High risk | "Participants were informed by their general practitioner about which intervention they would be offered." |
| Blinding of outcome assessment (detection bias) | Unclear risk | Unclear risk of bias for cardiovascular risk factors. High‐risk of bias for patient‐reported outcomes |
| Incomplete outcome data (attrition bias) | High risk | 25‐30% loss to follow‐up in all 3 treatment groups by 5 years. No imputation of missing values |
| Selective reporting (reporting bias) | Unclear risk | Primary and secondary outcomes unclear in protocol document |
| Other bias | Unclear risk | Partial funding from pharmaceutical industry. Authors speculate on potential risk of contamination between participants in different treatment groups but attempted to mitigate this risk by allocating cohabitating couples into the same intervention group |
| Study characteristics | ||
| Methods | Randomised controlled trial, parallel group (1:1) | |
| Participants | Patients in primary care clinics across 10 provinces in Canada Inclusion criteria:
Exclusion criteria: hypersensitivity to statins, risk of pregnancy, breastfeeding, active liver disease or liver enzyme abnormalities, elevated creatine kinase, elevated triglycerides (> 939 mg/dL), history of pancreatitis, significant renal insufficiency 3053 participants enrolled and randomised (n = 1510 intervention, n = 1543 comparison) Mean age: 56 years, 32% women, 50% diabetes mellitus, 23% CVD | |
| Interventions | Intervention group: physicians and participants provided with coronary risk profile consisting of a 8‐year CHD risk estimate, cardiovascular age, and age gap; repeat profile provided at 3 months to demonstrate response to therapy and amount of risk reduction Comparison group: usual care | |
| Outcomes | Primary outcomes: change in LDL‐C level, change in TC/HDL ratio, percentage of participants reaching national lipid targets Secondary outcomes: change in nonlipid risk factors, global 10‐year risk 3053 participants analysed for efficacy outcomes (n = 1510 intervention, n = 1543 comparison) Follow‐up: 1 year | |
| Study funding sources | Funded by Pfizer Canada and multiple investigators with pharmaceutical industry ties | |
| Notes | Protocol violation noted for 121 participants (n = 56 intervention, n = 65 comparison) | |
| Risk of bias | ||
| Bias | Authors' judgement | Support for judgement |
| Random sequence generation (selection bias) | Unclear risk | Method of random sequence generation not reported |
| Allocation concealment (selection bias) | Low risk | "Randomization was completed at a central coordinating centre" |
| Blinding of participants and personnel (performance bias) | High risk | Participants and personnel not blinded |
| Blinding of outcome assessment (detection bias) | Unclear risk | Method for outcome assessment not reported |
| Incomplete outcome data (attrition bias) | Low risk | 12% loss to follow‐up which was similar in the 2 groups; ITT analysis performed |
| Selective reporting (reporting bias) | Unclear risk | Protocol document not available for review |
| Other bias | High risk | Pharmaceutical funding Potential for contamination bias since randomisation occurred within physician practice (investigators attempted to evaluate for this with sensitivity analyses) Protocol violation noted for 4% of participants (n = 121) |
| Study characteristics | ||
| Methods | Quasi‐randomised controlled trial, parallel group (1:1) | |
| Participants | Participants aged 35‐75 years, with type 2 diabetes mellitus and no history of CVD or renal disease attending a specialised diabetes mellitus clinic in the UK Inclusion criteria: not reported Exclusion criteria: not reported 323 participants recruited (n = 162 intervention, n = 161 comparison) Mean age of participants not reported; 48% women; 100% diabetes mellitus | |
| Interventions | The New Zealand cardiovascular risk score was calculated for all participants Intervention group: CVD risk score was documented on the front of the participant's chart before visit Comparison group: no risk score documentation | |
| Outcomes | Primary outcome: not specified Outcomes reported: changes in diabetes mellitus treatment, changes in antihypertensive treatment, referral to dietician, risk score mentioned in letter to GP Follow‐up: none | |
| Study funding sources | Funding source not reported by authors | |
| Notes | — | |
| Risk of bias | ||
| Bias | Authors' judgement | Support for judgement |
| Random sequence generation (selection bias) | High risk | "We allocated patients alternately to experimental and control groups." |
| Allocation concealment (selection bias) | High risk | See above |
| Blinding of participants and personnel (performance bias) | High risk | Not blinded |
| Blinding of outcome assessment (detection bias) | Unclear risk | Method for outcome assessment not reported |
| Incomplete outcome data (attrition bias) | Low risk | All participants included in study were analysed |
| Selective reporting (reporting bias) | Unclear risk | No protocol available for review |
| Other bias | High risk | Small study bias |
| Study characteristics | ||
| Methods | Randomised controlled trial, parallel group (1:1:1:1:1) | |
| Participants | 1371 employees from 2 Glasgow factories randomised to 5 groups (n = 293 group 1, n = 297 group 2, n = 285 group 3, n = 263 group 4, n = 233 group 5) Inclusion criteria: additional criteria not reported Exclusion criteria: night‐shift workers and workers participating in another cholesterol treatment study 58% of sample were 40‐59 years of age, 9% women | |
| Interventions | 4 intervention groups:
1 comparison group (internal control): group 5 no health intervention This review reports results for the comparison of group 4 and group 5 | |
| Outcomes | Outcomes reported: change in Dundee score; plasma cholesterol concentration; diastolic blood pressure, BMI; self‐reported behaviours 1157 employees analysed at 5 months (n = 247 group 1, n = 250 group 2, n = 241 group 3, n = 219 group 4, n = 200 group 5) 1107 employees analysed at 12 months (n = 240 group 1, n = 237 group 2, n = 226 group 3, n = 211 group 4, n = 193 group 5) Follow‐up: baseline, 5 months, and 12 months | |
| Study funding sources | Scottish Chief Scientist Office | |
| Notes | Authors also compared the effects of the intervention to an external control site that was not randomised. These comparisons were reported in the manuscript but are not presented in this review. Outcomes for changes in risk factors and health behaviours only reported at 5 months | |
| Risk of bias | ||
| Bias | Authors' judgement | Support for judgement |
| Random sequence generation (selection bias) | Low risk | "[S]ubjects were allocated, by means of computer generated randomisation, to one of five groups." |
| Allocation concealment (selection bias) | Unclear risk | Method of allocation concealment not reported |
| Blinding of participants and personnel (performance bias) | High risk | Participants and personnel not blinded |
| Blinding of outcome assessment (detection bias) | Unclear risk | Method of outcome assessment not reported |
| Incomplete outcome data (attrition bias) | Low risk | ITT analysis performed |
| Selective reporting (reporting bias) | High risk | Protocol not available and no trial registration. 12 month outcomes not reported |
| Other bias | High risk | Potential for contamination bias. "We recognised that subjects in group 5 (internal control) were open to influences from colleagues because the messages given to other participants were being freely discussed in the workplace." |
| Study characteristics | ||
| Methods | Randomised controlled trial, parallel group (1:1) | |
| Participants | 1526 hypertensive participants (aged 18‐75 years) with uncontrolled treated hypertension (systolic blood pressure > 140 mmHg or diastolic blood pressure > 90 mmHg). Number randomised per group not reported Inclusion criteria: same criteria as above | |
| Interventions | All groups were treated with a therapeutic strategy that consisted of fosinopril 20 mg/day for 8 weeks with the possible increase to fosinopril + hydrochlorothiazide at 4 weeks. Participants randomised to the intervention group had their 10‐year Framingham risk information provided to their treating physician. | |
| Outcomes | Primary and secondary outcomes not specified. Outcomes reported include: agreement between calculated risk and estimated risk by general practitioner, blood pressure at week 8 1273 participants analysed but number per group not reported | |
| Study funding sources | Not reported. 1 author affiliated with a pharmaceutical company | |
| Notes | Study published in French | |
| Risk of bias | ||
| Bias | Authors' judgement | Support for judgement |
| Random sequence generation (selection bias) | Unclear risk | Randomisation stated but method for random sequence generation not reported |
| Allocation concealment (selection bias) | Unclear risk | Method of allocation concealment not reported |
| Blinding of participants and personnel (performance bias) | High risk | Participants not blinded |
| Blinding of outcome assessment (detection bias) | Unclear risk | Blinding of outcome assessment not reported |
| Incomplete outcome data (attrition bias) | High risk | 1527 randomised but only 1273 analysed; no reasons provided for loss to follow‐up; no imputation |
| Selective reporting (reporting bias) | High risk | Outcomes not prespecified and study not registered |
| Other bias | Unclear risk | Few study details provided in text |
| Study characteristics | ||
| Methods | Cluster‐randomised controlled trial, parallel group (1:1) | |
| Participants | People with hypertension from 29 primary care health centres in Sor and Nord‐Trondelag counties in Norway Unit of randomisation: health centre Number recruited: 29 health centres and 2239 participants total (n = 17 health centres with 984 participants in the intervention group; n = 12 health centres with 1255 participants in the comparison group) Mean age: 64 years, 58% women, 100% Norwegian | |
| Interventions | Intervention group:
Comparison group: usual care | |
| Outcomes | Outcomes measured: last registered cholesterol, blood pressure, weight (or BMI), number of cigarettes Risk score calculated only if enough information available during the search period Number analysed at 18 month follow‐up: n = 887 intervention, n = 1127 comparison Number analysed after 3 month extension (21 month follow‐up): n = 879 intervention, n = 1119 comparison Follow‐up: 18 months initially, trial extended 3 months due to missing data | |
| Study funding sources | Norwegian Medical Association with contribution from the foundation promoting general practice in Sor‐Trondelag | |
| Notes | Issues with intervention fidelity: "After 18 months the CDSS had been used, partly or totally, in the treatment of 104 patient in the intervention group." Trial extended by 3 months because of inadequate collection of data at 18 months | |
| Risk of bias | ||
| Bias | Authors' judgement | Support for judgement |
| Random sequence generation (selection bias) | Unclear risk | Method of random sequence generation not reported |
| Allocation concealment (selection bias) | Unclear risk | Method of allocation concealment not reported |
| Blinding of participants and personnel (performance bias) | High risk | Personnel not blinded, and not clear that participants were blinded |
| Blinding of outcome assessment (detection bias) | High risk | Outcomes abstracted by primary investigator who was not blinded |
| Incomplete outcome data (attrition bias) | High risk | > 90% of participants in both groups were missing data to calculate 10‐year CHD risk at 18 months. The trial was extended by 3 months which decreased this amount to ~ 50% |
| Selective reporting (reporting bias) | Unclear risk | No protocol available for review |
| Other bias | High risk | Trial extended by 3 months due to missing data. Clinicians provided lists of missing participant information and were asked to resolve this. Poor intervention fidelity (CDSS was used partially or totally in the treatment of only 104 participants in the intervention group) |
| Study characteristics | ||
| Methods | Randomised controlled trial, parallel group (1:1) | |
| Participants | People aged 50 years and older from primary care practices in West Midlands, UK running the EMIS (Egton Medical Information Systems) LV software Total number randomised: 38,417 (n = 18,912 intervention, n = 19,235 comparison) | |
| Interventions | Intervention group: receives electronic alert messages identifying participants at high‐risk for CVD, those whose risk factor data is incomplete, and those who may have undiagnosed diabetes mellitus. Health record searched and updated every 24 h. Treatment recommendations not provided. Alerts can be ignored by clinicians Comparison group: usual care. Computer software acquires data from the electronic health record but does not generate an electronic alert for the clinician | |
| Outcomes | Primary outcome: difference in annual incidence rate of CVD events (composite of CHD, stroke/TIA, myocardial infarction, sudden cardiac death) Secondary outcomes include differences in the proportion of: high‐risk participants identified, participants with missing data, participants with undefined diabetes mellitus status Number analysed at follow‐up: 36,092 (n = 18,021 intervention, n = 18,071 comparison) Follow‐up: 2 years | |
| Study funding sources | Department of Health PhD Studentship from Warwick Medical School | |
| Notes | User was not obliged to respond to the alert "Recruitment into the study had to be closed before the required number of patients over 50 years could be achieved, due to resource constraints." | |
| Risk of bias | ||
| Bias | Authors' judgement | Support for judgement |
| Random sequence generation (selection bias) | High risk | "The e‐Nudge software automatically randomised registered patients within each practice to intervention and control arms, depending on whether the last digit of the 10‐digit NHS number was odd or even." |
| Allocation concealment (selection bias) | High risk | See above |
| Blinding of participants and personnel (performance bias) | High risk | Physicians were kept unaware of odd/even rule for allocation but an alert would appear each time a patient record was opened Personnel not blinded; unclear if participants were blind |
| Blinding of outcome assessment (detection bias) | Low risk | Outcomes assessed by electronic abstraction from medical record |
| Incomplete outcome data (attrition bias) | Low risk | 1 practice withdrew from study at 6 months but overall < 10% missing data |
| Selective reporting (reporting bias) | Low risk | Authors clearly report changes to the protocol and outcomes reported match the protocol and trial registration |
| Other bias | High risk | Risk of contamination bias because randomisation was at the individual level, and the same physician may have taken care of participants randomised to intervention and control groups Senior author is the medical director of the software company that provided the e‐Nudge software. Underpowered for primary outcome |
| Study characteristics | ||
| Methods | Randomised controlled trial, parallel group (1:1) | |
| Participants | People with LDL‐C > 100 mg/dL, no history of CHD or vascular disease, and not currently receiving lipid‐lowering therapy Inclusion criteria: additional criteria not reported Exclusion criteria: people older than 74 years, LDL‐C < 100 mg/dL, charts missing risk factor information used to calculate 10‐year CHD risk Total number of participants randomised: 368 (n = 186 intervention, n = 182 comparison) Mean (SD) age: 58 (9), 72% women, 92% African American, 6% white, 23% diabetes mellitus | |
| Interventions | Intervention group: charts appended to include 10‐year absolute CHD risk, ATP‐II risk category, and potential treatment options Comparison group: charts appended with ATP‐II LDL‐C targets and consensus targets for blood pressure, BMI, and haemoglobin A1c. No risk information included Both groups received a 1‐h academic detailing session to review the importance of risk assessment in cholesterol management | |
| Outcomes | Primary outcome: proportion of high‐risk participants who were recommended a statin Secondary outcomes: proportion of moderate‐risk participants who were recommended a statin; proportion of entire cohort receiving lifestyle counselling, intensified blood pressure management, or documentation of risk in chart Total number of participants analysed: 351 (n = 182 intervention, n = 169 comparison) | |
| Study funding sources | Emory University Medical Care Foundation | |
| Notes | Authors report possible protocol violations and randomisation errors | |
| Risk of bias | ||
| Bias | Authors' judgement | Support for judgement |
| Random sequence generation (selection bias) | High risk | Method of random sequence generation not reported. "Randomization errors" reported by authors |
| Allocation concealment (selection bias) | Unclear risk | Method of allocation concealment not reported |
| Blinding of participants and personnel (performance bias) | High risk | No blinding of personnel; unclear if participants were blinded |
| Blinding of outcome assessment (detection bias) | Unclear risk | Method of outcome assessment not reported |
| Incomplete outcome data (attrition bias) | High risk | Differential loss to follow‐up (greater in control group); ITT analysis not performed |
| Selective reporting (reporting bias) | Unclear risk | No protocol available for review |
| Other bias | High risk | Risk of contamination bias as same physician may have taken care of participants randomised to intervention and control groups |
| Study characteristics | ||
| Methods | Randomised controlled trial, parallel group (1:1) | |
| Participants | Danish residents aged 30‐60 years from 11 municipalities in suburban Copenhagen, Denmark 61,301 people originally randomised within the study but 59,993 people met the inclusion criteria at baseline for this analysis Total randomised: 59,993 (n = 11,708 intervention, n = 48,285 comparison) Mean age: not reported, 50% women, 88% Danish | |
| Interventions | Intervention group: invited for screening, risk assessment, and lifestyle counselling up to 4 times over a 5‐year period; high‐risk individuals were offered additional lifestyle counselling on smoking cessation, diet, and physical activity Comparison group: not invited for screening; formal risk assessment not provided | |
| Outcomes | Primary outcome: incident ischaemic heart disease Secondary outcome: incident stroke, incident combined ischaemic heart disease and stroke, mortality, and attendance rates Total analysed in follow‐up: 59,616 (n = 11,629 intervention, n = 47,987 comparison) Follow‐up: 10 years | |
| Study funding sources | Public, private, and industry sources: Danish Research Councils, Health Foundation, Danish Centre for Evaluation and Health Technology Assessment, Copenhagen County, Danish Heart Foundation, Ministry of Health and Prevention, Association of Danish Pharmacies, Augustinus Foundation, Novo Nordisk, Velux Foundation, Becket Foundation, and Ib Henriksens Foundation | |
| Notes | Trial powered for 70% participation rate in the intervention group but only 52% of people in the intervention group accepted the invitation and were examined at baseline Data for risk factor levels not available given the pragmatic study design | |
| Risk of bias | ||
| Bias | Authors' judgement | Support for judgement |
| Random sequence generation (selection bias) | Low risk | "The 61 301 people were randomised by computer generated random numbers with different randomisation ratios in the different age and sex groups …" *Note for this analysis, 59,313 people met the baseline inclusion criteria. |
| Allocation concealment (selection bias) | Unclear risk | Method of allocation concealment not reported |
| Blinding of participants and personnel (performance bias) | High risk | Personnel and participants not blinded to intervention but "neither the control group nor their doctor knew that they formed a control group." |
| Blinding of outcome assessment (detection bias) | Low risk | "Use of data from central registers further blinded the assessment of endpoints in relation to randomisation group." |
| Incomplete outcome data (attrition bias) | Low risk | < 1% loss to follow‐up of event data |
| Selective reporting (reporting bias) | High risk | Cardiovascular outcomes were not prespecified in the original trial protocol |
| Other bias | High risk | Potential for contamination bias because randomisation was at the participant level |
| Study characteristics | ||
| Methods | Cluster‐randomised controlled trial, parallel group (1:1) | |
| Participants | Adults from 25 practices with blood pressure ≥ 140 mmHg or already being treated for high blood pressure, total cholesterol ≥ 6.5 mmol/L or already being treated for high cholesterol, smoking (men ≥ 50 years, women ≥ 55 years), diabetes mellitus, family history of CVD and visible obesity. Unit of randomisation: primary care practice Exclusion criteria: existing CVD, familial hypercholesterolaemia Total randomised: 25 practices with 615 participants (13 practices with 322 participants in the intervention group, 12 practices with 293 participants in the comparison group) Mean age: 57 years, 55% women, 14% diabetes mellitus | |
| Interventions | Intervention group: received individual 10‐year CVD risk assessment, risk communication via decision aid, motivational interviewing by nurses regarding lifestyle modifications Comparison group: usual care consistent with Dutch guidelines | |
| Outcomes | Primary outcome: questionnaires to assess fruits and vegetables intake, fat intake, physical exercise, smoking, alcohol consumption; self‐reported adherence to medical treatment; cardiovascular risk factor levels Secondary outcomes: perception of own health behaviour, attitude towards behaviour change, self‐efficacy, risk perception, anxiety, satisfaction Total analysed at follow‐up: 24 practices with 526 participants (13 practices with 264 participants in the intervention group, 11 practices with 258 participants in the comparison group) Follow‐up: baseline, 12 weeks, and 52 weeks | |
| Study funding sources | The Netherlands Organization for Health Research and Development | |
| Notes | Study includes patient‐reported outcomes only | |
| Risk of bias | ||
| Bias | Authors' judgement | Support for judgement |
| Random sequence generation (selection bias) | Low risk | "An independent statistician performed a central block randomization" |
| Allocation concealment (selection bias) | Low risk | Treatment allocation performed centrally by an independent statistician |
| Blinding of participants and personnel (performance bias) | High risk | "Because of the training, nurses could not be blinded. To minimize potential bias, patients were informed about the aim of the study, but not about being part of an intervention or control group." |
| Blinding of outcome assessment (detection bias) | Unclear risk | Method of outcome assessment was not reported for all outcomes, but several outcomes were self‐report questionnaires |
| Incomplete outcome data (attrition bias) | High risk | Participants with missing data were excluded; ITT analysis not performed |
| Selective reporting (reporting bias) | High risk | Protocol and trial registration reports risk factor levels (cholesterol, blood pressure, and 10‐year CVD risk) as outcomes that would be collected. Protocol also discusses economic analysis but these data are not provided in the published report |
| Other bias | Low risk | Other sources of bias not identified |
| Study characteristics | ||
| Methods | Cluster‐randomised controlled trial, parallel group (1:1) | |
| Participants | Adults with measured cholesterol level from 162 primary care practices in Hessen, Germany; recruited from 14 continuing medical education (CME) groups Unit of randomisation: CME group Inclusion criteria: additional criteria not reported Exclusion criteria: CME groups excluded if they participated in previous quality improvement projects Total randomised at baseline: 14 CME groups (N = 1132) Intervention group: 7 CME groups with 44 practices (n = 550) Comparison group: 7 CME groups with 47 practices (n = 582) Mean age: 59 years, 56% women, 97% German nationality, 18% diabetes mellitus, 20% CVD | |
| Interventions | Intervention group: 2 CME sessions to learn shared decision‐making communication strategies, guideline booklet, paper‐based risk calculator, and individual risk summary sheet for each participant Comparison group: CME unrelated to CVD prevention | |
| Outcomes | Primary outcomes: relative change in global risk at 6 months, patient participant scale Secondary outcomes: GP prescription behaviour, CV risk status after 6 months Total analysed at follow‐up: Intervention group: 7 CME groups with 40 practices (n = 460) Comparison group: 7 CME groups with 41 practices (n = 466) Follow‐up: baseline, after consultation, at 6 months | |
| Study funding sources | The study was funded by the German Federal Ministry of Education and Research, grant No. 01GK0401 | |
| Notes | Baseline imbalances with more diabetics and more participants with prior CVD events in the comparison group | |
| Risk of bias | ||
| Bias | Authors' judgement | Support for judgement |
| Random sequence generation (selection bias) | Unclear risk | Method of random sequence generation not reported |
| Allocation concealment (selection bias) | High risk | Physicians recruited participants after cluster‐randomisation "physicians were asked to approach all consecutive patients who had their cholesterol levels measured during a period of 4 weeks" Baseline imbalances between the 2 groups for diabetes mellitus, secondary prevention, and desire to participate in decision‐making |
| Blinding of participants and personnel (performance bias) | High risk | "Participating family doctors could not be blinded because of the intervention. Patients were informed that different kinds of risk communication and decision support would be assessed; they were unaware of their physicians’ group allocation, however." |
| Blinding of outcome assessment (detection bias) | High risk | "Family doctors provided data on risk factors to calculate a CVD risk score for each patient at baseline and at follow‐up." |
| Incomplete outcome data (attrition bias) | Unclear risk | 18% loss to follow‐up. Imputed missing values for individuals missing a single value to calculate 10‐year CVD risk. Large amount of missing data for shared decision‐making questionnaire (but this outcome was not included in this systematic review) |
| Selective reporting (reporting bias) | Low risk | All outcomes reported in trial registration were reported |
| Other bias | Low risk | Other sources of bias not identified |
| Study characteristics | ||
| Methods | Randomised controlled trial, parallel group (1:1:1) | |
| Participants | Public sector workers from Spain recruited from an annual work health assessment Inclusion criteria: additional criteria not reported Exclusion criteria: unable to understand medical advice, lacking permanent work contract, failed to attend the 2 scheduled visits ‐ separated by 1 year Total randomised 3153 participants: (n = 1051 intervention group receiving 10‐year Framingham risk score, n = 1045 intervention group receiving heart age, n = 1057 comparison group with conventional medical advice) Mean age: 46 (7.1) years, 52% women | |
| Interventions | Intervention groups:
Comparison group: conventional medical advice without provision of a CVD risk score | |
| Outcomes | Outcomes reported: BMI, fasting lipids (total cholesterol, triglycerides, HDL, glucose), blood pressure, self‐reported smoking, self‐reported physical activity. Results for intervention groups 1 and 2 were combined for the analyses reported in this systematic review Number analysed at follow‐up 2844 participants: (n = 955 in group 1, n = 914 in group 2, n = 975 in comparison group) Follow‐up: 1 year | |
| Study funding sources | Not reported by authors | |
| Notes | Few details provided within the study about the means used for calculating and providing the CVD risk score | |
| Risk of bias | ||
| Bias | Authors' judgement | Support for judgement |
| Random sequence generation (selection bias) | Unclear risk | "Using a computerized random number generator, the 3153 participants were randomly allocated to one of the three study groups" However, marked differences in baseline characteristics raises questions about the adequacy of randomisation |
| Allocation concealment (selection bias) | Unclear risk | Method of allocation concealment not reported |
| Blinding of participants and personnel (performance bias) | High risk | "[S]ingle blind design" |
| Blinding of outcome assessment (detection bias) | Unclear risk | Method of outcome assessment unclear |
| Incomplete outcome data (attrition bias) | Low risk | 10% loss to follow‐up |
| Selective reporting (reporting bias) | Unclear risk | No protocol available for review |
| Other bias | Unclear risk | Risk calculator developed by Unilever. Unclear if this model was validated |
| Study characteristics | ||
| Methods | Cluster‐randomised controlled trial, parallel group (2:1) | |
| Participants | Adults age 30‐74 years without CVD, recruited from 253 physician practices in Quebec, Canada Unit of randomisation: continuing medical education (CME) meeting Inclusion and exclusion criteria: additional criteria not reported Total randomised at baseline: 24 CME meetings with 253 physicians and 958 enrolled participants Intervention group: 16 CME meetings with 170 physicians and 782 enrolled participants Comparison group: 8 CME meetings with 83 comparison group physicians and 176 enrolled participants Mean age 51 years, 35% women | |
| Interventions | Intervention group: physicians received coronary risk profile (8‐year CHD risk and cardiovascular age) for their participants within 10 working days after the baseline participant assessment Comparison group: usual care, received coronary risk profile at completion of study (after outcomes collected) | |
| Outcomes | Primary outcome: likelihood of high‐risk vs low‐risk participants being seen at 3‐month follow‐up Secondary outcome: CVD risk factor levels, 8‐year CHD risk Total analysed at follow‐up: 291 participants (n = 202 intervention and n = 89 comparison) Follow‐up: 3 months | |
| Study funding sources | Grant‐in‐aid from Merck Frosst Canada, Inc | |
| Notes | Authors of the study had a financial stake in the computer risk model used for risk prediction | |
| Risk of bias | ||
| Bias | Authors' judgement | Support for judgement |
| Random sequence generation (selection bias) | Unclear risk | Method of sequence generation not reported by authors, but participants "selected" by physicians after randomisation |
| Allocation concealment (selection bias) | Unclear risk | Method of allocation concealment not reported |
| Blinding of participants and personnel (performance bias) | High risk | Participants and personnel not blinded |
| Blinding of outcome assessment (detection bias) | Unclear risk | Method of outcome assessment unclear but likely clinicians who were not blinded |
| Incomplete outcome data (attrition bias) | High risk | High loss to follow‐up rate. Approximately 70% of participants (667/958) were not reassessed at follow‐up and not included in analyses. Differential loss to follow‐up in intervention group |
| Selective reporting (reporting bias) | Unclear risk | No protocol available for review |
| Other bias | High risk | Study funded by Merck. 4 authors had financial stake in the prediction tool that was developed |
| Study characteristics | ||
| Methods | Randomised controlled trial, parallel group (1:1) | |
| Participants | Adult primary care patients with a diagnosis of diabetes mellitus; English‐ or Spanish‐speaking from urban New York Exclusion criteria: additional criteria not reported Total randomised at baseline 150 participants (n = 80 intervention, n = 70 comparison) Mean age: 58 years (SD 11.5), women 73%, 89% Black or Latino, 100% diabetes mellitus | |
| Interventions | The intervention consisted of a provider‐led discussion of the participant's risk using the Statin Choice tool which provided a 10‐year underlying risk category (average ≤ 15%, elevated = 15%‐30%, or high > 30%), a revised risk with statin therapy, and risks of statin treatment Comparison group: printed material from the American Diabetes Association on how to reduce cholesterol through dietary modifications | |
| Outcomes | Primary outcomes not specified Outcomes assessed from surveys: statin knowledge, decision Total analysed at follow‐up ‐ not specified by authors | |
| Study funding sources | Not reported by authors | |
| Notes | There was limited use of the Statin Choice decision support tool by the 46 providers (mean use 1.7 times) Adherence outcome poorly reported: "At 3 and 6 months, 70% and 80% of the participants reported good adherence to statins with no difference between groups." No further details provided | |
| Risk of bias | ||
| Bias | Authors' judgement | Support for judgement |
| Random sequence generation (selection bias) | Unclear risk | Method of random sequence generation not reported |
| Allocation concealment (selection bias) | Unclear risk | Method of allocation concealment not reported |
| Blinding of participants and personnel (performance bias) | High risk | Participants and personnel not blinded to intervention group |
| Blinding of outcome assessment (detection bias) | High risk | Self‐reported outcomes |
| Incomplete outcome data (attrition bias) | Unclear risk | Not reported |
| Selective reporting (reporting bias) | Unclear risk | Protocol not available |
| Other bias | High risk | Limited use of decision support tool in trial |
| Study characteristics | ||
| Methods | Cluster‐randomised controlled trial, parallel group (1:1:1) | |
| Participants | Adults aged 60‐79 years with high blood pressure from 27 general practices from UK Unit of randomisation: general practice Exclusion criteria: non‐ambulatory patients, life‐threatening illness, recent major surgery Total randomised at baseline: 27 general practices with 715 participants (n = 269 computerised decision support + risk chart, n = 264 risk chart, n = 182 usual care) Mean age: 71 years, 54% women, 11% diabetes mellitus, 11% history of MI or stroke | |
| Interventions | Intervention groups:
In the "CVD risk chart" group, CVD risk information was manually extracted by nurses and included in the medical record Comparison group: usual care | |
| Outcomes | Primary outcome: percentage of participants in each group with 5‐year CVD risk ≥ 10% Secondary outcomes: systolic and diastolic blood pressure, CVD drug prescription Total analysed at 12 months follow‐up 531 participants (n = 202 computerised decision support + risk chart, n = 199 risk chart, n = 1 usual care) Follow‐up: 12 months | |
| Study funding sources | NHS Wales Office of Research and Development, grant number RC016, NHS Research and Development Primary Care Career Scientist Award | |
| Notes | For the analyses in this systematic review, participants randomised to both intervention groups were combined (both these groups received CVD risk scores) and were compared with usual care (did not receive systematic provision of a CVD risk score) | |
| Risk of bias | ||
| Bias | Authors' judgement | Support for judgement |
| Random sequence generation (selection bias) | Low risk | "Randomisation was performed with a table of random numbers by a researcher not involved in the study and who was blind to the identity of the practices." |
| Allocation concealment (selection bias) | Low risk | See above |
| Blinding of participants and personnel (performance bias) | High risk | "Because of the nature of the study, neither the doctors and nurses nor the patients were blind to their study group." |
| Blinding of outcome assessment (detection bias) | High risk | Outcome assessors were unblinded clinic staff |
| Incomplete outcome data (attrition bias) | High risk | 41% of participants had missing cholesterol data |
| Selective reporting (reporting bias) | Unclear risk | Protocol not available for review |
| Other bias | Low risk | Other sources of bias not identified |
| Study characteristics | ||
| Methods | Randomised controlled trial, factorial design (2 × 2) | |
| Participants | Adults aged 32‐80 years with newly diagnosed hypertension from South Western UK Exclusion criteria: severe hypertension requiring immediate treatment, secondary hypertension, hypertension associated with pregnancy, dementia Total randomised: n = 217 participants (n = 51 to decision aid + video/leaflet, n = 52 decision aid only, n = 55 video/leaflet only, n = 59 usual care) Mean age: 59 years, 49% women | |
| Interventions | Intervention group: factorial design with decision support tool ± instructional video and leaflet about cardiovascular risk factors Comparison group: usual care Participants randomised to the decision support tool received a CVD risk score | |
| Outcomes | Primary outcome: decisional conflict scale Secondary outcomes: subscales of decision conflict scale related to uncertainty and decision quality; intention to start treatment; anxiety; knowledge; treatment decision Total analysed at follow‐up for primary outcome: n = 212 (n = 50 decision aid + video/leaflet, n = 50 decision aid only, n = 54 video/leaflet only, n = 58 usual care) Total analysed at 3‐month follow‐up for secondary outcomes: n = 199 (n = 48 decision aid + video/leaflet, n = 48 decision aid only, n = 51 video/leaflet only, n = 52 usual care) Follow‐up: 3 months for initial study 3‐year extended follow‐up reported in a subsequent study published by Emmert et al. 2005 Total analysed at 3 years follow‐up: n = 188 (n = 87 decision aid, n = 101 no decision aid) | |
| Study funding sources | Medical Research Council, National Health Service Primary Care Career Scientist Award | |
| Notes | For the analyses in this systematic review, all participants randomised to the decision support tool, which provided a CVD risk score, were combined and compared with participants not randomised to the decision support tool | |
| Risk of bias | ||
| Bias | Authors' judgement | Support for judgement |
| Random sequence generation (selection bias) | Low risk | "The allocation schedule was computer‐generated by an individual not involved in the study and executed by one of the authors (AM), to whom the allocation was concealed in advance by the nature of the minimisation procedure." |
| Allocation concealment (selection bias) | Low risk | See above |
| Blinding of participants and personnel (performance bias) | High risk | "Given the nature of the interventions, there was no masking of participants or the researcher administering the interventions (AM)." |
| Blinding of outcome assessment (detection bias) | High risk | "Likewise, blinding was not possible for outcome assessment, as this was conducted principally through self‐completion questionnaires." |
| Incomplete outcome data (attrition bias) | Low risk | < 10% loss to follow‐up; ITT analysis performed |
| Selective reporting (reporting bias) | Unclear risk | Protocol document not available |
| Other bias | Low risk | Other sources of bias not identified |
| Study characteristics | ||
| Methods | Cluster‐randomised controlled trial, parallel group (1:1) | |
| Participants | Patients from primary care practices in Sydney, Australia and New Zealand who had attended the service 3 or more times in a 24 month period and at least once in a 6 month period. Unit of randomisation: primary care practice Specific inclusion and exclusion criteria not reported Total randomised at baseline: 61 primary care practices with 38,725 participants (n = 31 practices with 19,385 participants in intervention group; n = 30 practices with 19,340 participants in comparison group) Total "high‐risk" participants randomised at baseline: 10,308 participants (n = 5392 intervention group, n = 4916 comparison group) Mean age: 61 years, 58% women, 17% diabetes mellitus, 13% CVD | |
| Interventions | Intervention group: clinical decision support software, audit and feedback tools, guideline dissemination and staff training. Clinical decision support software presented 5‐year CVD risk information and heart age. Comparison group: usual care | |
| Outcomes | Primary outcome: proportion of participants who received "appropriate" screening of CVD risk factors by end of study; proportion of high‐risk participants receiving recommended medication prescription Secondary outcomes: CV risk factor levels, incident CVD events, escalation of drug prescriptions in high‐risk people Total analysed at follow‐up: 60 primary care practices (n = 30 intervention group, n = 30 comparison group). 1 practice withdrew from the intervention group shortly after randomisation, but this did not affect number of total participants. Total 'high‐risk' participants analysed at follow‐up: 10,181 participants (n = 5335 intervention group, n = 4846 comparison group) Median follow‐up: 17 months | |
| Study funding sources | The National Health and Medical Research Council of Australia and the New South Wales Department of Health | |
| Notes | Authors report higher than anticipated intracluster coefficients in their analyses | |
| Risk of bias | ||
| Bias | Authors' judgement | Support for judgement |
| Random sequence generation (selection bias) | Low risk | "Permuted block randomisation was centrally performed using a web‐based form." |
| Allocation concealment (selection bias) | Low risk | See above |
| Blinding of participants and personnel (performance bias) | High risk | "Participating services did not make any special provisions to advertise the trial and their allocation status to patients; however, it would be reasonable to assume that when the tools were used during a consultation, patients may have been aware of the intervention." |
| Blinding of outcome assessment (detection bias) | Low risk | "[O]utcome analyses were conducted blinded to randomised allocation" |
| Incomplete outcome data (attrition bias) | Low risk | ITT analysis used |
| Selective reporting (reporting bias) | Low risk | All outcomes from protocol and trial registration were reported |
| Other bias | Unclear risk | Marked baseline imbalances between the groups that were not statistically significant due to larger than expected intracluster coefficients (ICC) |
| Study characteristics | ||
| Methods | Cluster‐randomised trial, parallel group (1:1) | |
| Participants | Patients from primary care centres in Tenerife, Spain Unit of randomisation: clinician Study aim: to assess the efficacy of the statin choice decision aid compared to usual primary care in Spanish participants with type 2 diabetes mellitus Inclusion criteria: 18 years of age or older, type 2 diabetes mellitus, Spanish language‐speaking, and no cognitive or sensorial impairments Exclusion criteria: no additional criteria listed Total randomised at baseline: 29 physicians with 168 participants (n = 15 physicians with 86 participants in intervention group, n = 14 physicians with 82 participants in the comparison group) Mean age (SD): intervention 63.9 years (9.7) and control 59.6 years (12.3); sex: intervention 41% women, control 34% women; 100% diabetes mellitus; 10‐year risk category: intervention 37.6% high risk, control 25.3% high risk; ischaemic heart disease: intervention 24%, control 18% | |
| Interventions | Intervention group: statin choice decision aid about the use of statins. The decision aid consisted of a 3‐page pamphlet listing: CVD risk factors, 10‐year CVD risk based on the UKPDS risk engine presented in pictographs with and without statins, list of adverse effects of statins and their incidence Comparison group: usual care | |
| Outcomes | Primary and secondary outcomes not specified Outcomes reported: statin knowledge, risk perception, decisional conflict scale (DCS), satisfaction with decision‐making, problem areas in diabetes questionnaire, self‐report of statin taking, self‐report of adherence at 3 months (Morisky), consultation time by physician Follow‐up: immediately after encounter and at 3 months Total analysed at 3 months follow‐up: 131 participants (n = 67 intervention, n = 64 comparison) | |
| Study funding sources | Spanish Ministry of Health, Social Services and Equality (grant number: EC10‐005) | |
| Notes | Analyses of outcomes accounted for clustering, but no power calculations performed. Significant baseline differences between intervention and control groups. At 3 months, 20% of participants were lost to follow‐up (but 42% missing data for adherence outcome). ITT analysis not performed Study funded by Spanish Ministry of Health, Social Services and Equality (grant number: EC10‐005) No conflicts of interest reported | |
| Risk of bias | ||
| Bias | Authors' judgement | Support for judgement |
| Random sequence generation (selection bias) | Low risk | "Physicians who consented to participate were randomised to intervention or usual care by means of a computer‐generated list." |
| Allocation concealment (selection bias) | High risk | Participants were recruited to the trial by clinicians and this occurred after clinicians were randomised Significant baseline difference between the 2 treatment groups suggests high risk of selection bias. Participants in the intervention group were significantly older, had more hypertension, and were more likely to be prescribed statins at baseline than participants in the control group |
| Blinding of participants and personnel (performance bias) | High risk | Participants and clinicians not blinded to intervention |
| Blinding of outcome assessment (detection bias) | Unclear risk | Not reported by authors but all outcomes were measured by participant self‐report |
| Incomplete outcome data (attrition bias) | High risk | 34/168 (20%) participants were lost to follow‐up. Adherence data were missing for 71/168 (42%) participants. ITT analysis not performed |
| Selective reporting (reporting bias) | High risk | Per clinical trial registration, the primary outcome was adherence at 3 months as measured by Morisky scale, chart abstraction, and pharmacy records. This was not reported as a primary outcome by the authors and the latter 2 methods were not used to measure adherence Several secondary outcomes not reported: haemoglobin A1c, lipid profile, health‐related quality of life, consultation time |
| Other bias | High risk | Small study bias |
| Study characteristics | ||
| Methods | Cluster‐randomised controlled trial, parallel group (1:1) | |
| Participants | Participants aged 40‐79 years from 29 physician panels with a Framingham risk score of at least 5%, LDL cholesterol level above guideline threshold for drug treatment, and not prescribed a lipid‐lowering medication Exclusion criteria: coronary heart disease, heart failure, stroke, diabetes mellitus, peripheral vascular disease Total randomised at baseline: 29 physicians with 435 participants (n = 14 physicians and 218 participants in the intervention group, n = 15 physicians and 217 participants in the comparison group). Mean age 60.7 years, 23% women, mean Framingham Risk score (SD): 14.2 (6.7) in intervention group and 13.8 (6.3) in comparison group | |
| Interventions | Intervention group: patients of physicians randomised to the intervention group were mailed individualised CVD risk messages that described benefits of using a statin (and controlling hypertension or quitting smoking when relevant) Comparison group: usual care | |
| Outcomes | Primary outcome: occurrence of a LDL‐cholesterol level that was at least 30 mg/dL lower than prior Secondary outcome: lipid‐lowering drug prescription, aspirin prescription, change in systolic and diastolic blood pressure, difference in number of antihypertensive medications prescribed, documentation of quitting smoking Follow‐up: 9 months; but extended to 18 months post hoc Total analysed in follow‐up: same as above | |
| Study funding sources | Agency for Healthcare Research and Quality, USA | |
| Notes | Primary endpoint at 9 months not met in the original protocol but analyses included a 18‐month post hoc analysis that did achieve the primary endpoint | |
| Risk of bias | ||
| Bias | Authors' judgement | Support for judgement |
| Random sequence generation (selection bias) | Low risk | "Randomization was performed using a random number generator (SAS 9.2, SAS Institute Inc., Cary, NC) by a researcher who was not aware of the physicians’ order in the blocks. Allocation to intervention or control groups was not revealed until after randomization was completed." |
| Allocation concealment (selection bias) | Low risk | See above |
| Blinding of participants and personnel (performance bias) | High risk | Participants and personnel not blinded |
| Blinding of outcome assessment (detection bias) | Low risk | "All outcomes were assessed by applying the outcome criteria to patient data automatically collected from EHRs using automated searches. No human judgment was involved in outcome assessments." |
| Incomplete outcome data (attrition bias) | Unclear risk | ITT analysis performed All included participants analysed but only 38% of intervention and 34% of control had LDL testing which biases result to null |
| Selective reporting (reporting bias) | Low risk | All outcomes from trial registration were reported |
| Other bias | Unclear risk | Initial trial follow‐up planned for 9 months; extended to 18 months post hoc |
| Study characteristics | ||
| Methods | Randomised controlled trial, parallel group (1:1) | |
| Participants | 646 men 35 years or older and women 45 years or older, without CVD or diabetes mellitus, and with a 10‐year risk of CHD > 10% in 11 federally qualified health centres in the USA Exclusion criteria: diagnosed vascular disease, diabetes mellitus, primary language other than English or Spanish, primary care clinician discretion Mean age 60 years, 11% women, 50% African American, 33% non‐Hispanic white, 13% Hispanic | |
| Interventions | Intervention group: the intervention group received telephone and mailed outreach with individualised CVD risk information and uncontrolled risk factors provided by lay health workers. Comparison group: usual care | |
| Outcomes | Primary outcome: discussion about drug treatment for cholesterol at 6 months, follow‐up LDL‐cholesterol level > 30 mg/dL lower than baseline value Secondary outcome: statin prescription at 6 months, repeat LDL‐cholesterol test at 1 year Follow‐up: 1 year | |
| Study funding sources | Agency for Healthcare Research and Quality, USA | |
| Notes | — | |
| Risk of bias | ||
| Bias | Authors' judgement | Support for judgement |
| Random sequence generation (selection bias) | Low risk | "A Northwestern investigator (SP) who was not aware of patients' identities, stratified eligible patients by CHC network then randomly assigned patients in a 1:1 ratio within each stratum using a random number generator in SAS 9.3 statistical software." |
| Allocation concealment (selection bias) | Low risk | See above |
| Blinding of participants and personnel (performance bias) | High risk | Participants and personnel were not blinded to intervention |
| Blinding of outcome assessment (detection bias) | Low risk | "Northwestern investigators reviewed these charts and were blinded to study group assignments." |
| Incomplete outcome data (attrition bias) | Unclear risk | Pragmatic trial design. Outcomes obtained as a part of routine care. Only 36% of participants had a repeat LDL cholesterol test after 1 year. |
| Selective reporting (reporting bias) | Low risk | All outcomes from clinical trial registration reported. Post hoc outcomes and analyses delineated in manuscript |
| Other bias | Unclear risk | Potential for contamination bias since randomisation occurred at the level of participant |
| Study characteristics | ||
| Methods | Randomised controlled trial, 2 × 2 factorial design | |
| Participants | Adults at increased CVD risk (10‐year Framingham risk ≥ 20%) recruited from 4 general practices in Oxfordshire, UK Exclusion criteria: prevalent cardiovascular disease (MI, stroke, TIA, prior revascularisation), physical disability or condition reducing the ability to walk Total randomised at baseline 194 (n = 99 to personalised 10‐year CVD risk estimate, n = 95 to risk factor levels only) Mean age: 62 years, 33% women, 98% white, 19% diabetes mellitus | |
| Interventions | Participants were randomised in a 2 × 2 factorial design to receive: either a personalised 10‐year cardiovascular disease risk estimate from a decision support tool or were told their blood pressure, total cholesterol, and fasting glucose values and if they were elevated per guidelines. Participants were simultaneously randomised to receive or not receive a brief lifestyle intervention by slideshow targeting physical activity, diet, and smoking. Results presented for decision support tool compared with no decision support | |
| Outcomes | Primary outcome: physical activity at 1 month, cardiovascular risk factor levels at 1 month Secondary outcomes: BMI, cholesterol levels, fasting glucose, anxiety, quality of life, self‐regulation, worry about heart attack risk, intention to increase physical activity, recall of risk information Total analysed at follow‐up 185 (n = 94 in personalised 10‐year CVD risk group, n = 91 in risk factor levels only group) Follow‐up: 1 month | |
| Study funding sources | Diabetes Trials Unit Fellowship, Insulin Dependent Diabetes Trust | |
| Notes | — | |
| Risk of bias | ||
| Bias | Authors' judgement | Support for judgement |
| Random sequence generation (selection bias) | Low risk | "Computerized randomization was used to allocate participants and was performed internally." |
| Allocation concealment (selection bias) | Low risk | See above |
| Blinding of participants and personnel (performance bias) | High risk | Participants were not blinded. "One research fellow remained unblinded in order to deliver the intervention." |
| Blinding of outcome assessment (detection bias) | Low risk | "Research nurses who inputted data were blind to intervention allocation." |
| Incomplete outcome data (attrition bias) | High risk | ITT analysis but "valid baseline and follow‐up accelerometer data were only available for 125 participants (64%)". |
| Selective reporting (reporting bias) | Low risk | Outcomes reported as outlined in the protocol document |
| Other bias | Low risk | Other sources of bias not identified |
| Study characteristics | ||
| Methods | Randomised controlled trial, parallel group (1:1) | |
| Participants | Men and women aged 35‐75 years without CVD in North Carolina, USA Exclusion criteria: prior history of CVD, serious chronic medical condition that would limit their candidacy for screening (i.e. chronic renal failure, cirrhosis of the liver, HIV, current non‐skin cancer), people who had participated in a previous quality improvement initiative Total randomised 87 adults (n = 49 to intervention group, n = 38 to comparison group) Mean age 53 years, 59% women, 73% white, 23% African American, 8% diabetes mellitus | |
| Interventions | Intervention group: participants provided with most‐recent risk factor information and instructed to review a computerised decision support tool prior to clinic visit. The decision support tool provided individualised CHD risk, the pros and cons of pertinent risk‐reducing therapies, and the amount of risk reduction achievable after 1 or more therapeutic interventions. Comparison group: provided a list of their cardiovascular risk factors | |
| Outcomes | Primary outcome: discussion with provider about CHD risk reduction, plans for CHD risk reduction Secondary outcomes: knowledge about CHD prevention, perception of CHD risk, interest in participating in decision‐making, accuracy of risk perception, self‐perceived barriers to risk reduction Total analysed 75 adults (n = 41 in intervention group, n = 34 in comparison group) | |
| Study funding sources | Internal funding from Department of Medicine at University of North Carolina | |
| Notes | 2 authors received consulting and licensing fees from Bayer, Inc. 1 author received honoraria and consulting fees from Merck, Pfizer, and Glaxo Smith Kline. Small pilot study | |
| Risk of bias | ||
| Bias | Authors' judgement | Support for judgement |
| Random sequence generation (selection bias) | Unclear risk | "We used a computerized random number generator to randomize patients to receive either the Heart to Heart decision aid or a list of their CHD risk factors that they could present to their doctor." Baseline imbalances in key parameters such as CHD risk factors, baseline CHD risk, and interest in prevention strategies |
| Allocation concealment (selection bias) | Low risk | "Intervention assignments were sealed in security envelopes until after subjects agreed to participate in the study. The research assistant then broke the seal to determine intervention assignment." |
| Blinding of participants and personnel (performance bias) | High risk | "We blinded patients to the purpose of our study by telling them only that they were participating in a study about "prevention of CHD." Doctors were not blinded and saw patients in both the decision aid and control group. |
| Blinding of outcome assessment (detection bias) | Unclear risk | Method of outcome assessment not reported |
| Incomplete outcome data (attrition bias) | Unclear risk | 12 participants excluded postrandomisation (8 because they did not meet eligibility criteria); ITT analysis not performed |
| Selective reporting (reporting bias) | Low risk | All outcomes from trial registration were reported |
| Other bias | High risk | Small study bias with key baseline imbalances in spite of randomisation Possible contamination bias as same doctors saw participants who were in intervention and control groups |
| Study characteristics | ||
| Methods | Randomised controlled trial, parallel group (1:1) | |
| Participants | Men and women aged 40‐79 years with no history of CVD or diabetes mellitus, at moderate or high‐risk based on Framingham risk score Exclusion criteria: serious medical condition that limited life expectancy to less than 5 years, first clinic visit, no cholesterol level checked in 18 months, extreme risk factor levels (systolic blood pressure > 180 mmHg or total cholesterol > 300 mg/dL) Total randomised at baseline: 160 participants (n = 81 to intervention group, n = 79 to comparison group) Mean age: 63 years, 28% women, 86% white, 10% African American | |
| Interventions | Intervention group:
Comparison group: usual care | |
| Outcomes | Primary outcome: feasibility of subject recruitment, intervention delivery, and measurement of study outcomes Secondary outcomes: self‐reported adherence, global CHD risk, blood pressure, serum total and HDL cholesterol levels, smoking status, aspirin use, intent to start CHD reducing medication, self‐efficacy for CHD risk reduction Total analysed: 154 participants (n = 77 intervention group, n = 77 comparison group) Follow‐up: 3 months | |
| Study funding sources | National Heart, Lung, and Blood Institute, USA; National Cancer Institute, USA; American Heart Association | |
| Notes | Feasibility study, no power calculation | |
| Risk of bias | ||
| Bias | Authors' judgement | Support for judgement |
| Random sequence generation (selection bias) | Unclear risk | Method for sequence generation not reported. Baseline imbalances between intervention and control noted |
| Allocation concealment (selection bias) | Unclear risk | "Patients were randomised by study staff who accessed an online randomised schedule." |
| Blinding of participants and personnel (performance bias) | High risk | "Physicians were not blinded and saw patients in both the intervention and control group." |
| Blinding of outcome assessment (detection bias) | Unclear risk | Method of outcome assessment not reported |
| Incomplete outcome data (attrition bias) | Low risk | "The study lost 6 patient participants during follow‐up, resulting in a 96% follow up rate." |
| Selective reporting (reporting bias) | Low risk | All outcomes reported in trial registration reported |
| Other bias | High risk | "[P]hysicians saw patients in both the intervention and control groups, which may have resulted in contamination between study groups." |
| Study characteristics | ||
| Methods | Randomised controlled trial, parallel group (1:1:1:1) | |
| Participants | Men and women age 30‐60 years with obesity (BMI ≥ 29 kg/m²) Exclusion criteria: diagnosis of a heart condition or cancer, being pregnant Total randomised at baseline 781 participants (n = 197 to CVD risk message, n = 194 to CVD risk message + automated health planning tool, n = 195 to health planning tool alone, n = 195 to educational information (control) Mean age: 47 years. Few baseline characteristics presented | |
| Interventions | Participants randomised to 1 of 3 intervention groups: a CVD risk message, CVD risk message + automated health planning tool, health planning tool alone Comparison group: educational information about diet low in saturated fats without CVD risk message or planning tool For this systematic review, data for participants in the 2 CVD risk message groups were combined and compared with participants in the 2 groups that did not receive a CVD risk message (n = 392 intervention group, n = 389 comparison group) | |
| Outcomes | Primary outcome: saturated fat intake as measured by self‐reported food‐frequency questionnaire, 2‐item scale to evaluate consumption of low‐fat foods Secondary outcomes: CVD risk perception, intention to reduce saturated fat intake, self‐efficacy, planning and outcome expectancies Total analysed in follow‐up 581 participants (n = 141 in CVD risk message group, n = 137 in CVD risk message + automated health planning tool, n = 141 in automated health planning tool alone, n = 141 in educational information (control) For this systematic review, n = 278 in CVD risk groups, n = 282 in comparison groups Follow‐up: 5 weeks | |
| Study funding sources | Unilever funded and created the Heart Age score tested in the study | |
| Notes | Internet‐based trial with a large amount of missing data | |
| Risk of bias | ||
| Bias | Authors' judgement | Support for judgement |
| Random sequence generation (selection bias) | Unclear risk | Method of random sequence generation not reported |
| Allocation concealment (selection bias) | Unclear risk | Method of allocation concealment not reported |
| Blinding of participants and personnel (performance bias) | Unclear risk | Method of blinding not reported |
| Blinding of outcome assessment (detection bias) | High risk | Outcomes were patient‐reported |
| Incomplete outcome data (attrition bias) | High risk | > 20% loss to follow‐up; ITT analysis not performed |
| Selective reporting (reporting bias) | High risk | Trial registered retrospectively |
| Other bias | High risk | Trial funded by Unilever and multiple authors were employees of Unilever. Heart Age Calculator software was also proprietary of Unilever |
| Study characteristics | ||
| Methods | Randomised controlled trial, parallel group (1:1) | |
| Participants | African American adults aged 40‐75 years with uncontrolled hypertension Exclusion criteria: individuals with > 40% missed or cancelled clinic appointments during the past 3 years Total randomised: 280 participants (n = 136 intervention group, n = 144 comparison group) Mean age: 62 years, 65% women, 100% African Americans, 54% diabetes mellitus, 18% with CAD or equivalent | |
| Interventions | Intervention group:
Comparison group: received written material, brochures, and cookbook from American Heart Association addressing healthy lifestyle | |
| Outcomes | Primary outcome: change in 4‐year CHD risk at 6 months Secondary outcomes: 5 mmHg or greater reduction in SBP at 6 months; absolute change in blood pressure Total analysed for primary outcome: 212 participants (n = 96 intervention group, n = 118 comparison group) Follow‐up: 6 months | |
| Study funding sources | Robert Wood Johnson Foundation and the staff of the Finding Answers, Disparities Research for Change Program; unrestricted | |
| Notes | Intervention targeted to individuals with uncontrolled hypertension but mean blood pressure was 140.5/81.2 mmHg | |
| Risk of bias | ||
| Bias | Authors' judgement | Support for judgement |
| Random sequence generation (selection bias) | Unclear risk | "[R]andomised at a 1:1 ratio using random computer‐generated assignments" |
| Allocation concealment (selection bias) | Unclear risk | Method of allocation concealment not reported |
| Blinding of participants and personnel (performance bias) | High risk | "[S]ingle‐blinded study;" "All providers were blinded to the study arm." |
| Blinding of outcome assessment (detection bias) | Low risk | "The 6‐month endpoint blood pressure was performed by blinded office medical assistants" |
| Incomplete outcome data (attrition bias) | High risk | Greater missing data in the intervention group "After 6 months, 94 (69%) intervention subjects and 118 (82%) control subjects had 4‐year CHD risk assessed" |
| Selective reporting (reporting bias) | Unclear risk | Trial registration retrospectively; all outcomes from trial registration reported |
| Other bias | Unclear risk | Unrestricted supplementary funding from Pfizer, Inc |
| Study characteristics | ||
| Methods | Cluster‐randomised trial, parallel group (1:1) | |
| Participants | People aged 45‐69 years without CVD, recruited from 34 general practices in urban Sydney, Australia Unit of randomisation: practice Exclusion criteria: insufficient English skills, cognitively impaired, Aboriginal or Torres Strait Islander, diagnosed or treated CVD Total randomised: 34 clusters of 1074 participants (n = 18 practices with 567 participants in the intervention group, n = 16 practice with 507 participants in the comparison group) Mean age: 56 years, 58% women, 56% Anglo‐Celtic, 12% diabetes mellitus | |
| Interventions | Intervention group: physicians received training on the importance of absolute risk assessment and use of a CVD risk calculator; participants received a 20‐30 min consultation that involved calculating cardiovascular risk and providing appropriate management based on risk level and current guidelines Comparison group: general health check | |
| Outcomes | Primary outcome: antihypertensive medication prescription, lipid‐lowering medication prescription at 12 months Secondary outcomes: changes in blood pressure and blood lipids; self‐reported smoking; self‐reported physical activity levels; diet consumption Total analysed: 34 clusters of 906 participants (n = 18 practices with 475 participants in the intervention group; n = 15 practices with 431 participants in the comparison group) Follow‐up: 12 months | |
| Study funding sources | National Health and Medical Research Council of Australia | |
| Notes | Only 685/1074 (64%) had values available for risk assessment | |
| Risk of bias | ||
| Bias | Authors' judgement | Support for judgement |
| Random sequence generation (selection bias) | Low risk | "A person (U.J.) independent of the intervention and data collection conducted the allocation using a computer randomization program." |
| Allocation concealment (selection bias) | Low risk | See above |
| Blinding of participants and personnel (performance bias) | High risk | Personnel not blinded to intervention |
| Blinding of outcome assessment (detection bias) | Low risk | "Research staff collecting practice data were blinded to group allocation, as were patients." |
| Incomplete outcome data (attrition bias) | High risk | Large amount of missing data. Only 64% of participants had values available for risk assessment |
| Selective reporting (reporting bias) | High risk | Several outcomes (such as health‐related quality of life) mentioned in trial registry and protocol were not reported in this report |
| Other bias | Low risk | Other sources of bias not identified |
| Study characteristics | ||
| Methods | Cluster‐randomised controlled trial, parallel group (1:1) | |
| Participants | People aged 40‐75 years without CVD recruited from 45 primary care clinicians Unit of randomisation: primary care clinician Additional inclusion and exclusion criteria not reported Total randomised: 45 primary care clinicians with 623 participants (n = 19 primary care clinicians with 332 participants in intervention group, n = 26 primary care clinicians with 291 participants in the comparison group Mean age: 54 years, 55% women, 100% Dutch, 20% diabetes mellitus | |
| Interventions | Intervention group: primary care clinicians trained to use cardiovascular risk in guidelines and in the use of a clinical decision support tool (paper booklet) provided to participants prior to clinic visit (2 clinic visits separated by 2 weeks) Comparison group: educational materials about the guidelines on paper | |
| Outcomes | Primary outcome not specified. Outcomes reported: appropriate risk classification, appropriate assessment, appropriate smoking advice, appropriate dietary advice Secondary outcomes: anxiety, appropriateness of perceived risk, self‐reported lifestyle changes (smoking in past 7 d, phys activity > 2 h, EtOH use, BMI > 30), self‐efficacy regarding lifestyle changes Total analysed at 0 weeks: 490 participants (n = 276 intervention group, n = 200 comparison group) Total analysed at 26 weeks: 427 participants (n = 227 intervention group, n = 200 comparison group) Follow‐up: 26 weeks | |
| Study funding sources | The Netherlands Organization for Health Research and Development | |
| Notes | — | |
| Risk of bias | ||
| Bias | Authors' judgement | Support for judgement |
| Random sequence generation (selection bias) | Low risk | "A computer was used for the stratified randomization, which was at practice level to prevent contamination of the intervention within group practices." |
| Allocation concealment (selection bias) | High risk | Participant recruitment occurred after cluster‐randomisation which increases the risk of selection bias |
| Blinding of participants and personnel (performance bias) | High risk | Participants and personnel not blinded |
| Blinding of outcome assessment (detection bias) | High risk | Outcomes assessed by physicians who were not blinded to intervention |
| Incomplete outcome data (attrition bias) | High risk | > 20% loss to follow‐up; ITT analysis not performed |
| Selective reporting (reporting bias) | Unclear risk | Protocol not available for review |
| Other bias | Low risk | Other sources of bias not identified |
| Study characteristics | ||
| Methods | Randomised controlled trial, parallel group (1:1) | |
| Participants | Adult Australian residents with access to the Internet, trial recruitment strategies geared toward individuals with self‐reported hypercholesterolemia Total randomised: 2099 participants (n = 1062 participants intervention group, n = 1037 participants comparison group) Mean age: 56 years, 55% women, 12% diabetes mellitus, 9% CHD | |
| Interventions | Intervention group: individuals assigned to intervention received immediate, fully automated, personally tailored cholesterol treatment advice based on current Australian guidelines regarding the need for starting or increasing statin therapy or non‐drug intervention strategies. Comparison group: provided with general information about cholesterol management | |
| Outcomes | Primary outcome: number of participants reporting starting or increasing lipid‐lowering medication Secondary outcomes: number of participants who self‐reported: a cholesterol level, doctor visit, start of a healthy diet, start of an exercise programme, weight‐loss, smoking cessation, blood pressure check‐up Total analysed: same as above (ITT) Follow‐up: 8 weeks | |
| Study funding sources | MBF Australia, Pfizer, National Health and Medical Research Council of Australia Program Grant (Grant ID: 571281) | |
| Notes | Internet‐based study, no human contact | |
| Risk of bias | ||
| Bias | Authors' judgement | Support for judgement |
| Random sequence generation (selection bias) | Low risk | "Randomization was done automatically in real time by a central computerized service run by the investigators at The George Institute for International Health." |
| Allocation concealment (selection bias) | Low risk | See above |
| Blinding of participants and personnel (performance bias) | Low risk | "Participants were not informed of the precise randomised comparison being made and were simply told that they were participating in a trial that sought to ‘find out if advice about cholesterol provided on the Internet can improve your cholesterol management.’" "Investigators were blinded to the allocation of all individuals throughout the trial." |
| Blinding of outcome assessment (detection bias) | High risk | Outcomes self‐reported by participants |
| Incomplete outcome data (attrition bias) | Low risk | 93% follow‐up, ITT analysis performed |
| Selective reporting (reporting bias) | Low risk | All prespecified outcomes reported |
| Other bias | High risk | Outcomes subject to recall bias |
| Study characteristics | ||
| Methods | Randomised controlled trial, parallel group (1:1) | |
| Participants | Type‐2 diabetics under the age of 75 years newly referred to the Diabetes Care System West‐Friesland, a managed care system in the Netherlands Exclusion criteria: unable to read/write Dutch, history of stroke/TIA Total randomised: 262 participants (n = 132 intervention group, n = 130 comparison group) Mean age 59 years, 44% women, 100% diabetes mellitus | |
| Interventions | Intervention group: received: risk communication intervention from trained diabetes nurses and dieticians in addition to usual care. Risk communication consisted of: general explanation about risks of diabetes mellitus, presentation of 10‐year absolute CVD risk, visual/graphical presentation of absolute and relative risk, and explanation of treatment benefits using a 'positive' frame Comparison group: received usual care provided by the diabetes nurses and dieticians of the Diabetes Care System which consisted of general information about having diabetes mellitus and education about treatment options and lifestyle modifications | |
| Outcomes | Primary outcome: appropriateness of risk perception. Secondary outcomes: anxiety, generalised worry, illness perception, attitude, intention to change behaviour, satisfaction with communication Total analysed: 204 participants (n = 102 intervention group, n = 102 comparison group) Follow‐up: 12 weeks | |
| Study funding sources | Dutch Diabetes Research Foundation Grant 2007.13.004 | |
| Notes | — | |
| Risk of bias | ||
| Bias | Authors' judgement | Support for judgement |
| Random sequence generation (selection bias) | Low risk | "All participating patients gave written informed consent and were randomised into an intervention and a control group by means of a list drawn up by a computerized randomisation program (version 1.0.0; Random Allocation Software)." |
| Allocation concealment (selection bias) | Low risk | "The manager of the DCS [Diabetes Care System], who is not involved in the patients' care, allocates the patient to one of the two groups on the basis of the randomisation list." |
| Blinding of participants and personnel (performance bias) | High risk | Participants and personnel not blinded to intervention |
| Blinding of outcome assessment (detection bias) | High risk | Outcomes derived from self‐report questionnaires |
| Incomplete outcome data (attrition bias) | High risk | > 20% loss to follow‐up; ITT analysis not performed |
| Selective reporting (reporting bias) | Low risk | All pre‐specified outcomes from protocol were reported |
| Other bias | High risk | Potential for contamination because the same diabetes nurses and dieticians delivered the risk communication intervention and usual care |
| Study characteristics | ||
| Methods | Randomised controlled trial, parallel group (7:3) | |
| Participants | Inclusion criteria: adult smokers who smoked > 5 cigarettes/day Exclusion criteria: history of psychotic illness, unable to read/speak English, minimum life expectancy of 18 months Total randomised: 1006 participants (n = 714 intervention group, n = 292 comparison group) Mean age: 46 years, 64% women, 82% white | |
| Interventions | Intervention group: multifaceted intervention
Counselors were trained to support participants in making clear and autonomous choices and goal‐setting. Comparison group: received booklets on smoking cessation and healthy diet; also encouraged to enrol in a smoking cessation programme and to meet with their physician | |
| Outcomes | Primary outcome: 12‐month prolonged tobacco abstinence Secondary outcomes: change in percent calories from fat, LDL‐C from baseline to 18 months Total analysed: same as above (ITT analysis) Follow‐up: 18 months | |
| Study funding sources | National Institute of Mental Health, USA; National Cancer Institute, USA | |
| Notes | — | |
| Risk of bias | ||
| Bias | Authors' judgement | Support for judgement |
| Random sequence generation (selection bias) | Unclear risk | Method of random sequence generation not reported |
| Allocation concealment (selection bias) | Low risk | "The results of a stratified permutated blocked randomization were placed in numbered double‐sealed security envelopes." |
| Blinding of participants and personnel (performance bias) | High risk | Participants and personnel not blinded to treatment assignment |
| Blinding of outcome assessment (detection bias) | High risk | Self‐reported outcomes |
| Incomplete outcome data (attrition bias) | High risk | 28% loss to follow‐up at 18 months; ITT analysis reported by authors but analyses appear to be completers analysis for LDL |
| Selective reporting (reporting bias) | Low risk | Prespecified outcomes all reported |
| Other bias | Unclear risk | Received funding from pharmaceutical industry |
| Study characteristics | ||
| Methods | Randomised controlled trial, parallel group (1:1) | |
| Participants | Participants age 45‐64 years from the Fraser Health region in British Columbia, Canada Exclusion criteria: no additional criteria specified Number of primary prevention participants randomised: 315 participants (n = 157 intervention group, n = 158 comparison group) Mean age: 56 years, 58% women | |
| Interventions | Intervention group: participants and their primary care doctor received a 'report card' showing the person's CVD risk profile; also participants received Telehealth lifestyle counselling by 2 kinesiologists trained in motivational interviewing every 6 months for approximately 30 min per session. Comparison group: usual care | |
| Outcomes | Primary outcome: Framingham risk score Total analysed: same as above (ITT analysis) Follow‐up: 1 year | |
| Study funding sources | Canadian Institutes of Health Research, Community Alliance for Health Research Program, project 43267 | |
| Notes | This study included participants eligible for either primary or secondary prevention but randomised and analysed these 2 groups separately. For this systematic review, we report on the 315 participants in the primary prevention group. | |
| Risk of bias | ||
| Bias | Authors' judgement | Support for judgement |
| Random sequence generation (selection bias) | Low risk | "The study statistician then randomly assigned the participants to the intervention or control study arm according to computer‐generated random numbers." |
| Allocation concealment (selection bias) | Unclear risk | "The research coordinator received the assignment codes in envelopes, which were concealed from all members of the research team and were not opened by the coordinator until the point of randomization." Not reported if sealed or opaque |
| Blinding of participants and personnel (performance bias) | High risk | Personnel not blinded to intervention but "all data were collected without patients’ knowledge of group allocation." |
| Blinding of outcome assessment (detection bias) | Low risk | "The outcome assessors were blinded to group allocation …" |
| Incomplete outcome data (attrition bias) | Low risk | No major loss to follow‐up. ITT analysis with multiple imputation of missing data performed |
| Selective reporting (reporting bias) | Unclear risk | No protocol document available for review |
| Other bias | Unclear risk | Potential for contamination bias but sensitivity analysis removing analysis of all participants who shared a physician did not result in change in point estimates |
| Study characteristics | ||
| Methods | Randomised controlled trial, parallel group (1:1) | |
| Participants | Adults with CVD or a CVD‐risk equivalent condition, at least 1 modifiable risk factor (e.g. hypertension or active smoking) Exclusion criteria: patients with metastatic cancer, dementia, psychosis, or end‐stage renal disease; no Internet access; nursing care; unable to read English; heart transplant; hospitalised for a cardiac‐related illness in the previous 3 months Total randomised: 96 participants (n = 47 intervention group. n = 49 comparison group) Mean age: 63 years, 68% women, 62% white, 32% African American, 29% diabetes mellitus | |
| Interventions | Intervention group: participants were presented a web‐based decision support tool that calculated their CVD risk based on the Framingham risk score and in subsequent online encounters could select modules with evidence‐based recommendations regarding healthy lifestyle behaviours (medication adherence, diet, risk factor knowledge, smoking cessation) Comparison group: usual care, received general printed educational CVD information | |
| Outcomes | Outcomes reported: mean differences in 10‐year Framingham risk score, BMI, smoking status, systolic blood pressure, and self‐reported medication adherence Total analysed: not reported Follow‐up: 3 months | |
| Study funding sources | Informed Medical Decisions Foundation, grant number 0170‐1 | |
| Notes | — | |
| Risk of bias | ||
| Bias | Authors' judgement | Support for judgement |
| Random sequence generation (selection bias) | Unclear risk | Method of random sequence generation not reported but authors report baseline differences between participants, so this may be high risk of bias |
| Allocation concealment (selection bias) | Unclear risk | "Randomization assignments were placed in sealed, consecutively numbered envelopes." Not reported if envelopes were opaque |
| Blinding of participants and personnel (performance bias) | High risk | Participants and personnel were not blinded to the intervention. |
| Blinding of outcome assessment (detection bias) | Unclear risk | Unclear who assessed 3 month follow‐up visit outcomes. Medication use was self‐reported |
| Incomplete outcome data (attrition bias) | Unclear risk | Outcome data were not clearly reported including number of participants contributing to data |
| Selective reporting (reporting bias) | Unclear risk | Protocol document not available |
| Other bias | Unclear risk | Small study bias |
ATP: Adult Treatment Panel, of the National Cholesterol Education Program; BMI: body mass index; CAD: coronary artery disease; CDSS: computerised clinical decision support; CHD: coronary heart disease; CME: continuing medical education; CVD: cardiovascular disease; FRS: Framingham risk score; GHQ: general health questionnaire; HTN: hypertension; ITT: intention‐to‐treat; LDL: low‐density lipoprotein; MI: myocardial infarction; SBP: systolic blood pressure; TIA: transient ischaemic attack.
Characteristics of excluded studies [ordered by study ID]
| Study | Reason for exclusion |
| Risk score not part of the intervention | |
| Risk score not part of the intervention | |
| Risk score not part of the intervention (health risk appraisal) | |
| Risk score not part of the intervention | |
| Risk score not part of the intervention | |
| Risk score not part of the intervention | |
| Risk score not part of the intervention | |
| Risk score not part of the intervention | |
| Risk intervention used in both groups | |
| Risk score used in both groups | |
| Risk score not part of the intervention | |
| Risk score not part of the intervention | |
| Risk score not part of the intervention | |
| Risk score not part of the intervention | |
| Not primary prevention | |
| Risk score not part of the intervention | |
| Risk score used in both groups | |
| Not primary prevention | |
| Risk score not part of the intervention | |
| Risk score not part of the intervention | |
| Risk score not part of the intervention | |
| Risk score not part of the intervention | |
| Risk score not part of the intervention | |
| Clinical vignettes/hypothetical patients | |
| Risk score not part of the intervention | |
| Risk score used in both groups | |
| Risk score not part of the intervention | |
| Risk score not part of the intervention | |
| Not RCT or quasi‐RCT | |
| Risk score not part of the intervention | |
| Risk score not part of the intervention | |
| Risk score used in both groups | |
| Risk score used in both groups | |
| Risk score not part of the intervention | |
| Risk score not part of the intervention | |
| Risk score not part of the intervention | |
| Risk score not part of the intervention | |
| Risk score used in both groups | |
| Risk score not part of the intervention | |
| Not primary prevention | |
| Risk score not part of the intervention | |
| Not primary prevention | |
| Risk score used in both groups | |
| Risk score used in both groups | |
| Not RCT or quasi‐RCT | |
| Not RCT or quasi‐RCT | |
| Risk score used in both groups | |
| Risk score not part of the intervention | |
| Risk score not part of the intervention | |
| Risk score not part of the intervention | |
| Risk score not part of the intervention | |
| Risk score not part of the intervention | |
| Risk score not part of the intervention | |
| Risk score not part of the intervention | |
| Not primary prevention | |
| Not primary prevention | |
| Risk score used in both groups | |
| Not RCT or quasi‐RCT | |
| Not RCT or quasi‐RCT | |
| Not primary prevention | |
| Risk score used in both groups | |
| Risk score not part of the intervention | |
| Risk score used in both groups | |
| Risk score not part of the intervention | |
| Risk score used in both groups | |
| Risk score not part of the intervention | |
| Risk score not part of the intervention | |
| Risk score used in both groups | |
| Risk score not part of the intervention | |
| Not RCT or quasi‐RCT | |
| Not RCT or quasi‐RCT | |
| Not RCT or quasi‐RCT | |
| Not RCT or quasi‐RCT | |
| Not primary prevention | |
| Risk score used in both groups | |
| Not primary prevention | |
| Not primary prevention | |
| Not primary prevention | |
| Not RCT or quasi‐RCT |
RCT: randomised controlled trial.
Characteristics of studies awaiting classification [ordered by study ID]
| Methods | Randomised controlled trial, parallel group (1:1) |
| Participants | 31 participants attending a specialist diabetes clinic appointment at the Oxford Centre for Diabetes. Mean age: 51 years, 55% women, 100% diabetes mellitus |
| Interventions | Intervention group: received a facilitated discussion based on 10‐year coronary heart disease and stroke risk estimate generated by the UKPDS Risk engine Control group: received routine discussion of CVD risk factors |
| Outcomes | Participant satisfaction, measured by questionnaire and semi‐structured interviews |
| Notes | Abstract only, full report not published |
| Methods | Randomised controlled trial, parallel group (1:1) |
| Participants | 78 individuals with hypertension aged 30‐84 years Exclusion criteria: no prior MI, stroke, heart failure, or pregnancy Mean age 62 years, 55% women, 17% diabetes mellitus |
| Interventions | Intervention group: received information on their personalised estimated risk of heart disease and stroke and education about the utility of effective blood pressure management in decreasing their risk estimate. Control group: usual care |
| Outcomes | Primary outcome: adherence at baseline, 3, 6, and 12 months measured by pill counting and electronic pill bottles Secondary outcomes: blood pressure, self‐perception of cardiovascular and stroke risk, perceived benefit of treatment |
| Notes | Published abstract and scientific poster reviewed. Manuscript still in preparation |
| Methods | Randomised controlled trial, parallel group (1:1) |
| Participants | 144 type‐2 diabetics from 4 urban primary care clinics |
| Interventions | Intervention group: randomised to a Spanish‐language, tablet computer‐based CVD risk communication intervention incorporating the individual’s unique 10‐year CVD risk information. Comparison group: usual care |
| Outcomes | CVD risk discussion during clinic visit, medication change |
| Notes | Published abstract reviewed. Manuscript in preparation |
CVD: cardiovascular disease; MI: myocardial infarction; UKPDS: United Kingdom Prospective Diabetes Study.
Characteristics of ongoing studies [ordered by study ID]
| Study name | The INTEGRATE study |
| Methods | Stepped‐wedge randomised controlled trial |
| Participants | All eligible patients 45‐70 years of age from 40 general practices in the Netherlands with electronic medical records |
| Interventions | The intervention is the Personalized Prevention Approach for CardioMetabolic Risk (PPA CMR). An online risk estimation tool based on the FINDRISK score is used to screen for participants with increased CVD risk. Participants with a FINDRISK score above risk threshold are offered additional measurements by their GP. In clinic, a GP uses SCORE to assess 10‐year CVD risk and then provides participants with increased risk with tailored lifestyle advice and/or medication. Control group: wailting list control; do not receive risk score nor lifestyle advice; recieve intervention at 1 year. |
| Outcomes | Primary outcomes: number of newly detected participants with CVD; change in individual risk factors (smoking, physical inactivity, obesity, unhealthy diet, blood pressure, cholesterol levels); expected new participants with CVD and mortality at 5, 10, 20 years; cost‐effectiveness; non‐participation and compliance Secondary outcomes: difference in primary outcome at 5 years; willingness to change lifestyle; change in health status |
| Starting date | 1 April 2014 |
| Contact information | Professor N. J. de Wit Julius Health Centre UMC Utrecht Huispost Str. 6.131 PO Box 85500 3508 GA Utrecht Netherlands [email protected] |
| Notes | www.integrateproject.nl NTR4277, the Netherlands National Trial Register |
| Study name | Risk Or Benefit IN Screening for CArdiovascular disease (ROBINSCA) study |
| Methods | Population‐based randomised screening trial, parallel group (1:1:1) |
| Participants | 39,000 participants at increased risk for CVD |
| Interventions | Comparison of 3 cardiovascular screening strategies: classic risk screening based on the Systematic COronary Risk Evaluation (SCORE) model; screening for coronary artery calcium using computed tomography; usual care All groups will receive written general lifestyle advice. Individuals at increased risk for CVD based on classic risk assessment or coronary calcium will be referred to general practitioner for lifestyle advice or medical therapy |
| Outcomes | Primary outcome: cumulative 5‐year fatal and non‐fatal coronary heart disease Secondary outcomes: sensitivity of the screening tests, favorable and unfavorable effects of screening, cost‐effectiveness |
| Starting date | First quarter 2014 |
| Contact information | H.J. de Koning, Department of Public Health, Erasmus MC, University Medical Center Rotterdam, PO Box 2040, 3000 CA Rotterdam, The Netherlands |
| Notes | www.robinsca.nl |
| Study name | The CORE‐trial: a pragmatic randomized controlled trial in primary care investigating effectiveness and cost‐effectiveness of the Check Your Health Preventive Programme offered population‐wide to 30‐49 years |
| Methods | Pragmatic household‐cluster‐randomised trial |
| Participants | 10,505 participants aged 30‐49 years from 35 practices within central Denmark |
| Interventions | The intervention consists of a preventive health check that consists of a health examination and individual risk profile (Heart‐SCORE model) during a single office visit. Follow‐up visits are stratified by risk profile to a health promoting consultation, behavioural programme, or no follow‐up Comparison group: standard prevention and treatment strategy |
| Outcomes | Primary outcomes: 10‐year risk of fatal CVD, physical activity (self‐report and cardiorespiratory fitness), health‐related quality of life, functional capacity (affiliation to the labour market and sick leave > 3 weeks) Secondary outcomes: cost‐effectiveness as measured by life‐years gained, direct costs, and total health cost |
| Starting date | May 2013; anticipated completion April 2017 |
| Contact information | Annelli Sandbæk, PhD Professor, Department of Public Health, University of Aarhus; [email protected] Helle T Maindal, PhD, Associate Professor, Department of Public Health, University of Aarhus; [email protected] |
| Notes | ClinicalTrials.gov ID: NCT02028195 |
| Study name | Risk Assessment and Treat Compliance in Hypertension Education Trial (RATCHET) |
| Methods | Randomised controlled trial, parallel group (1:1) |
| Participants | Adults aged 30‐84 years Inclusion criteria: essential hypertension (new diagnosis or established diagnosis) meeting criteria for pharmacologic therapy as defined by current guidelines. Exclusion criteria: lack of written informed consent, previous myocardial infarction, previous stroke, congestive heart failure, stage 3 or greater chronic kidney disease, pregnancy, use of medication bubble/blister package |
| Interventions | Intervention group: knowledge of cardiovascular risk assessment plus standard care Control group: standard/usual care |
| Outcomes | Primary outcome: medication compliance Secondary outcomes: patient perception of cardiovascular risk, pilot feasibility study, blood pressure, cholesterol level, Framingham risk score Follow‐up: 1 year |
| Starting date | May 2007 |
| Contact information | George Dresser University of Western Ontario, Canada LHSC Victoria Hospital, Rm E6‐302 519.685.8500 ext.33342 |
| Notes | Anticipated completion date March 2011 but no results posted yet |
| Study name | Effect of Patient Education on Compliance and Cardiovascular Risk Parameters (FAILAKA) |
| Methods | Cluster‐randomised controlled trial, parallel group (1:1) |
| Participants | Adults aged 30‐70 years Inclusion criteria:
Exclusion criteria:
|
| Interventions | Intervention group: participants attending clinics randomised to structured patient education will receive education targeting their risk factors and receive information about evidence‐based targets. Physician in education clinics will also calculate Framingham risk score and provide a booklet entitled, 'Know your numbers'. Control group: usual care |
| Outcomes | Primary outcome: cardiovascular risk factor control (HbA1c, blood pressure, LDL‐cholesterol, body mass index, and smoking cessation) Medication compliance: assessed by Morisky scale |
| Starting date | June 2014 |
| Contact information | Dr. Samia Almusallam Director of the Family Medicine residency programme Kuwait Institute for Medical Specialization |
| Notes | Anticipated completion date January 2016 but no results posted |
| Study name | Task shifting and blood pressure control in Ghana: a cluster‐randomized trial |
| Methods | Cluster‐randomised trial, parallel group (1:1) assignment |
| Participants | 640 participants with uncomplicated hypertension (BP 140‐179/90‐99 mmHg and absence of target organ damage) from 32 community health centres and district hospitals in Ghana |
| Interventions | The intervention consists of WHO Package CV risk assessment, patient education, initiation and titration of antihypertensive medications, behavioural counselling, and assessment of barriers to adherence Comparison group: usual care |
| Outcomes | Primary outcome: mean change in systolic blood pressure from baseline to 12 months Secondary outcomes: proportion of participants with adequate systolic blood pressure control at 12 months; levels of physical activity; percent change in weight; and dietary intake of fruits and vegetables at 12 months |
| Starting date | May 2013; completion date March 2017 |
| Contact information | Gbenga Ogedegbe, MD, MS, MPH, Center for Healthful Behavior Change, Division of Health & Behavior, Department of Population Health, New York University School of Medicine, 550 1st Avenue, New York, NY 10016 |
| Notes | ClinicalTrials.gov ID: NCT01802372 |
| Study name | Systematic Appraisal Referral and Treatment of CVD risk in rural India (SMARTHealth India) |
| Methods | Stepped wedge cluster‐randomised trial |
| Participants | 15,000 adults age 40 years and older at high cardiovascular disease risk from 18 primary health centres and 54 villages in rural Andhra Pradesh |
| Interventions | Intervention group: a mobile device‐based clinical decision support system for non‐physician healthcare workers and primary care doctors to assess and manage CVD risk, provide lifestyle advice, and manage risk factors according to Indian national guidelines. Comparison group: usual care |
| Outcomes | The primary study outcome is the difference in the proportion of people meeting guideline‐recommended blood pressure targets in the intervention period vs the control period. Secondary outcomes include mean reduction in blood pressure levels; change in cardiovascular disease risk factors (BMI, smoking, healthy eating habits, physical activity, self‐reported use of BP and other cardiovascular medicines, quality of life), and CVD event rates (hospitalisation data). |
| Starting date | Fourth quarter of 2013; randomisation planned to continue until first quarter of 2016 |
| Contact information | Devarsetty Praveen, the George Institute for Global Health, Hyderabad, India, [email protected] |
| Notes | — |
| Study name | Consumer Navigation of Electronic Cardiovascular Tools (CONNECT) study |
| Methods | Randomised controlled trial, parallel group (1:1) |
| Participants | 2000 regular adult health service attendees at Australian general practice or Aboriginal Community Controlled Health Services |
| Interventions | Intervention group: will be able to securely access a consumer portal to view participant data uploaded from the clinic record, use interactive tools to view their personal CVD risk and explore relative risk reductions from various CVD management strategies, access healthy lifestyle reminders and motivational message prompts, and connect with peers to set healthy lifestyle goals. Comparison group: usual care |
| Outcomes | Primary outcome: proportion of participants meeting the Australian guideline BP and lipid targets. |
| Starting date | October 2014; still recruiting |
| Contact information | Professor Julie Redfern, the George Institute for Global Health, Level 10, King George V Building, Missenden Road, Camperdown NSW 2050, Australia |
| Notes | Australian New Zealand Clinical Trials Registry number: ACTRN12613000715774 |
| Study name | Million hearts: cardiovascular disease risk reduction model |
| Methods | Cluster‐randomised trial (1:1) parallel group |
| Participants | 720 general medical practices, Medicare fee‐for‐service beneficiaries aged 18‐79 years of age without history of myocardial infarction or stroke |
| Interventions | Intervention group: practices will be asked to screen all eligible Medicare beneficiaries for their 10‐year risk of a heart attack or stroke using the American College of Cardiology/American Heart Association (ACC/AHA) 10‐year Atherosclerotic Cardiovascular Disease (ASCVD) pooled cohort risk calculator. For participants at the highest risk (10‐year ASCVD risk > 30%), providers will receive a monthly per beneficiary Cardiovascular Care Management payment to reduce their practice‐wide absolute risk |
| Outcomes | Population‐wide reduction in 10‐year composite risk and population‐wide reduction in composite incidence of myocardial infarction and stroke. Trial is powered for latter outcome based on Medicare fee‐for‐service claims data. |
| Starting date | January 2016 reported. Trial has not started yet. |
| Contact information | Darshak M Sanghavi, MD, Centers for Medicare and Medicaid Services, Prevention and Population Health Models Group, 7500 Security Blvd, Baltimore, MD 21244 |
| Notes | Trial conducted by Center for Medicare and Medicaid Innovation |
| Study name | Information and Risk Modification Trial (INFORM) |
| Methods | Randomised controlled trial, parallel group (1:1:1:1) |
| Participants | 932 men and women blood donors with no previous history of CVD aged 40‐94 years in England. |
| Interventions | 4 groups:
|
| Outcomes | Primary outcome: change in objectively measured physical activity Secondary outcomes: objectively measured dietary behaviours, CVD risk factors, medication and healthcare usage, perceived risk, cognitive evaluation of provision of CHD risk scores, psychological outcomes |
| Starting date | January 2015 |
| Contact information | Professor Simon Griffin, Cambridge Institute of Public Health, University of Cambridge School of Clinical Medicine Forvie Site, Cambridge Biomedical Campus, Cambridge CB2 0SR, United Kingdom |
| Notes | Participants who took part in the INTERVAL study (www.intervalstudy.org.uk, ISRCTN24760606) and completed their 2‐year questionnaire participate in the INFORM study. |
CVD: cardiovascular disease.
Data and analyses
| Outcome or subgroup title | No. of studies | No. of participants | Statistical method | Effect size |
| 1.1 CVD events Show forest plot | 3 | 99070 | Risk Ratio (IV, Fixed, 95% CI) | 1.01 [0.95, 1.08] |
| Analysis 1.1  Comparison 1: CVD risk score versus no CVD risk score/usual care, Outcome 1: CVD events | ||||
| 1.2 CVD events, excluding Bucher 2010 Show forest plot | 2 | 95708 | Risk Ratio (IV, Fixed, 95% CI) | 1.01 [0.94, 1.08] |
| Analysis 1.2  Comparison 1: CVD risk score versus no CVD risk score/usual care, Outcome 2: CVD events, excluding Bucher 2010 | ||||
| 1.3 Total cholesterol Show forest plot | 12 | 20437 | Mean Difference (IV, Random, 95% CI) | ‐0.10 [‐0.20, 0.00] |
| Analysis 1.3  Comparison 1: CVD risk score versus no CVD risk score/usual care, Outcome 3: Total cholesterol | ||||
| 1.4 Low‐density lipoprotein cholesterol Show forest plot | 10 | 22122 | Mean Difference (IV, Random, 95% CI) | ‐0.03 [‐0.10, 0.04] |
| Analysis 1.4  Comparison 1: CVD risk score versus no CVD risk score/usual care, Outcome 4: Low‐density lipoprotein cholesterol | ||||
| 1.5 Systolic blood pressure Show forest plot | 16 | 32954 | Mean Difference (IV, Random, 95% CI) | ‐2.77 [‐4.16, ‐1.38] |
| Analysis 1.5  Comparison 1: CVD risk score versus no CVD risk score/usual care, Outcome 5: Systolic blood pressure | ||||
| 1.6 Diastolic blood pressure Show forest plot | 14 | 22378 | Mean Difference (IV, Random, 95% CI) | ‐1.12 [‐2.11, ‐0.13] |
| Analysis 1.6  Comparison 1: CVD risk score versus no CVD risk score/usual care, Outcome 6: Diastolic blood pressure | ||||
| 1.7 Change in multivariable CVD risk Show forest plot | 9 | 9549 | Std. Mean Difference (IV, Random, 95% CI) | ‐0.21 [‐0.39, ‐0.02] |
| Analysis 1.7  Comparison 1: CVD risk score versus no CVD risk score/usual care, Outcome 7: Change in multivariable CVD risk | ||||
| 1.8 Adverse events (investigator defined) Show forest plot | 4 | 4630 | Risk Ratio (IV, Fixed, 95% CI) | 0.72 [0.49, 1.04] |
| Analysis 1.8  Comparison 1: CVD risk score versus no CVD risk score/usual care, Outcome 8: Adverse events (investigator defined) | ||||
| 1.9 Anxiety Show forest plot | 2 | 388 | Std. Mean Difference (IV, Fixed, 95% CI) | ‐0.07 [‐0.27, 0.13] |
| Analysis 1.9  Comparison 1: CVD risk score versus no CVD risk score/usual care, Outcome 9: Anxiety | ||||
| 1.10 New/intensified lipid‐lowering medication Show forest plot | 11 | 14175 | Risk Ratio (IV, Random, 95% CI) | 1.47 [1.15, 1.87] |
| Analysis 1.10  Comparison 1: CVD risk score versus no CVD risk score/usual care, Outcome 10: New/intensified lipid‐lowering medication | ||||
| 1.11 New/intensified antihypertensive medication Show forest plot | 8 | 13255 | Risk Ratio (IV, Random, 95% CI) | 1.51 [1.08, 2.11] |
| Analysis 1.11  Comparison 1: CVD risk score versus no CVD risk score/usual care, Outcome 11: New/intensified antihypertensive medication | ||||
| 1.12 New aspirin Show forest plot | 3 | 1614 | Risk Ratio (IV, Fixed, 95% CI) | 2.71 [1.24, 5.91] |
| Analysis 1.12  Comparison 1: CVD risk score versus no CVD risk score/usual care, Outcome 12: New aspirin | ||||
| 1.13 Medication adherence Show forest plot | 4 | 621 | Risk Ratio (IV, Random, 95% CI) | 1.14 [0.92, 1.40] |
| Analysis 1.13  Comparison 1: CVD risk score versus no CVD risk score/usual care, Outcome 13: Medication adherence | ||||
| 1.14 Smoking cessation Show forest plot | 7 | 5346 | Risk Ratio (IV, Fixed, 95% CI) | 1.38 [1.13, 1.69] |
| Analysis 1.14  Comparison 1: CVD risk score versus no CVD risk score/usual care, Outcome 14: Smoking cessation | ||||
| 1.15 Exercise Show forest plot | 2 | 2595 | Risk Ratio (IV, Fixed, 95% CI) | 0.98 [0.90, 1.06] |
| Analysis 1.15  Comparison 1: CVD risk score versus no CVD risk score/usual care, Outcome 15: Exercise | ||||
| 1.16 Decisional conflict Show forest plot | 4 | 1261 | Std. Mean Difference (IV, Random, 95% CI) | ‐0.29 [‐0.57, ‐0.01] |
| Analysis 1.16  Comparison 1: CVD risk score versus no CVD risk score/usual care, Outcome 16: Decisional conflict | ||||
| Outcome or subgroup title | No. of studies | No. of participants | Statistical method | Effect size |
| 2.1 Total cholesterol by decision support use Show forest plot | 12 | 20437 | Mean Difference (IV, Random, 95% CI) | ‐0.10 [‐0.20, 0.00] |
| Analysis 2.1  Comparison 2: CVD risk score versus no CVD risk score/usual care by decision support use, Outcome 1: Total cholesterol by decision support use | ||||
| 2.1.1 Decision support use | 8 | 9444 | Mean Difference (IV, Random, 95% CI) | ‐0.09 [‐0.20, 0.01] |
| 2.1.2 No decision support use | 4 | 10993 | Mean Difference (IV, Random, 95% CI) | ‐0.11 [‐0.27, 0.06] |
| 2.2 Low‐density lipoprotein cholesterol by decision support Show forest plot | 10 | 22122 | Mean Difference (IV, Random, 95% CI) | ‐0.03 [‐0.10, 0.04] |
| Analysis 2.2  Comparison 2: CVD risk score versus no CVD risk score/usual care by decision support use, Outcome 2: Low‐density lipoprotein cholesterol by decision support | ||||
| 2.2.1 Decision support use | 9 | 21739 | Mean Difference (IV, Random, 95% CI) | ‐0.02 [‐0.10, 0.06] |
| 2.2.2 No decision support use | 1 | 383 | Mean Difference (IV, Random, 95% CI) | ‐0.11 [‐0.25, 0.03] |
| 2.3 Systolic blood pressure by decision support use Show forest plot | 16 | 32954 | Mean Difference (IV, Random, 95% CI) | ‐2.77 [‐4.16, ‐1.38] |
| Analysis 2.3  Comparison 2: CVD risk score versus no CVD risk score/usual care by decision support use, Outcome 3: Systolic blood pressure by decision support use | ||||
| 2.3.1 Decision support use | 13 | 22457 | Mean Difference (IV, Random, 95% CI) | ‐2.17 [‐3.52, ‐0.82] |
| 2.3.2 No decision support use | 3 | 10497 | Mean Difference (IV, Random, 95% CI) | ‐4.57 [‐6.89, ‐2.25] |
| 2.4 Diastolic blood pressure by decision support use Show forest plot | 14 | 22378 | Mean Difference (IV, Random, 95% CI) | ‐1.12 [‐2.11, ‐0.13] |
| Analysis 2.4  Comparison 2: CVD risk score versus no CVD risk score/usual care by decision support use, Outcome 4: Diastolic blood pressure by decision support use | ||||
| 2.4.1 Decision support use | 10 | 11385 | Mean Difference (IV, Random, 95% CI) | ‐0.76 [‐1.29, ‐0.23] |
| 2.4.2 No decision support use | 4 | 10993 | Mean Difference (IV, Random, 95% CI) | ‐2.09 [‐3.33, ‐0.85] |
| 2.5 Change in multivariable CVD risk by decision support Show forest plot | 9 | 9549 | Std. Mean Difference (IV, Random, 95% CI) | ‐0.21 [‐0.39, ‐0.02] |
| Analysis 2.5  Comparison 2: CVD risk score versus no CVD risk score/usual care by decision support use, Outcome 5: Change in multivariable CVD risk by decision support | ||||
| 2.5.1 Decision support use | 7 | 6209 | Std. Mean Difference (IV, Random, 95% CI) | ‐0.17 [‐0.27, ‐0.07] |
| 2.5.2 No decision support use | 2 | 3340 | Std. Mean Difference (IV, Random, 95% CI) | ‐0.26 [‐0.98, 0.46] |
| Outcome or subgroup title | No. of studies | No. of participants | Statistical method | Effect size |
| 3.1 Total cholesterol by health IT use Show forest plot | 12 | 20437 | Mean Difference (IV, Random, 95% CI) | ‐0.10 [‐0.20, 0.00] |
| Analysis 3.1  Comparison 3: CVD risk score versus no CVD risk score/usual care by health IT use, Outcome 1: Total cholesterol by health IT use | ||||
| 3.1.1 Health IT use | 8 | 9444 | Mean Difference (IV, Random, 95% CI) | ‐0.09 [‐0.20, 0.01] |
| 3.1.2 No health IT use | 4 | 10993 | Mean Difference (IV, Random, 95% CI) | ‐0.11 [‐0.27, 0.06] |
| 3.2 Low‐density lipoprotein cholesterol by health IT use Show forest plot | 10 | 22122 | Mean Difference (IV, Random, 95% CI) | ‐0.03 [‐0.10, 0.04] |
| Analysis 3.2  Comparison 3: CVD risk score versus no CVD risk score/usual care by health IT use, Outcome 2: Low‐density lipoprotein cholesterol by health IT use | ||||
| 3.2.1 Health IT use | 9 | 21739 | Mean Difference (IV, Random, 95% CI) | ‐0.02 [‐0.10, 0.06] |
| 3.2.2 No health IT use | 1 | 383 | Mean Difference (IV, Random, 95% CI) | ‐0.11 [‐0.25, 0.03] |
| 3.3 Systolic blood pressure by health IT use Show forest plot | 16 | 32954 | Mean Difference (IV, Random, 95% CI) | ‐2.77 [‐4.16, ‐1.38] |
| Analysis 3.3  Comparison 3: CVD risk score versus no CVD risk score/usual care by health IT use, Outcome 3: Systolic blood pressure by health IT use | ||||
| 3.3.1 Health IT use | 13 | 22457 | Mean Difference (IV, Random, 95% CI) | ‐2.17 [‐3.52, ‐0.82] |
| 3.3.2 No health IT use | 3 | 10497 | Mean Difference (IV, Random, 95% CI) | ‐4.57 [‐6.89, ‐2.25] |
| 3.4 Diastolic blood pressure by health IT use Show forest plot | 14 | 22378 | Mean Difference (IV, Random, 95% CI) | ‐1.12 [‐2.11, ‐0.13] |
| Analysis 3.4  Comparison 3: CVD risk score versus no CVD risk score/usual care by health IT use, Outcome 4: Diastolic blood pressure by health IT use | ||||
| 3.4.1 Health IT use | 10 | 11385 | Mean Difference (IV, Random, 95% CI) | ‐0.76 [‐1.29, ‐0.23] |
| 3.4.2 No health IT use | 4 | 10993 | Mean Difference (IV, Random, 95% CI) | ‐2.09 [‐3.33, ‐0.85] |
| 3.5 Change in multivariable CVD risk by health IT use Show forest plot | 9 | 9549 | Std. Mean Difference (IV, Random, 95% CI) | ‐0.21 [‐0.39, ‐0.02] |
| Analysis 3.5  Comparison 3: CVD risk score versus no CVD risk score/usual care by health IT use, Outcome 5: Change in multivariable CVD risk by health IT use | ||||
| 3.5.1 Health IT use | 6 | 5387 | Std. Mean Difference (IV, Random, 95% CI) | ‐0.19 [‐0.26, ‐0.12] |
| 3.5.2 No health IT use | 3 | 4162 | Std. Mean Difference (IV, Random, 95% CI) | ‐0.15 [‐0.69, 0.39] |
| Outcome or subgroup title | No. of studies | No. of participants | Statistical method | Effect size |
| 4.1 Total cholesterol by risk status Show forest plot | 12 | 20437 | Mean Difference (IV, Random, 95% CI) | ‐0.10 [‐0.20, 0.00] |
| Analysis 4.1  Comparison 4: CVD risk score versus no CVD risk score/usual care by risk status of participants, Outcome 1: Total cholesterol by risk status | ||||
| 4.1.1 High‐risk participants only | 3 | 4105 | Mean Difference (IV, Random, 95% CI) | ‐0.13 [‐0.22, ‐0.03] |
| 4.1.2 Participants of all risk levels | 9 | 16332 | Mean Difference (IV, Random, 95% CI) | ‐0.10 [‐0.23, 0.03] |
| 4.2 Low‐density lipoprotein cholesterol by risk status Show forest plot | 10 | 22122 | Mean Difference (IV, Random, 95% CI) | ‐0.03 [‐0.10, 0.04] |
| Analysis 4.2  Comparison 4: CVD risk score versus no CVD risk score/usual care by risk status of participants, Outcome 2: Low‐density lipoprotein cholesterol by risk status | ||||
| 4.2.1 High‐risk participants only | 3 | 14219 | Mean Difference (IV, Random, 95% CI) | ‐0.07 [‐0.11, ‐0.03] |
| 4.2.2 Participants of all risk levels | 7 | 7903 | Mean Difference (IV, Random, 95% CI) | ‐0.01 [‐0.11, 0.09] |
| 4.3 Systolic blood pressure by risk status Show forest plot | 16 | 32954 | Mean Difference (IV, Random, 95% CI) | ‐2.77 [‐4.16, ‐1.38] |
| Analysis 4.3  Comparison 4: CVD risk score versus no CVD risk score/usual care by risk status of participants, Outcome 3: Systolic blood pressure by risk status | ||||
| 4.3.1 High‐risk participants only | 5 | 18375 | Mean Difference (IV, Random, 95% CI) | ‐2.22 [‐4.04, ‐0.40] |
| 4.3.2 Participants of all risk levels | 11 | 14579 | Mean Difference (IV, Random, 95% CI) | ‐2.96 [‐4.68, ‐1.24] |
| 4.4 Diastolic blood pressure by risk status Show forest plot | 14 | 22378 | Mean Difference (IV, Random, 95% CI) | ‐1.12 [‐2.11, ‐0.13] |
| Analysis 4.4  Comparison 4: CVD risk score versus no CVD risk score/usual care by risk status of participants, Outcome 4: Diastolic blood pressure by risk status | ||||
| 4.4.1 High‐risk participants only | 3 | 4091 | Mean Difference (IV, Random, 95% CI) | ‐0.90 [‐2.42, 0.63] |
| 4.4.2 Participants of all risk levels | 11 | 18287 | Mean Difference (IV, Random, 95% CI) | ‐1.20 [‐2.26, ‐0.14] |
| 4.5 Change in multivariable CVD risk by risk status Show forest plot | 9 | 9549 | Std. Mean Difference (IV, Random, 95% CI) | ‐0.21 [‐0.39, ‐0.02] |
| Analysis 4.5  Comparison 4: CVD risk score versus no CVD risk score/usual care by risk status of participants, Outcome 5: Change in multivariable CVD risk by risk status | ||||
| 4.5.1 High‐risk participants only | 2 | 4038 | Std. Mean Difference (IV, Random, 95% CI) | ‐0.15 [‐0.21, ‐0.09] |
| 4.5.2 Participants of all risk levels | 7 | 5511 | Std. Mean Difference (IV, Random, 95% CI) | ‐0.22 [‐0.49, 0.05] |
| Outcome or subgroup title | No. of studies | No. of participants | Statistical method | Effect size |
| 5.1 Multivariable CVD risk Show forest plot | 5 | 1921 | Std. Mean Difference (IV, Fixed, 95% CI) | ‐0.15 [‐0.25, ‐0.06] |
| Analysis 5.1  Comparison 5: Multivariable CVD risk, Outcome 1: Multivariable CVD risk | ||||
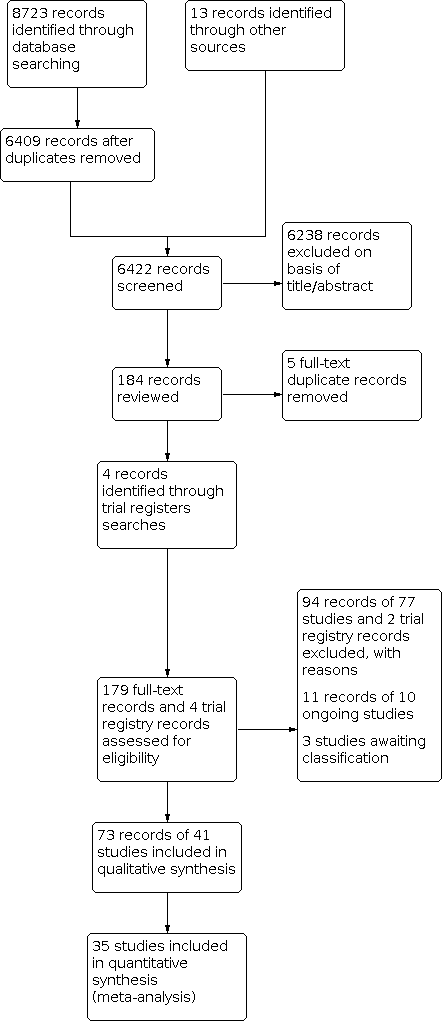
Study flow diagram.

Summary of CVD risk score interventions by included study.
Abbreviations: CHD: coronary heart disease; CVD: cardiovascular disease; FRS: Framingham risk score; MI: myocardial infarction; RF: risk factors, RR: risk ratio; UKPDS: United Kingdom Prospective Diabetes Study

Risk of bias summary: review authors' judgements about each risk of bias item for each included study.

Risk of bias graph: review authors' judgements about each risk of bias item presented as percentages across all included studies.

Funnel plot of comparison: 1 CVD risk score versus no CVD risk score/usual care, outcome: 1.3 Total cholesterol (mmol/L).

Funnel plot of comparison: 1 CVD risk score versus no CVD risk score/usual care, outcome: 1.5 Systolic blood pressure (mmHg).

Funnel plot of comparison: 1 CVD risk score versus no CVD risk score/usual care, outcome: 1.7 Change in multivariable CVD risk.

Comparison 1: CVD risk score versus no CVD risk score/usual care, Outcome 1: CVD events

Comparison 1: CVD risk score versus no CVD risk score/usual care, Outcome 2: CVD events, excluding Bucher 2010

Comparison 1: CVD risk score versus no CVD risk score/usual care, Outcome 3: Total cholesterol

Comparison 1: CVD risk score versus no CVD risk score/usual care, Outcome 4: Low‐density lipoprotein cholesterol

Comparison 1: CVD risk score versus no CVD risk score/usual care, Outcome 5: Systolic blood pressure

Comparison 1: CVD risk score versus no CVD risk score/usual care, Outcome 6: Diastolic blood pressure

Comparison 1: CVD risk score versus no CVD risk score/usual care, Outcome 7: Change in multivariable CVD risk

Comparison 1: CVD risk score versus no CVD risk score/usual care, Outcome 8: Adverse events (investigator defined)

Comparison 1: CVD risk score versus no CVD risk score/usual care, Outcome 9: Anxiety

Comparison 1: CVD risk score versus no CVD risk score/usual care, Outcome 10: New/intensified lipid‐lowering medication

Comparison 1: CVD risk score versus no CVD risk score/usual care, Outcome 11: New/intensified antihypertensive medication

Comparison 1: CVD risk score versus no CVD risk score/usual care, Outcome 12: New aspirin

Comparison 1: CVD risk score versus no CVD risk score/usual care, Outcome 13: Medication adherence

Comparison 1: CVD risk score versus no CVD risk score/usual care, Outcome 14: Smoking cessation

Comparison 1: CVD risk score versus no CVD risk score/usual care, Outcome 15: Exercise

Comparison 1: CVD risk score versus no CVD risk score/usual care, Outcome 16: Decisional conflict

Comparison 2: CVD risk score versus no CVD risk score/usual care by decision support use, Outcome 1: Total cholesterol by decision support use

Comparison 2: CVD risk score versus no CVD risk score/usual care by decision support use, Outcome 2: Low‐density lipoprotein cholesterol by decision support

Comparison 2: CVD risk score versus no CVD risk score/usual care by decision support use, Outcome 3: Systolic blood pressure by decision support use

Comparison 2: CVD risk score versus no CVD risk score/usual care by decision support use, Outcome 4: Diastolic blood pressure by decision support use

Comparison 2: CVD risk score versus no CVD risk score/usual care by decision support use, Outcome 5: Change in multivariable CVD risk by decision support

Comparison 3: CVD risk score versus no CVD risk score/usual care by health IT use, Outcome 1: Total cholesterol by health IT use

Comparison 3: CVD risk score versus no CVD risk score/usual care by health IT use, Outcome 2: Low‐density lipoprotein cholesterol by health IT use

Comparison 3: CVD risk score versus no CVD risk score/usual care by health IT use, Outcome 3: Systolic blood pressure by health IT use

Comparison 3: CVD risk score versus no CVD risk score/usual care by health IT use, Outcome 4: Diastolic blood pressure by health IT use

Comparison 3: CVD risk score versus no CVD risk score/usual care by health IT use, Outcome 5: Change in multivariable CVD risk by health IT use

Comparison 4: CVD risk score versus no CVD risk score/usual care by risk status of participants, Outcome 1: Total cholesterol by risk status

Comparison 4: CVD risk score versus no CVD risk score/usual care by risk status of participants, Outcome 2: Low‐density lipoprotein cholesterol by risk status

Comparison 4: CVD risk score versus no CVD risk score/usual care by risk status of participants, Outcome 3: Systolic blood pressure by risk status

Comparison 4: CVD risk score versus no CVD risk score/usual care by risk status of participants, Outcome 4: Diastolic blood pressure by risk status

Comparison 4: CVD risk score versus no CVD risk score/usual care by risk status of participants, Outcome 5: Change in multivariable CVD risk by risk status

Comparison 5: Multivariable CVD risk, Outcome 1: Multivariable CVD risk
| CVD risk scoring for the primary prevention of cardiovascular disease | ||||||
| Patient or population: adults without prevalent cardiovascular disease (primary cardiovascular disease prevention) | ||||||
| Outcomes | Anticipated absolute effects* (95% CI) | Relative effect | N of participants | Quality of the evidence | Comments | |
|---|---|---|---|---|---|---|
| Risk with not providing CVD risk scores/usual care | Risk with providing CVD risk scores | |||||
| CVD events | Study population | RR 1.01 | 99,070 | ⊕⊕⊝⊝ | — | |
| 53 per 1000 | 54 per 1000 | |||||
| Total cholesterol (mmol/L) | In the comparison group, the range of mean total cholesterol level was 5.1 to 6.6 mmol/L and the range of mean change from baseline in total cholesterol level was 0.09 lower to 0.14 mmol/L higher | The mean difference in total cholesterol in the intervention group was 0.10 mmol/L lower | — | 20,437 | ⊕⊕⊝⊝ | — |
| Systolic blood pressure (mmHg) | In the comparison group, the range of mean systolic blood pressure level was 124.1 to 159.0 mmHg and the range of mean change from baseline in systolic blood pressure level was 5.3 lower to 1.0 higher mmHg | The mean difference in systolic blood pressure in the intervention group was 2.77 mmHg lower | — | 32,954 | ⊕⊕⊝⊝ | — |
| Change in multivariable CVD risk (SD) | In the comparison group, the range of mean change from baseline in multivariable CVD risk was 5.3 lower to 0.77 higher SDs | The mean difference in multivariable CVD risk in the intervention group was 0.21 SDs lower | — | 9549 | ⊕⊕⊝⊝ | Standardised mean differences were calculated for this outcome due to the use of different multivariable CVD risk scales. An effect size of ~0.20 SD units reflects a small effect. |
| Investigator‐defined adverse events | Study population | RR 0.72 | 4630 | ⊕⊕⊝⊝ | Adverse events were defined heterogeneously by investigators and included some events that may have been due to newly prescribed medications rather than the provision of a CVD risk score itself. | |
| 27 per 1000 | 19 per 1000 | |||||
| New/intensified lipid‐lowering medication | Study population | RR 1.47 | 14,175 | ⊕⊕⊝⊝ | Prescribing rates in the comparison group varied among the included trials (range 4% to 22%). Median prescribing rate presented | |
| 107 per 1000 | 157 per 1000 | |||||
| New/intensified antihypertensive medication | Study population | RR 1.51 | 13,255 | ⊕⊕⊝⊝ | Prescribing rates in the comparison group varied among the included trials (range 0% to 27%). Median prescribing rate presented | |
| 114 per 1000 | 172 per 1000 | |||||
| *The risk in the intervention group (and its 95% confidence interval) is based on the assumed risk in the comparison group and the relative effect of the intervention (and its 95% CI). | ||||||
| GRADE Working Group grades of evidence | ||||||
| aDowngraded due to study limitations, primarily driven by high risk of selection bias in Holt 2010 and high risk of reporting bias in Bucher 2010 and Jorgensen 2014. | ||||||
| Outcome or subgroup title | No. of studies | No. of participants | Statistical method | Effect size |
| 1.1 CVD events Show forest plot | 3 | 99070 | Risk Ratio (IV, Fixed, 95% CI) | 1.01 [0.95, 1.08] |
| 1.2 CVD events, excluding Bucher 2010 Show forest plot | 2 | 95708 | Risk Ratio (IV, Fixed, 95% CI) | 1.01 [0.94, 1.08] |
| 1.3 Total cholesterol Show forest plot | 12 | 20437 | Mean Difference (IV, Random, 95% CI) | ‐0.10 [‐0.20, 0.00] |
| 1.4 Low‐density lipoprotein cholesterol Show forest plot | 10 | 22122 | Mean Difference (IV, Random, 95% CI) | ‐0.03 [‐0.10, 0.04] |
| 1.5 Systolic blood pressure Show forest plot | 16 | 32954 | Mean Difference (IV, Random, 95% CI) | ‐2.77 [‐4.16, ‐1.38] |
| 1.6 Diastolic blood pressure Show forest plot | 14 | 22378 | Mean Difference (IV, Random, 95% CI) | ‐1.12 [‐2.11, ‐0.13] |
| 1.7 Change in multivariable CVD risk Show forest plot | 9 | 9549 | Std. Mean Difference (IV, Random, 95% CI) | ‐0.21 [‐0.39, ‐0.02] |
| 1.8 Adverse events (investigator defined) Show forest plot | 4 | 4630 | Risk Ratio (IV, Fixed, 95% CI) | 0.72 [0.49, 1.04] |
| 1.9 Anxiety Show forest plot | 2 | 388 | Std. Mean Difference (IV, Fixed, 95% CI) | ‐0.07 [‐0.27, 0.13] |
| 1.10 New/intensified lipid‐lowering medication Show forest plot | 11 | 14175 | Risk Ratio (IV, Random, 95% CI) | 1.47 [1.15, 1.87] |
| 1.11 New/intensified antihypertensive medication Show forest plot | 8 | 13255 | Risk Ratio (IV, Random, 95% CI) | 1.51 [1.08, 2.11] |
| 1.12 New aspirin Show forest plot | 3 | 1614 | Risk Ratio (IV, Fixed, 95% CI) | 2.71 [1.24, 5.91] |
| 1.13 Medication adherence Show forest plot | 4 | 621 | Risk Ratio (IV, Random, 95% CI) | 1.14 [0.92, 1.40] |
| 1.14 Smoking cessation Show forest plot | 7 | 5346 | Risk Ratio (IV, Fixed, 95% CI) | 1.38 [1.13, 1.69] |
| 1.15 Exercise Show forest plot | 2 | 2595 | Risk Ratio (IV, Fixed, 95% CI) | 0.98 [0.90, 1.06] |
| 1.16 Decisional conflict Show forest plot | 4 | 1261 | Std. Mean Difference (IV, Random, 95% CI) | ‐0.29 [‐0.57, ‐0.01] |
| Outcome or subgroup title | No. of studies | No. of participants | Statistical method | Effect size |
| 2.1 Total cholesterol by decision support use Show forest plot | 12 | 20437 | Mean Difference (IV, Random, 95% CI) | ‐0.10 [‐0.20, 0.00] |
| 2.1.1 Decision support use | 8 | 9444 | Mean Difference (IV, Random, 95% CI) | ‐0.09 [‐0.20, 0.01] |
| 2.1.2 No decision support use | 4 | 10993 | Mean Difference (IV, Random, 95% CI) | ‐0.11 [‐0.27, 0.06] |
| 2.2 Low‐density lipoprotein cholesterol by decision support Show forest plot | 10 | 22122 | Mean Difference (IV, Random, 95% CI) | ‐0.03 [‐0.10, 0.04] |
| 2.2.1 Decision support use | 9 | 21739 | Mean Difference (IV, Random, 95% CI) | ‐0.02 [‐0.10, 0.06] |
| 2.2.2 No decision support use | 1 | 383 | Mean Difference (IV, Random, 95% CI) | ‐0.11 [‐0.25, 0.03] |
| 2.3 Systolic blood pressure by decision support use Show forest plot | 16 | 32954 | Mean Difference (IV, Random, 95% CI) | ‐2.77 [‐4.16, ‐1.38] |
| 2.3.1 Decision support use | 13 | 22457 | Mean Difference (IV, Random, 95% CI) | ‐2.17 [‐3.52, ‐0.82] |
| 2.3.2 No decision support use | 3 | 10497 | Mean Difference (IV, Random, 95% CI) | ‐4.57 [‐6.89, ‐2.25] |
| 2.4 Diastolic blood pressure by decision support use Show forest plot | 14 | 22378 | Mean Difference (IV, Random, 95% CI) | ‐1.12 [‐2.11, ‐0.13] |
| 2.4.1 Decision support use | 10 | 11385 | Mean Difference (IV, Random, 95% CI) | ‐0.76 [‐1.29, ‐0.23] |
| 2.4.2 No decision support use | 4 | 10993 | Mean Difference (IV, Random, 95% CI) | ‐2.09 [‐3.33, ‐0.85] |
| 2.5 Change in multivariable CVD risk by decision support Show forest plot | 9 | 9549 | Std. Mean Difference (IV, Random, 95% CI) | ‐0.21 [‐0.39, ‐0.02] |
| 2.5.1 Decision support use | 7 | 6209 | Std. Mean Difference (IV, Random, 95% CI) | ‐0.17 [‐0.27, ‐0.07] |
| 2.5.2 No decision support use | 2 | 3340 | Std. Mean Difference (IV, Random, 95% CI) | ‐0.26 [‐0.98, 0.46] |
| Outcome or subgroup title | No. of studies | No. of participants | Statistical method | Effect size |
| 3.1 Total cholesterol by health IT use Show forest plot | 12 | 20437 | Mean Difference (IV, Random, 95% CI) | ‐0.10 [‐0.20, 0.00] |
| 3.1.1 Health IT use | 8 | 9444 | Mean Difference (IV, Random, 95% CI) | ‐0.09 [‐0.20, 0.01] |
| 3.1.2 No health IT use | 4 | 10993 | Mean Difference (IV, Random, 95% CI) | ‐0.11 [‐0.27, 0.06] |
| 3.2 Low‐density lipoprotein cholesterol by health IT use Show forest plot | 10 | 22122 | Mean Difference (IV, Random, 95% CI) | ‐0.03 [‐0.10, 0.04] |
| 3.2.1 Health IT use | 9 | 21739 | Mean Difference (IV, Random, 95% CI) | ‐0.02 [‐0.10, 0.06] |
| 3.2.2 No health IT use | 1 | 383 | Mean Difference (IV, Random, 95% CI) | ‐0.11 [‐0.25, 0.03] |
| 3.3 Systolic blood pressure by health IT use Show forest plot | 16 | 32954 | Mean Difference (IV, Random, 95% CI) | ‐2.77 [‐4.16, ‐1.38] |
| 3.3.1 Health IT use | 13 | 22457 | Mean Difference (IV, Random, 95% CI) | ‐2.17 [‐3.52, ‐0.82] |
| 3.3.2 No health IT use | 3 | 10497 | Mean Difference (IV, Random, 95% CI) | ‐4.57 [‐6.89, ‐2.25] |
| 3.4 Diastolic blood pressure by health IT use Show forest plot | 14 | 22378 | Mean Difference (IV, Random, 95% CI) | ‐1.12 [‐2.11, ‐0.13] |
| 3.4.1 Health IT use | 10 | 11385 | Mean Difference (IV, Random, 95% CI) | ‐0.76 [‐1.29, ‐0.23] |
| 3.4.2 No health IT use | 4 | 10993 | Mean Difference (IV, Random, 95% CI) | ‐2.09 [‐3.33, ‐0.85] |
| 3.5 Change in multivariable CVD risk by health IT use Show forest plot | 9 | 9549 | Std. Mean Difference (IV, Random, 95% CI) | ‐0.21 [‐0.39, ‐0.02] |
| 3.5.1 Health IT use | 6 | 5387 | Std. Mean Difference (IV, Random, 95% CI) | ‐0.19 [‐0.26, ‐0.12] |
| 3.5.2 No health IT use | 3 | 4162 | Std. Mean Difference (IV, Random, 95% CI) | ‐0.15 [‐0.69, 0.39] |
| Outcome or subgroup title | No. of studies | No. of participants | Statistical method | Effect size |
| 4.1 Total cholesterol by risk status Show forest plot | 12 | 20437 | Mean Difference (IV, Random, 95% CI) | ‐0.10 [‐0.20, 0.00] |
| 4.1.1 High‐risk participants only | 3 | 4105 | Mean Difference (IV, Random, 95% CI) | ‐0.13 [‐0.22, ‐0.03] |
| 4.1.2 Participants of all risk levels | 9 | 16332 | Mean Difference (IV, Random, 95% CI) | ‐0.10 [‐0.23, 0.03] |
| 4.2 Low‐density lipoprotein cholesterol by risk status Show forest plot | 10 | 22122 | Mean Difference (IV, Random, 95% CI) | ‐0.03 [‐0.10, 0.04] |
| 4.2.1 High‐risk participants only | 3 | 14219 | Mean Difference (IV, Random, 95% CI) | ‐0.07 [‐0.11, ‐0.03] |
| 4.2.2 Participants of all risk levels | 7 | 7903 | Mean Difference (IV, Random, 95% CI) | ‐0.01 [‐0.11, 0.09] |
| 4.3 Systolic blood pressure by risk status Show forest plot | 16 | 32954 | Mean Difference (IV, Random, 95% CI) | ‐2.77 [‐4.16, ‐1.38] |
| 4.3.1 High‐risk participants only | 5 | 18375 | Mean Difference (IV, Random, 95% CI) | ‐2.22 [‐4.04, ‐0.40] |
| 4.3.2 Participants of all risk levels | 11 | 14579 | Mean Difference (IV, Random, 95% CI) | ‐2.96 [‐4.68, ‐1.24] |
| 4.4 Diastolic blood pressure by risk status Show forest plot | 14 | 22378 | Mean Difference (IV, Random, 95% CI) | ‐1.12 [‐2.11, ‐0.13] |
| 4.4.1 High‐risk participants only | 3 | 4091 | Mean Difference (IV, Random, 95% CI) | ‐0.90 [‐2.42, 0.63] |
| 4.4.2 Participants of all risk levels | 11 | 18287 | Mean Difference (IV, Random, 95% CI) | ‐1.20 [‐2.26, ‐0.14] |
| 4.5 Change in multivariable CVD risk by risk status Show forest plot | 9 | 9549 | Std. Mean Difference (IV, Random, 95% CI) | ‐0.21 [‐0.39, ‐0.02] |
| 4.5.1 High‐risk participants only | 2 | 4038 | Std. Mean Difference (IV, Random, 95% CI) | ‐0.15 [‐0.21, ‐0.09] |
| 4.5.2 Participants of all risk levels | 7 | 5511 | Std. Mean Difference (IV, Random, 95% CI) | ‐0.22 [‐0.49, 0.05] |
| Outcome or subgroup title | No. of studies | No. of participants | Statistical method | Effect size |
| 5.1 Multivariable CVD risk Show forest plot | 5 | 1921 | Std. Mean Difference (IV, Fixed, 95% CI) | ‐0.15 [‐0.25, ‐0.06] |