Valoración del riesgo para la prevención primaria de las enfermedades cardiovasculares
Información
- DOI:
- https://doi.org/10.1002/14651858.CD006887.pub4Copiar DOI

- Base de datos:
-
- Cochrane Database of Systematic Reviews
- Versión publicada:
-
- 14 marzo 2017see what's new
- Tipo:
-
- Intervention
- Etapa:
-
- Review
- Grupo Editorial Cochrane:
-
Grupo Cochrane de Corazón
- Copyright:
-
- Copyright © 2017 The Cochrane Collaboration. Published by John Wiley & Sons, Ltd.
Cifras del artículo
Altmetric:
Citado por:
Autores
Contributions of authors
KNK ‐ design of review, article screening, data collection, data analysis, data interpretation, manuscript writing
SDP ‐ design of review, article screening, data collection, data interpretation, and manuscript revision for important intellectual content
PP ‐ data interpretation and manuscript revision for important intellectual content
DML‐J ‐ data interpretation and manuscript revision for important intellectual content
MAB ‐ development and execution of database searches, manuscript revision for important intellectual content
MDH ‐ design of review, article screening, data collection, data interpretation, manuscript revision for important intellectual content
Sources of support
Internal sources
-
Northwestern University, Chicago, IL, USA
External sources
-
National Heart, Lung, and Blood Institute, USA
Cardiovascular Epidemiology and Prevention Training grant (5 T32 HL069771‐11)
-
This project was supported by the National Institute for Health Research via Cochrane Infrastructure to the Heart Group. The views and opinions expressed therein are those of the authors and do not necessarily reflect those of the Systematic Reviews Programme, NIHR, NHS or the Department of Health, UK
Declarations of interest
KNK ‐ none known. KNK received support from the National Heart, Lung, and Blood Institute training grant in cardiovascular epidemiology and prevention during the conduct of this work (T32 HL069771).
SDP ‐ author on 2 included studies*. SDP receives grant support from Pfizer, Inc. for research outside the submitted work.
PP ‐ none known.
DML‐J ‐ author on 2 included studies*.
MAB ‐ none known.
MDH ‐ MDH receives support from the World Heart Federation to serve as the senior programme advisor for its Emerging Leaders programme, which has been supported by Boehringer Ingelheim, Novartis, Bupa, and AstraZeneca. MDH is also a Cochrane Heart Group satellite coordinating editor and associate editor for JAMA for which he receives compensation from the American Medical Association. MDH also receives travel support from the American Heart Association.
*Note that data extraction and risk of bias assessment for these two trials were performed by authors not involved in the study (KNK and MDH).
Acknowledgements
We acknowledge Karen Rees and Mariana Dyakova for their assistance with the protocol development. We also acknowledge Andrew Beswick, Peter Brindle, Shah Ebrahim, and Tom Fahey, authors of two prior systematic reviews published with Cochrane methodology (Beswick 2008; Brindle 2006). The authors would also like to thank Amelie Yavchitz for assistance with translation of Hanon 2000 and David Prieto‐Merino for statistical advice for the meta‐analysis.
Version history
| Published | Title | Stage | Authors | Version |
| 2017 Mar 14 | Risk scoring for the primary prevention of cardiovascular disease | Review | Kunal N Karmali, Stephen D Persell, Pablo Perel, Donald M Lloyd-Jones, Mark A Berendsen, Mark D Huffman | |
| 2015 Jan 22 | Risk scoring for the primary prevention of cardiovascular disease | Protocol | Kunal N Karmali, Stephen D Persell, Donald M Lloyd‐Jones, Pablo Perel, Mark D Huffman | |
Differences between protocol and review
1. For the main outcomes presented in our Abstract, Plain language summary, and 'Summary of findings' table, we prioritised clinical outcomes (CVD events, adverse events), selected CVD risk factor levels (total cholesterol, systolic blood pressure, and multivariable CVD risk), and commonly prescribed medications for primary CVD prevention (lipid‐lowering medications and antihypertensive medications). We included a mixture of these primary and secondary outcomes because we judged these to be of greatest relevance for stakeholders such as patients, clinicians, policy makers, and guideline developers.
2. We modified the secondary outcome of preventive medication prescribing to 'new or intensified medication prescribing in higher risk participants' to capture the anticipated behaviour change from providing a CVD risk score. Similarly, for the smoking outcome, we reported 'smoking cessation,' the desired behaviour change from providing a CVD risk score.
3. We edited the 'objectives' sentence to include main outcomes including risk factor levels and preventive medication prescribing.
4. We had initially planned on analysing all data at the level of the individual using the intra‐cluster coefficient (ICC) to generate a cluster design effect. However, few studies reported outcome‐specific ICC and estimates varied substantially between trials. After statistical consultation, we meta‐analysed data from cluster‐RCTs using the reported effect estimate with its 95% confidence interval as long as the authors reported using appropriate statistical analyses (e.g. multilevel model, generalised estimating equations) that accounted for clustering (Chapter 16.3.3 of Higgins 2011). All 17 cluster‐RCTs included in this review reported adjusting for clustering in their analyses.
5. We imputed standard deviations for some trials that reported standard errors or 95% confidence intervals (Chapter 16.1.3 of Higgins 2011).
6. We included two post hoc subgroup analyses to identify reasons for heterogeneity. These included subgroups comparing: trials including high‐risk participants only versus trials including all risk levels; and trials incorporating the CVD risk score with health IT versus trials that did not incorporate health IT.
Keywords
MeSH
Medical Subject Headings (MeSH) Keywords
- Anticholesteremic Agents [therapeutic use];
- Antihypertensive Agents [therapeutic use];
- Blood Pressure;
- Cardiovascular Diseases [blood, etiology, *prevention & control];
- Cholesterol [blood];
- Heart Diseases [prevention & control];
- Primary Prevention [*methods];
- Randomized Controlled Trials as Topic;
- Risk Assessment;
- Risk Factors;
- Stroke [prevention & control];
Medical Subject Headings Check Words
Adult; Humans;
PICO
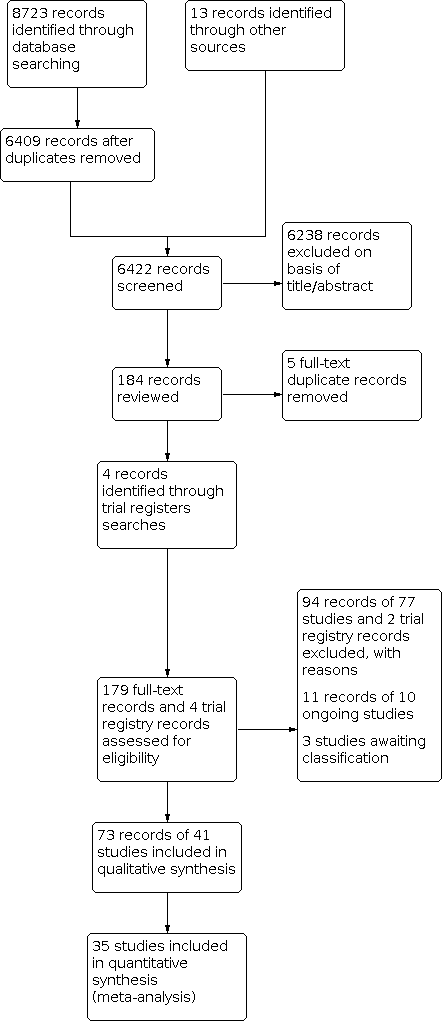
Study flow diagram.

Summary of CVD risk score interventions by included study.
Abbreviations: CHD: coronary heart disease; CVD: cardiovascular disease; FRS: Framingham risk score; MI: myocardial infarction; RF: risk factors, RR: risk ratio; UKPDS: United Kingdom Prospective Diabetes Study

Risk of bias summary: review authors' judgements about each risk of bias item for each included study.

Risk of bias graph: review authors' judgements about each risk of bias item presented as percentages across all included studies.

Funnel plot of comparison: 1 CVD risk score versus no CVD risk score/usual care, outcome: 1.3 Total cholesterol (mmol/L).

Funnel plot of comparison: 1 CVD risk score versus no CVD risk score/usual care, outcome: 1.5 Systolic blood pressure (mmHg).

Funnel plot of comparison: 1 CVD risk score versus no CVD risk score/usual care, outcome: 1.7 Change in multivariable CVD risk.

Comparison 1: CVD risk score versus no CVD risk score/usual care, Outcome 1: CVD events

Comparison 1: CVD risk score versus no CVD risk score/usual care, Outcome 2: CVD events, excluding Bucher 2010

Comparison 1: CVD risk score versus no CVD risk score/usual care, Outcome 3: Total cholesterol

Comparison 1: CVD risk score versus no CVD risk score/usual care, Outcome 4: Low‐density lipoprotein cholesterol

Comparison 1: CVD risk score versus no CVD risk score/usual care, Outcome 5: Systolic blood pressure

Comparison 1: CVD risk score versus no CVD risk score/usual care, Outcome 6: Diastolic blood pressure

Comparison 1: CVD risk score versus no CVD risk score/usual care, Outcome 7: Change in multivariable CVD risk

Comparison 1: CVD risk score versus no CVD risk score/usual care, Outcome 8: Adverse events (investigator defined)

Comparison 1: CVD risk score versus no CVD risk score/usual care, Outcome 9: Anxiety

Comparison 1: CVD risk score versus no CVD risk score/usual care, Outcome 10: New/intensified lipid‐lowering medication

Comparison 1: CVD risk score versus no CVD risk score/usual care, Outcome 11: New/intensified antihypertensive medication

Comparison 1: CVD risk score versus no CVD risk score/usual care, Outcome 12: New aspirin

Comparison 1: CVD risk score versus no CVD risk score/usual care, Outcome 13: Medication adherence

Comparison 1: CVD risk score versus no CVD risk score/usual care, Outcome 14: Smoking cessation

Comparison 1: CVD risk score versus no CVD risk score/usual care, Outcome 15: Exercise

Comparison 1: CVD risk score versus no CVD risk score/usual care, Outcome 16: Decisional conflict

Comparison 2: CVD risk score versus no CVD risk score/usual care by decision support use, Outcome 1: Total cholesterol by decision support use

Comparison 2: CVD risk score versus no CVD risk score/usual care by decision support use, Outcome 2: Low‐density lipoprotein cholesterol by decision support

Comparison 2: CVD risk score versus no CVD risk score/usual care by decision support use, Outcome 3: Systolic blood pressure by decision support use

Comparison 2: CVD risk score versus no CVD risk score/usual care by decision support use, Outcome 4: Diastolic blood pressure by decision support use

Comparison 2: CVD risk score versus no CVD risk score/usual care by decision support use, Outcome 5: Change in multivariable CVD risk by decision support

Comparison 3: CVD risk score versus no CVD risk score/usual care by health IT use, Outcome 1: Total cholesterol by health IT use

Comparison 3: CVD risk score versus no CVD risk score/usual care by health IT use, Outcome 2: Low‐density lipoprotein cholesterol by health IT use

Comparison 3: CVD risk score versus no CVD risk score/usual care by health IT use, Outcome 3: Systolic blood pressure by health IT use

Comparison 3: CVD risk score versus no CVD risk score/usual care by health IT use, Outcome 4: Diastolic blood pressure by health IT use

Comparison 3: CVD risk score versus no CVD risk score/usual care by health IT use, Outcome 5: Change in multivariable CVD risk by health IT use

Comparison 4: CVD risk score versus no CVD risk score/usual care by risk status of participants, Outcome 1: Total cholesterol by risk status

Comparison 4: CVD risk score versus no CVD risk score/usual care by risk status of participants, Outcome 2: Low‐density lipoprotein cholesterol by risk status

Comparison 4: CVD risk score versus no CVD risk score/usual care by risk status of participants, Outcome 3: Systolic blood pressure by risk status

Comparison 4: CVD risk score versus no CVD risk score/usual care by risk status of participants, Outcome 4: Diastolic blood pressure by risk status

Comparison 4: CVD risk score versus no CVD risk score/usual care by risk status of participants, Outcome 5: Change in multivariable CVD risk by risk status

Comparison 5: Multivariable CVD risk, Outcome 1: Multivariable CVD risk
| CVD risk scoring for the primary prevention of cardiovascular disease | ||||||
| Patient or population: adults without prevalent cardiovascular disease (primary cardiovascular disease prevention) | ||||||
| Outcomes | Anticipated absolute effects* (95% CI) | Relative effect | N of participants | Quality of the evidence | Comments | |
|---|---|---|---|---|---|---|
| Risk with not providing CVD risk scores/usual care | Risk with providing CVD risk scores | |||||
| CVD events | Study population | RR 1.01 | 99,070 | ⊕⊕⊝⊝ | — | |
| 53 per 1000 | 54 per 1000 | |||||
| Total cholesterol (mmol/L) | In the comparison group, the range of mean total cholesterol level was 5.1 to 6.6 mmol/L and the range of mean change from baseline in total cholesterol level was 0.09 lower to 0.14 mmol/L higher | The mean difference in total cholesterol in the intervention group was 0.10 mmol/L lower | — | 20,437 | ⊕⊕⊝⊝ | — |
| Systolic blood pressure (mmHg) | In the comparison group, the range of mean systolic blood pressure level was 124.1 to 159.0 mmHg and the range of mean change from baseline in systolic blood pressure level was 5.3 lower to 1.0 higher mmHg | The mean difference in systolic blood pressure in the intervention group was 2.77 mmHg lower | — | 32,954 | ⊕⊕⊝⊝ | — |
| Change in multivariable CVD risk (SD) | In the comparison group, the range of mean change from baseline in multivariable CVD risk was 5.3 lower to 0.77 higher SDs | The mean difference in multivariable CVD risk in the intervention group was 0.21 SDs lower | — | 9549 | ⊕⊕⊝⊝ | Standardised mean differences were calculated for this outcome due to the use of different multivariable CVD risk scales. An effect size of ~0.20 SD units reflects a small effect. |
| Investigator‐defined adverse events | Study population | RR 0.72 | 4630 | ⊕⊕⊝⊝ | Adverse events were defined heterogeneously by investigators and included some events that may have been due to newly prescribed medications rather than the provision of a CVD risk score itself. | |
| 27 per 1000 | 19 per 1000 | |||||
| New/intensified lipid‐lowering medication | Study population | RR 1.47 | 14,175 | ⊕⊕⊝⊝ | Prescribing rates in the comparison group varied among the included trials (range 4% to 22%). Median prescribing rate presented | |
| 107 per 1000 | 157 per 1000 | |||||
| New/intensified antihypertensive medication | Study population | RR 1.51 | 13,255 | ⊕⊕⊝⊝ | Prescribing rates in the comparison group varied among the included trials (range 0% to 27%). Median prescribing rate presented | |
| 114 per 1000 | 172 per 1000 | |||||
| *The risk in the intervention group (and its 95% confidence interval) is based on the assumed risk in the comparison group and the relative effect of the intervention (and its 95% CI). | ||||||
| GRADE Working Group grades of evidence | ||||||
| aDowngraded due to study limitations, primarily driven by high risk of selection bias in Holt 2010 and high risk of reporting bias in Bucher 2010 and Jorgensen 2014. | ||||||
| Outcome or subgroup title | No. of studies | No. of participants | Statistical method | Effect size |
| 1.1 CVD events Show forest plot | 3 | 99070 | Risk Ratio (IV, Fixed, 95% CI) | 1.01 [0.95, 1.08] |
| 1.2 CVD events, excluding Bucher 2010 Show forest plot | 2 | 95708 | Risk Ratio (IV, Fixed, 95% CI) | 1.01 [0.94, 1.08] |
| 1.3 Total cholesterol Show forest plot | 12 | 20437 | Mean Difference (IV, Random, 95% CI) | ‐0.10 [‐0.20, 0.00] |
| 1.4 Low‐density lipoprotein cholesterol Show forest plot | 10 | 22122 | Mean Difference (IV, Random, 95% CI) | ‐0.03 [‐0.10, 0.04] |
| 1.5 Systolic blood pressure Show forest plot | 16 | 32954 | Mean Difference (IV, Random, 95% CI) | ‐2.77 [‐4.16, ‐1.38] |
| 1.6 Diastolic blood pressure Show forest plot | 14 | 22378 | Mean Difference (IV, Random, 95% CI) | ‐1.12 [‐2.11, ‐0.13] |
| 1.7 Change in multivariable CVD risk Show forest plot | 9 | 9549 | Std. Mean Difference (IV, Random, 95% CI) | ‐0.21 [‐0.39, ‐0.02] |
| 1.8 Adverse events (investigator defined) Show forest plot | 4 | 4630 | Risk Ratio (IV, Fixed, 95% CI) | 0.72 [0.49, 1.04] |
| 1.9 Anxiety Show forest plot | 2 | 388 | Std. Mean Difference (IV, Fixed, 95% CI) | ‐0.07 [‐0.27, 0.13] |
| 1.10 New/intensified lipid‐lowering medication Show forest plot | 11 | 14175 | Risk Ratio (IV, Random, 95% CI) | 1.47 [1.15, 1.87] |
| 1.11 New/intensified antihypertensive medication Show forest plot | 8 | 13255 | Risk Ratio (IV, Random, 95% CI) | 1.51 [1.08, 2.11] |
| 1.12 New aspirin Show forest plot | 3 | 1614 | Risk Ratio (IV, Fixed, 95% CI) | 2.71 [1.24, 5.91] |
| 1.13 Medication adherence Show forest plot | 4 | 621 | Risk Ratio (IV, Random, 95% CI) | 1.14 [0.92, 1.40] |
| 1.14 Smoking cessation Show forest plot | 7 | 5346 | Risk Ratio (IV, Fixed, 95% CI) | 1.38 [1.13, 1.69] |
| 1.15 Exercise Show forest plot | 2 | 2595 | Risk Ratio (IV, Fixed, 95% CI) | 0.98 [0.90, 1.06] |
| 1.16 Decisional conflict Show forest plot | 4 | 1261 | Std. Mean Difference (IV, Random, 95% CI) | ‐0.29 [‐0.57, ‐0.01] |
| Outcome or subgroup title | No. of studies | No. of participants | Statistical method | Effect size |
| 2.1 Total cholesterol by decision support use Show forest plot | 12 | 20437 | Mean Difference (IV, Random, 95% CI) | ‐0.10 [‐0.20, 0.00] |
| 2.1.1 Decision support use | 8 | 9444 | Mean Difference (IV, Random, 95% CI) | ‐0.09 [‐0.20, 0.01] |
| 2.1.2 No decision support use | 4 | 10993 | Mean Difference (IV, Random, 95% CI) | ‐0.11 [‐0.27, 0.06] |
| 2.2 Low‐density lipoprotein cholesterol by decision support Show forest plot | 10 | 22122 | Mean Difference (IV, Random, 95% CI) | ‐0.03 [‐0.10, 0.04] |
| 2.2.1 Decision support use | 9 | 21739 | Mean Difference (IV, Random, 95% CI) | ‐0.02 [‐0.10, 0.06] |
| 2.2.2 No decision support use | 1 | 383 | Mean Difference (IV, Random, 95% CI) | ‐0.11 [‐0.25, 0.03] |
| 2.3 Systolic blood pressure by decision support use Show forest plot | 16 | 32954 | Mean Difference (IV, Random, 95% CI) | ‐2.77 [‐4.16, ‐1.38] |
| 2.3.1 Decision support use | 13 | 22457 | Mean Difference (IV, Random, 95% CI) | ‐2.17 [‐3.52, ‐0.82] |
| 2.3.2 No decision support use | 3 | 10497 | Mean Difference (IV, Random, 95% CI) | ‐4.57 [‐6.89, ‐2.25] |
| 2.4 Diastolic blood pressure by decision support use Show forest plot | 14 | 22378 | Mean Difference (IV, Random, 95% CI) | ‐1.12 [‐2.11, ‐0.13] |
| 2.4.1 Decision support use | 10 | 11385 | Mean Difference (IV, Random, 95% CI) | ‐0.76 [‐1.29, ‐0.23] |
| 2.4.2 No decision support use | 4 | 10993 | Mean Difference (IV, Random, 95% CI) | ‐2.09 [‐3.33, ‐0.85] |
| 2.5 Change in multivariable CVD risk by decision support Show forest plot | 9 | 9549 | Std. Mean Difference (IV, Random, 95% CI) | ‐0.21 [‐0.39, ‐0.02] |
| 2.5.1 Decision support use | 7 | 6209 | Std. Mean Difference (IV, Random, 95% CI) | ‐0.17 [‐0.27, ‐0.07] |
| 2.5.2 No decision support use | 2 | 3340 | Std. Mean Difference (IV, Random, 95% CI) | ‐0.26 [‐0.98, 0.46] |
| Outcome or subgroup title | No. of studies | No. of participants | Statistical method | Effect size |
| 3.1 Total cholesterol by health IT use Show forest plot | 12 | 20437 | Mean Difference (IV, Random, 95% CI) | ‐0.10 [‐0.20, 0.00] |
| 3.1.1 Health IT use | 8 | 9444 | Mean Difference (IV, Random, 95% CI) | ‐0.09 [‐0.20, 0.01] |
| 3.1.2 No health IT use | 4 | 10993 | Mean Difference (IV, Random, 95% CI) | ‐0.11 [‐0.27, 0.06] |
| 3.2 Low‐density lipoprotein cholesterol by health IT use Show forest plot | 10 | 22122 | Mean Difference (IV, Random, 95% CI) | ‐0.03 [‐0.10, 0.04] |
| 3.2.1 Health IT use | 9 | 21739 | Mean Difference (IV, Random, 95% CI) | ‐0.02 [‐0.10, 0.06] |
| 3.2.2 No health IT use | 1 | 383 | Mean Difference (IV, Random, 95% CI) | ‐0.11 [‐0.25, 0.03] |
| 3.3 Systolic blood pressure by health IT use Show forest plot | 16 | 32954 | Mean Difference (IV, Random, 95% CI) | ‐2.77 [‐4.16, ‐1.38] |
| 3.3.1 Health IT use | 13 | 22457 | Mean Difference (IV, Random, 95% CI) | ‐2.17 [‐3.52, ‐0.82] |
| 3.3.2 No health IT use | 3 | 10497 | Mean Difference (IV, Random, 95% CI) | ‐4.57 [‐6.89, ‐2.25] |
| 3.4 Diastolic blood pressure by health IT use Show forest plot | 14 | 22378 | Mean Difference (IV, Random, 95% CI) | ‐1.12 [‐2.11, ‐0.13] |
| 3.4.1 Health IT use | 10 | 11385 | Mean Difference (IV, Random, 95% CI) | ‐0.76 [‐1.29, ‐0.23] |
| 3.4.2 No health IT use | 4 | 10993 | Mean Difference (IV, Random, 95% CI) | ‐2.09 [‐3.33, ‐0.85] |
| 3.5 Change in multivariable CVD risk by health IT use Show forest plot | 9 | 9549 | Std. Mean Difference (IV, Random, 95% CI) | ‐0.21 [‐0.39, ‐0.02] |
| 3.5.1 Health IT use | 6 | 5387 | Std. Mean Difference (IV, Random, 95% CI) | ‐0.19 [‐0.26, ‐0.12] |
| 3.5.2 No health IT use | 3 | 4162 | Std. Mean Difference (IV, Random, 95% CI) | ‐0.15 [‐0.69, 0.39] |
| Outcome or subgroup title | No. of studies | No. of participants | Statistical method | Effect size |
| 4.1 Total cholesterol by risk status Show forest plot | 12 | 20437 | Mean Difference (IV, Random, 95% CI) | ‐0.10 [‐0.20, 0.00] |
| 4.1.1 High‐risk participants only | 3 | 4105 | Mean Difference (IV, Random, 95% CI) | ‐0.13 [‐0.22, ‐0.03] |
| 4.1.2 Participants of all risk levels | 9 | 16332 | Mean Difference (IV, Random, 95% CI) | ‐0.10 [‐0.23, 0.03] |
| 4.2 Low‐density lipoprotein cholesterol by risk status Show forest plot | 10 | 22122 | Mean Difference (IV, Random, 95% CI) | ‐0.03 [‐0.10, 0.04] |
| 4.2.1 High‐risk participants only | 3 | 14219 | Mean Difference (IV, Random, 95% CI) | ‐0.07 [‐0.11, ‐0.03] |
| 4.2.2 Participants of all risk levels | 7 | 7903 | Mean Difference (IV, Random, 95% CI) | ‐0.01 [‐0.11, 0.09] |
| 4.3 Systolic blood pressure by risk status Show forest plot | 16 | 32954 | Mean Difference (IV, Random, 95% CI) | ‐2.77 [‐4.16, ‐1.38] |
| 4.3.1 High‐risk participants only | 5 | 18375 | Mean Difference (IV, Random, 95% CI) | ‐2.22 [‐4.04, ‐0.40] |
| 4.3.2 Participants of all risk levels | 11 | 14579 | Mean Difference (IV, Random, 95% CI) | ‐2.96 [‐4.68, ‐1.24] |
| 4.4 Diastolic blood pressure by risk status Show forest plot | 14 | 22378 | Mean Difference (IV, Random, 95% CI) | ‐1.12 [‐2.11, ‐0.13] |
| 4.4.1 High‐risk participants only | 3 | 4091 | Mean Difference (IV, Random, 95% CI) | ‐0.90 [‐2.42, 0.63] |
| 4.4.2 Participants of all risk levels | 11 | 18287 | Mean Difference (IV, Random, 95% CI) | ‐1.20 [‐2.26, ‐0.14] |
| 4.5 Change in multivariable CVD risk by risk status Show forest plot | 9 | 9549 | Std. Mean Difference (IV, Random, 95% CI) | ‐0.21 [‐0.39, ‐0.02] |
| 4.5.1 High‐risk participants only | 2 | 4038 | Std. Mean Difference (IV, Random, 95% CI) | ‐0.15 [‐0.21, ‐0.09] |
| 4.5.2 Participants of all risk levels | 7 | 5511 | Std. Mean Difference (IV, Random, 95% CI) | ‐0.22 [‐0.49, 0.05] |
| Outcome or subgroup title | No. of studies | No. of participants | Statistical method | Effect size |
| 5.1 Multivariable CVD risk Show forest plot | 5 | 1921 | Std. Mean Difference (IV, Fixed, 95% CI) | ‐0.15 [‐0.25, ‐0.06] |