Pemarkahan risiko untuk pencegahan primer penyakit kardiovaskular
Abstract
Background
The current paradigm for cardiovascular disease (CVD) emphasises absolute risk assessment to guide treatment decisions in primary prevention. Although the derivation and validation of multivariable risk assessment tools, or CVD risk scores, have attracted considerable attention, their effect on clinical outcomes is uncertain.
Objectives
To assess the effects of evaluating and providing CVD risk scores in adults without prevalent CVD on cardiovascular outcomes, risk factor levels, preventive medication prescribing, and health behaviours.
Search methods
We searched the Cochrane Central Register of Controlled Trials (CENTRAL) in the Cochrane Library (2016, Issue 2), MEDLINE Ovid (1946 to March week 1 2016), Embase (embase.com) (1974 to 15 March 2016), and Conference Proceedings Citation Index‐Science (CPCI‐S) (1990 to 15 March 2016). We imposed no language restrictions. We searched clinical trial registers in March 2016 and handsearched reference lists of primary studies to identify additional reports.
Selection criteria
We included randomised and quasi‐randomised trials comparing the systematic provision of CVD risk scores by a clinician, healthcare professional, or healthcare system compared with usual care (i.e. no systematic provision of CVD risk scores) in adults without CVD.
Data collection and analysis
Three review authors independently selected studies, extracted data, and evaluated study quality. We used the Cochrane 'Risk of bias' tool to assess study limitations. The primary outcomes were: CVD events, change in CVD risk factor levels (total cholesterol, systolic blood pressure, and multivariable CVD risk), and adverse events. Secondary outcomes included: lipid‐lowering and antihypertensive medication prescribing in higher‐risk people. We calculated risk ratios (RR) for dichotomous data and mean differences (MD) or standardised mean differences (SMD) for continuous data using 95% confidence intervals. We used a fixed‐effects model when heterogeneity (I²) was at least 50% and a random‐effects model for substantial heterogeneity (I² > 50%). We evaluated the quality of evidence using the GRADE framework.
Main results
We identified 41 randomised controlled trials (RCTs) involving 194,035 participants from 6422 reports. We assessed studies as having high or unclear risk of bias across multiple domains. Low‐quality evidence evidence suggests that providing CVD risk scores may have little or no effect on CVD events compared with usual care (5.4% versus 5.3%; RR 1.01, 95% confidence interval (CI) 0.95 to 1.08; I² = 25%; 3 trials, N = 99,070). Providing CVD risk scores may reduce CVD risk factor levels by a small amount compared with usual care. Providing CVD risk scores reduced total cholesterol (MD −0.10 mmol/L, 95% CI −0.20 to 0.00; I² = 94%; 12 trials, N = 20,437, low‐quality evidence), systolic blood pressure (MD −2.77 mmHg, 95% CI −4.16 to −1.38; I² = 93%; 16 trials, N = 32,954, low‐quality evidence), and multivariable CVD risk (SMD −0.21, 95% CI −0.39 to −0.02; I² = 94%; 9 trials, N = 9549, low‐quality evidence). Providing CVD risk scores may reduce adverse events compared with usual care, but results were imprecise (1.9% versus 2.7%; RR 0.72, 95% CI 0.49 to 1.04; I² = 0%; 4 trials, N = 4630, low‐quality evidence). Compared with usual care, providing CVD risk scores may increase new or intensified lipid‐lowering medications (15.7% versus 10.7%; RR 1.47, 95% CI 1.15 to 1.87; I² = 40%; 11 trials, N = 14,175, low‐quality evidence) and increase new or increased antihypertensive medications (17.2% versus 11.4%; RR 1.51, 95% CI 1.08 to 2.11; I² = 53%; 8 trials, N = 13,255, low‐quality evidence).
Authors' conclusions
There is uncertainty whether current strategies for providing CVD risk scores affect CVD events. Providing CVD risk scores may slightly reduce CVD risk factor levels and may increase preventive medication prescribing in higher‐risk people without evidence of harm. There were multiple study limitations in the identified studies and substantial heterogeneity in the interventions, outcomes, and analyses, so readers should interpret results with caution. New models for implementing and evaluating CVD risk scores in adequately powered studies are needed to define the role of applying CVD risk scores in primary CVD prevention.
PICO
Ringkasan bahasa mudah
Kesan klinikal pemarkahan risiko kardiovaskular pada orang tanpa penyakit kardiovaskular
Soalan ulasan
Apakah bukti tentang manfaat potensi klinikal dan bahaya penyediaan pemarkahan risiko penyakit kardiovaskular (cardiovascular disease, CVD) pada orang yang tidak mempunyai sejarah penyakit jantung atau strok?
Latar belakang
Penyakit kardiovaskular (CVD) adalah sekumpulan keadaan yang merangkumi penyakit jantung dan strok. Garis panduan pencegahan CVD menekankan penggunaan pemarkahan risiko, pengiraan yang menggunakan pembolehubah klinikal untuk menganggarkan kemungkinan serangan jantung atau strok pertama, untuk membimbing pengambilan keputusan rawatan pada populasi umum. Walaupun terdapat banyak perhatian dalam perkembangan jenis pemarkahan risiko CVD yang berbeza, ia juga mempunyai ketidakpastian tentang kesan pemberian pemarkahan risiko CVD dalam praktik klinikal.
Tujuan tinjauan sistematik ini adalah untuk menilai kesan penilaian pemarkahan risiko CVD pada orang dewasa tanpa sejarah penyakit jantung atau strok pada hasil kardiovaskular, tahap faktor risiko, pemberian ubat pencegahan, dan tingkah laku kesihatan.
Ciri‐ciri kajian
Kami mencari pangkalan data saintifik untuk percubaan terawak (kajian klinikal yang memasukkan orang ke dalam kumpulan rawatan yang berbeza secara rawak) yang secara sistematik memberikan pemarkahan risiko CVD atau rawatan biasa kepada orang dewasa tanpa sejarah penyakit jantung atau strok. Bukti adalah terkini sehingga Mac 2016. Pembiayaan untuk sebahagian besar kajian adalah daripada sumber kerajaan atau syarikat farmakeutikal.
Hasil utama
Kami mengenal pasti 41 kajian yang melibatkan 194,035 peserta. Banyak kajian mempunyai batasan. Bukti berkualiti rendah menunjukkan bahawa pemberian pemarkahan risiko CVD memberikan sedikit atau tidak mempengaruhi jumlah orang yang mendapat penyakit jantung atau strok. Pemberian pemarkahan risiko CVD mungkin akan mengurangkan tahap faktor risiko CVD (seperti kolesterol, tekanan darah, serta pembolehubah risiko CVD) dengan jumlah yang sedikit serta mungkin meningkatkan pemberian ubat penurun kolesterol dan tekanan darah pada orang yang berisiko tinggi. Pemberian pemarkahan risiko CVD mungkin dapat mengurangkan bahaya, tetapi hasilnya adalah tidak tepat.
Kualiti bukti
Terdapat bukti berkualiti rendah untuk menjadi panduan penggunaan pemarkahan risiko dalam amalan klinikal. Kajian‐kajian mempunyai banyak batasan dan menggunakan kaedah yang berbeza untuk memberikan pemarkahan risiko CVD. Kemungkinan kajian lebih lanjut akan mempengaruhi hasil ini.
Authors' conclusions
Summary of findings
| CVD risk scoring for the primary prevention of cardiovascular disease | ||||||
| Patient or population: adults without prevalent cardiovascular disease (primary cardiovascular disease prevention) | ||||||
| Outcomes | Anticipated absolute effects* (95% CI) | Relative effect | N of participants | Quality of the evidence | Comments | |
|---|---|---|---|---|---|---|
| Risk with not providing CVD risk scores/usual care | Risk with providing CVD risk scores | |||||
| CVD events | Study population | RR 1.01 | 99,070 | ⊕⊕⊝⊝ | — | |
| 53 per 1000 | 54 per 1000 | |||||
| Total cholesterol (mmol/L) | In the comparison group, the range of mean total cholesterol level was 5.1 to 6.6 mmol/L and the range of mean change from baseline in total cholesterol level was 0.09 lower to 0.14 mmol/L higher | The mean difference in total cholesterol in the intervention group was 0.10 mmol/L lower | — | 20,437 | ⊕⊕⊝⊝ | — |
| Systolic blood pressure (mmHg) | In the comparison group, the range of mean systolic blood pressure level was 124.1 to 159.0 mmHg and the range of mean change from baseline in systolic blood pressure level was 5.3 lower to 1.0 higher mmHg | The mean difference in systolic blood pressure in the intervention group was 2.77 mmHg lower | — | 32,954 | ⊕⊕⊝⊝ | — |
| Change in multivariable CVD risk (SD) | In the comparison group, the range of mean change from baseline in multivariable CVD risk was 5.3 lower to 0.77 higher SDs | The mean difference in multivariable CVD risk in the intervention group was 0.21 SDs lower | — | 9549 | ⊕⊕⊝⊝ | Standardised mean differences were calculated for this outcome due to the use of different multivariable CVD risk scales. An effect size of ~0.20 SD units reflects a small effect. |
| Investigator‐defined adverse events | Study population | RR 0.72 | 4630 | ⊕⊕⊝⊝ | Adverse events were defined heterogeneously by investigators and included some events that may have been due to newly prescribed medications rather than the provision of a CVD risk score itself. | |
| 27 per 1000 | 19 per 1000 | |||||
| New/intensified lipid‐lowering medication | Study population | RR 1.47 | 14,175 | ⊕⊕⊝⊝ | Prescribing rates in the comparison group varied among the included trials (range 4% to 22%). Median prescribing rate presented | |
| 107 per 1000 | 157 per 1000 | |||||
| New/intensified antihypertensive medication | Study population | RR 1.51 | 13,255 | ⊕⊕⊝⊝ | Prescribing rates in the comparison group varied among the included trials (range 0% to 27%). Median prescribing rate presented | |
| 114 per 1000 | 172 per 1000 | |||||
| *The risk in the intervention group (and its 95% confidence interval) is based on the assumed risk in the comparison group and the relative effect of the intervention (and its 95% CI). | ||||||
| GRADE Working Group grades of evidence | ||||||
| aDowngraded due to study limitations, primarily driven by high risk of selection bias in Holt 2010 and high risk of reporting bias in Bucher 2010 and Jorgensen 2014. | ||||||
Background
Description of the condition
Cardiovascular disease (CVD), which includes ischaemic heart disease and stroke, is the leading cause of mortality and disability worldwide (Murray 2012; Naghavi 2015). According to the Global Burden of Disease study, ischaemic heart disease and stroke accounted for 12.9 million deaths worldwide in 2013, or one in every four of the total (Naghavi 2015). CVD is also costly, and the World Economic Forum estimates that the direct cost attributable to CVD is USD 863 billion worldwide, with a projected rise of 22% by 2030 (Bloom 2011).
The incidence of CVD is largely explained by several modifiable risk factors, which include abnormal cholesterol, elevated blood pressure, diabetes mellitus, smoking, unhealthy diet, excessive alcohol intake, abdominal obesity, psychosocial stress, and lack of physical activity. These nine modifiable risk factors increase the risk of future CVD events and contribute to an estimated 90% of the population attributable risk fraction of ischaemic heart disease and stroke worldwide (O'Donnell 2010; Yusuf 2004). Prevention, treatment, and control of these risk factors before clinical manifestation are therefore primary targets of interventions to reduce the burden of CVD.
Description of the intervention
CVD events are often determined by the confluence of multiple, co‐existing risk factors (Smith 2004). The multifactorial nature of CVD has led to the development and application of multivariable risk assessment tools, or CVD risk scores, to calculate CVD risk. CVD risk scores allow clinicians to integrate information from multiple CVD risk factors and quantitatively estimate a person's absolute risk for, or likelihood of experiencing, a CVD event during a defined period of time.
The first widely used multivariable CVD risk score was derived from the Framingham Heart Study in the USA (Anderson 1991; Wilson 1998). The Framingham risk score incorporated the effects of age, sex, systolic blood pressure, total cholesterol, high‐density lipoprotein (HDL) cholesterol, smoking status, antihypertensive treatment status, and diabetes mellitus to estimate 10‐year risk of coronary heart disease. During the past two decades, there has been widespread development of additional CVD risk scores such as the European Systematic COronary Risk Evaluation (SCORE) algorithm (Conroy 2003); the German Prospective Cardiovascular Munster (PROCAM) model (Assmann 2002); the UK QRISK and QRISK2 equations (Hippisley‐Cox 2007; Hippisley‐Cox 2008); the World Health Organization (WHO) risk chart (WHO 2007); the American College of Cardiology (ACC)/American Heart Association (AHA) 2013 Pooled Cohort risk equations (Goff 2014); and the Globorisk cardiovascular risk equation for use globally, including in low‐ and middle‐income countries (Hajifathalian 2015). CVD prevention guidelines recommend use of these risk scores to guide treatment decisions for primary prevention in people who do not yet have clinical manifestations of CVD (Anderson 2013; NCEP 2002; NICE 2014; Piepoli 2016; Stone 2014; WHO 2007).
How the intervention might work
The current paradigm for CVD risk reduction in primary prevention matches the intensity of prevention efforts to a person's absolute risk for developing CVD (Bethesda 1996; Smith 2004). Risk‐based prevention, therefore, directs treatments toward people at increased risk who derive greater benefit from treatment, while sparing people at lower risk for whom benefits may not outweigh the costs and harms of treatment. Qualitative assessment of CVD risk, however, is fraught with error, thereby providing a rationale for quantitative risk assessment tools (Grover 1995; Meland 1994; Pignone 2003; Van der Weijden 2008). Prevention guidelines in the USA, the UK, Europe, Canada, and the developing world promote the use of multivariable CVD risk scores to guide treatment decisions in primary prevention (Anderson 2013; NCEP 2002; NICE 2014; Piepoli 2016; Stone 2014; WHO 2007). The 2013 ACC/AHA Cholesterol Guidelines in the USA, described in Stone 2014, and the National Institute for Health and Care Excellence (NICE) recommendations for the prevention of CVD in the UK, laid out in NICE 2014, both advocate risk‐based prevention strategies that incorporate multivariable CVD risk scores to estimate short‐ and long‐term CVD risk, providing a quantitative framework to guide clinician‐patient discussions regarding statins in primary prevention.
Analyses of randomised clinical trials (RCTs) provide empiric support for risk stratification by demonstrating that the absolute risk reduction from preventive medications is related more to the magnitude of pretreatment risk than the relative risk reduction associated with treating a single risk factor (BPLTTC 2014; CTT 2012; Jackson 2005). Therefore, use of CVD risk scores not only has the potential to effectively and efficiently direct preventive care to those in greatest need but may help maximise benefit of treatment in high‐risk people and minimise harms of over‐treatment in people at low risk. Additional purported benefits of CVD risk scores also include raising awareness of disease, improving communication between clinician and patient, and motivating adherence to recommended lifestyle changes or preventive therapies (Goff 2014).
Why it is important to do this review
Although considerable research has focused on the derivation and validation of multivariable CVD risk prediction tools in different populations, the effects of CVD risk scores to direct clinical practice is poorly understood, and few studies have examined their utility in clinical practice (Damen 2016). In 2006 and 2008, two related systematic reviews performed with Cochrane methodology identified only four RCTs testing the clinical effects of CVD risk scores and found no clear evidence that CVD risk assessment improved health outcomes (Beswick 2008; Brindle 2006). In 2008, a systematic review examining the clinical benefits or harms of providing CVD risk scores identified six trials showing that physicians presented with risk information tended to appropriately prescribe preventive therapies (Sheridan 2008). Another systematic review examining the effect of giving CVD risk information to adults in clinical practice identified 18 studies (14 RCTs) demonstrating that global CVD risk information improved accuracy of risk perception and increased patients' intent to start pharmacotherapy (Sheridan 2010). However, in both reviews the effect of CVD risk scores on health outcomes, risk factors, and health behaviours was unclear.
In spite of widespread recommendations for the use of multivariable CVD risk scores in clinical practice guidelines (Anderson 2013; NCEP 2002; NICE 2014; Piepoli 2016; Stone 2014; WHO 2007), uncertainty remains about their effects on health‐related outcomes. Given the publication of new trials and the continued prominence of multivariable CVD risk scores in primary CVD prevention guidelines, a systematic review of the literature is warranted.
Objectives
To assess the effects of evaluating and providing CVD risk scores in adults without prevalent CVD on cardiovascular outcomes, risk factor levels, preventive medication prescribing, and health behaviours.
Methods
Criteria for considering studies for this review
Types of studies
We included RCTs and quasi‐RCTs (systematic allocation) with individual or cluster allocation. We included studies reported as full text and abstracts as well as unpublished data.
Types of participants
We included studies that reported results for adults (18 years of age and older) in outpatient settings free of clinical CVD (defined as prior heart attack, stroke, heart failure, symptomatic peripheral vascular disease, or atrial fibrillation). Participants with diabetes mellitus or elevated risk factors as well as those already on background preventive medications were eligible for inclusion. For studies that included a combination of participants with and without prevalent CVD, we included studies that reported results for primary prevention participants. When studies included both primary and secondary prevention populations, we included only those studies with < 30% of the study population having prevalent CVD.
Types of interventions
We included trials that compared the systematic provision of a multivariable CVD risk score by a clinician, healthcare professional, or healthcare system versus usual care (i.e. no systematic provision of a CVD risk score) in primary CVD prevention. We excluded health risk appraisals not based on a risk score and studies testing risk of hypothetical patients.
Types of outcome measures
Primary outcomes
-
CVD events (a composite of fatal and non‐fatal myocardial infarction and stroke)
-
Change in risk factor levels
-
Cholesterol: total cholesterol, low‐density lipoprotein (LDL) cholesterol
-
Blood pressure: systolic blood pressure, diastolic blood pressure
-
Change in multivariable CVD risk: a summary score or risk estimate that incorporates multiple and simultaneous changes in different CVD risk factor levels
-
-
Investigator‐defined adverse events, including but not limited to physical or psychosocial events, including anxiety or depression
Secondary outcomes
-
Preventive medication prescribing in higher risk people
-
Lipid‐lowering medications
-
Antihypertensive medications
-
Aspirin
-
-
Medication adherence
-
Health‐related behaviours
-
Smoking cessation
-
Exercise
-
Diet
-
-
Decisional conflict, measured according to the decisional conflict scale
-
Health‐related quality of life, measured according to any validated scale concerning quality of life
-
Costs
Search methods for identification of studies
Key inclusion criteria were studies that were relevant to CVD primary prevention, employed a prospective design, and provided or incorporated a CVD risk score to guide treatment decisions in CVD prevention.
Exclusion criteria were studies that were unrelated to CVD risk scores; those addressing health risk appraisals not based on a quantitative risk score; those relying only on self‐reported risk factors and lifestyle; and those involving clinical vignettes or hypothetical patients rather than real patients.
Electronic searches
We identified trials through systematic searches of the following bibliographic databases on 15 March 2016.
-
Cochrane Central Register of Controlled Trials (CENTRAL; 2016 Issue 2) in the Cochrane Library (Wiley).
-
Ovid MEDLINE(R) (1946 to March Week 1 2016).
-
Ovid MEDLINE(R) In‐Process & Other Non‐Indexed Citations (14 March 2016).
-
Embase, including Embase Classic, via embase.com (1947 to 15 March 2016).
-
Conference Proceedings Citation Index‐Science (CPCI‐S) via Web of Science (1990 to 15 March 2016).
Two authors (KNK, MAB) designed the database searches based on the MEDLINE search strategy used in a previous systematic review published with Cochrane methodology (Beswick 2008). The search strategies for each database are available in Appendix 1. For the MEDLINE search, we applied the Cochrane sensitivity and precision maximizing RCT filter (Lefebvre 2011). For Embase, we translated from Ovid to embase.com syntax, the multiterm Embase filter with the best balance of sensitivity and specificity (Wong 2006), and we limited the search to records indexed in Embase. For Conference Proceedings Citation Index‐Science we used a combination of terms for identifying trials described in section 6.3.2.2 of the Cochrane Handbook for Systematic Reviews of Interventions (Lefebvre 2011). We applied no filters to the CENTRAL search.
We searched all databases from their inception to March 2016, and we imposed no restriction on language of publication.
Searching other resources
We tried to identify other potentially eligible trials or ancillary publications by searching the reference lists of retrieved included studies and relevant review articles for additional references. We also searched ClinicalTrials.gov (www.ClinicalTrials.gov) and the WHO International Clinical Trials Registry Platform (ICTRP) Search Portal (apps.who.int/trialsearch/) on 16 March 2016. Lastly, we contacted study authors of included or registered trials to identify further studies or unpublished data that could contribute to our review.
Data collection and analysis
Selection of studies
Three authors (KNK and SDP or MDH) independently screened titles and abstracts of every record retrieved to determine which studies to assess further, resolving disagreements by consensus. We then retrieved full‐text study reports/publications of all eligible or potentially eligible reports. Three authors (KNK and SDP or MDH) independently screened full‐text articles, identified studies for inclusion, and recorded reasons for exclusion of the ineligible studies. We resolved any disagreements through discussion or, if required, recourse to the third author (SDP or MDH). We identified and excluded duplicate reports and collated multiple reports of the same study so that each study, rather than each report, was the unit of analysis. We recorded the selection process in sufficient detail to complete a PRISMA flow diagram and Characteristics of excluded studies table.
Data extraction and management
For studies that fulfilled the inclusion criteria, we used standardised data extraction forms to record study characteristics and outcome data. We extracted the following study characteristics.
-
Methods: study design, total duration of study, details of any run‐in period, number of study centres and location, study country and setting, withdrawals, and date of study.
-
Participants: N, mean age, age range, sex, severity of condition, diagnostic criteria, baseline CVD risk, smoking history, inclusion criteria, and exclusion criteria.
-
Interventions: CVD risk score used, comparator group.
-
Outcomes: primary and secondary outcomes specified and collected, and time points reported.
-
Notes: funding for trial, and notable conflicts of interest of trial authors.
Three authors (KNK and SDP or MDH) independently extracted outcome data from included studies in duplicate. We resolved disagreements by consensus or by involving the third author. One author (KNK) transferred data into Review Manager 5 (RevMan 2014), and another author (SDP) spot‐checked to ensure that study characteristics and study data were entered correctly.
Assessment of risk of bias in included studies
Three authors (KNK and SDP or MDH) independently assessed risk of bias for each study using the criteria outlined in the Cochrane Handbook for Systematic Reviews of Interventions (Higgins 2011). We resolved disagreements by consensus or by involving the third author. We assessed risk of bias according to the following domains.
-
Random sequence generation.
-
Allocation concealment.
-
Blinding of participants and personnel.
-
Blinding of outcome assessment.
-
Incomplete outcome data.
-
Selective outcome reporting.
-
Other bias (e.g. industry funding).
We judged risk of bias criteria as low risk, unclear risk, or high risk and evaluated individual bias items as described in Higgins 2011. When considering treatment effects, we took into account the risk of bias for the studies that contributed to that outcome. For cluster‐RCTs, we followed Cochrane recommendations for assessing risk of bias, with particular attention across the domains of recruitment, baseline imbalances, loss of cluster, incorrect analyses, and comparability with individually RCTs (Higgins 2011). Two of the review authors (SDP and DLJ) performed two studies included in this review (Persell 2013; Persell 2015). For these two studies, data extraction and risk of bias assessment were performed by review authors who were not involved with the conduct of either study (KNK and MDH).
Assessment of bias in conducting the systematic review
We conducted the review according to a published protocol and reported any deviations from it in the Differences between protocol and review section.
Measures of treatment effect
We analysed dichotomous data as risk ratios (RRs) with 95% confidence intervals (CIs). We used inverse variance methods to facilitate meta‐analysis of outcomes from individual RCTs and appropriately analysed cluster‐RCTs (Chapter 16.3.3 of Higgins 2011). We used RevMan 2014 to convert the reported effect estimates to a common risk ratio format. We analysed continuous data as mean difference (MD) or standardised mean difference (SMD) with 95% CIs. We entered data presented as a scale with a consistent direction of effect. For meta‐analyses of mean differences, we pooled results of studies that reported final values with those reporting changes from baseline (Chapter 9.4.5.2 of Higgins 2011). For meta‐analyses of SMDs, we pooled results of studies that reported change from baseline (change scores).
Unit of analysis issues
We included RCTs with parallel design and cluster‐RCTs. For cluster‐RCTs, we recorded whether investigators accounted for clustering in their analyses (e.g. multilevel model, generalised estimating equations). If analyses adjusted for clustering, then we meta‐analysed individual RCTs with cluster‐RCTs. For continuous outcomes, we used the inverse‐variance method to calculate MDs and SMDs. For dichotomous outcomes, we used the generic inverse‐variance method to meta‐analyse the reported effect estimate (and corresponding standard error or confidence interval) from the appropriately‐analysed cluster‐RCT and the reported or calculated effect estimate from the individual RCT (Chapter 16.3.3 of Higgins 2011).
Dealing with missing data
We contacted investigators or study sponsors to verify key study characteristics and obtain missing numerical outcome data where possible (e.g. when a study is identified as abstract only). We investigated attrition rates, losses to follow‐up, withdrawals, and critically appraised methods for handling missing data and imputation methods. If standard deviations for outcomes were not available, we imputed these values from data within the trial using methods outlined in Chapter 16.1.3 of Higgins 2011 and through RevMan 2014
Assessment of heterogeneity
We used the I² statistic to measure heterogeneity among the trials in each analysis. If we identified substantial (I² > 50%) heterogeneity, we reported it and explored possible causes by subgroup analyses.
Assessment of reporting biases
We created and examined a funnel plot to explore possible publication and small study bias for the primary outcomes.
Data synthesis
We undertook meta‐analyses only if the treatments, participants, and the underlying clinical questions in the studies were similar enough for pooling to be appropriate. If there was no or moderate heterogeneity (I² < 50%), we performed fixed‐effect model meta‐analyses. If there was substantial heterogeneity (I² > 50%), we performed a random‐effects model meta‐analyses with cautious interpretation.
Subgroup analysis and investigation of heterogeneity
We had planned on performing the following pre‐specified subgroup analyses on our primary outcomes.
-
Sex (patient).
-
RCTs versus quasi‐RCTs.
-
Trials providing CVD risk scores to clinicians versus trials providing CVD risk scores to patients.
-
Trials that incorporated a multivariable CVD risk score within a clinical decision support tool (either clinician‐facing or patient‐facing).
Among these prespecified subgroups, we were only able to perform a subgroup analysis among trials that used or did not use a clinical decision support tool. We did not have sufficient data from each trial to perform subgroup analysis by sex. We identified only one quasi‐RCT. Lastly, many studies and protocols were unclear as to whether CVD risk scores were exclusively directed to a clinician or patient. Frequently, such risk scores were provided to both clinicians and patients during a clinical encounter.
Based on the substantial heterogeneity identified in our meta‐analysis, we also performed two post hoc subgroup analyses on:
-
Trials that utilised health information technology (IT) for risk assessment or risk communication.
-
Trials that exclusively enrolled participants with higher risk (defined as 10‐year CVD risk ≥ 10% or a high‐risk condition such as diabetes mellitus).
We used the formal test for subgroup interactions in RevMan 2014.
Sensitivity analysis
We had planned to carry out sensitivity analyses excluding studies assessed as being at unclear or high risk of bias in any domain. However, we assessed nearly all studies as being at unclear or high risk of bias, so this sensitivity analysis was not performed.
Summary of findings and assessment of the certainty of the evidence
We assessed the quality of the evidence for each outcome according to the GRADE approach and presented results in a 'Summary of findings' table (Guyatt 2008). We rated the quality of evidence as: high, moderate, low, or very low after consideration of within‐study risk of bias (methodological quality), directness of evidence, heterogeneity, precision of effect estimates, and risk of publication bias.
Results
Description of studies
See: Characteristics of included studies; Characteristics of excluded studies; Characteristics of studies awaiting classification; Characteristics of ongoing studies.
Results of the search
We identified 8723 records through database searching and an additional 13 records from prior systematic reviews of this topic (Brindle 2006; Beswick 2008; Sheridan 2008; Sheridan 2010; Willis 2012; Usher‐Smith 2015). The article selection process is depicted in the PRISMA flowchart in Figure 1. After removing duplicates, we screened 6422 records and excluded 6238 based on title and abstract. We removed an additional 5 duplicate records and assessed 179 full‐text records and 4 trial registry records for eligibility. We excluded 94 records of 77 studies and 2 trial registry records with reasons, identified 11 records of 10 ongoing studies, and listed 3 studies as awaiting classification. In total, we included 73 records of 41 studies (N = 194,035) in this systematic review.

Study flow diagram.
Included studies
Study design and location
Details of the methods, participants, intervention, comparison group, and outcome measures for each of the studies in this review are shown in the Characteristics of included studies table. We identified 23 individual‐level RCTs (N = 117,040), 17 cluster‐RCTs (N = 76,672), and 1 quasi‐RCT (N = 323). The earliest trial was reported in 1994 (British Family Heart 1994), and the most recent was reported in 2016 (Perestelo‐Perez 2016). Fifteen trials took place in European countries outside the UK (Benner 2008; Bucher 2010; Christensen 2004; Cobos 2005; Denig 2014; Engberg 2002; Hanon 2000; Hetlevik 1999; Jorgensen 2014; Koelewijn‐van Loon 2010; Krones 2008; Lopez‐Gonzalez 2015; Perestelo‐Perez 2016; Van Steenkiste 2007; Welschen 2012); 12 trials in the USA (Bertoni 2009; Eaton 2011; Edelman 2006; Jacobson 2006; Mann 2010; Persell 2013; Persell 2015; Sheridan 2006; Sheridan 2011; Turner 2012; Williams 2006; Zullig 2014); 7 trials in the UK (British Family Heart 1994; Hall 2003; Hanlon 1995; Holt 2010; Montgomery 2000; Montgomery 2003; Price 2011); 3 trials in Canada (Grover 2007; Lowensteyn 1998; Wister 2007); 3 trials in Australia or New Zealand (Peiris 2015; Vagholkar 2014; Webster 2010); and 1 Internet‐based trial that did not report a specific country (Soureti 2011). All studies were conducted in the outpatient setting. Participant follow‐up ranged from no follow‐up in Hall 2003, Jacobson 2006 and Sheridan 2006 to 10 years of extended follow‐up in Jorgensen 2014. In total, 21 out of 41 trials reported a follow‐up of one year or more.
Participants
Mean age reported in the trials ranged from 40 years in Engberg 2002 to 71 years in Montgomery 2000, and the proportion of female participants ranged from 8% in Hanlon 1995 to 80% in Edelman 2006. In the 20 trials that reported participants' ethnicity, most (16 out of 20) included a majority of white or European participants; the remaining 4 trials included a majority of African American participants (Jacobson 2006; Mann 2010; Persell 2015; Turner 2012). Participants in the included trials had varying past medical histories. Ten trials included only participants with higher CVD risk (defined as diabetes mellitus or 10‐year CVD risk ≥ 10%) (Benner 2008; Denig 2014; Grover 2007; Hall 2003; Mann 2010; Perestelo‐Perez 2016; Persell 2013; Persell 2015; Price 2011; Welschen 2012), and 5 of these trials included only participants with diabetes mellitus (Denig 2014; Mann 2010; Perestelo‐Perez 2016; Price 2011; Welschen 2012). The other 31 trials included participants with all risk levels. There were 13 trials that included participants with prevalent CVD, but based on our selection criteria we included only those trials where these participants made up < 30% of the total sample (Bertoni 2009; British Family Heart 1994; Cobos 2005; Eaton 2011; Grover 2007; Holt 2010; Krones 2008; Montgomery 2000; Peiris 2015; Perestelo‐Perez 2016; Turner 2012; Webster 2010; Zullig 2014). One trial included participants with human immunodeficiency virus (HIV) who were part of the Swiss HIV Cohort Study (Bucher 2010).
Interventions and comparison groups
Interventions varied across trials, which featured different CVD risk scores, risk presentations, and co‐interventions (Figure 2). The two most common CVD risk scores used were the Framingham Coronary Heart Disease Risk Score (24 trials) and the UK Prospective Diabetes Study (UKPDS) risk engine (6 trials). In these trials, baseline CVD risk was presented as a 5‐ or 10‐year absolute risk of a CVD event. Six trials used risk‐adjusted cardiovascular age (called by various names such as heart age, cardiovascular age, or vascular age) in addition to or in lieu of the absolute CVD risk information (Eaton 2011; Grover 2007; Lopez‐Gonzalez 2015; Lowensteyn 1998; Peiris 2015; Soureti 2011). In addition to the risk message, interventions also included: patient education material (31 trials); clinician‐ or patient‐facing decision‐support tools (27 trials); nurse counselling (11 trials); academic detailing/continuing medical education (9 trials); electronic health record integration (10 trials); electronic or paper‐based reminders (7 trials); and audit and feedback (4 trials). A few trials implemented only one of these components (Hall 2003; Hanon 2000; Lopez‐Gonzalez 2015; Welschen 2012), while on the opposite side of the spectrum, there were five or more of these components (Bertoni 2009; Denig 2014; ; Koelewijn‐van Loon 2010; Peiris 2015; Sheridan 2011; Turner 2012; Vagholkar 2014; Wister 2007). In total, among the 41 studies, 28 studies incorporated health IT for some aspect of the risk score intervention. The range of co‐interventions is summarised in Figure 2.

Summary of CVD risk score interventions by included study.
Abbreviations: CHD: coronary heart disease; CVD: cardiovascular disease; FRS: Framingham risk score; MI: myocardial infarction; RF: risk factors, RR: risk ratio; UKPDS: United Kingdom Prospective Diabetes Study
Comparison groups were generally characterised as 'usual care' by study authors and did not include the systematic provision of CVD risk scores. Some studies described the addition of: passive guideline dissemination (Bucher 2010; Mann 2010; Van Steenkiste 2007), provision of risk factor levels alone (Edelman 2006; Jacobson 2006; Sheridan 2006), continuing medical education for an unrelated topic (Bertoni 2009; Krones 2008), and general health and risk factor information (Cobos 2005; Soureti 2011; Turner 2012; Webster 2010; Welschen 2012; Zullig 2014). Comparison group descriptions are summarised in Figure 2.
Outcomes
Among the included trials, the most common primary outcome in 10 trials addressed a clinical care process measure such as risk factor screening, preventive treatment discussions, guideline adherence, or achievement of risk factor targets (Bertoni 2009; Cobos 2005; Eaton 2011; Grover 2007; Jacobson 2006; Lowensteyn 1998; Montgomery 2000; Peiris 2015; Persell 2015; Sheridan 2006). Other primary outcomes reported in the included studies were multivariable CVD risk in eight trials (Benner 2008; British Family Heart 1994; Edelman 2006; Hanlon 1995; Krones 2008; Turner 2012; Wister 2007; Zullig 2014), patient‐reported outcomes in seven trials (Christensen 2004; Denig 2014; Koelewijn‐van Loon 2010; Mann 2010; Montgomery 2003; Perestelo‐Perez 2016; Welschen 2012), CVD risk factor levels in six trials (Bucher 2010; Grover 2007; Hanon 2000; Lopez‐Gonzalez 2015; Persell 2013; Persell 2015), medication prescribing rates in four trials (Hall 2003; Vagholkar 2014; Van Steenkiste 2007; Webster 2010), and health behaviours in three trials (Price 2011; Soureti 2011; Williams 2006). Only two trials reported CVD events as a primary outcome, but both reported being underpowered for this endpoint after completion of the study (Holt 2010; Jorgensen 2014).
Study funding sources
We present detailed information on study funding sources in the Characteristics of included studies table. Five trials reported receiving study funding exclusively from pharmaceutical companies (Benner 2008; Cobos 2005; Grover 2007; Lowensteyn 1998; Soureti 2011). There were 19 trials that reported funding from public and/or federal government sources (Bertoni 2009; Denig 2014; Edelman 2006; Hanlon 1995; Hetlevik 1999; Koelewijn‐van Loon 2010; Krones 2008; Montgomery 2000; Montgomery 2003; Peiris 2015; Perestelo‐Perez 2016; Persell 2013; Persell 2015; Sheridan 2011; Vagholkar 2014; Van Steenkiste 2007; Welschen 2012; Williams 2006; Wister 2007), 7 trials that reported study funding from a combination of public and private sources (British Family Heart 1994; Bucher 2010; Christensen 2004; Engberg 2002; Jorgensen 2014; Turner 2012; Webster 2010), and 3 trials with study funding from internal (usually hospital) sources (Holt 2010; Jacobson 2006; Sheridan 2006). Five trials did not report sources of study funding (Eaton 2011; Hall 2003; Hanon 2000; Lopez‐Gonzalez 2015; Mann 2010).
Excluded studies
We excluded 94 records of 77 studies after full‐text review and 2 trial registry records. The most common reason for exclusion was that a risk score was not part of the intervention (41 trials). We excluded other studies because they provided CVD risk scores in all treatment groups without a usual care comparator group (16 trials), were not an RCT or quasi‐RCT (10 trials), did not study a primary prevention population (11 trials), or used clinical vignettes and hypothetical patients (1 trial).
A complete list of excluded studies, along with the reason for exclusion of each study, is presented in the Characteristics of excluded studies table.
Studies awaiting classification
We identified three studies awaiting classification (Adamson 2013; Gryn 2012; Roach 2012). Two of these studies included participants with diabetes mellitus (Adamson 2013; Roach 2012), and one included participants with hypertension (Gryn 2012). All three studies reported having an intervention group that received a personalised CVD risk estimate, but the identified records were abstracts and did not provide sufficient details to determine eligibility for this systematic review. Authors of two of these studies reported preparing manuscripts (Gryn 2012; Roach 2012). We present additional details of these studies in the Characteristics of studies awaiting classification table.
Ongoing studies
We identified 11 reports of 10 ongoing studies. Three of these studies are taking place in Europe (Badenbroek 2014; Ijkema 2014; Maindal 2014), one in the USA (Sanghavi 2015), one in Canada (NCT00694239), one in the UK (Silarova 2015), one in Australia (Redfern 2014), and three in low‐ and middle‐income countries (NCT02096887; Ogedegbe 2014; Praveen 2013). Two studies will supplement CVD risk scores with novel sources of CVD risk information: Ijkema 2014 with coronary artery calcium scores and Silarova 2015 with genetic risk information. Three ongoing studies will test innovative implementation models to provide CVD risk scores. These include: direct‐to‐patient health portals within an electronic health record (Redfern 2014), non‐physician healthcare workers in resource‐poor settings (Praveen 2013), and financial incentives linked to CVD risk assessment and absolute risk reduction (Sanghavi 2015). The Characteristics of ongoing studies table presents details of these studies.
Risk of bias in included studies
Overall and trial‐specific assessment of risk of bias are shown in Figure 3 and Figure 4. In general, there was high risk of bias across the included studies. Due to the nature of the intervention, few trials were able to blind participants, study personnel, or both. Thus, in our overall risk of bias assessment, we put greater weight on blinding of outcome assessment (detection bias) compared to blinding of participants or study personnel (performance bias). We concluded that only three trials had an overall low risk of bias across most domains (Peiris 2015; Persell 2013; Persell 2015). We summarise risk of bias assessment across each domain below, but detailed documentation supporting risk of bias assessment for each trial is included in the Characteristics of included studies table.

Risk of bias summary: review authors' judgements about each risk of bias item for each included study.

Risk of bias graph: review authors' judgements about each risk of bias item presented as percentages across all included studies.
Allocation
There were 19 trials that adequately reported the methods used for random sequence generation, and we assessed them as being at low risk of bias (Benner 2008; Bucher 2010; Cobos 2005; Denig 2014; Hanlon 1995; Jorgensen 2014; Koelewijn‐van Loon 2010; Montgomery 2000; Montgomery 2003; Peiris 2015; Perestelo‐Perez 2016; Persell 2013; Persell 2015; Price 2011; Vagholkar 2014; Van Steenkiste 2007; Webster 2010; Welschen 2012; Wister 2007). We assessed 19 trials as being at unclear risk of bias and 3 trials as having an inadequate method of random sequence generation.
Sixteen trials reported adequate allocation concealment (Bucher 2010; Denig 2014; Engberg 2002; Grover 2007; Koelewijn‐van Loon 2010; Montgomery 2000; Montgomery 2003; Peiris 2015; Persell 2013; Persell 2015; Price 2011; Sheridan 2006; Vagholkar 2014; Webster 2010; Welschen 2012; Williams 2006). Among the remaining trials, there were 18 at unclear risk of bias and 7 trials at high risk of bias for allocation concealment.
In total, 12 trials were assessed as being at low risk of selection bias, that is, for both random sequence generation and allocation concealment (Bucher 2010; Denig 2014; Koelewijn‐van Loon 2010; Montgomery 2000; Montgomery 2003; Peiris 2015; Persell 2013; Persell 2015; Price 2011; Vagholkar 2014; Webster 2010; Welschen 2012).
Blinding
Due to the nature of the intervention, we assessed 38 out of 41 trials as being at high risk of bias due to an unblinded study design. The trials with low or unclear risk of bias were Internet‐based studies where research personnel had no direct contact with participants (Soureti 2011; Webster 2010). Therefore, we used blinding of outcome assessors to determine overall risk of bias. Among the 41 trials, 12 trials reported adequate blinding of outcome assessors (Bertoni 2009; Eaton 2011; Edelman 2006; Holt 2010; Jorgensen 2014; Peiris 2015; Persell 2013; Persell 2015; Price 2011; Turner 2012; Vagholkar 2014; Wister 2007). The remaining 18 trials were at unclear risk of bias, and 11 trials were at high risk of bias due to unblinded outcome assessors.
Incomplete outcome data
Many studies suffered from high losses to follow‐up and missing data, particularly data used for calculating follow‐up cholesterol levels or risk scores. Moreover, few studies performed intention‐to‐treat analyses. Only 13 trials adequately addressed incomplete data (Bucher 2010; Eaton 2011; Grover 2007; Hall 2003; Hanlon 1995; Holt 2010; Jorgensen 2014; Lopez‐Gonzalez 2015; Montgomery 2003; Peiris 2015; Sheridan 2011; Webster 2010; Wister 2007). We assessed 8 trials as being at unclear risk of bias and 20 trials as being at high risk of bias due to incomplete outcome data.
Selective reporting
Several of the included studies either had protocols available for review or were prospectively registered. The risk of bias associated with selective reporting was low in 15 trials (Benner 2008; Bertoni 2009; British Family Heart 1994; Denig 2014; Holt 2010; Krones 2008; Peiris 2015; Persell 2013; Persell 2015; Price 2011; Sheridan 2006; Sheridan 2011; Webster 2010; Welschen 2012; Williams 2006), unclear in 18 trials, and high in 8 trials.
Other potential sources of bias
Other potential sources of bias are reviewed in detail in the Characteristics of included studies table. Common sources of potential bias included: pharmaceutical funding or potential financial conflicts of interest among study authors (Benner 2008; Cobos 2005; Engberg 2002; Grover 2007; Holt 2010; Lowensteyn 1998; Soureti 2011; Williams 2006); contamination bias (Denig 2014; Grover 2007; Hanlon 1995; Holt 2010; Jacobson 2006; Jorgensen 2014; Persell 2015; Sheridan 2006; Sheridan 2011; Welschen 2012; Wister 2007); and poor fidelity to the intervention protocol (Bertoni 2009; British Family Heart 1994; Denig 2014; Eaton 2011; Mann 2010).
Effects of interventions
See: Summary of findings 1 CVD risk scoring for the primary prevention of cardiovascular disease
See: Summary of findings for the main outcomes (summary of findings Table 1).
Primary outcomes
Cardiovascular disease events
We identified only three RCTs (N = 99,070) that reported the effects of providing CVD risk scores on CVD events (Bucher 2010; Holt 2010; Jorgensen 2014). Among participants in the CVD risk score group, there was low‐quality evidence suggesting little or no effect on CVD events compared with usual care (5.4% versus 5.3%; RR 1.01, 95% CI 0.95 to 1.08; I² = 25%; Analysis 1.1). Notably, study authors from two of these trials reported being underpowered for this endpoint because of limited recruitment of participants over the age of 50 and low CVD event rates (Holt 2010; Jorgensen 2014). The third trial was in a cohort of people with HIV in Switzerland (Bucher 2010). Due to the unique characteristics and limited generalisability of this cohort, we reanalysed data excluding this study; results were unchanged in direction and magnitude (Analysis 1.2).
Cholesterol level
Effects of providing CVD risk scores on cholesterol levels were reported for total cholesterol and LDL cholesterol. We identified 12 RCTs (N = 20,437) that reported the effects of providing CVD risk scores on total cholesterol and were included in the meta‐analysis. There was low‐quality evidence suggesting that providing CVD risk scores may slightly reduce total cholesterol levels compared with usual care (MD −0.10 mmol/L, 95% CI −0.20 to 0.00; I² = 94%; Analysis 1.3). We also identified 10 RCTs (N = 22,122) that reported on the effects of providing CVD risk scores on LDL cholesterol levels. There was uncertainty about the effect of providing CVD risk scores compared with usual care on LDL cholesterol levels (MD −0.03 mmol/L, 95% CI −0.10 to 0.04; I² = 84%; low‐quality evidence; Analysis 1.4); the results were imprecise but similar in direction and magnitude to those for total cholesterol. There was substantial heterogeneity for both outcomes that was not explained by a single trial, so these effect estimates should be interpreted with caution. There was no evidence of publication bias by funnel plot for total cholesterol level (Figure 5). Many of the trials identified in this review reported on achievement of guideline‐recommended cholesterol goals after provision of a CVD risk score. However, this outcome was deemed to be unsuitable for meta‐analysis due to the marked variation in cholesterol goals from different countries, guidelines, and time periods. One pragmatic clinical trial (N = 435) did not use systematic follow‐up procedures after providing CVD risk scores but reported that participants in the CVD risk score group had a greater proportion of repeat LDL cholesterol levels > 30 mg/dL lower than baseline compared with those in the usual care group (22.5% vs. 16.1%, OR 1.59, 95% CI 1.05 to 2.41, P = 0.029; Persell 2013).

Funnel plot of comparison: 1 CVD risk score versus no CVD risk score/usual care, outcome: 1.3 Total cholesterol (mmol/L).
Blood pressure level
Trials reported the effects of providing CVD risk scores on blood pressure levels for systolic blood pressure, diastolic blood pressure, or both. We identified low‐quality evidence suggesting that providing CVD risk scores may slightly reduce systolic blood pressure compared with usual care (MD −2.77 mmHg, 95% CI −4.16 to −1.38; I² = 93%; 16 trials, N = 32,954; Analysis 1.5). Similarly, we found low‐quality evidence suggesting that providing CVD risk scores may slightly reduce diastolic blood pressure compared with usual care (MD −1.12 mmHg, 95% CI −2.11 to −0.13; I² = 94%; 14 trials, N = 22,378; Analysis 1.6). There was substantial heterogeneity for both outcomes that was not explained by a single trial, so readers should interpret these estimates with caution. There was no evidence of publication bias by funnel plot for systolic blood pressure (Figure 6). Of note, there were two RCTs that reported the effects of providing CVD risk scores on systolic and diastolic blood pressures, but we did not pool them because of insufficient data (Bucher 2010; Hanon 2000). Neither trial found a difference in blood pressure level between the CVD risk score versus usual care groups.

Funnel plot of comparison: 1 CVD risk score versus no CVD risk score/usual care, outcome: 1.5 Systolic blood pressure (mmHg).
Multivariable CVD risk
In total, 17 RCTs (N = 29,119) reported on the effects of providing CVD risk scores on multivariable CVD risk (a summary measure that incorporated changes in multiple different CVD risk factor levels simultaneously). The scale of this measure varied among studies. Moreover, some studies compared final values between the two treatment groups while others compared change from baseline values. We elected to calculate standardised mean differences (SMDs) for change from baseline values for the CVD risk score group and the usual care comparator for our main outcomes. We identified low‐quality evidence suggesting that providing CVD risk scores may slightly reduce multivariable CVD risk compared with usual care (SMD −0.21, 95% CI −0.39 to −0.02; I² = 94%; 9 trials, N = 9549; Analysis 1.7). There was substantial heterogeneity that was not explained by a single trial, so readers should interpret these estimates with caution. There was no evidence of publication bias by funnel plot (Figure 7). We also meta‐analysed studies that compared final values for multivariable CVD risk estimates between the intervention and comparison groups and observed similar findings (SMD −0.15, 95% CI −0.25 to −0.06; Analysis 5.1).

Funnel plot of comparison: 1 CVD risk score versus no CVD risk score/usual care, outcome: 1.7 Change in multivariable CVD risk.
Five trials reported the effects of the intervention on multivariable CVD risk, but we did not pool these in the meta‐analyses because of how they reported data (British Family Heart 1994, Bucher 2010; Hetlevik 1999; Price 2011; Zullig 2014). One of these trials demonstrated a reduction in multivariable CVD risk with the provision of a CVD risk score (British Family Heart 1994). This cluster‐RCT randomised 12,472 men and women in 13 towns in Britain to a nurse‐led screening and counselling programme based on Dundee score (a measure of coronary heart disease risk) or usual care. After one year, the intervention reduced the Dundee risk score by 16.1% (95% CI 10.9% to 21.1%) in men and 15.7% (95% CI 7.4% to 23.3%) in women compared with usual care. The other four studies (N = 6626), however, did not find that provision of a CVD risk score changed multivariable CVD risk (Bucher 2010; Hetlevik 1999; Price 2011; Zullig 2014).
Adverse events
There were four RCTs (N = 4630) that reported on adverse events after providing a CVD risk score (Benner 2008; Grover 2007; Price 2011; Turner 2012). Definition of adverse events varied between studies and included back pain, headache, cough, upper respiratory infection, musculoskeletal pain, and anxiety. There was low‐quality evidence suggesting that providing a CVD risk score may reduce adverse events compared with usual care, but the results were imprecise (1.9% versus 2.7%; RR 0.72, 95% CI 0.49 to 1.04; I² = 0%; Analysis 1.8). There were three RCTs (N = 968) that specifically reported on the effect of the CVD risk scores on anxiety (Montgomery 2000; Van Steenkiste 2007; Welschen 2012). Two measured anxiety as a continuous variable and observed that providing CVD risk scores may have little to no effect on anxiety compared with usual care (SMD −0.07, 95% CI −0.27 to 0.13; I² = 0%; 2 studies, N = 388; low‐quality evidence; Analysis 1.9). We did not include Van Steenkiste 2007 in meta‐analysis due to insufficient reporting of data but observed no difference in the proportion of anxious participants who received a CVD score versus usual care (16% vs 16%, P value not provided). Lastly, one trial measured psychological distress in middle‐aged participants who received a CVD risk assessment (with or without primary care physician follow‐up) compared with usual care (Christensen 2004). This trial found no difference in psychological distress at one and five years between participants in the two treatment groups that received a CVD risk assessment compared with those in the usual care group (P = 0.466 at one year and P = 0.579 at five years).
Secondary outcomes
Medication prescriptions in higher risk individuals
New or intensified lipid‐lowering medications
We identified low‐quality evidence suggesting that providing CVD risk scores may increase prescriptions for new or intensified lipid‐lowering medications in higher risk people compared with usual care (15.7% versus 10.7%; RR 1.47, 95% CI 1.15 to 1.87; I² = 40%; 11 trials, N = 14,175; Analysis 1.10). There was substantial heterogeneity among studies that was not explained by a single trial, so readers should interpret these estimates with caution.
Four additional studies reported the effects of providing a CVD risk score on lipid‐lowering medication prescribing compared with usual care, but we did not include them in the meta‐analysis because they did not report sufficient data to determine which higher‐risk participants received a lipid‐lowering medication (Bertoni 2009; Cobos 2005; Krones 2008; Webster 2010). None of these studies reported a change in lipid‐lowering medication prescribing. In Bertoni 2009, use of a CVD risk score‐based decision support tool increased "guideline‐concordant lipid‐lowering therapy" compared with passive dissemination of an unrelated guideline (9.7%, 95% CI 2.8% to 16.6%), but this was primarily driven by a reduction in inappropriate prescribing in lower risk individuals. Authors reported no difference in appropriate lipid‐lowering medication prescribing rates (P = 0.37) (Bertoni 2009). Similarly, in Cobos 2005, a computerised decision‐support tool that provided a personalised CVD risk score decreased inappropriate statin prescribing (primarily in lower risk individuals) but did not increase guideline‐recommended statin prescribing compared with usual care. In Krones 2008, the authors reported no difference in the proportion of participants with CVD risk >15% who were treated with preventive medications between the CVD risk score group and the usual care comparator but formal statistical testing was not presented. Lastly, in Webster 2010, there was no difference in new or increased lipid‐lowering medication prescribing in a group of Australian adults randomised to a web‐based decision support tool (percent difference −1.6%, 95% CI −3.57 to 0.57, P = 0.15), but insufficient data were available to determine risk status of participants who received therapy.
New or intensified antihypertensive medications
We identified low‐quality evidence that providing CVD risk scores may increase new or intensified antihypertensive medications compared with usual care (17.2% versus 11.4%; RR 1.51, 95% CI 1.08 to 2.11, I² = 53%; 8 studies, N = 13,255; Analysis 1.11). There was substantial heterogeneity among studies that was not explained by a single trial, so readers should interpret these estimates with caution. We did not pool three studies reporting the effects of providing CVD risk scores on antihypertensive medication prescribing in the meta‐analysis because they did not provide sufficient information to determine which high‐risk participants were prescribed antihypertensive medications. None of these studies reported a difference in antihypertensive medication prescribing between the two groups (Jacobson 2006; Krones 2008; Montgomery 2003).
New aspirin prescriptions
Providing CVD risk scores may increase new aspirin prescribing compared with usual care (RR 2.71, 95% CI 1.24 to 5.91, I² = 0%; 3 studies, N = 1614; Analysis 1.12). We did not pool three additional studies reporting the effect of providing CVD risk scores on aspirin prescribing in the meta‐analysis because it was unclear which participants were at higher risk (Jacobson 2006; Krones 2008), and the trials did not provide data on primary prevention (Peiris 2015). Two of these studies reported no difference in aspirin prescribing in the overall study population (Jacobson 2006; Krones 2008). The other study reported an increase in aspirin prescribing among participants with prevalent CVD (17.8% vs 2.7%; RR 4.79, 95% CI 2.47 to 9.29), but this did not meet the primary prevention focus of this review (Peiris 2015).
Medication adherence
There was uncertainty whether providing CVD risk scores had an effect on medication adherence compared with usual care (RR 1.14, 95% CI 0.92 to 1.41, I² = 58%; 4 studies, N = 621; Analysis 1.13). One additional study (N = 150) reported "no difference" in medication adherence rates between participants randomised to a statin decision support tool but did not provide specific estimates or statistical testing (Mann 2010).
Health behaviours
Smoking
Providing a CVD risk score may increase smoking cessation compared with usual care (RR 1.38, 95% CI 1.13 to 1.69, I² = 0%; 7 studies, N = 5346; Analysis 1.14). There were nine additional studies that reported on the effects of providing CVD risk scores on the prevalence of smoking rates, and results were mixed. Five of these studies reported reductions in smoking prevalence in the CVD risk score group compared with the usual care group (British Family Heart 1994; Jorgensen 2014; Koelewijn‐van Loon 2010; Lopez‐Gonzalez 2015; Van Steenkiste 2007), whereas four studies reported no change in smoking prevalence in the CVD risk score group compared with usual care (Denig 2014; Hetlevik 1999; Price 2011; Zullig 2014). In the only study to biochemically verify smoking status, there was no difference in urine cotinine for participants who received a CVD risk score compared with usual care (SMD −0.53, 95% CI −1.23 to 0.17, P = 0.136; Price 2011).
Exercise
There were eight RCTs (N = 8391) that reported the effects of providing CVD risk scores on physical activity (Edelman 2006; Hanlon 1995; Koelewijn‐van Loon 2010; Lopez‐Gonzalez 2015; Price 2011; Van Steenkiste 2007; Webster 2010; Wister 2007). Physical activity outcomes varied by studies and included: self‐reported increase in physical activity, number of days exercising > 30 minutes, and proportion meeting physical activity guidelines. Two studies (N = 2595) measured self‐reported increase in physical activity, and demonstrated no evidence that providing a CVD risk score had an effect on this outcome compared with usual care (RR 0.98, 95% CI 0.90 to 1.06, I² = 0%; Analysis 1.15). The remaining 6 RCTs reported mixed results on physical activity. One RCT of 154 participants reported an increase in the number of days with physical activity > 30 minutes (3.7 days in intervention versus 2.4 days in control; P = 0.002; Edelman 2006). Similarly, Lopez‐Gonzalez 2015 reported an increase in self‐reported exercise sessions per week in participants receiving a Framingham risk message compared with usual care: 3.48 sessions (95% CI 3.35 to 3.62) in the Framingham risk message group versus 3.60 sessions (95% CI 3.47 to 3.73) in the usual care group. In Van Steenkiste 2007, authors reported an increase in within‐group physical activity among participants receiving a CVD risk score compared with usual care, but there were marked baseline imbalances between the two treatment groups and follow‐up data were missing from >50% of participants. In contrast, there was no change in physical activity in the CVD risk score group compared with usual care in two RCTs involving 930 participants (Koelewijn‐van Loon 2010; Wister 2007). Only one RCT (N = 198) used an objective measure of physical activity with an accelerometer and showed no difference in total accelerometer counts between those in the CVD risk score group and those in the usual care group (SMD 0.086, 95% CI −0.202 to 0.374, P = 0.559; Price 2011).
Diet
There were six RCTs (N = 5375) that reported information on the effects of providing CVD risk scores on diet (Hanlon 1995; Koelewijn‐van Loon 2010; Price 2011; Soureti 2011; Webster 2010; Wister 2007). Measures of diet were highly variable with little overlap, so we did not perform quantitative meta‐analysis. Results varied among studies. Two studies reported improvements in heart‐healthy diets after providing a CVD risk score (Hanlon 1995; Wister 2007). In Hanlon 1995, self‐reported increase in fruit and vegetable consumption (24.3% versus 11.6%, P < 0.001) and self‐reported reduction in fat consumption (30.0% versus 9.4%, P < 0.001) was greater in the CVD risk score group compared with usual care (Hanlon 1995). Similarly, in Wister 2007 nutritional level (as measured by a 5‐point ordinal scale based on the number of recommended food groups met per day)was higher in the CVD risk score group compared with the usual care group (0.30, 95% CI 0.13 to 0.47 versus −0.05, 95% CI −0.22 to 0.12; p <0.01; units not provided). In contrast, four studies reported no difference in healthy dietary patterns between the two groups (Koelewijn‐van Loon 2010; Price 2011; Soureti 2011; Webster 2010).
Decisional conflict
We identified evidence suggesting that providing a CVD risk score may reduce decisional conflict compared with usual care (SMD −0.29, 95% CI −0.57 to −0.01, I² = 79%; 4 studies, N = 1261; Analysis 1.16). The effect estimate had substantial heterogeneity that was explained by Montgomery 2003, the study with the largest magnitude reduction in decisional conflict. The direction of the effect was similar, but the magnitude was attenuated when excluding this trial from the analysis (SMD −0.16, 95% CI −0.28 to −0.04, I² = 0%; 3 studies, N = 1049 participants).
Health‐related quality of life
One trial (N = 308) reported on the effect of providing CVD risk scores on health‐related quality of life, measured by the Dutch Euro quality of life (EQ5D‐NL) scale. There was no evidence to suggest that providing CVD risk scores compared with usual care had an effect on quality of life in this one study (effect size −0.006, 95% CI −0.035 to 0.023, I² = 0%; Denig 2014).
Costs
One trial conducted in Spain reported the effects of providing CVD risk scores on direct costs (Cobos 2005). Providing a CVD risk score to a clinician decreased overall lipid‐lowering medication prescribing rates by decreasing prescriptions in low‐risk individuals. The adjusted mean treatment cost per patient was EUR 237 in the usual care group versus EUR 178 in the intervention group, for a difference of EUR 59 (95% CI 34, 83; P < 0.001), a savings of 25% in treatment costs. Similarly, the adjusted means of the total costs per patient were EUR 283 in the usual care group versus EUR 223 in the intervention group, for a difference of EUR 60 (95% CI 33, 86; P = 0.001), a total savings of 21%. A reduction in lipid‐lowering medication prescribing rates among low‐risk participants was also seen in a quality improvement trial employing a personal digital assistant (PDA) that calculated 10‐year coronary heart disease risk (Bertoni 2009); however, investigators performed no formal cost‐effectiveness analysis. Likewise, British Family Heart 1994 did not perform a formal cost‐effectiveness analysis, but based on the observed risk factor changes and the projected reduction in coronary events, the authors suggested that the modest improvements did not support broader implementation of the intervention.
Subgroup and sensitivity analyses
We performed a subgroup analysis evaluating the effects of providing CVD risk scores on CVD risk factor levels (total cholesterol, LDL‐cholesterol, systolic blood pressure, diastolic blood pressure, and multivariable CVD risk) by use of clinical decision‐support tools to provide CVD risk scores. Results were similar in magnitude and direction, but substantial heterogeneity remained for all analyses (Analysis 2.1; Analysis 2.2; Analysis 2.3; Analysis 2.4; Analysis 2.5).
Due to the substantial heterogeneity observed for CVD risk factor levels, we also performed post hoc subgroup analyses evaluating the effects of providing CVD risk scores by use of health IT and by trials that exclusively enrolled participants with higher risk (defined as 10‐year CVD risk ≥ 10% or a high‐risk condition such as diabetes mellitus). For subgroup analyses by use of health IT, results were similar in magnitude and direction, but substantial heterogeneity remained for all analyses (Analysis 3.1; Analysis 3.2; Analysis 3.3; Analysis 3.4; Analysis 3.5). In contrast, heterogeneity for the effects of providing CVD risk scores on total cholesterol and LDL cholesterol was attenuated when including trials that exclusively enrolled higher‐risk participants (MD −0.13 mmol/L, 95% CI −0.22 to −0.03, I² = 34%; 3 studies, N = 4105 for total cholesterol, Analysis 4.1; and MD −0.07 mmol/L, 95% CI −0.11 to −0.03, I² = 0%; 3 studies, N = 14,219 for LDL cholesterol, Analysis 4.2). This attenuation of heterogeneity was not seen for systolic blood pressure (Analysis 4.3), diastolic blood pressure (Analysis 4.4), or multivariable CVD risk (Analysis 4.5), which may reflect the greater emphasis on risk‐based treatment in cholesterol guidelines compared with blood pressure guidelines.
We did not identify sufficient data to perform subgroup analyses by sex or trial design (RCT versus quasi‐RCT). Additionally, after reading study protocols, it was often unclear whether CVD risk scores were provided directly to patients or to clinicians because frequently CVD risk scores were provided to both within the context of a clinical encounter. We did not perform sensitivity analyses because we assessed all studies as being at unclear or high risk of bias.
Discussion
Summary of main results
The trials identified in this systematic review provide low‐quality evidence that current strategies for providing CVD risk scores in primary prevention may have little to no effect on CVD events compared with usual care. However, only three studies reported this outcome, and all had limitations. Compared with usual care, providing CVD risk scores may reduce CVD risk factors like cholesterol, blood pressure and multivariable CVD risk by a small amount and may reduce adverse events, but results were imprecise. There was substantial heterogeneity for many analyses, particularly when analysing change in risk factor levels. This was likely a result of: diverse risk levels of the participants recruited for the studies; the multifaceted and varying nature of the interventions tested; different baseline medication treatment rates; and the different outcomes collected. Given this heterogeneity, readers should interpret results with caution.
Providing CVD risk scores may increase prescriptions for new or intensified lipid‐lowering medications, new or intensified antihypertensive medications, and new aspirin therapy in higher‐risk people. Further, providing CVD risk scores may increase smoking cessation and may reduce decisional conflict compared with usual care. However, providing CVD risk scores may have little to no effect on medication adherence or health‐related quality of life. Measurement of exercise and diet was highly variable among the included studies, and the effects of providing CVD risk scores on these outcomes were mixed. Data on costs were also limited but suggest a reduction in healthcare costs after providing CVD risks scores. Full reporting of effect sizes and quality of evidence ratings for main outcomes are listed in summary of findings Table 1.
Overall completeness and applicability of evidence
This review provides the most contemporary appraisal of the evidence to date. We identified 73 records of 41 studies (N = 193,614), 8 ongoing studies, and 3 studies awaiting classification. This compares with only four trials (N = 4648) identified in two previous systematic reviews addressing a similar objective and using Cochrane methodology (Brindle 2006; Beswick 2008). We employed broad selection criteria that led to the inclusion of a wide range of trials with different designs, risk levels among participants, and choices of outcomes. CVD risk score interventions also ranged from simple CVD risk score presentations to multifaceted interventions that incorporated different risk messages, clinical decision support tools, electronic reminders, patient activation material, audit and feedback, and nurse‐led counselling sessions. These inclusive selection criteria led to substantial heterogeneity in many of our pooled estimates. However, they also enhance the external validity of our findings due to the varied settings, populations, and interventions studied in the trials. Although many CVD prevention guidelines recommend the use of multivariable CVD risk scores to guide primary prevention treatment strategies (Anderson 2013; NCEP 2002; NICE 2014; Piepoli 2016; Stone 2014; WHO 2007), we identified multiple evidence gaps to guide the application of CVD risk scores in clinical practice. Trials generally had a short‐term focus, had methodological limitations particularly in the domains of attrition bias and detection bias, and were underpowered for clinical endpoints. Given the multifactorial nature of many of the CVD risk score interventions, it is also unclear which component of the intervention was most effective at improving CVD prevention. Thus, there is uncertainty about optimal implementation of CVD risk scores in practice to improve cardiovascular health outcomes.
Quality of the evidence
Using the GRADE framework, we rated the quality of evidence guiding the clinical application of CVD risk scores in primary CVD prevention as low overall. Quality assessments were generally downgraded due to: study limitations across multiple risk of bias domains; inconsistency of results due to the substantial unexplained heterogeneity in pooled estimates; and imprecision. Specifically, we rated the quality of evidence for the effects of providing CVD risk scores on CVD events as low, downgrading due to study limitations and imprecision. We rated the quality of evidence for the effects of providing CVD risk scores on CVD risk factor levels (total cholesterol, systolic blood pressure, and multivariable CVD risk) as low, downgrading due to study limitations and inconsistency. We rated the quality of evidence for the effects of providing CVD risk scores on adverse events as low, downgrading due to study limitations and imprecision. We rated the quality of evidence for the effects of providing CVD risk scores on new or intensified lipid‐lowering medications and antihypertensive medications as low, downgrading due to study limitations and inconsistency.
Potential biases in the review process
Our review has several strengths. First, we followed a pre‐specified, published protocol to guide our systematic review and noted any deviations from this protocol. Second, we conducted a comprehensive, transparent search strategy that was guided by an information specialist (MAB) and that identified published reports, conference abstracts, and clinical trial registers. Third, we included only RCTs or quasi‐RCTs that used a systematic method of allocation to the CVD risk score intervention. Fourth, we performed all title screening, data extraction, and risk of bias assessments in duplicate to minimise bias. Fifth, we used the GRADE framework to rate the quality of evidence and factored this quality assessment to guide our conclusions regarding the effects of providing CVD risk scores.
The principal limitation of this review is the quality of the available data. Nearly all trials (38 out of 41) had high or unclear risk of bias across multiple domains. Moreover, most trials were powered for process outcomes rather than clinical outcomes, were designed for short duration, did not use systematic follow‐up procedures, and delivered CVD risk messages at a single time point only. Trials also varied in terms of design, risk levels of participants, complexity of CVD risk score interventions, content of risk messages, and choice of outcomes. This heterogeneity is demonstrated in the results of our meta‐analysis and should temper confidence in our reported effect estimates. This inconsistency is also reflected in our GRADE quality assessments. Our selection criteria of trials with all or ≥70% primary prevention participants and where only the intervention group received a multivariable CVD risk score led to the exclusion of several well‐known trials that included a majority of participants with established CVD (Cleveringa 2008; Ketola 2001; Weymiller 2007). Other prominent but excluded trials provided a CVD risk score to both treatment groups (Keyserling 2014; Kullo 2016). Nevertheless, we feel that our inclusive definition of a CVD risk score intervention and the methods we used to select and evaluate the evidence outweigh these limitations.
Agreements and disagreements with other studies or reviews
Our results are consistent with prior systematic reviews performed on this topic. Two previous systematic reviews performed with Cochrane methodology identified no strong evidence that CVD risk scores improved health outcomes (Beswick 2008; Brindle 2006). However, both reviews searched literature through 2004 and only included interventions that provided a CVD risk score to clinicians. Therefore, they identified only four studies (N = 4648). In contrast, our search was performed through March 2016 and included CVD risk score assessment provided directly to patients or performed at the health system level. Consequently, we identified a greater number of trials and were able to provide greater detail about the effects of CVD risk scores on a variety of intermediate outcomes and health behaviours. Other systematic reviews have also highlighted that CVD risk scores can increase patients’ intent to start therapy and physicians’ prescribing of cardiovascular medications with no evidence of harm (Sheridan 2008; Sheridan 2010). However, these reviews did not systematically collect or report effects of CVD risk scores on individual risk factor levels or cardiovascular outcomes.
Our results complement the findings of a recently published non‐Cochrane systematic review that evaluated the effect of providing a CVD risk score on clinical outcomes (Usher‐Smith 2015). This review identified 17 trials (N = 19,036) and reported a small reduction in modelled CVD risk (−0.39%, 95% CI −0.71 to −0.07); a trend toward lower mean total or LDL cholesterol (−0.11 mmol/L, 95% CI −0.23 to 0.01); an increase in lipid‐lowering and antihypertensive medication prescribing in high‐risk participants (RR 2.11, 95% CI 1.27 to 3.49 and RR 2.38, 95% CI 1.11 to 5.10, respectively); and mixed effects on smoking cessation, physical activity, and alcohol consumption. Notably, this review did not identify evidence that providing CVD risk scores had an effect on blood pressure level (systolic blood pressure: −0.82 mmHg, 95% CI −2.70 to 1.05; diastolic blood pressure: −0.48 mmHg, 95% CI −1.41 to 0.44). This review, however, has notable limitations. For example, it included non‐randomised, before‐after studies at high risk of selection bias. Additionally, the authors did not use a systematic framework, such as GRADE, to assess the quality of evidence or guide recommendations. Lastly, the authors used restrictive inclusion criteria that led to the exclusion of many contemporary trials that incorporated CVD risk score interventions within complex, multifaceted interventions. Our review addresses many of these limitations by including only RCTs or quasi‐RCTs, using GRADE to assess the quality of evidence, and including trials with multifaceted interventions such as Peiris 2015, where provision of a CVD risk score was just one component of a larger implementation model. Thus, our review may provide a more comprehensive and generalisable assessment of the current state of the science.
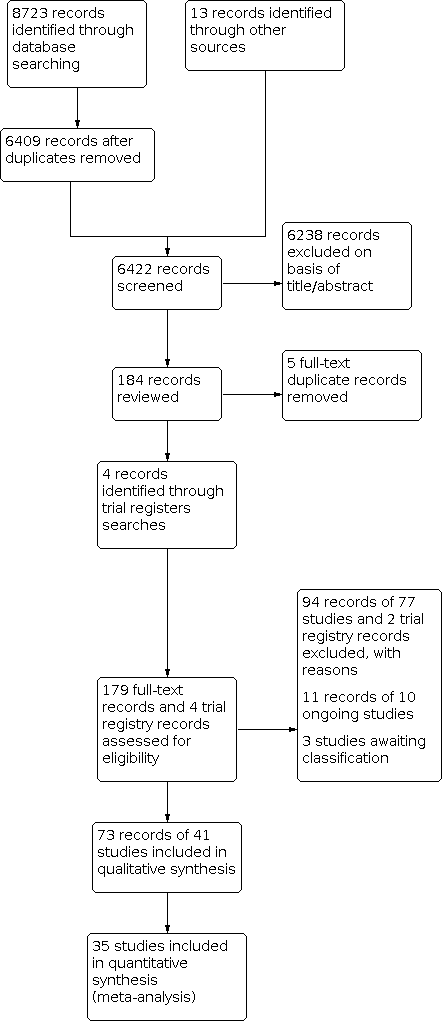
Study flow diagram.

Summary of CVD risk score interventions by included study.
Abbreviations: CHD: coronary heart disease; CVD: cardiovascular disease; FRS: Framingham risk score; MI: myocardial infarction; RF: risk factors, RR: risk ratio; UKPDS: United Kingdom Prospective Diabetes Study

Risk of bias summary: review authors' judgements about each risk of bias item for each included study.

Risk of bias graph: review authors' judgements about each risk of bias item presented as percentages across all included studies.

Funnel plot of comparison: 1 CVD risk score versus no CVD risk score/usual care, outcome: 1.3 Total cholesterol (mmol/L).

Funnel plot of comparison: 1 CVD risk score versus no CVD risk score/usual care, outcome: 1.5 Systolic blood pressure (mmHg).

Funnel plot of comparison: 1 CVD risk score versus no CVD risk score/usual care, outcome: 1.7 Change in multivariable CVD risk.

Comparison 1: CVD risk score versus no CVD risk score/usual care, Outcome 1: CVD events

Comparison 1: CVD risk score versus no CVD risk score/usual care, Outcome 2: CVD events, excluding Bucher 2010

Comparison 1: CVD risk score versus no CVD risk score/usual care, Outcome 3: Total cholesterol

Comparison 1: CVD risk score versus no CVD risk score/usual care, Outcome 4: Low‐density lipoprotein cholesterol

Comparison 1: CVD risk score versus no CVD risk score/usual care, Outcome 5: Systolic blood pressure

Comparison 1: CVD risk score versus no CVD risk score/usual care, Outcome 6: Diastolic blood pressure

Comparison 1: CVD risk score versus no CVD risk score/usual care, Outcome 7: Change in multivariable CVD risk

Comparison 1: CVD risk score versus no CVD risk score/usual care, Outcome 8: Adverse events (investigator defined)

Comparison 1: CVD risk score versus no CVD risk score/usual care, Outcome 9: Anxiety

Comparison 1: CVD risk score versus no CVD risk score/usual care, Outcome 10: New/intensified lipid‐lowering medication

Comparison 1: CVD risk score versus no CVD risk score/usual care, Outcome 11: New/intensified antihypertensive medication

Comparison 1: CVD risk score versus no CVD risk score/usual care, Outcome 12: New aspirin

Comparison 1: CVD risk score versus no CVD risk score/usual care, Outcome 13: Medication adherence

Comparison 1: CVD risk score versus no CVD risk score/usual care, Outcome 14: Smoking cessation

Comparison 1: CVD risk score versus no CVD risk score/usual care, Outcome 15: Exercise

Comparison 1: CVD risk score versus no CVD risk score/usual care, Outcome 16: Decisional conflict

Comparison 2: CVD risk score versus no CVD risk score/usual care by decision support use, Outcome 1: Total cholesterol by decision support use

Comparison 2: CVD risk score versus no CVD risk score/usual care by decision support use, Outcome 2: Low‐density lipoprotein cholesterol by decision support

Comparison 2: CVD risk score versus no CVD risk score/usual care by decision support use, Outcome 3: Systolic blood pressure by decision support use

Comparison 2: CVD risk score versus no CVD risk score/usual care by decision support use, Outcome 4: Diastolic blood pressure by decision support use

Comparison 2: CVD risk score versus no CVD risk score/usual care by decision support use, Outcome 5: Change in multivariable CVD risk by decision support

Comparison 3: CVD risk score versus no CVD risk score/usual care by health IT use, Outcome 1: Total cholesterol by health IT use

Comparison 3: CVD risk score versus no CVD risk score/usual care by health IT use, Outcome 2: Low‐density lipoprotein cholesterol by health IT use

Comparison 3: CVD risk score versus no CVD risk score/usual care by health IT use, Outcome 3: Systolic blood pressure by health IT use

Comparison 3: CVD risk score versus no CVD risk score/usual care by health IT use, Outcome 4: Diastolic blood pressure by health IT use

Comparison 3: CVD risk score versus no CVD risk score/usual care by health IT use, Outcome 5: Change in multivariable CVD risk by health IT use

Comparison 4: CVD risk score versus no CVD risk score/usual care by risk status of participants, Outcome 1: Total cholesterol by risk status

Comparison 4: CVD risk score versus no CVD risk score/usual care by risk status of participants, Outcome 2: Low‐density lipoprotein cholesterol by risk status

Comparison 4: CVD risk score versus no CVD risk score/usual care by risk status of participants, Outcome 3: Systolic blood pressure by risk status

Comparison 4: CVD risk score versus no CVD risk score/usual care by risk status of participants, Outcome 4: Diastolic blood pressure by risk status

Comparison 4: CVD risk score versus no CVD risk score/usual care by risk status of participants, Outcome 5: Change in multivariable CVD risk by risk status

Comparison 5: Multivariable CVD risk, Outcome 1: Multivariable CVD risk
| CVD risk scoring for the primary prevention of cardiovascular disease | ||||||
| Patient or population: adults without prevalent cardiovascular disease (primary cardiovascular disease prevention) | ||||||
| Outcomes | Anticipated absolute effects* (95% CI) | Relative effect | N of participants | Quality of the evidence | Comments | |
|---|---|---|---|---|---|---|
| Risk with not providing CVD risk scores/usual care | Risk with providing CVD risk scores | |||||
| CVD events | Study population | RR 1.01 | 99,070 | ⊕⊕⊝⊝ | — | |
| 53 per 1000 | 54 per 1000 | |||||
| Total cholesterol (mmol/L) | In the comparison group, the range of mean total cholesterol level was 5.1 to 6.6 mmol/L and the range of mean change from baseline in total cholesterol level was 0.09 lower to 0.14 mmol/L higher | The mean difference in total cholesterol in the intervention group was 0.10 mmol/L lower | — | 20,437 | ⊕⊕⊝⊝ | — |
| Systolic blood pressure (mmHg) | In the comparison group, the range of mean systolic blood pressure level was 124.1 to 159.0 mmHg and the range of mean change from baseline in systolic blood pressure level was 5.3 lower to 1.0 higher mmHg | The mean difference in systolic blood pressure in the intervention group was 2.77 mmHg lower | — | 32,954 | ⊕⊕⊝⊝ | — |
| Change in multivariable CVD risk (SD) | In the comparison group, the range of mean change from baseline in multivariable CVD risk was 5.3 lower to 0.77 higher SDs | The mean difference in multivariable CVD risk in the intervention group was 0.21 SDs lower | — | 9549 | ⊕⊕⊝⊝ | Standardised mean differences were calculated for this outcome due to the use of different multivariable CVD risk scales. An effect size of ~0.20 SD units reflects a small effect. |
| Investigator‐defined adverse events | Study population | RR 0.72 | 4630 | ⊕⊕⊝⊝ | Adverse events were defined heterogeneously by investigators and included some events that may have been due to newly prescribed medications rather than the provision of a CVD risk score itself. | |
| 27 per 1000 | 19 per 1000 | |||||
| New/intensified lipid‐lowering medication | Study population | RR 1.47 | 14,175 | ⊕⊕⊝⊝ | Prescribing rates in the comparison group varied among the included trials (range 4% to 22%). Median prescribing rate presented | |
| 107 per 1000 | 157 per 1000 | |||||
| New/intensified antihypertensive medication | Study population | RR 1.51 | 13,255 | ⊕⊕⊝⊝ | Prescribing rates in the comparison group varied among the included trials (range 0% to 27%). Median prescribing rate presented | |
| 114 per 1000 | 172 per 1000 | |||||
| *The risk in the intervention group (and its 95% confidence interval) is based on the assumed risk in the comparison group and the relative effect of the intervention (and its 95% CI). | ||||||
| GRADE Working Group grades of evidence | ||||||
| aDowngraded due to study limitations, primarily driven by high risk of selection bias in Holt 2010 and high risk of reporting bias in Bucher 2010 and Jorgensen 2014. | ||||||
| Outcome or subgroup title | No. of studies | No. of participants | Statistical method | Effect size |
| 1.1 CVD events Show forest plot | 3 | 99070 | Risk Ratio (IV, Fixed, 95% CI) | 1.01 [0.95, 1.08] |
| 1.2 CVD events, excluding Bucher 2010 Show forest plot | 2 | 95708 | Risk Ratio (IV, Fixed, 95% CI) | 1.01 [0.94, 1.08] |
| 1.3 Total cholesterol Show forest plot | 12 | 20437 | Mean Difference (IV, Random, 95% CI) | ‐0.10 [‐0.20, 0.00] |
| 1.4 Low‐density lipoprotein cholesterol Show forest plot | 10 | 22122 | Mean Difference (IV, Random, 95% CI) | ‐0.03 [‐0.10, 0.04] |
| 1.5 Systolic blood pressure Show forest plot | 16 | 32954 | Mean Difference (IV, Random, 95% CI) | ‐2.77 [‐4.16, ‐1.38] |
| 1.6 Diastolic blood pressure Show forest plot | 14 | 22378 | Mean Difference (IV, Random, 95% CI) | ‐1.12 [‐2.11, ‐0.13] |
| 1.7 Change in multivariable CVD risk Show forest plot | 9 | 9549 | Std. Mean Difference (IV, Random, 95% CI) | ‐0.21 [‐0.39, ‐0.02] |
| 1.8 Adverse events (investigator defined) Show forest plot | 4 | 4630 | Risk Ratio (IV, Fixed, 95% CI) | 0.72 [0.49, 1.04] |
| 1.9 Anxiety Show forest plot | 2 | 388 | Std. Mean Difference (IV, Fixed, 95% CI) | ‐0.07 [‐0.27, 0.13] |
| 1.10 New/intensified lipid‐lowering medication Show forest plot | 11 | 14175 | Risk Ratio (IV, Random, 95% CI) | 1.47 [1.15, 1.87] |
| 1.11 New/intensified antihypertensive medication Show forest plot | 8 | 13255 | Risk Ratio (IV, Random, 95% CI) | 1.51 [1.08, 2.11] |
| 1.12 New aspirin Show forest plot | 3 | 1614 | Risk Ratio (IV, Fixed, 95% CI) | 2.71 [1.24, 5.91] |
| 1.13 Medication adherence Show forest plot | 4 | 621 | Risk Ratio (IV, Random, 95% CI) | 1.14 [0.92, 1.40] |
| 1.14 Smoking cessation Show forest plot | 7 | 5346 | Risk Ratio (IV, Fixed, 95% CI) | 1.38 [1.13, 1.69] |
| 1.15 Exercise Show forest plot | 2 | 2595 | Risk Ratio (IV, Fixed, 95% CI) | 0.98 [0.90, 1.06] |
| 1.16 Decisional conflict Show forest plot | 4 | 1261 | Std. Mean Difference (IV, Random, 95% CI) | ‐0.29 [‐0.57, ‐0.01] |
| Outcome or subgroup title | No. of studies | No. of participants | Statistical method | Effect size |
| 2.1 Total cholesterol by decision support use Show forest plot | 12 | 20437 | Mean Difference (IV, Random, 95% CI) | ‐0.10 [‐0.20, 0.00] |
| 2.1.1 Decision support use | 8 | 9444 | Mean Difference (IV, Random, 95% CI) | ‐0.09 [‐0.20, 0.01] |
| 2.1.2 No decision support use | 4 | 10993 | Mean Difference (IV, Random, 95% CI) | ‐0.11 [‐0.27, 0.06] |
| 2.2 Low‐density lipoprotein cholesterol by decision support Show forest plot | 10 | 22122 | Mean Difference (IV, Random, 95% CI) | ‐0.03 [‐0.10, 0.04] |
| 2.2.1 Decision support use | 9 | 21739 | Mean Difference (IV, Random, 95% CI) | ‐0.02 [‐0.10, 0.06] |
| 2.2.2 No decision support use | 1 | 383 | Mean Difference (IV, Random, 95% CI) | ‐0.11 [‐0.25, 0.03] |
| 2.3 Systolic blood pressure by decision support use Show forest plot | 16 | 32954 | Mean Difference (IV, Random, 95% CI) | ‐2.77 [‐4.16, ‐1.38] |
| 2.3.1 Decision support use | 13 | 22457 | Mean Difference (IV, Random, 95% CI) | ‐2.17 [‐3.52, ‐0.82] |
| 2.3.2 No decision support use | 3 | 10497 | Mean Difference (IV, Random, 95% CI) | ‐4.57 [‐6.89, ‐2.25] |
| 2.4 Diastolic blood pressure by decision support use Show forest plot | 14 | 22378 | Mean Difference (IV, Random, 95% CI) | ‐1.12 [‐2.11, ‐0.13] |
| 2.4.1 Decision support use | 10 | 11385 | Mean Difference (IV, Random, 95% CI) | ‐0.76 [‐1.29, ‐0.23] |
| 2.4.2 No decision support use | 4 | 10993 | Mean Difference (IV, Random, 95% CI) | ‐2.09 [‐3.33, ‐0.85] |
| 2.5 Change in multivariable CVD risk by decision support Show forest plot | 9 | 9549 | Std. Mean Difference (IV, Random, 95% CI) | ‐0.21 [‐0.39, ‐0.02] |
| 2.5.1 Decision support use | 7 | 6209 | Std. Mean Difference (IV, Random, 95% CI) | ‐0.17 [‐0.27, ‐0.07] |
| 2.5.2 No decision support use | 2 | 3340 | Std. Mean Difference (IV, Random, 95% CI) | ‐0.26 [‐0.98, 0.46] |
| Outcome or subgroup title | No. of studies | No. of participants | Statistical method | Effect size |
| 3.1 Total cholesterol by health IT use Show forest plot | 12 | 20437 | Mean Difference (IV, Random, 95% CI) | ‐0.10 [‐0.20, 0.00] |
| 3.1.1 Health IT use | 8 | 9444 | Mean Difference (IV, Random, 95% CI) | ‐0.09 [‐0.20, 0.01] |
| 3.1.2 No health IT use | 4 | 10993 | Mean Difference (IV, Random, 95% CI) | ‐0.11 [‐0.27, 0.06] |
| 3.2 Low‐density lipoprotein cholesterol by health IT use Show forest plot | 10 | 22122 | Mean Difference (IV, Random, 95% CI) | ‐0.03 [‐0.10, 0.04] |
| 3.2.1 Health IT use | 9 | 21739 | Mean Difference (IV, Random, 95% CI) | ‐0.02 [‐0.10, 0.06] |
| 3.2.2 No health IT use | 1 | 383 | Mean Difference (IV, Random, 95% CI) | ‐0.11 [‐0.25, 0.03] |
| 3.3 Systolic blood pressure by health IT use Show forest plot | 16 | 32954 | Mean Difference (IV, Random, 95% CI) | ‐2.77 [‐4.16, ‐1.38] |
| 3.3.1 Health IT use | 13 | 22457 | Mean Difference (IV, Random, 95% CI) | ‐2.17 [‐3.52, ‐0.82] |
| 3.3.2 No health IT use | 3 | 10497 | Mean Difference (IV, Random, 95% CI) | ‐4.57 [‐6.89, ‐2.25] |
| 3.4 Diastolic blood pressure by health IT use Show forest plot | 14 | 22378 | Mean Difference (IV, Random, 95% CI) | ‐1.12 [‐2.11, ‐0.13] |
| 3.4.1 Health IT use | 10 | 11385 | Mean Difference (IV, Random, 95% CI) | ‐0.76 [‐1.29, ‐0.23] |
| 3.4.2 No health IT use | 4 | 10993 | Mean Difference (IV, Random, 95% CI) | ‐2.09 [‐3.33, ‐0.85] |
| 3.5 Change in multivariable CVD risk by health IT use Show forest plot | 9 | 9549 | Std. Mean Difference (IV, Random, 95% CI) | ‐0.21 [‐0.39, ‐0.02] |
| 3.5.1 Health IT use | 6 | 5387 | Std. Mean Difference (IV, Random, 95% CI) | ‐0.19 [‐0.26, ‐0.12] |
| 3.5.2 No health IT use | 3 | 4162 | Std. Mean Difference (IV, Random, 95% CI) | ‐0.15 [‐0.69, 0.39] |
| Outcome or subgroup title | No. of studies | No. of participants | Statistical method | Effect size |
| 4.1 Total cholesterol by risk status Show forest plot | 12 | 20437 | Mean Difference (IV, Random, 95% CI) | ‐0.10 [‐0.20, 0.00] |
| 4.1.1 High‐risk participants only | 3 | 4105 | Mean Difference (IV, Random, 95% CI) | ‐0.13 [‐0.22, ‐0.03] |
| 4.1.2 Participants of all risk levels | 9 | 16332 | Mean Difference (IV, Random, 95% CI) | ‐0.10 [‐0.23, 0.03] |
| 4.2 Low‐density lipoprotein cholesterol by risk status Show forest plot | 10 | 22122 | Mean Difference (IV, Random, 95% CI) | ‐0.03 [‐0.10, 0.04] |
| 4.2.1 High‐risk participants only | 3 | 14219 | Mean Difference (IV, Random, 95% CI) | ‐0.07 [‐0.11, ‐0.03] |
| 4.2.2 Participants of all risk levels | 7 | 7903 | Mean Difference (IV, Random, 95% CI) | ‐0.01 [‐0.11, 0.09] |
| 4.3 Systolic blood pressure by risk status Show forest plot | 16 | 32954 | Mean Difference (IV, Random, 95% CI) | ‐2.77 [‐4.16, ‐1.38] |
| 4.3.1 High‐risk participants only | 5 | 18375 | Mean Difference (IV, Random, 95% CI) | ‐2.22 [‐4.04, ‐0.40] |
| 4.3.2 Participants of all risk levels | 11 | 14579 | Mean Difference (IV, Random, 95% CI) | ‐2.96 [‐4.68, ‐1.24] |
| 4.4 Diastolic blood pressure by risk status Show forest plot | 14 | 22378 | Mean Difference (IV, Random, 95% CI) | ‐1.12 [‐2.11, ‐0.13] |
| 4.4.1 High‐risk participants only | 3 | 4091 | Mean Difference (IV, Random, 95% CI) | ‐0.90 [‐2.42, 0.63] |
| 4.4.2 Participants of all risk levels | 11 | 18287 | Mean Difference (IV, Random, 95% CI) | ‐1.20 [‐2.26, ‐0.14] |
| 4.5 Change in multivariable CVD risk by risk status Show forest plot | 9 | 9549 | Std. Mean Difference (IV, Random, 95% CI) | ‐0.21 [‐0.39, ‐0.02] |
| 4.5.1 High‐risk participants only | 2 | 4038 | Std. Mean Difference (IV, Random, 95% CI) | ‐0.15 [‐0.21, ‐0.09] |
| 4.5.2 Participants of all risk levels | 7 | 5511 | Std. Mean Difference (IV, Random, 95% CI) | ‐0.22 [‐0.49, 0.05] |
| Outcome or subgroup title | No. of studies | No. of participants | Statistical method | Effect size |
| 5.1 Multivariable CVD risk Show forest plot | 5 | 1921 | Std. Mean Difference (IV, Fixed, 95% CI) | ‐0.15 [‐0.25, ‐0.06] |