Dance therapy for schizophrenia
Información
- DOI:
- https://doi.org/10.1002/14651858.CD006868.pub3Copiar DOI

- Base de datos:
-
- Cochrane Database of Systematic Reviews
- Versión publicada:
-
- 04 octubre 2013see what's new
- Tipo:
-
- Intervention
- Etapa:
-
- Review
- Grupo Editorial Cochrane:
-
Grupo Cochrane de Esquizofrenia
- Copyright:
-
- Copyright © 2013 The Cochrane Collaboration. Published by John Wiley & Sons, Ltd.
Cifras del artículo
Altmetric:
Citado por:
Autores
Contributions of authors
JR ‐ study selection, data extraction, input and analysis, writing up the review in 2012 update.
JX ‐ developing the protocol, study selection, data extraction, input and analysis, writing up the review in previous version.
Sources of support
Internal sources
-
University of Leeds, UK.
-
University of Nottingham, UK.
External sources
-
No external support received, Not specified.
Declarations of interest
Juanjuan Ren ‐ no known conflict for interest.
Jun Xia ‐ no known conflict of interest.
Tessa Grant ‐ no known conflict of interest (2009 version of the review).
Acknowledgements
The authors would like to thank Judy Wright for running the trials search and Clive Adams for editorial input and Chunbo Li for his help in the preparation of this updating manuscript and editing.
We would also like to acknowledge and thank our consumer contributors, Janey Antoniou and Ben Gray of RETHINK, UK www.rethink.org, who have written Plain language summaries (PLS) of this review, Jane wrote the original PLS and Ben has written the current version for this update.
Samantha Roberts, the Trials Search Co‐ordinator of the Cochrane Schizophrenia Group ran the 2012 search.
Finally, we would like to acknowledge Tessa Grant for her help in trial selection for the previous version of this review.
Version history
| Published | Title | Stage | Authors | Version |
| 2013 Oct 04 | Dance therapy for schizophrenia | Review | Juanjuan Ren, Jun Xia | |
| 2009 Jan 21 | Dance therapy for schizophrenia | Review | Jun Xia, Tessa Jane Grant | |
| 2007 Oct 17 | Dance therapy for schizophrenia | Protocol | Jun Xia, Tessa Jane Grant | |
Differences between protocol and review
There are no differences between protocol and review.
Keywords
MeSH
Medical Subject Headings (MeSH) Keywords
Medical Subject Headings Check Words
Humans;
PICO


Study flow diagram to show trial selection

Methodological quality summary: review authors' judgements about each methodological quality item for the included study.

Risk of bias graph: review authors' judgements about each risk of bias item presented as percentages across all included studies.

Comparison 1 DANCE THERAPY vs STANDARD CARE, Outcome 1 Leaving the study early.
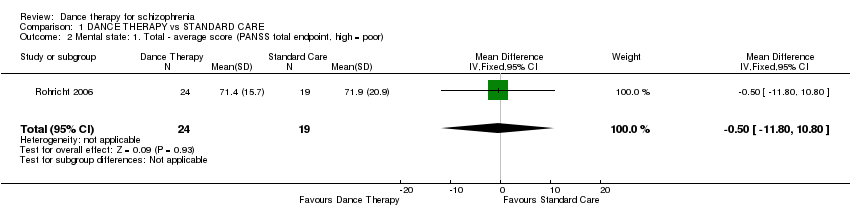
Comparison 1 DANCE THERAPY vs STANDARD CARE, Outcome 2 Mental state: 1. Total ‐ average score (PANSS total endpoint, high = poor).

Comparison 1 DANCE THERAPY vs STANDARD CARE, Outcome 3 Mental state: 2. Positive symptoms ‐ average score (PANSS positive endpoint, high = poor).
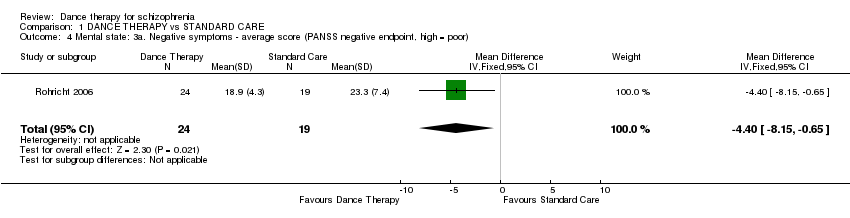
Comparison 1 DANCE THERAPY vs STANDARD CARE, Outcome 4 Mental state: 3a. Negative symptoms ‐ average score (PANSS negative endpoint, high = poor).

Comparison 1 DANCE THERAPY vs STANDARD CARE, Outcome 5 Mental state: 3b. Negative symptoms ‐ not improved (PANSS negative symptom reduction less than 20% ‐ 40%).
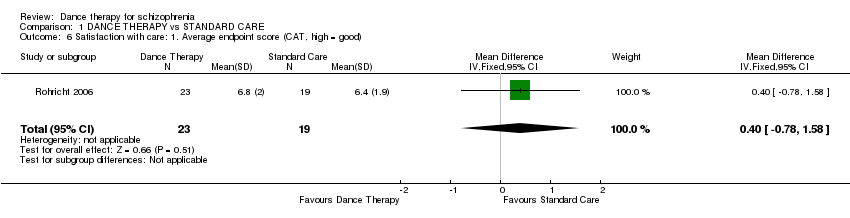
Comparison 1 DANCE THERAPY vs STANDARD CARE, Outcome 6 Satisfaction with care: 1. Average endpoint score (CAT, high = good).

Comparison 1 DANCE THERAPY vs STANDARD CARE, Outcome 7 Quality of life: 1. Average endpoint score (MANSA, high = good).
| Study | Intervention | Mean | SD | N |
| Rohricht 2006 | Dance therapy | 1.3 | 1.6 | 24 |
| Rohricht 2006 | Control group | 1.6 | 2.2 | 19 |
Comparison 1 DANCE THERAPY vs STANDARD CARE, Outcome 8 Adverse effects: 1. Average endpoint score (EPS, high = poor, skewed data).
| Title | References | Exsiting related review |
| Art therapy for schizophrenia | ||
| Cognitive remediation therapy for schizophrenia | ||
| Information and communication technology‐based cognitive remediation for supporting treatment compliance for people with serious mental illness | ||
| Music therapy plus dance therapy for schizophrenia | ||
| Psychoeducation for schizophrenia |
| Methods | Allocation: centralised sequence generation with table of random numbers or computer‐generated code, stratified by severity of illness, sequence concealed till interventions assigned. |
| Participants | Diagnosis: schizophrenia, if operational criteria used these should be in the context of routine care. |
| Interventions | 1. Dance therapy: the nature and frequency of this approach should be clearly described. N = 150. |
| Outcomes | Quality of life: healthy days,** SF‐36***. |
| Notes | * size of study to detect a 10% difference in improvement with 80% certainty. |
| CGI: Clinical Global Impression | |
| DANCE THERAPY compared to STANDARD CARE for schizophrenia | ||||||
| Patient or population: patients with schizophrenia | ||||||
| Outcomes | Illustrative comparative risks* (95% CI) | Relative effect | No of Participants | Quality of the evidence | Comments | |
| Assumed risk | Corresponding risk | |||||
| STANDARD CARE | DANCE THERAPY | |||||
| Service utilisation‐days in hospital | No data available | No data available | ||||
| Clinical global response‐leaving the study early (short term) | 95 per 1000 | 42 per 1000 | RR 0.44 | 45 | ⊕⊕⊕⊝ | |
| Clinical global response‐leaving the study early (long term) | 429 per 1000 | 291 per 1000 | RR 0.68 | 45 | ⊕⊕⊝⊝ | |
| Mental state: 2a. Negative symptoms ‐ average score (PANSS negative endpoint, high = poor) | The mean mental state: 2a. negative symptoms ‐ average score (PANSS negative endpoint, high = poor) in the control groups was | The mean mental state: 2a. negative symptoms ‐ average score (PANSS negative endpoint, high = poor) in the intervention groups was | 43 | ⊕⊕⊕⊝ | ||
| Mental state: 2b. Negative symptoms ‐ not improved (PANSS negative symptom reduction less than 20‐40%) | 810 per 1000 | 502 per 1000 | RR 0.62 | 45 | ⊕⊕⊕⊝ | |
| Satisfaction with care: Average endpoint score (CAT, high = good) | The mean satisfaction with care: average endpoint score (CAT, high = good) in the control groups was | The mean satisfaction with care: average endpoint score (CAT, high = good) in the intervention groups was | 42 | ⊕⊕⊕⊝ | ||
| Quality of life Manchester Short Assessment (MANSA, high = good) | The mean quality of life Manchester short assessment (MANSA, high = good) in the control groups was | The mean quality of life Manchester short assessment (MANSA, high = good) in the intervention groups was 0 higher | 39 | ⊕⊕⊕⊝ | ||
| *The basis for the assumed risk (e.g. the median control group risk across studies) is provided in footnotes. The corresponding risk (and its 95% confidence interval) is based on the assumed risk in the comparison group and the relative effect of the intervention (and its 95% CI). | ||||||
| GRADE Working Group grades of evidence | ||||||
| 1 Risk of bias: rated‐'serious': Randomised in blocks, no details reported. | ||||||
| Outcome or subgroup title | No. of studies | No. of participants | Statistical method | Effect size |
| 1 Leaving the study early Show forest plot | 1 | Risk Ratio (M‐H, Fixed, 95% CI) | Subtotals only | |
| 1.1 short term | 1 | 45 | Risk Ratio (M‐H, Fixed, 95% CI) | 0.44 [0.04, 4.49] |
| 1.2 long term | 1 | 45 | Risk Ratio (M‐H, Fixed, 95% CI) | 0.68 [0.31, 1.51] |
| 2 Mental state: 1. Total ‐ average score (PANSS total endpoint, high = poor) Show forest plot | 1 | 43 | Mean Difference (IV, Fixed, 95% CI) | ‐0.5 [‐11.80, 10.80] |
| 3 Mental state: 2. Positive symptoms ‐ average score (PANSS positive endpoint, high = poor) Show forest plot | 1 | 43 | Mean Difference (IV, Fixed, 95% CI) | 2.5 [‐0.67, 5.67] |
| 4 Mental state: 3a. Negative symptoms ‐ average score (PANSS negative endpoint, high = poor) Show forest plot | 1 | 43 | Mean Difference (IV, Fixed, 95% CI) | ‐4.40 [‐8.15, ‐0.65] |
| 5 Mental state: 3b. Negative symptoms ‐ not improved (PANSS negative symptom reduction less than 20% ‐ 40%) Show forest plot | 1 | 45 | Risk Ratio (M‐H, Fixed, 95% CI) | 0.62 [0.39, 0.97] |
| 6 Satisfaction with care: 1. Average endpoint score (CAT, high = good) Show forest plot | 1 | 42 | Mean Difference (IV, Fixed, 95% CI) | 0.40 [‐0.78, 1.58] |
| 7 Quality of life: 1. Average endpoint score (MANSA, high = good) Show forest plot | 1 | 39 | Mean Difference (IV, Fixed, 95% CI) | 0.0 [‐0.48, 0.48] |
| 8 Adverse effects: 1. Average endpoint score (EPS, high = poor, skewed data) Show forest plot | Other data | No numeric data | ||