吉非替尼治疗晚期非小细胞肺癌
Abstract
研究背景
吉非替尼治疗晚期非小细胞肺癌(NSCLC)的作用正在发生变化。我们进行了系统综述,评价所有随机试验的可用证据。
研究目的
决定吉非替尼作为晚期非小细胞肺癌的一线,二线或维持治疗的有效性和安全性。
检索策略
我们从2017年2月17日起在CENTRAL,MEDLINE和Embase进行检索。我们手工检索了相关的会议记录,临床试验注册库和检索文章的参考列表。
标准/纳入排除标准
我们纳入单独或联合其他治疗评估吉非替尼的试验,与安慰剂或其他治疗相比,NSCLC患者的首次或连续治疗,不包括同情使用。
数据收集与分析
我们使用Cochrane标准方法学。两位作者独立筛选检索结果并选择具有良好方法学质量的研究。我们对所有数据都进行了意向性分析。我们评价了以下结局数据:总生存期,无进展生存期,毒性,肿瘤反应和生活质量。我们还收集了以下亚组的数据:亚洲种族和正面表皮生长因子受体(EGFR)突变。
主要结果
我们纳入了35项符合条件的随机对照试验(RCTs),对12,089名患者进行了检查。
总人口
与安慰剂或化疗相比,吉非替尼在一线或二线治疗中的总生存率无统计学差异。与安慰剂相比,二线吉非替尼延长治疗失败的时间(TTF)(风险比(HR)0.82,95%置信区间(CI)0.75至0.90,P <0.0001)。维持吉非替尼可改善一线治疗后的无进展生存期(HR 0.70,95%CI 0.53至0.91,P = 0.007)。
亚洲种族患者的研究或进行亚组分析
二线吉非替尼延长了安慰剂的总生存期(HR 0.66,95%CI 0.48‐0.91,P = 0.01)。在一线治疗中,单用吉非替尼单独化疗可以改善无进展生存期(HR 0.65,95%CI 0.43〜0.98,P = 0.04,证据质量中等)。与单用吉非替尼或单独化疗相比,吉非替尼联合化疗方案可改善无进展生存期(HR 0.69,95%CI 0.49至0.96,P = 0.03; HR 0.69,95%CI 0.62至0.77,P <0.00001))。在二线治疗中,接受安慰剂或化疗的患者的无进展生存期优于吉非替尼组(HR 0.69,95%CI 0.52至0.91,P = 0.009; HR 0.71,95%CI 0.57至0.88,P = 0.002; 中等质量的证据)。二线治疗联合吉非替尼与化疗优于单独吉非替尼(HR 0.65,95%CI 0.43‐0.97,P = 0.04)。作为维持治疗,与安慰剂相比,吉非替尼改善了无进展生存期(HR 0.42,95%CI 0.33‐0.54,P <0.00001)。
EGFR突变阳性肿瘤患者
EGFR突变阳性患者的研究显示,吉非替尼与一线和二线化疗相比,无进展生存期有所改善(HR 0.47,95%CI 0.36〜0.61,P <0.00001; HR 0.24,95% CI 0.12至0.47,P <0.0001)。在一项III期研究中,吉非替尼作为化疗后的维持治疗改善了总体和无进展生存(HR 0.39,95%CI 0.15至0.98,P = 0.05; HR 0.17,95%CI分别为0.07至0.41,P <0.0001) 与安慰剂相比。
吉非替尼的毒性包括皮疹,腹泻和肝转氨酶紊乱。化疗的毒性包括贫血,中性粒细胞减少症和神经毒性。
在生活质量方面,吉非替尼改善了癌症治疗 ‐ 肺功能评估(FACT‐L)(标准化平均差(SMD)10.50,95%CI 9.55至11.45,P <0.000001),肺癌分量表(SMD 3.63,95 %CI 3.08〜4.19,P <0.00001)和试验结果指数(SMD 9.87,95%CI 1.26〜18.48,P <0.00001)评分与化疗相比。
作者结论
该系统综述显示,与标准的一线或二线化疗或维持治疗相比,吉非替尼可能对选定患者群体的无进展生存期和生活质量产生有益影响,特别是那些患有EGFR突变敏感肿瘤的患者。
给予吉非替尼维持治疗时EGFR突变患者比安慰剂组患者寿命更长。
一项研究进行亚组分析,结果显示吉非替尼改善了亚洲患者二线治疗组安慰剂的总生存率。所有其他研究均未检测到总体存活的益处。在这次审查中分析的数据是非常不同的。我们能够合并的数据有限,很大程度上是由于研究设计的差异。大多数研究中的偏倚风险是中等的,一些研究没有充分解决潜在的选择,磨损和报告偏倚。这种异质性可能会影响结果的适用性。
吉非替尼联合化疗似乎在改善无进展生存期方面优于吉非替尼或单独化疗,但需要进一步的数据和III期研究。
与目前的化疗方案相比,吉非替尼具有良好的毒性特征。虽然总体生存率没有改善,但吉非替尼与EGFR突变患者的细胞毒性化疗相比,无进展生存期延长,副作用较小。
PICO
Plain language summary
吉非替尼与非治疗或化疗对非小细胞肺癌的比较
系统综述问题
如果接受吉非替尼治疗,非小细胞肺癌患者的寿命是否会延长?
背景
非小细胞肺癌(最常见的肺癌类型)是全球癌症死亡的主要原因。诊断为晚期肺癌的人可能会接受化疗。
已经发现一些肺癌具有基因突变,这是细胞内染色体序列的改变。这种突变影响表皮生长因子受体(EGFR),它是细胞表面的开关,导致细胞不受控制的生长和扩散。吉非替尼是一种针对突变EGFR细胞的药物,从而阻止其生长。研究发现,这种突变更常见于非吸烟者、女性、亚裔和腺癌(一种肺癌)的人群中。
研究特征
我们在2017年2月17日前检索了相关试验。在2000年至2017年期间共进行了35项研究,评估来自多个国家(包括北美,欧洲和亚洲)的12,089名受试者。
主要结果
该评价显示,与没有其他治疗或化疗相比,用吉非替尼治疗晚期肺癌患者的寿命不会延长。对于初次治疗后肺癌恶化的患者,吉非替尼可延长癌症进一步发展前的时间,但仅限于选定的亚洲人群或EGFR突变患者。将吉非替尼与化学疗法联合应用可能会增加单独应用吉非替尼或单独化疗的时间。对于化疗后稳定的表皮生长因子受体突变阳性患者,与安慰剂相比,正在进行的吉非替尼可显著提高生存率。
与接受吉非替尼治疗的患者相比,接受化疗的患者发生严重副作用,例如低红白血细胞计数和神经症状。吉非替尼引起的副作用包括皮疹,腹泻和肝功能障碍。
与化疗相比,吉非替尼的生活质量可能得到改善。
证据质量
将吉非替尼作为一线和二线治疗与化学疗法进行比较时,我们将证据的质量降至中等水平以获得总体存活和无进展生存的结果,因为结果不准确,并且可能不适用于所有到期的患者包括只有70岁以上的人口。然而,当我们比较吉非替尼与化疗的毒性时,证据的质量很高。
Authors' conclusions
Summary of findings
| Gefitinib compared to chemotherapy for first‐line treatment of advanced NSCLC | ||||||
| Patient or population: advanced NSCLC | ||||||
| Outcomes | Illustrative comparative risks* (95% CI) | Relative effect | No of participants | Quality of the evidence | Comments | |
| Assumed risk | Corresponding risk | |||||
| Chemotherapy | Gefitinib | |||||
| Overall survival (OS) | The mean OS ranged across control groups from 3.5 to 8 months | The mean OS in the intervention group ranged from 2.2 to 5.9 months | HR 0.98 (0.91 to 1.46) | 275 | ⊕⊕⊕⊝ | OS similar in the Asian (HR 0.94, 0.82 to 1.06) and EGFR mutation positive subgroups (HR 0.97, 0.77 to 1.21) |
| Progression‐free survival (PFS) | The PFS ranged across control groups from 2 to 2.9 months | The mean PFS in the intervention group ranged from 1.9 to 2.7 months | HR 1.19 (0.86 to 1.65) | 275 | ⊕⊕⊕⊝ | PFS improved with gefitinib in the Asian subgroup (HR 0.65, 0.43 to 0.98) and the EGFR mutation positive subgroup (HR 0.47, 0.36 to 0.61) |
| *The basis for the assumed risk (e.g. the median control group risk across studies) is provided in footnotes. The corresponding risk (and its 95% confidence interval) is based on the assumed risk in the comparison group and the relative effect of the intervention (and its 95% CI). | ||||||
| GRADE Working Group grades of evidence | ||||||
| 1We downgraded the quality of evidence by one level because of serious indirectness as one study included only elderly patients (> 70 years old). | ||||||
| Gefitinib compared to chemotherapy for second‐line treatment of advanced NSCLC | ||||||
| Patient or population: advanced NSCLC | ||||||
| Outcomes | Illustrative comparative risks* (95% CI) | Relative effect | No of participants | Quality of the evidence | Comments | |
| Assumed risk | Corresponding risk | |||||
| Chemotherapy | Gefitinib | |||||
| Overall survival (OS) | The mean OS ranged across control groups from 7.1 to 8 months | The mean OS in the intervention group ranged from 7.5 to 7.6 months | HR 1.02 (0.91 to 1.15) | 1607 | ⊕⊕⊕⊝ | OS similar in Asian patients (HR 0.94, 0.79 to 1.12) and EGFR mutation positive patients (HR 0.83, 0.41 to 1.66). |
| Progression‐free survival (PFS) | The mean PFS ranged across control groups from 2.7 to 3.4 months | The mean PFS in the intervention group ranged from 2.2 to 3 months | HR 1.04 (0.92 to 1.17) | 1607 | ⊕⊕⊕⊝ | PFS significantly improved in Asian patients (HR 0.71, 0.57 to 0.88) and in patients positive for EGFR mutation (HR 0.24, 0.12 to 0.47) (ranged from 2.7 to 4.1 months versus 4.5 to 7 months). |
| *The basis for the assumed risk (e.g. the median control group risk across studies) is provided in footnotes. The corresponding risk (and its 95% confidence interval) is based on the assumed risk in the comparison group and the relative effect of the intervention (and its 95% CI). | ||||||
| GRADE Working Group grades of evidence | ||||||
| 1We downgraded the quality of evidence by one level because of imprecision based on the wide confidence interval. | ||||||
| Gefitinib compared to chemotherapy for advanced NSCLC | |||||
| Patient or population: advanced NSCLC | |||||
| Outcomes | Illustrative comparative risks* (95% CI) | Relative effect | No of participants | Quality of the evidence | |
| Assumed risk | Corresponding risk | ||||
| Chemotherapy | Gefitinib | ||||
| Skin rash | Study population | RR 2.40 | 1858 | ⊕⊕⊕⊕ | |
| 9 per 1000 | 21 per 1000 | ||||
| Constipation | Study population | RR 0.41 | 1719 | ⊕⊕⊕⊕ | |
| 19 per 1000 | 8 per 1000 | ||||
| Fatigue | Study population | RR 0.16 | 275 | ⊕⊕⊕⊝ | |
| 65 per 1000 | 10 per 1000 | ||||
| Asthenia | Study population | RR 0.51 | 1773 | ⊕⊕⊕⊕ | |
| 79 per 1000 | 40 per 1000 | ||||
| Neurotoxicity | Study population | RR 0.07 | 1529 | ⊕⊕⊕⊕ | |
| 29 per 1000 | 2 per 1000 | ||||
| Neutropenia | Study population | RR 0.04 | 1857 | ⊕⊕⊕⊕ | |
| 505 per 1000 | 20 per 1000 | ||||
| Febrile neutropenia | Study population | RR 0.12 | 1768 | ⊕⊕⊕⊕ | |
| 92 per 1000 | 11 per 1000 | ||||
| *The basis for the assumed risk (e.g. the median control group risk across studies) is provided in footnotes. The corresponding risk (and its 95% confidence interval) is based on the assumed risk in the comparison group and the relative effect of the intervention (and its 95% CI). | |||||
| GRADE Working Group grades of evidence | |||||
| 1We downgraded the quality of evidence by one level because of serious indirectness as one study included only elderly patients (> 70 years old). | |||||
Background
Description of the condition
Non‐small cell lung cancer (NSCLC) accounts for 14% of all cancer‐related deaths and is by far the leading cause of cancer death among both men and women. In the United States, it was predicted that about 234,030 new cases of NSCLC would be diagnosed, and 154,050 deaths would result from NSCLC in 2018 (ACS 2018). The survival rate for people diagnosed with NSCLC will vary according to the extent (stage) of the cancer. People with locally advanced NSCLC (stage III or more) have a five‐year survival rate of 5% to 36%, and survival estimates do vary according to stage at diagnosis (ACS 2018). Active treatment of NSCLC consists of surgery, radiotherapy and chemotherapy, given as single therapies or in combination. Although there have been major medical therapeutic advances in recent times, these have not been sufficient to significantly affect the high mortality and morbidity rates associated with lung cancer.
The pathogenesis of lung neoplasms is multifactorial, however most can be directly attributed to tobacco smoke exposure. NSCLC arising in smokers has a different spectrum of molecular abnormalities from those in non‐smokers, suggesting differences in aetiology, pathogenesis and possibly prognosis. Mutations of tumour suppressor genes such as p53 and retinoblastoma; stimulation of proto‐oncogenes such as K‐ras, c‐myc and c‐raf; and production of autocrine growth factors are some of the potential pathogenic mechanisms so far described in the development of lung cancer. Recent research has identified two oncogenic drivers, epidermal growth factor receptor (EGFR) mutation and EML4/ALK fusion, for which targeted therapies are available.
Description of the intervention
The epidermal growth factor receptor (EGFR) family of genes encodes a widely expressed transmembrane molecule that is frequently expressed in solid tumours. Overexpression of EGFR has been associated with the pathogenesis, proliferation, invasion and metastasis of various solid tumours, including NSCLC. EGFR is overexpressed in around 40% to 80% of documented cases of primary NSCLC and around 88% of advanced cases of NSCLC (Smith 2005).
Tyrosine kinase inhibitors (TKIs) bind to the intracellular domain of the tyrosine kinase and may inhibit EGFR downstream signalling. Inhibition of tyrosine kinase may, therefore, block EGFR‐mediated cancer cell propagation. TKIs may be classified as reversible or irreversible, and as selective against EGFR or active against other members of the receptor family. Somatic mutations in the region of EGFR that encodes the tyrosine kinase domain of the receptor (exons 18 through 21) have been identified in lung cancer. Such mutations occur more frequently in patients with NSCLC who have the adenocarcinoma sub‐type, women, Asian people and those who have never smoked (Kosaka 2004; Paez 2004). EGFR mutations are associated with both increased growth factor signalling and increased responsiveness to tyrosine kinase inhibitors (Mok 2011).
How the intervention might work
Gefitinib (Iressa, ZD 1839) is an orally active anilinoquinazoline that selectively and reversibly inhibits intracellular EGFR tyrosine kinase activity. Two large, randomised phase II clinical trials assessed the efficacy and safety of gefitinib monotherapy in patients with locally advanced or metastatic NSCLC who failed previous chemotherapy regimens (Fukuoka 2003 IDEAL I; Kris 2003 IDEAL II). Both showed no added benefit in terms of survival, time to progression or response rates compared with standard chemotherapy alone. However these monotherapy trials demonstrated a favourable safety profile. A phase III trial comparing gefitinib to placebo in advanced NSCLC patients who had received prior chemotherapy showed an improvement in progression‐free survival but no prolongation in overall survival (Thatcher 2005 ISEL). Since these early trials, a number of other randomised controlled trials (RCTs) have examined the effectiveness of gefitinib versus placebo or chemotherapy, or in combination with chemotherapy in the first‐ and second‐line settings. Several studies have also examined its role as maintenance therapy following treatment in patients with advanced NSCLC.
Why it is important to do this review
The precise clinical effectiveness of gefitinib in a range of clinical situations remains to be established. This review will bring together all the current evidence of effectiveness, in order to guide clinical management and the discussion of treatment risks and benefits in patients with NSCLC.
Objectives
To determine the effectiveness and safety of gefitinib as first‐line, second‐line or maintenance treatment for advanced NSCLC.
Methods
Criteria for considering studies for this review
Types of studies
We considered all published and unpublished randomised, controlled, phase II and phase III clinical trials of gefitinib as first‐ or second‐line or maintenance therapy in advanced NSCLC. We included any placebo‐controlled trials and trials using comparators. Trials with random allocation, double‐blinding and intention‐to‐treat analysis were preferred. We excluded cross‐over studies, studies that were quasi‐randomised and those that investigated the compassionate use of gefitinib.
Types of participants
Eligible trials included adult participants aged 18 years or older of either sex with histologically or cytologically confirmed NSCLC (stage IIIB/IV) not curable with surgery.
Types of interventions
We considered any administration of gefitinib for advanced NSCLC. This included the use of any dosage of gefitinib as first‐ or second‐line therapy or maintenance therapy:
-
Gefitinib at any dose compared with placebo or best supportive care.
-
Gefitinib at any dose compared with chemotherapeutic agents.
-
Gefitinib at a specific dose versus gefitinib at a different dose.
-
Gefitinib versus gefitinib combined with a chemotherapy regimen.
-
Gefitinib at any dose in combination with chemotherapeutic agents versus the same chemotherapy agents alone.
-
Gefitinib at any dose in combination with chemotherapeutic agents versus a different combination of chemotherapeutic agents.
Types of outcome measures
Primary outcomes
-
Overall survival (OS), assessed from date of randomisation to date of patient death (time to death).
-
Progression‐free survival (PFS):
-
Measured from the date of randomisation to the date of objective disease progression, based on Response Evaluation Criteria in Solid Tumours (RECIST), the revised version of the International Union Against Cancer/WHO criteria (Therasse 2000).
-
Time to treatment failure (TTF): measured from the date of randomisation to the date of study discontinuation (for any reason). This may be reported instead of PFS in some studies.
-
-
Toxicity (graded according to the National Cancer Institute Common Toxicity Criteria or the World Health Organization criteria (NCI CTCAE 2010).
-
However, we accepted whatever definitions had been used in the individual trials. A risk ratio (RR) significantly greater than 1 (RR > 1) is a positive response in favour of gefitinib.
-
Secondary outcomes
-
Median overall survival (OS) and progression‐free survival (PFS).
-
Survival rate at one year (1YSR).
-
Tumour response ‐ defined according to the RECIST criteria (Therasse 2000):
-
Complete response (CR) defined as the disappearance of all target lesions.
-
Partial response (PR) defined as at least a 30% decrease in the sum of the longest diameter of target lesions.
-
Overall response rate (ORR) taken as the sum of complete response (CR) rate and partial response (PR) rates.
-
Stable disease (SD) defined as neither sufficient shrinkage to qualify for partial response nor sufficient increase to qualify for progressive disease.
-
Disease control rate (DCR) defined as the sum of the ORR and SD rate. This represents all lesions that have either responded to the treatment or stabilised as a result of treatment.
-
-
Quality of life (QOL) and symptom response measured by the Functional Assessment of Cancer Therapy‐Lung (FACT‐L) quality of life instrument, the lung cancer subscale (LCS), the Trial Outcome Index (TOI) and the Pulmonary Symptom Index (PSI) (Cella 1995).
Search methods for identification of studies
Electronic searches
We electronically searched for eligible studies using:
-
The Cochrane Central Register of Controlled Trials (CENTRAL 2017, Issue 2) (Appendix 1);
-
MEDLINE via PubMed (1966 to 17 February 2017) (Appendix 2);
-
Embase via OVID (1980 to Week 08, 2017) (Appendix 3).
We developed the search string for MEDLINE according to the Cochrane Highly Sensitive Search Strategy, sensitivity‐maximising version (2008 version) as referenced in Chapter 6.4.11.1 and detailed in box 6.4.b of the Cochrane Handbook for Systematic Reviews of Interventions (Higgins 2011).
Searching other resources
The authors (ES, IY) also screened reference lists of included and excluded studies, attempted to contact authors of relevant studies and examined registers of ongoing trials: ClinicalTrials.gov (ClinicalTrials.gov) and Current Controlled Trials (isrctn.com) to locate all significant published and unpublished data. We also reviewed conference proceedings of the American Society of Clinical Oncology, the European Cancer Conference, the European Society of Medical Oncology and the International Association for the Study of Lung Cancer, from January 1990 to February 2017. When two articles or more used the same data, we only used the most updated article, unless we found some additional information in that article.
Data collection and analysis
Selection of studies
We assessed the eligibility of retrieved articles from the title and abstract. Two investigators (ES, IY) reviewed potential trials for inclusion and extracted data from the published manuscripts. We resolved disagreements about relevance either by consensus or by referral to a third investigator (RWB). There was no blinding of the authors as to origin or conclusions of the articles for eligibility assessment, data extraction or 'Risk of bias' assessment. We sought data for all patients randomised in all eligible randomised trials. Two review authors (ES, IY) independently carried out data extraction using a specifically designed data extraction form. We recorded study details, including year of publication, numbers of people randomised and analysed per arm, age, sex, race/ethnicity of participants, staging and histological cell type, performance status and any previous treatment. We also recorded the dose and duration of gefitinib treatment, as well as the use of any chemotherapeutic agents. We double‐checked all data for consistency, plausibility and integrity of randomisation and follow‐up.
Data extraction and management
We extracted data from included studies using the guidelines set out in the Cochrane Handbook for Systematic Reviews of Interventions (Higgins 2011).
Assessment of risk of bias in included studies
Two authors (ES, IY) independently assessed the risk of bias of included studies according to the areas and criteria proposed in the Cochrane Handbook for Systematic Reviews of Interventions (Higgins 2011). We considered studies to be at low risk of bias when true randomisation occurred, when there was blinding of assessors to treatment received, when all patients were accounted for and included in the analysis on an 'intention‐to‐treat' basis and when all outcome measures were reported. We also considered studies that were terminated early to have a source of bias of interest.
The results of these judgements are presented in the 'Risk of bias' tables (Characteristics of included studies).
(1) Sequence generation (checking for possible selection bias)
For each included study, we assessed the method used to generate the allocation sequence in sufficient detail to allow an evaluation of whether it should produce comparable groups.
We assessed risk of bias as:
-
Low risk: any truly random process, e.g. random number table, computer random number generator.
-
High risk: any non‐random process, e.g. odd or even date of birth, hospital or clinic record number.
-
Unclear risk: insufficient information about sequence generation process to permit judgement of risk.
(2) Allocation concealment (checking for possible selection bias)
For each included study, we assessed the method used to conceal the allocation sequence to determine whether intervention allocations could have been foreseen in advance of, or during, enrolment.
We assessed risk of bias as:
-
Low risk: e.g. central or telephone allocation, sequentially numbered drug containers of identical appearance.
-
High risk: e.g. open random allocation, unsealed or non‐opaque envelopes, alternation or rotation, date of birth.
-
Unclear risk: insufficient information to permit judgement of 'low risk' or 'high risk' or the study did not address this outcome.
(3) Blinding (checking for possible performance bias)
For each included study, we described the methods used, if any, to blind study participants and personnel from knowledge of which intervention a participant received.
We assessed risk of bias as:
-
Low risk: blinding of participants and key study personnel was ensured and it was unlikely that the blinding could have been broken, or there was no blinding of outcome measurement, but outcome measurement is unlikely to be influenced by the lack of blinding.
-
High risk: no blinding or incomplete blinding and the outcome is likely to be influenced by lack of blinding.
-
Unclear risk: insufficient information to permit judgement of 'low risk' or 'high risk' or the study did not address this outcome.
(4) Incomplete outcome data (checking for attrition bias)
For each included study, we reported the completeness of data including attrition and exclusions, the numbers included in the analysis at each stage and the reasons for attrition or exclusion.
We assessed risk of bias as:
-
Low risk: e.g. if there were any missing outcome data, the reasons for missing outcome data were unlikely to be related to true outcome.
-
High risk: e.g. reasons for missing outcome data are likely to be related to true outcome.
-
Unclear risk: insufficient reporting of attrition/exclusions to permit judgement of 'low risk' or 'high risk' or the study did not address this outcome.
(5) Selective reporting (checking for whether the prespecified outcomes were met)
For each included study, we assessed if the study's protocol was available and that the study's prespecified (primary and secondary) outcomes had been reported in the prespecified way, utilising prespecified measurements and analysis methods.
We assessed risk of bias as:
-
Low risk: e.g. the study protocol was available and all of the study's prespecified (primary and secondary) outcomes that are of interest in the review have been reported in the prespecified way, or if the protocol was not available, that the published report included all expected outcomes.
-
High risk: e.g. not all prespecified outcomes are reported, primary outcomes are reported using measurements or analysis methods that were not prespecified, the primary outcome reported was not prespecified, incomplete reporting of any outcomes, failure to include results for a key outcome that would be expected to have been reported.
-
Unclear risk: insufficient information available to permit a judgement of 'low risk' or 'high risk'.
(6) Other bias
For each included study, we assessed for bias due to problems are not covered elsewhere in the table.
We assess risk of bias as:
-
Low risk: e.g. study appears free of other bias.
-
High risk: e.g. there is at least one important risk of bias, such as a potential source of bias related to study design, or the study has been claimed to have been fraudulent.
-
Unclear risk: insufficient information or evidence that an identified problem will introduce bias.
Measures of treatment effect
Treatment effects are divided into quantitative data and patient‐reported outcomes. We analysed quantitative data such as survival and toxicity as dichotomous outcomes using the risk ratio (RR). We pooled time‐to‐event outcomes, such as hazard ratios (HR) for overall survival and progression‐free survival, provided that authors had analysed data using a Cox proportional hazards model. We summarised proportional outcomes, such as the proportion who survived, using a risk ratio (RR). We combined continuous outcomes with the inverse variance method. We combined quality of life outcomes if the same validated instrument was used, otherwise we utilised a descriptive approach. If data were combined, we presented the change from baseline as the standardised mean difference (SMD). All measures of effect included a 95% confidence interval (CI), P values and for pooled measures the I2 statistic value.
Assessment of heterogeneity
We performed tests for heterogeneity with Review Manager (RevMan 2014) using the I2 statistic and interpreting the I2 value using the guidance in the Cochrane Handbook for Systematic Reviews of Interventions (Higgins 2011). An I2 value of greater than 75% is likely to represent considerable heterogeneity, a value of 50% to 90% is likely to represent substantial heterogeneity and a value of 30% to 60% represents moderate heterogeneity.
Data synthesis
We combined quantitative data using Review Manager 5.3 (RevMan 2014). We calculated hazard ratios (HR) for data presented as survival curves using logrank expected number of events and variance. We pooled hazard ratios across trials using a fixed‐effect model. We combined continuous data, where the mean, standard deviation (SD) and number of participants in each arm were available, generating a mean difference (MD) and 95% CI. We planned to use a fixed‐effect model in the meta‐analysis if heterogeneity was deemed to be small (an I2 value of less than 50%). We applied a random‐effects model to comparisons demonstrating significant heterogeneity (with an I2 value of greater than 50%).
GRADE and 'Summary of findings' tables
We employed the GRADE approach to interpret findings (Schünemann 2011). We used GRADEProGDT (GRADEpro GDT 2015) to import data from Review Manager (RevMan 2014) to create 'Summary of findings' tables for major comparisons in this review. These tables provide information concerning the overall quality of the evidence from the included studies, the magnitude of the effect of the interventions and the sum of available data on the primary outcome and selected secondary outcomes. We selected the most relevant comparison for presentation in the 'Summary of findings' tables and we selected the following outcomes that we considered important to clinical decision‐making for inclusion in these tables:
-
Overall survival.
-
Progression‐free survival.
-
Toxicity.
Subgroup analysis and investigation of heterogeneity
We performed subgroup analyses for the outcomes of survival and tumour response. We categorised data from included studies into the following subgroups:
-
Asian population: if the study presented data specifically from patients who were of Asian ethnicity.
-
EGFR mutation positive: if the study presented data specifically from patients who were found to have EGFR activating mutations.
We undertook these subgroup analyses to determine whether there are differences between treatment groups depending on these biological and genomic factors.
Sensitivity analysis
Where applicable, we planned to perform a sensitivity analysis based on study quality, to assess the effect of this on the reported outcomes. We also applied a random‐effects model as part of our sensitivity analysis.
Results
Description of studies
Results of the search
The search strategy yielded 5703 studies or abstracts of which 127 studies were possibly eligible. Of these, we included 62 publications in this review, representing 35 primary studies and 27 publications that presented data from their respective primary studies. Fifty‐six were published in abstract form only and we found the remaining nine studies to be ineligible (Figure 1).

Study flow diagram for searches 1966‐2017.
(EGFR: epidermal growth factor receptor)
Included studies
We included a total of 35 separate primary studies in this review and these trials randomised a total of 12,089 patients. Seventeen of the eligible studies were multicentre, phase III trials (Gaafar 2011 EORTC08021; Giaccone 2004 INTACT I; Han 2012 First SIGNAL; Herbst 2004 INTACT II; Kelly 2008 SWOG S0023; Kim 2008 INTEREST; Lee 2010 ISTANA; Maemondo 2010 NEJ002; Maruyama 2008 V‐15‐32; Mitsudomi 2010 WJTOG3405; Mok 2009 IPASS; Soria 2015 IMPRESS; Sun 2012 KCSG‐LU08‐01; Takeda 2010 WJTOG0203; Thatcher 2005 ISEL; Yang 2014; Zhang 2012 INFORM). The remaining 18 were phase II studies (Ahn 2012; An 2016; Chen 2007; Chen 2011; Cheng 2016; Crino 2008 INVITE; Cufer 2006 SIGN; Dai 2013; Fukuoka 2003 IDEAL I; Goss 2009 INSTEP; Kim 2016; Kris 2003 IDEAL II; Li 2010; Lou 2014; Morere 2010 IFCT‐0301; Xu 2015; Xue 2015; Yu 2014). A summary of the 35 included primary studies is presented in Table 1. An additional 14 publications analysed data from their respective primary studies (Bell 2005; Boye 2016; Cella 2005; Chang 2006; Douillard 2010; Fukuoka 2011; Hirsch 2006; Herbst 2005; Inoue 2013; Oizumi 2012; Sekine 2009; Thongprasert 2011; Yamamoto 2010; Yang 2015). If we used data from these secondary studies, we did not duplicate with data from the respective primary studies and vice versa.
| Author/Year (Study name) | Journal | N | Comparison | Inclusion criteria | Phase | Asian | EGFR mutation | Line? |
| 1. Gefitinib versus placebo | ||||||||
| Goss 2009 (INSTEP) | JCO 27(13):2253‐2260 | 201 | Placebo | Poor PS | II | N | Subgroup | 1st line |
| Thatcher 2005 (ISEL) | Lancet 366:1527‐37 | 1692 | Placebo | — | III | Subset (Chang) | Subgroup (Hirsch) | 2nd line |
| Gaafar 2011 (EORTC08021) | Eur J Cancer (47):2331‐2340 | 173 | Placebo | Maintenance | III | N | N | Maintenance |
| Kelly 2008 (SWOGS0023) | JCO 26(15):2450‐2456 | 243 | Placebo | Consolidation | III | N | N | Maintenance |
| Zhang 2012 (INFORM) | Lancet Oncology 13:466‐475 | 296 | Placebo | Maintenance | III | Y | Subgroup | Maintenance |
| 2. Gefitinib versus chemotherapy | ||||||||
| Crino 2008 (INVITE) | JCO 26(26):4253‐4260 | 196 | Vinorelbine | Elderly patients | II | N | Subgroup | 1st line |
| Lou 2014 | Natl Med J China 94(30): 2337‐2341 | 51 | Carboplatin + paclitaxel | Asian | II | Y | N | 1st line |
| Morere 2010 (IFCT0301) | Lung Cancer 70:301‐307 | 85 | Docetaxel | Poor PS | II | N | N | 1st line |
| Han 2013 (First‐SIGNAL) | JCO 30(10): 1122‐1128 | 313 | Gemcitabine + cisplatin | — | III | Y | Planned Subgroup | 1st line |
| Mok 2009 (IPASS) | NEJM 361(10):947‐957 | 1217 | Carboplatin + paclitaxel | Asian, adenocarcinomas | III | Y | Subgroup | 1st line |
| Maemondo 2010 (NEJ002) | NEJM 362(25):2580‐2588 | 230 | Carboplatin + paclitaxel | Asian, EGFR mutation | III | Y | Y | 1st line |
| Mitsudomi 2010 (WJTOG3405) | Lancet Oncol 11:121‐128 | 177 | Cisplatin + docetaxel | Asian, EGFR mutation | III | Y | Y | 1st line |
| Yang 2014 | Eur J Cancer 50:2219‐2230 | 236 | Pemetrexed + cisplatin | Asian | III | Y | Subgroup | 1st line + maintenance |
| Cufer 2006 (SIGN) | Anti‐cancer Drugs 14:401‐409 | 141 | Docetaxel | Open‐label | II | N | N | 2nd line |
| Dai 2013 | Chin J Lung Cancer 16(8):405‐410 | 46 | Pemetrexed | Asian | II | Y | N | 2nd line |
| Kim 2016 | Cancer Res Treat 48(1):80‐87 | 95 | Pemetrexed | Asian | II | Y | N | 2nd/3rd line |
| Li 2010 | Chinese J Clin Onc 37:16‐18 | 98 | Docetaxel | Asian | II | Y | N | 2nd line |
| Kim 2008 (INTEREST) | Lancet 372:1809‐1818 | 1466 | Docetaxel | — | III | N | Subgroup (Doulliard) | 2nd line |
| Lee 2010 (ISTANA) | Clin Cancer Res 16(4):1307‐1314 | 161 | Docetaxel | Asian | III | Y | N | 2nd/3rd line |
| Maruyama 2008 (V‐15‐32) | JCO 26(26):4244‐4252 | 489 | Docetaxel | Asian | III | Y | Subgroup | 2nd/3rd line |
| Sun 2012 (KSCG‐LU08‐01) | Cancer 118:6234‐6242 | 141 | Pemetrexed | Adenocarcinoma, non‐smoker | III | Y | Subgroup | 2nd line |
| Ahn 2012 | Lung Cancer 77:346‐352 | 73 | Pemetrexed | Asian, never‐smokers | II | Y | N | Maintenance |
| Xu 2015 | Int J Clin Exp Med 8(4):6242‐6246 | 188 | Pemetrexed | Asian | II | Y | N | Maintenance |
| 3. Gefitinib 250 mg versus gefitinib 500 mg | ||||||||
| Fukuoka 2003 (IDEAL I) | JCO 21(12):2237‐2246 | 210 | G250 versus G500 | — | II | N | N | 2rd/3rd line |
| Kris 2003 (IDEAL II) | JAMA 290(16):2149‐2158 | 216 | G250 versus G500 | — | II | N | N | 3rd line |
| Xue 2015 | Int J Clin Exp Med 8(4):6242‐6246 | 188 | G250 versus G500 | Asian | II | Y | N | Maintenance |
| 4. Gefitinib versus gefitinib + chemotherapy | ||||||||
| An 2016 | Pathol Oncol Res 22:763‐768 | 90 | Gefitinib + Pemetrexed | Asian, EGFR mutation | II | Y | Y | 1st line |
| Cheng 2016 | JCO 34(27): 3258‐3266 | 191 | Gefitinib + Pemetrexed | Asian, EGFR mutation | II | Y | Y | 1st line |
| Chen 2007 | Cancer 109:1821‐8 | 48 | Gefitinib + Vinorelbine | Adenocarcinoma | II | N | Subgroup | 3rd line |
| Chen 2011 | J Thor Oncol 6:1110‐1116 | 115 | Gefitinib + Tegafur | Adenocarcinoma | II | Y | Subgroup | 2nd/3rd line |
| 5. Gefitinib + chemotherapy versus chemotherapy | ||||||||
| Giaccone 2004 (INTACT I) | JCO 22(5):777‐784 | 1093 | Gemcitabine + Cisplatin | — | III | N | N | 1st line |
| Herbst 2004 (INTACT II) | JCO 22(5):785‐794 | 1037 | Carboplatin + paclitaxel | — | III | N | N | 1st line |
| Takeda 2010 (WTOG0203) | JCO 28(5):753‐760 | 604 | Platinum doublet | — | III | Y | N | 1st line |
| Yu 2014 | Cancer Biology & Therapy 15:832‐839 | 117 | Pemetrexed + platinum | Asian | II | Y | N | 1st line |
| Soria 2015 (IMPRESS) | Lancet Oncology 16:990‐98 | 265 | Pemetrexed + cisplatin | EGFR mutation positive | III | N | Y | 2nd line |
EGFR: epidermal growth factor receptor
N: number of patients included
PS: performance status
Journals:
Cancer Res Treat: Cancer Research and Treatment
Chin J Lung Cancer: Chinese Journal of Lung Cancer
Chinese J Clin Onc: Chinese Journal of Clinical Oncology
Clin Cancer Res: Clinical Cancer Research
Eur J Cancer: European Journal of Cancer
Int J Clin Exp Med: International Journal of Clinical and Experimental Medicine
J Thor Oncol: Journal of Thoracic Oncology
JCO: Journal of Clinical Oncology
Natl Med J China: National Medical Journal of China
NMEJ: New England Journal of Medicine
Pathol Oncol Res: Pathology and Oncology Research
The duration of gefitinib therapy varied between studies. Most studies continued therapy until there was disease progression, unacceptable toxicity or withdrawal. Two studies administered gefitinib for six or eight weeks (Chen 2007; Morere 2010 IFCT‐0301). The shortest reported median duration of treatment was 50 days (Goss 2009 INSTEP) and the longest 308 days (Maemondo 2010 NEJ002).
Please refer to the Characteristics of included studies for full details of included studies. Study characteristics have also been summarised in Table 1.
The various comparisons can be seen in the Data and analyses section.
1. Gefitinib at any dose compared with placebo or best supportive care for NSCLC
-
General population (Comparison 1)
Three phase III studies (Gaafar 2011 EORTC08021; Kelly 2008 SWOG S0023; Thatcher 2005 ISEL) and a single phase II study (Goss 2009 INSTEP) compared gefitinib with placebo. The ISEL (Thatcher 2005 ISEL), INSTEP (Goss 2009 INSTEP), EORTC 08021 (Gaafar 2011 EORTC08021) and SWOGS0023 (Kelly 2008 SWOG S0023) trials examined survival outcomes, objective response rates and toxicity in the general population. The INSTEP study randomised chemotherapy‐naive patients to 250 mg of gefitinib or placebo as first‐line therapy. The ISEL study studied its effects as second‐line therapy in advanced NSCLC. Detailed subgroup analysis was conducted in the ISEL population and subsequently published. These two studies are also presented below as subgroup analyses (Chang 2006; Hirsch 2006). Subgroups were assessed for evidence by subgroup interactions, thus ensuring that outcomes were indeed different. Pre‐planned subgroup analysis of patients of Asian ethnicity was presented in Chang 2006 and analysis of molecular predictors of outcome was presented in Hirsch 2006. The SWOGS0023 and EORTC08021 studies assessed the effect of gefitinib versus placebo as maintenance therapy after initial treatment. In the SWOG study, patients were included after receiving concurrent cisplatin/etoposide chemotherapy with thoracic radiation (45 Gy, 1.8 Gy per fraction). The EORTC08021 trial included patients not progressing after first‐line platinum doublet chemotherapy. We studied a total of 2605 patients in this group.
-
Asian population (Comparison 2)
The INFORM study assessed the use of gefitinib as maintenance therapy in an East Asian patient group (Zhang 2012 INFORM). These patients had achieved disease control after first‐line platinum‐based chemotherapy. Chang 2006 selected only ISEL patients who were of Asian ethnicity. This subgroup represented 20% of the original ISEL population, a total of 342 patients. We included a total of 638 patients in this group.
-
EGFR mutation positive population (Comparison 3)
Zhang 2012 INFORM performed planned subgroup analysis on EGFR mutation positive patients and 30 of 79 (38%) tissue tumour samples were positive for EGFR mutations. Hirsch 2006 analysed ISEL tumour biopsy samples to examine the relationships between biomarkers and clinical outcome after gefitinib administration. Two‐hundred and fifteen of 1692 patients (12.7%) in the ISEL trial were assessable for mutation detection. Of these, 26 (12.1%) patients were positive for EGFR mutations. Other biomarkers examined included EGFR gene copy number, EGFR and p‐Akt protein expression and KRAS and BRAF mutations. Data from these other biomarkers are beyond the scope of this review.
2. Gefitinib at any dose compared with other chemotherapeutic agents
We included 18 primary studies in this analysis (Ahn 2012; Crino 2008 INVITE; Cufer 2006 SIGN; Dai 2013; Han 2012 First SIGNAL; Kim 2008 INTEREST; Kim 2016; Lee 2010 ISTANA; Li 2010; Lou 2014; Maemondo 2010 NEJ002; Maruyama 2008 V‐15‐32; Mitsudomi 2010 WJTOG3405; Mok 2009 IPASS; Morere 2010 IFCT‐0301; Sun 2012 KCSG‐LU08‐01; Xu 2015; Yang 2014). Nine of these studies were multicentre, randomised, phase III trials.
These 18 primary studies randomised a total of 5400 patients.
-
General population (Comparison 4)
Four studies, SIGN (Cufer 2006 SIGN), INTEREST (Kim 2008 INTEREST), INVITE (Crino 2008 INVITE) and IFCT‐0301 (Morere 2010 IFCT‐0301), compared gefitinib with chemotherapy in 1888 patients and data from these are presented in Comparison 4. Two studies compared gefitinib with first‐line chemotherapy (Crino 2008 INVITE; Morere 2010 IFCT‐0301) and the other two studies compared it with second‐line chemotherapy (Cufer 2006 SIGN; Kim 2008 INTEREST). 'Iressa in NSCLC versus Vinorelbine Investigation in the Elderly' (INVITE) was a randomised, multicentre, phase II trial that compared gefitinib with vinorelbine as first‐line therapy in elderly patients (Crino 2008 INVITE). IFCT‐0301 compared gefitinib, gemcitabine and docetaxel in chemotherapy‐naive patients with a performance status of 2 or 3 (Morere 2010 IFCT‐0301). SIGN (Second‐line Indication of Gefitinib in NSCLC) was a phase II, randomised study comparing gefitinib with docetaxel as second‐line therapy (Cufer 2006 SIGN). INTEREST (Iressa NSCLC Trial Evaluating Response and Survival again Taxotere) was a phase III trial, which assessed the non‐inferiority of gefitinib to docetaxel as second‐line therapy (Kim 2008 INTEREST). Douillard 2010 performed a preplanned secondary analysis to investigate the relationship between biomarkers and clinical outcomes in the INTEREST population. We included a total of 1888 patients in this group.
-
Asian population (Comparison 5)
Fourteen studies selected Asian patients only (Ahn 2012; Dai 2013; Han 2012 First SIGNAL; Kim 2016; Lee 2010 ISTANA; Li 2010; Lou 2014; Maruyama 2008 V‐15‐32; Mok 2009 IPASS; Mitsudomi 2010 WJTOG3405; Maemondo 2010 NEJ002; Sun 2012 KCSG‐LU08‐01; Xu 2015; Yang 2014), of which all except six (Ahn 2012; Dai 2013; Kim 2016; Li 2010; Lou 2014; Xu 2015) were phase III studies. We included a total of 3512 patients in this group.
First‐line studies
Five phase III studies (Han 2012 First SIGNAL; Maemondo 2010 NEJ002; Mitsudomi 2010 WJTOG3405; Mok 2009 IPASS; Yang 2014) and one phase II study (Lou 2014) compared gefitinib with first‐line chemotherapy. IPASS compared gefitinib with carboplatin‐paclitaxel, but in Asian patients with adenocarcinoma who were light or never‐smokers (Mok 2009 IPASS). Maemondo 2010 NEJ002 randomised Asian chemotherapy‐naive patients with EGFR mutations to receive gefitinib or carboplatin‐paclitaxel. WJTOG3405 compared gefitinib with cisplatin plus docetaxel in Asian patients with EGFR mutations (Mitsudomi 2010 WJTOG3405). First‐SIGNAL compared first‐line gefitinib with gemcitabine plus cisplatin in Asian never‐smokers with lung adenocarcinoma (Han 2012 First SIGNAL). The phase III study by Yang 2014 compared first‐line pemetrexed and cisplatin followed by gefitinib maintenance therapy with gefitinib monotherapy alone in Asian non‐smoking patients. Patients were randomised at trial entry to either gefitinib or pemetrexed plus cisplatin chemotherapy. Patients in both arms then continued with maintenance gefitinib. Data were analysed in the intention‐to‐treat population and only data from the first phase of the study were included in this analysis. In the phase II study by Lou 2014, gefitinib was compared with carboplatin and paclitaxel in Asian patients who were either non‐smokers or light ex‐smokers.
We analysed a total of 2224 patients from the six studies in this group.
Second‐line studies
Three phase III studies (Lee 2010 ISTANA; Maruyama 2008 V‐15‐32; Sun 2012 KCSG‐LU08‐01) and three phase II studies (Dai 2013; Kim 2016; Li 2010) compared gefitinib with second‐line chemotherapy. ISTANA (Lee 2010 ISTANA), V‐15‐32 (Maruyama 2008 V‐15‐32) and the phase II study by Li 2010 included patients of Asian ethnicity but where mutation status was not always known, and compared gefitinib with docetaxel. KCSG‐LU08‐01 (Sun 2012 KCSG‐LU08‐01), Dai 2013 and Kim 2016 selected Asian patients with unknown EGFR status and compared gefitinib with second‐line pemetrexed. Secondary studies published by Sekine 2009 and Yamamoto 2010 conducted analyses on quality of life and disease control respectively in the V‐15‐32 trial.
We analysed a total of 1030 patients from the six studies in this group.
Maintenance studies
Two phase II studies compared the role of gefitinib as maintenance to chemotherapy. Ahn 2012 randomised Asian non‐smokers not progressing after first‐line pemetrexed‐cisplatin, to receive either gefitinib or pemetrexed ± cisplatin, in a two‐staged study design. Xu 2015 compared single‐agent pemetrexed with gefitinib in Asian patients not progressing after four to eight cycles of first‐line chemotherapy.
We analysed 258 patients in this group.
-
EGFR mutation positive population (Comparison 6)
Nine studies were included in this group, six of which were first‐line studies (Crino 2008 INVITE; Han 2012 First SIGNAL; Maemondo 2010 NEJ002; Mitsudomi 2010 WJTOG3405; Mok 2009 IPASS; Yang 2014) and three of which were second‐line studies (Kim 2008 INTEREST; Maruyama 2008 V‐15‐32; Sun 2012 KCSG‐LU08‐01).
We included a total of 879 patients in this group.
Two phase III studies selected patients of Asian ethnicity who were also positive for EGFR mutations and compared gefitinib with first‐line carboplatin and paclitaxel or cisplatin and docetaxel respectively (Maemondo 2010 NEJ002; Mitsudomi 2010 WJTOG3405). In contrast, the IPASS (Mok 2009 IPASS) and First‐SIGNAL (Han 2012 First SIGNAL) studies selected Asian patients with adenocarcinomas, and conducted planned subgroup analyses on the EGFR mutation positive patients. IPASS compared first‐line gefitinib with carboplatin and paclitaxel and First‐SIGNAL compared gefitinib with gemcitabine and cisplatin. Yang 2014 conducted a post‐hoc analysis of EGFR mutation positive patients and compared first‐line pemetrexed and cisplatin followed by gefitinib maintenance with gefitinib alone. The INVITE phase II study in elderly patients that compared first‐line gefitinib with vinorelbine also conducted analysis of EGFR mutation positive patients but this study did not include any data that could be pooled (Crino 2008 INVITE).
We analysed a total of 802 patients in this group.
A further three phase III studies compared second‐line gefitinib with chemotherapy and conducted subgroup analyses in the EGFR mutation positive patients (Kim 2008 INTEREST; Maruyama 2008 V‐15‐32; Sun 2012 KCSG‐LU08‐01). INTEREST and V‐15‐32 compared gefitinib with docetaxel and KCSG‐LU08‐01 compared gefitinib with pemetrexed in this second‐line setting. The INTEREST study also analysed other biomarkers, such as EGFR gene copy number, EGFR protein expression and KRAS mutations, in addition to EGFR mutations. One study did not publish data that could be pooled (Maruyama 2008 V‐15‐32) and thus we included a total of 77 patients in this group.
3. Gefitinib at a specific dose versus a different dose (Comparison 7)
Three phase II studies compared the effect of two different doses of gefitinib, 250 mg and 500 mg in 527 patients (Fukuoka 2003 IDEAL I; Kris 2003 IDEAL II; Xue 2015). IDEAL I (Fukuoka 2003 IDEAL I) and IDEAL II (Kris 2003 IDEAL II) were multicentre, randomised, double‐blind, phase II studies that evaluated two doses of gefitinib (250 mg/day and 500 mg/day) as second‐ or third‐line therapy.
We analysed 431 patients in this group.
The third study randomised 96 patients who were stable after one month of gefitinib (250 mg/day) to either 250 mg/day or 500 mg/day as maintenance therapy (Xue 2015).
4. Gefitinib versus gefitinib combined with a chemotherapy regimen (Comparison 8)
Four studies compared gefitinib alone or in combination with chemotherapy. Two recently published studies examined the addition of chemotherapy to gefitinib versus gefitinib alone in the first‐line setting. A small study by An 2016 recruited 90 East Asian patients with an EGFR mutation and randomised them to receive gefitinib or gefitinib plus pemetrexed (500 mg/m2). In this study, pemetrexed or placebo was administered via intravenous infusion on day 1 of a 21‐day cycle. Gefitinib 250 mg was administered on days 2 to 16. A multicentre, phase II study by Cheng 2016 also compared gefitinib with and without pemetrexed as first‐line therapy. This study recruited 191 East Asian patients from China, Japan, Korea and Taiwan with advanced non‐squamous NSCLC with an activating EGFR mutation. Patients either received gefitinib 250 mg per day or gefitinib plus pemetrexed (500 mg/m2) infusion on day 1 of a 21‐day cycle.
We included a total of 281 patients in this group.
Chen 2007 compared 250 mg of daily oral gefitinib with gefitinib plus vinorelbine (15 mg/m2) every two weeks in 48 patients of Asian ethnicity with stage IV adenocarcinoma who had failed at least two lines of chemotherapy. Chen 2011 compared gefitinib alone with the combination of gefitinib plus tegafur (100 mg)/uracil (224 mg) in 115 Taiwanese patients with stage IIIB or IV adenocarcinoma who had failed first‐line chemotherapy.
We included a total of 163 patients in this group.
5. Gefitinib at any dose in combination with other chemotherapeutic agents versus the same chemotherapy agents alone (Comparison 9)
Five studies examined survival outcomes, objective response rates and toxicity (Giaccone 2004 INTACT I; Herbst 2004 INTACT II; Soria 2015 IMPRESS; Takeda 2010 WJTOG0203; Yu 2014). Overall, we included a total of 3110 patients.
INTACT I (Giaccone 2004 INTACT I) and INTACT II (Herbst 2004 INTACT II) were large, multicentre trials that examined the effect of the addition of two different doses of gefitinib to a chemotherapy regimen with the chemotherapy alone in chemotherapy‐naive patients. INTACT I compared the effect of the addition of gefitinib to a chemotherapy regimen that included gemcitabine and cisplatin and INTACT II a paclitaxel and carboplatin regime. WJTOG0203 compared the addition of 250 mg of gefitinib to platinum‐doublet chemotherapy in chemotherapy‐naive Japanese patients (Takeda 2010 WJTOG0203). In this study, patients were randomised to receive platinum doublet chemotherapy (Arm A) or platinum‐doublet chemotherapy for three cycles followed by gefitinib until disease progression (Arm B). The phase II study by Yu 2014 examined the addition of gefitinib to a first‐line pemetrexed and cisplatin chemotherapy schedule in Asian patients who were non‐smokers or light ex‐smokers.
In this group, we included 2845 patients.
The IMPRESS study was a phase III, multicentre study conducted across Europe and the Asia‐Pacific region (Soria 2015 IMPRESS). This study selected patients with EGFR mutation positive advanced NSCLC who had failed first‐line therapy with gefitinib. This study compared second‐line gefitinib plus chemotherapy (cisplatin and pemetrexed) with placebo plus the same chemotherapy regimen (cisplatin and pemetrexed). Two hundred and sixty‐five patients were included in this trial.
6. Gefitinib at any dose in combination with other chemotherapeutic agents versus a different combination of chemotherapeutic agent (Comparison 10)
No studies compared gefitinib in combination with a chemotherapeutic regime with a different regime of agents.
Data for all endpoints were not available in all published reports. A summary of efficacy and survival data is presented in Table 2.
| Study | ORR (%) | PFS (months) | OS (months) | ||||||
| 1. Gefitinib versus placebo | Gefitinib | Control | P | Gefitinib | Control | P | Gefitinib | Control | P |
| 1st line | |||||||||
| Goss 2009 | 6 | 1.0 | NS | 1.43 | 1.37 | NS | 3.7 | 2.8 | NS |
| 2nd line | |||||||||
| Thatcher 2005 ISEL | 37.5 | 48.3 | NS | 3 | 2.6 | 0.0006 | 5.6 | 5.1 | 0.087 |
| Maintenance therapy | |||||||||
| Kelly 2008 SWOGS0023 | ‐ | ‐ | ‐ | 8.3 | 11.7 | NS | 23 | 35 | 0.013 |
| Gaafar 2011 EORTC08021 | 12 | 1 | 0.004 | 4.1 | 2.9 | 0.0015 | 10.9 | 9.4 | NS |
| 2. Gefitinib versus placebo (Asian population) | Gefitinib | Control | P | Gefitinib | Control | P | Gefitinib | Control | P |
| Chang 2006 ISEL | 12.4 | 2.1 | 0.01 | 4.4 | 2.2 | 0.008 | 9.5 | 5.5 | 0.01 |
| Zhang 2012 INFORM | 24 | 1 | 0.0001 | 4.8 | 2.6 | < 0.0001 | 18.7 | 16.0 | NS |
| 3. Gefitinib versus placebo (EGFR mutation positive) | Gefitinib | Control | P | Gefitinib | Control | P | Gefitinib | Control | P |
| Zhang 2012 INFORM | ‐ | ‐ | ‐ | 16.6 | 2.8 | 0.0063 | 46.87 | 20.97 | 0.036 |
| Gefitinib vs chemotherapy | |||||||||
| 4. General population | Gefitinib | Chemo | P | Gefitinib | Chemo | P | Gefitinib | Chemo | P |
| versus 1st line chemotherapy | |||||||||
| Crino 2008 INVITE | 3.1 | 5.1 | ‐ | 2.7 | 2.9 | NS | 5.9 | 8 | NS |
| Morere 2010 IFCT0301 | ‐ | ‐ | ‐ | 1.9 | 2 | 0.078 | 2.2 | 3.5 | 0.088 |
| Morere 2010 IFCT0301 (Adenocarcinoma) | ‐ | ‐ | ‐ | 1.9 | 2.1 | 0.272 | 2.3 | 4.4 | NS |
| versus 2nd line chemotherapy | |||||||||
| Cufer 2006 SIGN | 13.2 | 13.7 | NS | 7.5 | 7.1 | NS | 3 | 3.4 | NS |
| Kim 2008 INTEREST | 9.1 | 7.6 | NS | 2.2 | 2.7 | NS | 7.6 | 8 | NS |
| Kim 2008 INTEREST | ‐ | ‐ | ‐ | ‐ | ‐ | ‐ | 8.5 | 8.9 | NS |
| 5. Asian population | Gefitinib | Chemo | P | Gefitinib | Chemo | P | Gefitinib | Chemo | P |
| versus 1st line chemotherapy | |||||||||
| Lou 2014 | 36 | 42.3 | NS | 4.2 | 8.3 | NS | 14.4 | 15 | NS |
| Maemondo 2010 (EGFR mutation positive) | 73.7 | 30.7 | < 0.001 | 10.8 | 5.4 | < 0.001 | 30.5 | 23.6 | NS |
| Mitsudomi 2010 WJTOG (EGFR mutation positive) | 62.1 | 32.2 | < 0.0001 | 9.2 | 6.3 | < 0.0001 | ‐ | ‐ | ‐ |
| Mok 2009 IPASS | 43 | 32.2 | < 0.001 | 5.7 | 5.8 | NS | 18.6 | 17.3 | NS |
| Han 2012 First‐SIGNAL (adenocarcinoma) | 55.4 | 46 | NS | 5.8 | 6.4 | NS | 22.3 | 22.9 | NS |
| Yang 2014 (Asian) | 47.5 | 41.5 | NS | 9.63 | 8.38 | NS | 27.9 | 26.9 | NS |
| versus 2nd line chemotherapy | |||||||||
| Dai 2013 | 17.4 | 13 | NS | 4.4 | 3.1 | NS | ‐ | ‐ | ‐ |
| Kim 2016 | 8 | 13 | NS | 2 | 2 | NS | 8.5 | 8.5 | NS |
| Li 2010 | 22.4 | 18.8 | NS | ‐ | ‐ | ‐ | 7.1 | 6.9 | NS |
| Kim 2008 INTEREST (subgroup) | ‐ | ‐ | ‐ | ‐ | ‐ | ‐ | 10.4 | 12.2 | NS |
| Lee 2010 ISTANA | 28.1 | 7.6 | 0.0007 | 3.3 | 3.4 | NS | 14.1 | 12.2 | NS |
| Maruyama 2008 V‐15‐32 | 22.5 | 12.8 | 0.009 | 2 | 2 | NS | 11.5 | 14 | NS |
| Sun 2012 KCSG‐LU08‐01 (adenocarcinoma, subgroup) | 58.8 | 22.4 | < 0.001 | 9.0 | 3.0 | 0.0006 | 22.2 | 18.9 | NS |
| versus maintenance therapy | |||||||||
| Ahn 2012 (Asian) | 46 | 35 | NS | 9.95 | 6.83 | NS | ‐ | ‐ | ‐ |
| Xu 2015 (Asian) | 18.1 | 29.8 | NS | ‐ | ‐ | ‐ | ‐ | ‐ | ‐ |
| 6. EGFR mutation positive | Gefitinib | Chemo | P | Gefitinib | Chemo | P | Gefitinib | Chemo | P |
| versus 1st line chemotherapy | |||||||||
| Maemondo 2010 (EGFR mutation positive) | 73.7 | 30.7 | < 0.001 | 10.8 | 5.4 | < 0.001 | 30.5 | 23.6 | NS |
| Mitsudomi 2010 WJTOG (EGFR mutation positive) | 62.1 | 32.2 | < 0.0001 | 9.2 | 6.3 | < 0.0001 | ‐ | ‐ | ‐ |
| Mok 2009 IPASS (subgroup) | 71.2 | 47.3 | < 0.001 | ‐ | ‐ | ‐ | ‐ | ‐ | ‐ |
| Han 2012 First‐SIGNAL (subgroup) | 84.6 | 37.5 | 0.002 | ‐ | ‐ | ‐ | ‐ | ‐ | ‐ |
| Yang 2014 (subgroup) | 70.8 | 65.4 | NS | 16.62 | 12.91 | NS | 45.7 | 32.4 | 0.255 |
| versus 2nd line chemotherapy | |||||||||
| INTEREST Doulliard 2010 (subgroup) | 42.1 | 21.1 | 0.04 | 7 | 4.1 | 0.001 | 14.2 | 16.6 | NS |
| Maruyama 2008 (subgroup) | 67 | 46 | ‐ | ‐ | ‐ | ‐ | ‐ | ‐ | ‐ |
| Sun 2012 KCSG‐LU08‐01 (subgroup) | ‐ | ‐ | ‐ | 15.7 | 2.9 | 0.005 | ‐ | ‐ | ‐ |
| 7. Gefitinib 250 mg versus gefitinib 500 mg | 250 mg | 500 mg | P | 250 mg | 500 mg | P | 250 mg | 500 mg | P |
| 2nd+ line | |||||||||
| Fukuoka 2003 | 18.4 | 19 | NS | 2.7 | 2.8 | NS | 7.6 | 8 | NS |
| Kris 2004 | 12 | 9 | NS | ‐ | ‐ | ‐ | 7 | 6 | NS |
| Maintenance therapy | |||||||||
| Xue 2015 (Asian) | 12.5 | 12.5 | NS | ‐ | ‐ | ‐ | ‐ | ‐ | ‐ |
| 8. Gefitinib versus gefitinib + chemotherapy | Gefitinib | G + Chemo | P | Gefitinib | G + Chemo | P | Gefitinib | G + Chemo | P |
| 1st line | |||||||||
| An 2016 | 73.33 | 80 | NS | 14 | 18 | < 0.05 | 32 | 34 | NS |
| Cheng 2016 | 74 | 80 | NS | 10.9 | 15.8 | 0.014 | ‐ | ‐ | ‐ |
| 2nd+ line | |||||||||
| Chen 2007(Asian, adenocarcinoma) | 55.6 | 52.4 | NS | 7.1 | 12.8 | NS | 13.3 | 23.4 | NS |
| Chen 2011(Asian, adenocarcinoma) | 35 | 37 | NS | 5.3 | 8.3 | 0.04 | ‐ | ‐ | ‐ |
| Chen 2011 (EGFR mutation positive subgroup) | ‐ | ‐ | ‐ | 7.6 | 14.4 | 0.0061 | ‐ | ‐ | ‐ |
| 9. Gefitinib + chemotherapy versus chemotherapy | 250 mg + Chemo | Chemo | P | 250 mg + Chemo | Chemo | P | 250 mg + Chemo | Chemo | P |
| 1st line | |||||||||
| Giaccone 2004 | 51.2 | 47.2 | NS | 5.8 | 6 | NS | 9.9 | 10.9 | NS |
| Herbst 2004 | 30.4 | 28.7 | NS | 5.3 | 5 | NS | 9.8 | 9.9 | NS |
| Takeda 2010 (Asian) | 34.2 | 29.3 | NS | 4.3 | 4.6 | < 0.001 | 12.9 | 13.7 | NS |
| Yu 2014 (Asian) | 47.4 | 50 | NS | 7.9 | 7 | NS | 25.4 | 20.5 | NS |
| 2nd line | |||||||||
| Soria 2015 IMPRESS (EGFR mutation positive) | 32 | 34 | NS | 5.4 | 5.4 | NS | 14.8 | 17.2 | NS |
Chemo: chemotherapy
G: gefitinib
NS: non‐significant
ORR: overall response rate
OS: overall survival
PFS: progression‐free survival
Risk of bias in included studies
We included trials that met our inclusion criteria. We checked all data extracted for accuracy and final database entries. We resolved any discrepancies through discussion. Overall, the risk of bias in the 35 included studies was moderate. The results of the 'Risk of bias' assessment are depicted graphically in Figure 2.
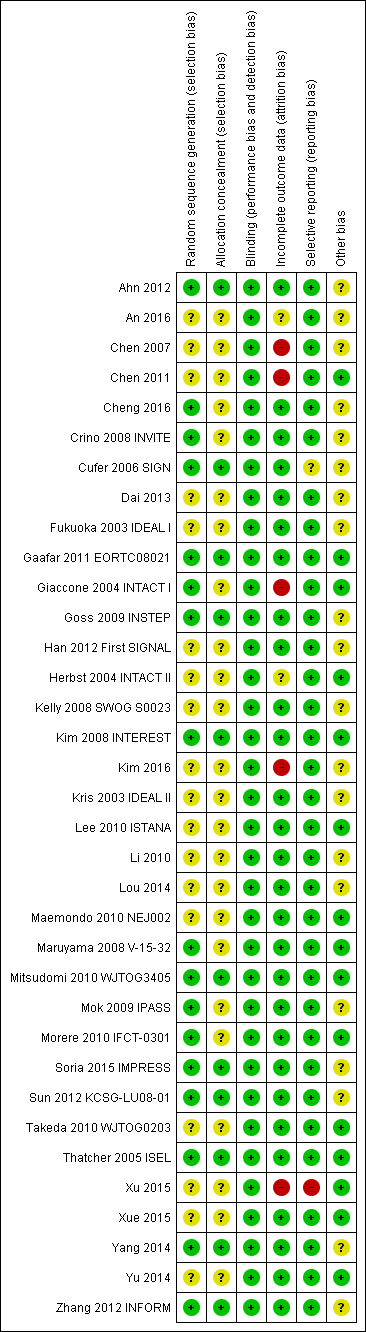
'Risk of bias' summary: review authors' judgements about each risk of bias item for each included study.
Allocation
Sequence generation
Seventeen of the 35 included studies reported adequate sequence generation (Ahn 2012; Cheng 2016; Crino 2008 INVITE; Cufer 2006 SIGN; Gaafar 2011 EORTC08021; Giaccone 2004 INTACT I; Goss 2009 INSTEP; Kim 2008 INTEREST; Maruyama 2008 V‐15‐32; Mitsudomi 2010 WJTOG3405; Mok 2009 IPASS; Morere 2010 IFCT‐0301; Soria 2015 IMPRESS; Sun 2012 KCSG‐LU08‐01; Thatcher 2005 ISEL; Yang 2014; Zhang 2012 INFORM). The remaining 18 studies were all described as randomised, but none provided any further information and so we classified them as having an uncertain risk of bias (An 2016; Chen 2007; Chen 2011; Dai 2013; Fukuoka 2003 IDEAL I; Han 2012 First SIGNAL; Herbst 2004 INTACT II; Kelly 2008 SWOG S0023; Kim 2016; Kris 2003 IDEAL II; Lee 2010 ISTANA; Li 2010; Lou 2014; Maemondo 2010 NEJ002; Takeda 2010 WJTOG0203; Xu 2015; Xue 2015; Yu 2014).
Allocation concealment
Allocation concealment was adequate in 11 of the included studies (Ahn 2012; Cufer 2006 SIGN; Gaafar 2011 EORTC08021; Goss 2009 INSTEP; Kim 2008 INTEREST; Mitsudomi 2010 WJTOG3405; Soria 2015 IMPRESS; Sun 2012 KCSG‐LU08‐01; Thatcher 2005 ISEL; Yang 2014; Zhang 2012 INFORM). Most of these studies used a minimisation method or centralised allocation procedure. The remaining studies did not report whether allocation was concealed and so are possibly at risk of bias.
Blinding
Of the 35 included trials, we judged blinding to be adequate in all studies. Eight studies blinded participants and investigators using an identical placebo (Fukuoka 2003 IDEAL I; Gaafar 2011 EORTC08021; Giaccone 2004 INTACT I; Goss 2009 INSTEP; Soria 2015 IMPRESS; Thatcher 2005 ISEL; Yang 2014; Zhang 2012 INFORM). The remaining 27 studies were unblinded or open‐label (for example comparing gefitinib with intravenous chemotherapy), but we judged that this would not affect the measured outcomes.
Incomplete outcome data
The majority of studies adequately addressed incomplete outcome data. Of the 35 included trials, 28 had a low risk of bias from incomplete outcome data. Studies cited reasons such as death, disease progression and drug toxicity for dropouts. Five phase II studies did not address withdrawals or patients lost to follow‐up and thus are potentially at high risk of bias (Chen 2007; Chen 2011; Giaccone 2004 INTACT I; Kim 2016; Xu 2015). Two studies did not provide adequate outcome data and so are at a risk of bias from incomplete outcome data analysis (An 2016;Herbst 2004 INTACT II).
Selective reporting
We judged 33 of the 35 included studies as at low risk of reporting bias. One study reported an outcome (progression‐free survival) that was not pre‐specified (Cufer 2006 SIGN). We judged this as an unclear risk of bias. Another study did not report an outcome that was prespecified in the methods ("survival time"), with no reason provided for this in the paper (Xu 2015). We judged this as a high risk of bias
Other potential sources of bias
Three trials were stopped early (Kelly 2008 SWOG S0023; Maemondo 2010 NEJ002; Mitsudomi 2010 WJTOG3405), which may be another source of bias. The SWOGS0023 study was stopped because an unplanned interim analysis concluded that the alternate hypothesis of improved survival would not be met. The NEJ002 and WJTOG3405 studies were concluded early following the presentation of contemporary data showing a progression‐free survival benefit in EGFR mutated patients. These studies were then closed to accrual.
We judged the remaining studies as having an unclear risk of bias listed due to conflicts of interest, in particular pharmaceutical funding or significant affiliations, or because they did not adequately declare any conflicts of interest (Ahn 2012; An 2016; Chen 2007; Cheng 2016; Crino 2008 INVITE; Cufer 2006 SIGN; Dai 2013; Fukuoka 2003 IDEAL I; Goss 2009 INSTEP; Han 2012 First SIGNAL; Kelly 2008 SWOG S0023; Kim 2008 INTEREST; Kim 2016; Kris 2003 IDEAL II; Li 2010; Mok 2009 IPASS; Soria 2015 IMPRESS; Sun 2012 KCSG‐LU08‐01; Yang 2014; Zhang 2012 INFORM).
Effects of interventions
See: Summary of findings for the main comparison Gefitinib compared to chemotherapy for first‐line treatment of advanced NSCLC; Summary of findings 2 Gefitinib compared to chemotherapy for second‐line treatment of advanced NSCLC; Summary of findings 3 Gefitinib compared to chemotherapy for advanced NSCLC ‐ toxicity
See: summary of findings Table for the main comparison ('Gefitinib compared to chemotherapy for first‐line treatment of advanced NSCLC'); summary of findings Table 2 ('Gefitinib compared to chemotherapy for second‐line treatment of advanced NSCLC'); summary of findings Table 3 ('Gefitinib compared to chemotherapy for advanced NSCLC ‐ toxicity').
1. Gefitinib versus placebo or best supportive care
Survival
See Analysis 1.1; Analysis 1.2; Analysis 1.3.
Four studies compared gefitinib with placebo in a general population (Gaafar 2011 EORTC08021; Goss 2009 INSTEP; Kelly 2008 SWOG S0023; Thatcher 2005 ISEL). The data presented examines the effect of gefitinib compared with placebo in the first‐line, second‐line and maintenance settings. Total pooling of data was not conducted for first‐ or second‐line therapy as only single studies were included. Pooling of data was only possible for maintenance treatment, as two studies were included (Gaafar 2011 EORTC08021; Kelly 2008 SWOG S0023). Gefitinib did not improve overall survival when compared with placebo, either when administered as first‐line (Goss 2009 INSTEP; hazard ratio (HR) 0.84, 95% confidence interval (CI) 0.62 to 1.14, P = 0.27), second‐line (Thatcher 2005 ISEL; HR 0.89, 95% CI 0.79 to 1.01, P = 0.06) or maintenance therapy (Gaafar 2011 EORTC08021; Kelly 2008 SWOG S0023; pooled HR 1.14, 95% CI 0.61 to 2.14, P = 0.69, I2 = 85%, random‐effects model).
One‐year survival rates were improved by administration of gefitinib versus placebo as second‐line therapy (risk ratio (RR) 1.28, 95% CI 1.05 to 1.57, P = 0.02), but not as maintenance therapy (RR 0.90, 95% CI 0.78 to 1.04, P = 0.15). Progression‐free survival was not improved when gefitinib was compared with placebo as first‐line therapy and median progression‐free survival was reported as 1.4 months in both groups (HR 0.82, 95% CI 0.60 to 1.12, P = 0.21). Time to treatment failure was improved in favour of gefitinib as second‐line therapy, with a HR of 0.82 (95% CI 0.75 to 0.90, P < 0.0001): median progression‐free survival was 3 months with gefitinib, 2.6 months with placebo. Maintenance use of gefitinib after first‐line treatment improved progression‐free survival (HR 0.70, 95% CI 0.53 to 0.91, P = 0.007, I2 = 32%).
Toxicity
See Analysis 1.4; Analysis 1.6.
We have pooled reported toxicity data from three studies in this comparison so as to examine the differences in toxicity between gefitinib and placebo or best supportive care (Gaafar 2011 EORTC08021; Goss 2009 INSTEP; Thatcher 2005 ISEL). Administration of gefitinib was significantly associated with Common Toxicity Criteria (CTC) grade 3 to 4 events such as skin rash (RR 7.92, 95% CI 1.46 to 43.03, P = 0.02, I2 = 0%) and diarrhoea (RR 2.48, 95% CI 1.15 to 5.35, P = 0.02, I2 = 0%). One study reported a statistically significant increase in alanine aminotransferase (ALT) with gefitinib (RR 9.11, 95% CI 1.18 to 70.32, P = 0.03). The risk of all other adverse events was either not estimable or not significantly different between the two groups.
Efficacy
See Analysis 1.22; Analysis 1.23.
Response was reported in only three of the four included studies (Gaafar 2011 EORTC08021; Goss 2009 INSTEP; Thatcher 2005 ISEL). We did not pool the data as the INSTEP study compared gefitinib with placebo as first‐line therapy, ISEL did so as second‐line therapy and the EORTC08021 trial as maintenance therapy. As first‐line therapy, gefitinib did not improve the overall response rate (RR 6.06, 95% CI 0.74 to 49.43, P = 0.09) or the disease control rate (RR 1.36, 95% CI 0.86 to 2.16, P = 0.19). This was reported as an overall response rate of 6% and 1% in the gefitinib and placebo groups, respectively, and the disease control rate was 31% and 23%, respectively. As second‐line therapy, the overall response rate was higher for gefitinib‐treated cases than for placebo (RR 6.42, 95% CI 2.82 to 14.64, P < 0.00001) and the disease control rate was also significantly higher for gefitinib (RR 1.24, 95% CI 1.06 to 1.44, P = 0.006). The overall response rate was 8% in the gefitinib group and 1% in the placebo group, and the disease control rate was 40% and 32%, respectively. Similarly, gefitinib improved the overall response rate and the disease control rate when used as maintenance therapy (RR 10.12, 95% CI 1.32 to 77.33, P = 0.03; RR 1.21, 95% CI 1.00 to 1.46, P = 0.05, respectively).
Quality of life and symptom improvement scores
Thatcher 2005 ISEL reported that the addition of gefitinib to "best supportive care" produced no significant changes in the quality of life subscale of the Functional Assessment of Cancer Therapy‐Lung (FACT‐L) questionnaire when compared with best supportive care alone. Gefitinib was associated with a statistically significant improvement in the symptom score (mean change from baseline ‐0.86 to ‐1.38; P = 0.019), but this did not meet predefined criteria. As described by Cella 2002, for changes in disease‐related symptoms to be classed as clinically relevant, the score must increase by two points. Goss 2009 INSTEP reported improvements in FACT‐L quality of life, FACT‐L Trial Outcome Index (TOI), lung cancer subscale (LCS) and Pulmonary Symptom Index (PSI) that were statistically non‐significant.
Subgroup analysis: Asian population
See Analysis 2.1; Analysis 2.2; Analysis 2.3; Analysis 2.4.
The INFORM study prospectively recruited patients of East Asian ethnic origin without disease progression after first‐line chemotherapy (Zhang 2012 INFORM). Pre‐planned subgroup analysis in the ISEL trial found marked heterogeneity in survival between patient groups (Thatcher 2005 ISEL).
The ISEL study conducted a subgroup analysis in 342 patients of Asian ethnicity who were enrolled in the ISEL trial. Two hundred and thirty‐five patients received second‐line gefitinib and 107 received placebo. Pre‐planned analysis reported that gefitinib significantly improved overall survival (HR 0.66, 95% CI 0.48 to 0.91, P = 0.01), the one‐year survival rate (RR 1.75, 95% CI 1.20 to 2.55, P = 0.004) and progression‐free survival (HR 0.69, 95% CI 0.52 to 0.91, P = 0.009) compared to placebo. Median overall survival was 9.5 months for gefitinib compared with 5.5 months for placebo. Covariate analysis of demographic subgroups further demonstrated a survival advantage across multiple subgroups. Overall survival in this Asian subgroup of patients was also greater in never‐smokers (HR 0.37, 95% CI 0.21 to 0.64, P = 0.0004) compared with smokers (HR 0.85, 95% CI 0.58 to 1.25, P = 0.40); females (HR 0.46, 95% CI 0.26 to 0.79, P = 0.0045) compared with males (HR 0.80, 95% CI 0.54 to 1.18, P = 0.26); and patients with adenocarcinoma (HR 0.66, 95% CI 0.45 to 0.97, P = 0.04) compared with non‐adenocarcinoma (HR 0.86, 95% CI 0.50 to 1.47, P = 0.58). Objective response rates were higher in Asian patients treated with gefitinib compared with placebo (RR 6.03, 95% CI 1.46 to 24.91, P = 0.01).
The INFORM study showed that gefitinib in the maintenance setting did not improve overall survival (HR 0.88, 95% CI 0.68 to 1.14, P = 0.335). However, gefitinib improved progression‐free survival over placebo (HR 0.42, 95% CI 0.33 to 0.54, P < 0.00001), and median progression‐free survival was improved from 2.6 months to 4.8 months. The objective response rate was greater with gefitinib (RR 35.00, 95% CI 4.86 to 252.15, P = 0.0004). There was no difference in reported toxicities.
Quality of life improvement rates were higher in those administered gefitinib compared with placebo, as measured by FACT‐L (improvement rates 55% versus 24%, P < 0.001), TOI (51% versus 21%, P < 0.001) and LCS (50% versus 22%, P < 0.001) in the INFORM study (Zhang 2012 INFORM). Gefitinib also increased the time‐to‐worsening of quality of life when compared with placebo (FACT‐L: 2.8 months versus 1.4 months, P = 0.019; TOI: 3.5 months versus 1.4 months P = 0.006; LCS: 2.8 months versus 1.4 months P = 0.028). The relationship between the change in quality of life score and prognosis was also analysed in the INFORM study. Patients with an improvement in quality of life had significantly longer progression‐free survival and overall survival when compared with those that had a stable or worsened quality of life (FACT‐L: 9.4 months versus 2.8 months versus 2.7 months, P < 0.001 and 25.4 months versus 19.9 months versus 14.4 months, P = 0.003, respectively).
Subgroup analysis: biomarker
See Analysis 3.1; Analysis 3.2.
Subgroup analysis of patients from the ISEL trial reported that the overall response rate was higher in patients with epidermal growth factor receptor (EGFR) mutations (37.5%; 6 of 16 patients) than those who were EGFR mutation negative (2.6%; 3 of 116 patients).
The INFORM study reported improved overall survival in 30 patients with EGFR mutations (HR 0.39, 95% CI 0.15 to 0.98, P = 0.036) with median overall survival improving from 20.97 months to 46.87 months when given gefitinib versus placebo. Whilst this subgroup only contained a very small number of patients, the study was able to show that gefitinib doubled the median overall survival. However, those with no detectable EGFR mutation or an unknown EGFR mutation status did not benefit from gefitinib maintenance therapy (HR 1.27, 95% CI 0.7 to 2.3, P = 0.431; HR 0.92, 95% CI 0.68 to 1.25, P = 0.603, respectively).
Progression‐free survival was also improved with gefitinib (HR 0.17, 95% CI 0.07 to 0.41, P < 0.0001) over placebo. Median progression‐free survival improved from 2.8 months to 16.6 months in this subgroup analysis of the INFORM trial.
2. Gefitinib versus chemotherapy
Survival
See Analysis 4.1; Analysis 4.2; Analysis 4.3.
Gefitinib versus first‐line chemotherapy
As first‐line therapy, only one study reported hazard ratios for survival (Crino 2008 INVITE). Gefitinib did not prolong overall survival (HR 0.98, 95% CI 0.66 to 1.46, P = 0.92, moderate quality of evidence) or progression‐free survival (HR 1.19, 95% CI 0.86 to 1.65, P = 0.30, moderate quality of evidence) when compared with vinorelbine in this general population of patients aged at least 70 years. This study selected patients over the age of 70 years old, therefore this limits the applicability of the data to other patients and thus we downgraded the quality of evidence to moderate.
Two studies reported selected survival outcomes comparing gefitinib with first‐line chemotherapy (Crino 2008 INVITE; Morere 2010 IFCT‐0301). When we pooled data from these two studies there was no difference in one‐year survival rates between gefitinib and first‐line chemotherapy (RR 0.93, 95% CI 0.63 to 1.38, P = 0.73, I2 = 26%). Median overall survival ranged from 2.2 to 5.9 months and 3.5 to 8 months in the gefitinib and chemotherapy groups, respectively. Median progression‐free survival ranged from 1.9 to 2.7 months and 2.0 to 2.9 months in the gefitinib and chemotherapy groups, respectively.
Gefitinib versus second‐line chemotherapy
The SIGN and INTEREST studies compared gefitinib with docetaxel as second‐line therapy (Cufer 2006 SIGN; Kim 2008 INTEREST). Only Kim 2008 INTEREST reported survival outcomes and neither overall survival (HR 1.02, 95% CI 0.91 to 1.15, P = 0.74, moderate quality of evidence) nor progression‐free survival (HR 1.04, 95% CI 0.92 to 1.17, P = 0.51, moderate quality of evidence) were prolonged by gefitinib. Median overall survival ranged from 7.5 to 7.6 months and 7.1 to 8 months in the gefitinib and chemotherapy groups, respectively. There was no difference in the one‐year survival rate (RR 0.94, 95% CI 0.82 to 1.09, P = 0.44). Median progression‐free survival in the non‐selected population ranged from 2.2 to 3 months and 2.7 to 3.4 months in the gefitinib and chemotherapy groups, respectively.
Cufer 2006 SIGN randomised patients to either second‐line gefitinib or docetaxel, however the trial was not formally powered to detect any statistical differences for any endpoint. We judged this to be at risk of serious imprecision and thus downgraded it one level.
Toxicity
See Analysis 4.4; Analysis 4.5; Analysis 4.6; Analysis 4.7; Analysis 4.8; Analysis 4.9; Analysis 4.10; Analysis 4.11.
We combined data to compare the toxicity profile of gefitinib with chemotherapy for first‐ and second‐line therapy to assess the overall effect in both groups. Data from Cufer 2006 SIGN, Crino 2008 INVITE, Kim 2008 INTEREST and Morere 2010 IFCT‐0301 were included. Gefitinib was generally better tolerated than chemotherapy. Gefitinib was associated with an increased risk of skin rash when compared with chemotherapy (RR 2.40, 95% CI 1.08 to 5.31, P = 0.03, I2 = 4.7%, high quality of evidence). Gefitinib was associated with a decreased risk of constipation (RR 0.41, 95% CI 0.17 to 0.97, P = 0.04, I2 = 0%, high quality of evidence), fatigue (RR 0.16, 95% CI 0.03 to 0.88, P = 0.04, I2 = 8.2%, moderate quality of evidence), asthenia (RR 0.51, 95% CI 0.35 to 0.75, P = 0.0007, I2 = 0%, high quality of evidence), neurotoxicity (RR 0.07, 95% CI 0.01 to 0.34, P = 0.001, I2 = 0%, high quality of evidence), neutropenia (RR 0.04, 95% CI 0.02 to 0.06, P < 0.00001, I2 = 43.1%, high quality of evidence), leukopenia (RR 0.03, 95% CI 0.00 to 0.22, P = 0.0005, I2 = 0%, high quality of evidence) and febrile neutropenia (RR 0.12, 95% CI 0.06 to 0.23, P < 0.00001, I2 = 0%, high quality of evidence). There were no differences between groups for any other measured adverse side effects including pruritus, diarrhoea, vomiting, anorexia, stomatitis, arthralgia, peripheral oedema, respiratory tract infection, dyspnoea, cough, anaemia, thrombocytopenia, hypokalaemia or pyrexia.
We assessed most of the toxicity outcomes as high‐quality evidence. We downgraded one outcome, fatigue, to a moderate quality of evidence as the study by Crino 2008 INVITE enrolled only 190 patients who were older than 70 years old, thus there was a risk of serious indirectness.
Efficacy
See Analysis 4.26; Analysis 4.27.
Only one first‐line study presented data on disease control rates and there was no reported improvement when administering gefitinib versus vinorelbine (RR 0.82, 95% CI 0.61 to 1.10, P = 0.19) (Crino 2008 INVITE). Disease control rates were 43.3% and 53.5% for gefitinib and chemotherapy, respectively. Two second‐line studies reported efficacy data (Cufer 2006 SIGN; Kim 2008 INTEREST). Pooled data showed that there was no improvement in overall response rate when comparing gefitinib and docetaxel as second‐line therapy (RR 1.16, 95% CI 0.85 to 1.59, P = 0.35, I2 = 0%). Overall response rates were 9% to 13% for both the gefitinib and chemotherapy groups.
Quality of life and symptom improvement scores
See Analysis 4.28; Analysis 4.29; Analysis 4.30; Analysis 4.31.
We pooled data from the INVITE (Crino 2008 INVITE) and INTEREST (Kim 2008 INTEREST) studies. Patients who received gefitinib reported statistically significant improvements in quality of life as assessed by scores on the FACT‐L (standardised mean difference (SMD) 10.50, 95% CI 9.55 to 11.45, P < 0.00001, I2 = 21%), LCS (SMD 3.63, 95% CI 3.08 to 4.19, P < 0.00001, I2 = 0%) and TOI (SMD 9.87, 95% CI 1.26 to 18.48, P = 0.02, I2 = 59%). One study also described an improvement in PSI scores (SMD 5.60, 95% CI 3.55 to 7.65, P < 0.00001) in patients who received gefitinib (Crino 2008 INVITE).
Subgroup analysis: Asian population
Survival
See Analysis 5.1; Analysis 5.2; Analysis 5.3; Analysis 5.4; Analysis 5.5; Analysis 5.6; Analysis 5.7.
Gefitinib versus first‐line chemotherapy
Five phase III studies compared gefitinib with first‐line platinum doublet chemotherapy (Han 2012 First SIGNAL; Maemondo 2010 NEJ002; Mitsudomi 2010 WJTOG3405; Mok 2009 IPASS; Yang 2014). The IPASS (Mok 2009 IPASS) and NEJ002 (Maemondo 2010 NEJ002) studies compared gefitinib with carboplatin‐paclitaxel. The WJTOG3405 study compared gefitinib with cisplatin‐docetaxel (Mitsudomi 2010 WJTOG3405). The First‐SIGNAL study compared gefitinib with gemcitabine‐cisplatin (Han 2012 First SIGNAL). The study by Yang 2014 compared gefitinib monotherapy with pemetrexed‐cisplatin followed by gefitinib maintenance.
Pooled analysis showed that gefitinib did not improve overall survival (HR 0.94, 95% CI 0.82 to 1.06, P = 0.31, I2 = 0%) or the one‐year survival rate (RR 1.03, 95% C 0.97 to 1.09, P = 0.33, I2 = 1%). One study reported median overall survival as 22 months in both groups. Progression‐free survival was higher in the gefitinib group than in the chemotherapy group (HR 0.65, 95% CI 0.43 to 0.98, P = 0.04, I2 = 93%). Median progression‐free survival ranged from 5.5 to 6.4 months with chemotherapy to 5.7 to 10.4 months with gefitinib. Please refer to Figure 3 for the pooled progression‐free survival data from first‐line studies that included Asian patients.

Progression‐free survival: Gefitinib versus first‐line chemotherapy in an Asian population (Analysis 5.4).
Gefitinib versus second‐line chemotherapy
Two phase III studies compared gefitinib with second‐line docetaxel in patients of Asian ethnicity (Lee 2010 ISTANA; Maruyama 2008 V‐15‐32) and one phase III study compared gefitinib with pemetrexed (Sun 2012 KCSG‐LU08‐01). In pooled analysis of these three trials, there was no benefit on either overall survival or the one‐year survival rate for gefitinib over second‐line chemotherapy (HR 0.94, 95% CI 0.79 to 1.12, P = 0.50, I2 = 0%; RR 0.94, 95% CI 0.81 to 1.11, P = 0.48, I2 = 0%, respectively). Progression‐free survival was prolonged (HR 0.71, 95% CI 0.57 to 0.88, P = 0.002, I2 = 40%; see Figure 4) in favour of gefitinib. Median progression‐free survival was 2 to 6.8 months with second‐line chemotherapy, and 2 to 10 months with gefitinib in the second‐line setting.

Progression‐free survival: Gefitinib versus second‐line chemotherapy in an Asian population (Analysis 5.5).
Gefitinib versus maintenance chemotherapy
Two phase II studies compared maintenance gefitinib with chemotherapy, however only one of them presented survival data (Ahn 2012). There was no difference in overall survival (HR 2.15, 95% CI 0.83 to 5.55, P = 0.11) or progression‐free survival (HR 0.53, 95% CI 0.27 to 1.04, P = 0.06) between the gefitinib and chemotherapy treatment arms. There was an improved one‐year survival rate (RR 0.79, 95% CI 0.65 to 0.98, P = 0.03) with maintenance gefitinib over chemotherapy.
Toxicity
See Analysis 5.8; Analysis 5.9; Analysis 5.10; Analysis 5.11; Analysis 5.12; Analysis 5.13; Analysis 5.14; Analysis 5.15; Analysis 5.16; Analysis 5.17; Analysis 5.18; Analysis 5.19; Analysis 5.20; Analysis 5.21; Analysis 5.22; Analysis 5.23.
Gefitinib was generally well tolerated in this population. We pooled toxicity data from all studies. Compared to chemotherapy, the gefitinib group reported fewer adverse side effects such as nausea (RR 0.34, 95% CI 0.17 to 0.64, P = 0.001, I2 = 0%), vomiting (RR 0.19, 95% CI 0.05 to 0.77, P = 0.02, I2 = 56%, random‐effects model), anorexia (RR 0.36, 95% CI 0.27 to 0.49, P < 0.00001, I2 = 18%), fatigue (RR 0.32, 95% CI 0.22 to 0.46, P < 0.00001, I2 = 50%), arthralgia (RR 0.14, 95% CI 0.03 to 0.61, P = 0.009, I2 = 0%), asthenia (RR 0.22, 95% CI 0.08 to 0.58, P = 0.002, I2 = 13%), neurotoxicity (RR 0.07, 95% CI 0.02 to 0.24, P < 0.0001, I2 = 0%), neutropenia (RR 0.11, 95% CI 0.05 to 0.27, P < 0.00001, I2 = 82%, random‐effects model), anaemia (RR 0.18, 95% CI 0.12 to 0.29, P < 0.00001, I2 = 4%), leukopenia (RR 0.07, 95% CI 0.02 to 0.23, P < 0.00001, I2 = 77%, random‐effects model), thrombocytopaenia (RR 0.32, 95% CI 0.14 to 0.72, P = 0.006, I2 = 22%) and febrile neutropenia (RR 0.09, 95% CI 0.03 to 0.28, P < 0.0001, I2 = 0%). Other side effects were seen more frequently in the gefitinib group. Skin rash (RR 3.11, 95% CI 1.28 to 7.55, P = 0.01, I2 = 60%, random‐effects model), diarrhoea (RR 2.79, 95% CI 1.57 to 4.94, P = 0.0005, I2 = 0%), increased alanine aminotransferase (ALT) (RR 10.03, 95% CI 5.23 to 19.26, P < 0.00001, I2 = 37%) and increased aspartate transaminase (AST) (RR 7.73, 95% CI 2.78 to 21.46, P < 0.0001, I2 = 0%) were more frequent in gefitinib‐treated cases.
Efficacy
See Analysis 5.24; Analysis 5.25; Analysis 5.26.
Objective response rates were higher in the gefitinib group when compared with first‐line chemotherapy (RR 1.43, 95% CI 1.13 to 1.82, P = 0.003, I2 = 76%, random‐effects model). The overall response rate ranged from 43% to 62.1% in the gefitinib group and 30.7% to 32.2% in the chemotherapy group. There was no effect on the disease control rate (RR 0.99, 95% CI 0.86 to 1.13, P = 0.86, I2 = 80%, random‐effects model): 73% to 94% and 78% to 81%, respectively.
The overall response rate was not significantly improved in the gefitinib group compared with second‐line chemotherapy (RR 1.43, 95% CI 0.92 to 2.22, P = 0.11, I2 = 46%). Two studies found that overall response rates were poor overall, but the gefitinib group performed better (23% to 28%) than the second‐line chemotherapy group (8% to 13%) (Lee 2010 ISTANA; Maruyama 2008 V‐15‐32). The disease control rate (RR 0.99, 95% CI 0.78 to 1.25, P = 0.92, I2 = 46%) was statistically similar for both groups (34% and 33%, respectively).
Pooled data from two maintenance studies found that gefitinib improved the stable disease rate and the disease control rate (RR 0.64, 95% CI 0.44 to 0.93, P = 0.02; RR 0.65, 95% CI 0.49 to 0.85, P = 0.002, respectively). There was no improvement in the overall response rate with maintenance gefitinib (RR 0.88, 95% CI 0.41 to 1.87, P = 0.06, I2 = 73%, random‐effects model).
Quality of life and symptom improvement scores
Three studies explored the impact of gefitinib versus chemotherapy on quality of life, but unfortunately the data could not be pooled (Lee 2010 ISTANA; Maruyama 2008 V‐15‐32; Mok 2009 IPASS). All three studies reported significantly improved quality of life in patients who received gefitinib as measured by the Trial Outcome Index (TOI). Mok 2009 IPASS and Maruyama 2008 V‐15‐32 stated that improvements as measured by FACT‐L were significant, but none recorded significant improvements on the lung cancer subscale (LCS).
Subgroup analysis: EGFR mutation positive population
Survival
See Analysis 6.1; Analysis 6.2; Analysis 6.3; Analysis 6.4.
Gefitinib versus first‐line chemotherapy
Five studies compared gefitinib with first‐line chemotherapy. Two of these studies selected patients with EGFR mutations (Maemondo 2010 NEJ002; Mitsudomi 2010 WJTOG3405), and the others selected patients based on clinical features and conducted subgroup analyses on patients positive for EGFR mutations (Han 2012 First SIGNAL; Mok 2009 IPASS; Yang 2014). We have separately analysed studies that selected EGFR mutants and those that selected patients based on clinical features then conducted subgroup analyses and progression‐free survival results are presented in Figure 5.
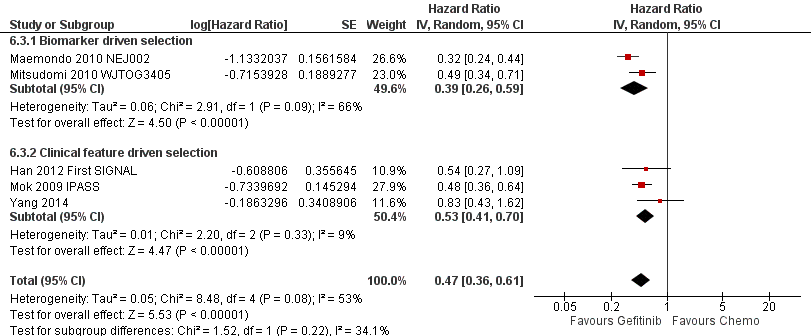
Progression‐free survival: Gefitinib versus first‐line chemotherapy in an EGFR mutation positive population (Analysis 6.3).
The two biomarker driven studies did not show any improvement in overall survival (HR 0.98, 95% CI 0.72 to 1.33, P = 0.90, I2 = 54%). Progression‐free survival was significantly increased with gefitinib compared with first‐line chemotherapy (HR 0.39, 95% CI 0.26 to 0.59, P < 0.00001, I2 = 66%, random‐effects model).
Three phase III studies conducted subgroup analyses in EGFR mutation positive patients. There was no improvement in overall survival (HR 0.95, 95% CI 0.68 to 1.33, P = 0.75, I2 = 20%). However, there was a statistically significant improvement in progression‐free survival (HR 0.53, 95% CI 0.41 to 0.70, P < 0.00001, I2 = 9%).
Pooled analysis of all first‐line studies that examined EGFR mutation positive patients showed that there was no difference in overall survival (HR 0.97, 95% CI 0.77 to 1.21, P = 0.76, I2 = 15%). However, pooled data from these five studies showed that gefitinib was able to prolong progression‐free survival when compared with first‐line chemotherapy (HR 0.47, 95% CI 0.36 to 0.61, P < 0.00001, I2 = 53%, random‐effects model), with median progression‐free survival improving from 5.5 to 6.3 months in the chemotherapy group to 9.2 to 10.4 months in the gefitinib group.
Gefitinib versus second‐line chemotherapy
When comparing gefitinib with second‐line chemotherapy, data were available from two studies (Kim 2008 INTEREST; Sun 2012 KCSG‐LU08‐01). This showed that gefitinib did not improve overall survival (HR 0.83, 95% CI 0.41 to 1.66, P = 0.60). There was a statistically significant improvement in progression‐free survival (HR 0.24, 95% CI 0.12 to 0.47, P < 0.0001, I2 = 0%) in EGFR mutation positive patients. Progression‐free survival for this analysis is presented in Figure 6.

Progression‐free survival: Gefitinib versus second‐line chemotherapy in an EGFR mutation positive population (Analysis 6.4).
Efficacy
See Analysis 6.5; Analysis 6.6; Analysis 6.7.
Gefitinib versus first‐line chemotherapy
Pooled analysis comparing first‐line gefitinib with chemotherapy showed that the overall response rate was significantly improved in favour of gefitinib. The two studies that selected patients with EGFR mutations (Maemondo 2010 NEJ002; Mitsudomi 2010 WJTOG3405), as well as the phase III studies that conducted subgroup analyses on EGFR mutation positive patients found significant improvements in overall response rate (RR 2.23, 95% CI 1.75 to 2.85, P < 0.00001, I2 = 0% and RR 1.45, 95% CI 1.05 to 1.99, P = 0.02, I2 = 53%, random‐effects model, respectively). Pooled analysis of all studies showed that first‐line gefitinib improved the overall response rate over chemotherapy (RR 1.73, 95% CI 1.29 to 2.31, P = 0.002, I2 = 70%, random‐effects model) and overall response rates ranged from 62% to 76% in the gefitinib group, compared with 31% to 47% in the first‐line chemotherapy group. The stable disease rate was improved in favour of first‐line chemotherapy (RR 0.52, 95% CI 0.28 to 0.97, P = 0.04, I2 = 66%, random‐effects model) but there was no difference in the disease control rate (RR 1.06, 95% CI 0.91 to 1.22, P = 0.46, I2 = 82%, random‐effects model).
Gefitinib versus second‐line chemotherapy
Gefitinib as second‐line therapy did not result in a significant difference in overall response rate (RR 1.65, 95% CI 0.88 to 3.09, P = 0.12). Overall response rates were reported as 67% in the gefitinib group and 46% in the chemotherapy group.
3. Gefitinib at a specific dose versus gefitinib at a different dose
Survival
See Analysis 7.1.
Two multicentre, randomised, double‐blind, phase II studies evaluated differing doses of gefitinib (250 mg and 500 mg) in the second‐line setting (Fukuoka 2003 IDEAL I; Kris 2003 IDEAL II). There was no significant effect on one‐year survival (RR 0.83, 95% CI 0.61 to 1.11, P = 0.21, I2 = 0%). HRs were not available for meta‐analysis. Median overall survival ranged from 7 to 7.6 months in patients given 250 mg, and 6 to 8 months in those given 500 mg of gefitinib. Median progression‐free survival ranged from 2.7 to 7 months and from 2.8 to 6 months in patients given 250 mg and 500 mg, respectively.
One study examined the effect of a higher dose of gefitinib in patients that had been stable after one month of 250 mg/day dosing of gefitinib (Xue 2015). In this study, there was no difference in progression‐free or overall survival with a higher dose of gefitinib (500 mg/day versus 250 mg/day: median progression‐free survival 5.30 months versus 6.23 months, P = 0.167; median overall survival 13.70 months versus 18.87 months, P = 0.156).
Toxicity
See Analysis 7.2; Analysis 7.3; Analysis 7.4; Analysis 7.5; Analysis 7.6; Analysis 7.7; Analysis 7.8; Analysis 7.9.
Data from all three studies were available for pooling (Fukuoka 2003 IDEAL I; Kris 2003 IDEAL II; Xue 2015). A gefitinib dose of 500 mg had a marginally worse toxicity profile when compared with the lower dose of 250 mg. This higher dose was associated with an increased rate of diarrhoea (RR 8.36, 95% CI 1.58 to 44.34, P = 0.01, I2 = 0%) and skin rash (RR 8.13, 95% CI 1.51 to 43.72, P = 0.01, I2 = 0%). Other reported side effects such as pruritus, acne, vomiting, anorexia, asthenia, neutropenia, leukopenia and dyspnoea were not significantly different between doses.
Efficacy
See Analysis 7.10; Analysis 7.11.
Pooled analysis of two studies found no significant difference in overall response rate (RR 0.92, 95% CI 0.58 to 1.46, P = 0.72, I2 = 0%) between doses (Fukuoka 2003 IDEAL I; Kris 2003 IDEAL II). Overall response rates in the 250mg arm were reported as 18% and 12% in the IDEAL I and IDEAL II trials respectively, compared with ORR rates of 19% and 9% respectively, in patients receiving 500mg of gefitinib. Complete and partial response rates were only reported individually in the IDEAL I paper, and were 10% and 18.1%, respectively.
A higher dose of gefitinib as maintenance treatment did not improve the overall response rate (12.5% versus 12.5%, P = 1) (Xue 2015).
Quality of life and symptom improvement scores
See Analysis 7.12; Analysis 7.13.
Two studies reported changes in quality of life and symptom improvement scores (Fukuoka 2003 IDEAL I; Kris 2003 IDEAL II).
Quality of life improvements were also measured using the Trial Outcome Index (TOI), a summary score of the physical and functional domains of FACT‐L and the lung cancer subscale (a validated subscale of the FACT‐L questionnaire). No statistically significant difference was found between 250 mg and 500 mg of gefitinib in the rate of change of the FACT‐L and TOI scales (SMD 3.70, 95% CI ‐7.28 to 14.69; P = 0.51, I2 = 0% and SMD 7.38, 95% CI ‐2.30 to 17.05; P = 0.14, I2 = 0%, respectively). Unfortunately, extractable data from the published papers were inconsistently reported and thus not all data were pooled for analysis.
Data from the IDEAL II study further correlated symptom improvement with objective response and survival. When given a dose of 250 mg of gefitinib, all patients who experienced a partial response also experienced symptom improvement. Patients with stable or progressive disease who experienced symptom improvement also had a longer median survival time compared to those in the same tumour progression category without symptom improvement.
Subgroup analysis
Both studies performed subgroup analyses.
Fukuoka 2003 IDEAL I found that the objective tumour response rate was higher for Japanese patients versus non‐Japanese patients (27.5% versus 10.4%; odds ratio (OR) 3.27; P = 0.0023). A planned subgroup multivariate analysis revealed seven factors that predicted response in Japanese patients: baseline lung cancer subscale, body mass index, performance status, prior radiotherapy, histology, prior immuno/hormonal therapy and gender. After accounting for all the baseline imbalances, the odds ratio indicated that Japanese patients had response rates 1.64 times that of non‐Japanese patients, but this was not considered statistically significant.
Kris 2003 IDEAL II reported observation of symptom improvement and radiographic responses in all patient subgroups. Multivariate analysis identified female gender to be predictive of both symptom improvement and radiographic responses.
Symptom improvement was rapid, with a median time to onset of less than two weeks: 10 days in the 250 mg group (95% CI 8 to 22 days) and 9 days (95% CI 9 to 16 days) in the 500 mg group.
It was also reported that patients receiving third‐, fourth‐ and fifth‐line and above therapy had similar rates of symptom improvement both for 250 mg and 500 mg doses of gefitinib. Post‐hoc analysis showed that RRs for symptom improvement for the subgroup of patients who had previously received a platinum and taxane were 24% at 250 mg and 28% at 500 mg and for patients who had previously received platinum and docetaxel, 24% and 26% for the 250 mg and 500 mg groups, respectively.
4. Gefitinib versus gefitinib plus chemotherapy
Survival
See Analysis 8.1; Analysis 8.2; Analysis 8.3.
In the first‐line setting, two studies compared gefitinib alone with gefitinib plus pemetrexed (An 2016; Cheng 2016). One study reported no difference in median survival between the gefitinib and gefitinib plus chemotherapy group (32 months versus 34 months respectively) (An 2016). The other study did not present survival data (Cheng 2016). There was, however, a statistically significant improvement in progression‐free survival in favour of gefitinib plus chemotherapy over gefitinib alone (HR 0.69, 95% CI 0.49 to 0.96; P = 0.03; median progression‐free survival 12.6 months versus 18.3 months) (Cheng 2016).
In the second‐line or greater setting, median overall survival improved from 13.3 months (Chen 2007) and 18.3 months (Chen 2011) to 23.4 months and 23.6 months, respectively. This improvement was not statistically significant. Combining gefitinib with either vinorelbine or tegafur/uracil did not improve the one‐year survival rate (RR 1.15, 95% CI 0.92 to 1.43; P = 0.22; I2 = 43%). Gefitinib plus chemotherapy improved one‐year progression‐free survival (RR 2.29, 95% CI 1.38 to 3.80; P = 0.001). However, the HR for progression‐free survival was only presented in Chen 2011 (HR 0.65, 95% CI 0.43 to 0.97; P = 0.04: median progression‐free survival improved from 7.1 months (Chen 2007) and 5.3 months (Chen 2011) to 12.8 months and 8.3 months, respectively).
Toxicity
See Analysis 8.4; Analysis 8.5; Analysis 8.6; Analysis 8.7; Analysis 8.8; Analysis 8.9; Analysis 8.10; Analysis 8.11; Analysis 8.12; Analysis 8.13; Analysis 8.14; Analysis 8.15.
We pooled toxicity data from three studies (An 2016; Chen 2007; Cheng 2016). Both regimens were well tolerated with no significant difference in rates of skin rash, diarrhoea, constipation, fatigue, blood counts, nausea or vomiting.
Pooled data from both first‐line studies did show that the addition of pemetrexed chemotherapy to gefitinib resulted in higher rates of raised ALT (RR 2.57, 95% CI 1.09 to 6.04; P = 0.03; I2 = 63%) but not AST (RR 1.47, 95% CI 0.56 to 3.88; P = 0.44; I2 = 0%).
Efficacy
See Analysis 8.16; Analysis 8.17; Analysis 8.18.
When comparing gefitinib alone to gefitinib plus chemotherapy as first‐line therapy, there was no improvement in overall response rate (RR 1.02, 95% CI 0.89 to 1.17; P = 0.73; I2 = 26%) or rate of stable disease (RR 0.67, 95% CI 0.39 to 1.16; P = 0.16; I2 = 0%).
In the second‐line setting, the addition of chemotherapy to gefitinib did not result in an improvement in either partial radiological response (RR 1.02, 95% CI 0.71 to 1.47; P = 0.92; I2 = 0%) or stable disease (RR 1.30, 95% CI 0.84 to 2.03; P = 0.24; I2 = 16%).
5. Gefitinib plus chemotherapy versus chemotherapy
Survival
See Analysis 9.1; Analysis 9.2; Analysis 9.3.
Meta‐analysis of two phase II, first‐line trials examining 1411 patients showed that the addition of gefitinib (250 mg/day) to a chemotherapy regimen in chemotherapy‐naive patients did not change the one‐year survival rate (RR 0.95, 95% CI 0.84 to 1.08, P = 0.44, I2 = 0%) (Giaccone 2004 INTACT I; Herbst 2004 INTACT II).
Two trials compared the addition of first‐line gefitinib to chemotherapy with chemotherapy alone in Asian patients only (Takeda 2010 WJTOG0203; Yu 2014). There was no improvement in overall survival (HR 0.86, 95% CI 0.72 to 1.02, P = 0.08, I2 = 0%), however there was a statistically significant improvement in progression‐free survival (HR 0.69, 95% CI 0.62 to 0.77, P < 0.00001, I2 = 18%).
A single phase III trial recruited only EGFR mutation positive patients who had failed prior first‐line gefitinib, and the addition of gefitinib to chemotherapy did not improve progression‐free survival (HR 0.86, 95% CI 0.65 to 1.13, P = 0.28) (Soria 2015 IMPRESS). Overall survival appeared to be better in the chemotherapy alone group (HR 1.62, 95% CI 1.05 to 2.50, P = 0.03).
Toxicity
See Analysis 9.4; Analysis 9.5; Analysis 9.6.
Pooled data from all five trials showed that the addition of gefitinib to a chemotherapeutic regimen resulted in increased rates of skin rash (RR 2.98, 95% CI 1.54 to 5.77, P = 0.001, I2 = 28%), acne (RR 4.95, 95% CI 1.09 to 22.51, P = 0.04, I2 = 0%) and diarrhoea (RR 2.04, 95% CI 1.17 to 3.58, P = 0.01, I2 = 17%). Other measured side effects such as pruritus, vomiting, nausea, anorexia, asthenia, dyspnoea, anaemia, neutropenia and leukopenia were not significantly increased.
Efficacy
See Analysis 9.16.
In the first‐line setting, the addition of gefitinib to chemotherapy did not effect the overall response rate in either the unselected population (RR 1.07, 95% CI 0.94 to 1.22, P = 0.28, I2 = 0%) or the Asian population (RR 1.14, 95% CI 0.93 to 1.40, P = 0.20, I2 = 0%). The overall response rate ranged from 30% to 51% in the gefitinib plus chemotherapy group and 29% to 50% in the chemotherapy group.
There was also no improvement in the overall response rate in the second‐line setting (RR 0.93, 95% CI 0.66 to 1.31, P = 0.66, I2 = 0%), and the overall response rate was 32% in the gefitinib plus chemotherapy group and 34% in the chemotherapy alone group.
Quality of life and symptom improvement scores
In the first‐line setting, the WJTOG0203 study reported a disease‐related symptoms assessment (Takeda 2010 WJTOG0203). Sequential administration of gefitinib was reported to provide better symptom control, however these differences were not statistically significant. The adjusted mean of initial summed scores of the lung cancer subscale were 20.3 for Arm A and 20.6 for Arm B. The adjusted lung cancer subscale scores at 12 and 18 weeks were 21 and 20.9 for Arm A and 21.8 and 21.2 for Arm B, respectively.
In the second‐line setting, the IMPRESS study reported that the improvements in quality of life were no different when gefitinib plus chemotherapy was compared to placebo plus chemotherapy as measured by the Trial Outcome Index (TOI) (29% versus 30.2%, respectively), FACT‐L (35.5% versus 38%, respectively) or lung cancer subscale (43.5% versus 42.6%, respectively) (Soria 2015 IMPRESS). There was also no difference in the time to worsening of health‐related quality of life as measured by the TOI, FACT‐L and lung cancer subscale.
These data could not be pooled for meta‐analysis.
Subgroup analysis
A planned exploratory subgroup analysis in Japanese patients of overall survival by histological group reported that patients with adenocarcinoma that were given sequential gefitinib had better outcomes than patients given chemotherapy alone (n = 467; progression‐free survival: HR 0.79, 95% CI 0.65 to 0.98, P = 0.03; overall survival: HR 0.60, 95% CI 0.50 to 0.73, P < 0.001) (Takeda 2010 WJTOG0203). There was no difference in overall survival or progression‐free survival in those with non‐adenocarcinoma (overall survival: HR 1.24, 95% CI 0.85 to 1.79, P = 0.25 and progression‐free survival: HR 1.14, 95% CI 0.80 to 1.62, P = 0.47). This study also reported that smokers also experienced improved survival with sequential gefitinib (HR 0.79, 95% CI 0.64 to 0.98), as opposed to non‐smokers (HR 0.94, 95% CI 0.66 to 1.33), however P values were not published.
Discussion
This meta‐analysis examined published data on the effectiveness and safety of gefitinib in patients with non‐small cell lung cancer (NSCLC). We performed an extensive search of electronic databases and carried out handsearching, and 35 randomised studies fulfilled the inclusion criteria. Some were phase II, open‐label design trials and limited pooling of data was possible due to methodological differences between studies.
Summary of main results
A total of 35 studies were included in this review.
Five studies compared gefitinib with placebo: one study in the first‐line, one study in the second‐line and three studies in the maintenance setting. Gefitinib did not improve survival in the first‐line setting in a general population of NSCLC patients. The ISEL study found that gefitinib as a second‐line therapy was able to reduce the risk of disease progression by 18%, and improve the objective response rate from 1% to 6% when compared to placebo (Thatcher 2005 ISEL). Three studies compared gefitinib with placebo in the maintenance setting. Gefitinib reduced the risk of disease progression by 31%.
In patients of Asian ethnicity, preplanned subgroup analysis in the ISEL study found that second‐line gefitinib improved overall and progression‐free survival by 34% and 31%, respectively (Chang 2006). The INFORM study compared gefitinib with placebo in the maintenance setting and selected patients of Asian ethnicity (Zhang 2012 INFORM). This study found that gefitinib prolonged progression‐free survival by 58% and the overall response rate improved from 1% to 24%. Quality of life analysis from the INFORM study also showed that improvement rates as measured by the Functional Assessment of Cancer Therapy‐Lung (FACT‐L), Trial Outcome Index (TOI) and lung cancer subscale were higher in the patients who were given gefitinib as maintenance therapy. These patients also experienced a longer time‐to‐worsening of quality of life scores.
In patients positive for an epidermal growth factor receptor (EGFR) mutation, subgroup analysis of the INFORM study showed an improvement in median overall survival from 21 months to 47 months and maintenance gefitinib reduced the risk of death by 61% (Zhang 2012 INFORM). Maintenance gefitinib also improved progression‐free survival from 2.8 months to 16.6 months.
Several phase II and III studies compared gefitinib with chemotherapy. Eighteen randomised studies have examined the effectiveness of gefitinib compared with recommended chemotherapy regimes. Meta‐analysis of four studies failed to demonstrate any benefit for survival or response rate in a general population (moderate quality of evidence). (Please refer to summary of findings Table for the main comparison and summary of findings Table 2). Quality of life was significantly better for patients on gefitinib than for those having chemotherapy, and gefitinib was significantly less toxic and generally well tolerated when compared with chemotherapy (high quality of evidence), in keeping with results from other studies. Skin rash, diarrhoea and increased liver transaminases were more frequent in the gefitinib group, but other significant side effects such as neutropenia, anaemia, leukopenia and febrile neutropenia were less frequent. (Please refer to summary of findings Table 3).
Fourteen trials included patients exclusively of Asian ethnicity, with some additionally selecting by EGFR mutation status or clinical criteria that are likely to have enriched EGFR mutations. Gefitinib improved the overall response rate by 43% and progression‐free survival by 35% when compared with first‐line chemotherapy, but this did not translate into an improvement in overall survival. Comparing gefitinib with second‐line chemotherapy found that progression‐free survival was improved by 29%, but there was no effect on overall survival or overall response rate. The effect of Asian ethnicity is complicated, and may be confounded by higher rates of EGFR mutation and the biologically plausible predictive biomarker characteristic of EGFR mutations. Two trials compared maintenance gefitinib with maintenance chemotherapy. There was no difference in either progression‐free survival or overall survival, but gefitinib was able to improve the one‐year survival rate by 21% and the disease control rate by 35%. Skin rash, diarrhoea and elevated liver transaminases were more common in those treated with gefitinib, however severe adverse side effects such as haematological derangements, neurotoxicity, nausea, anorexia, fatigue and arthralgia were much more common in the chemotherapy group.
Eight studies either selected patients with tumours expressing EGFR mutations for comparison or conducted subgroup analyses in these patients. Use of gefitinib in the first‐line setting improved progression‐free survival over platinum‐doublet chemotherapy. Studies that selected patients with EGFR mutations exclusively were able to show a 61% improvement in progression‐free survival over first‐line chemotherapy. Two studies recruited patients with clinical features likely to respond favourably to gefitinib, and showed a 51% improvement in progression‐free survival after subgroup analysis of EGFR mutation positive patients. Gefitinib also improved the overall response rate by 73% over first‐line chemotherapy. However, none were able to demonstrate an improvement in overall survival, arguably due to high rates of cross‐over. When comparing gefitinib with second‐line chemotherapy, a similar improvement in progression‐free survival of 76% was seen. There was no impact on overall survival or overall response rate.
Increasing the dose of gefitinib from 250 mg/day to 500 mg/day yielded no additional benefit in survival or response rate in three phase II trials. This increased dose, however, was associated with greater toxicity.
Two phase II studies compared pemetrexed plus gefitinib with gefitinib alone as first‐line treatment. Progression‐free survival was improved by 31% with a median improvement from 12.6 months to 18.3 months. There were, however, increased rates of raised ALT in this treatment arm. All other toxicities were similar. The two studies comparing gefitinib plus chemotherapy with gefitinib alone in the second‐line setting showed improved one‐year progression‐free survival when chemotherapy was added to gefitinib.
Five studies showed that the addition of gefitinib to a chemotherapy regimen compared to chemotherapy alone did not confer any survival benefit. In patients of Asian ethnicity, two studies showed that first‐line gefitinib plus chemotherapy improved progression‐free survival by 31% compared to chemotherapy alone. One phase III study compared gefitinib plus chemotherapy to chemotherapy alone and found that survival was improved in favour of chemotherapy alone. All patients in this study were EGFR mutation positive, but had failed prior first‐line therapy with gefitinib.
A summary of the efficacy results is presented in Table 2.
Overall completeness and applicability of evidence
Much of the data analysed in this review has predated the routine assessment of EGFR mutation status in NSCLC. This testing is now done routinely in many countries before starting treatment, and the status of EGFR mutation now guides the therapeutic options. Gefitinib has already been registered in occidental countries for treatment of NSCLC with EGFR activating mutations. The treatment options for patients with advanced NSCLC continue to evolve rapidly and although some of the data in this review may be considered historical, it still provides a foundation upon which ongoing studies examining the relationship between the effectiveness of gefitinib and the timing of its use with other treatment modalities can be built.
The inclusion criteria for selecting patients for these studies may have adversely affected their ability to provide statistically significant results. For example, some studies selected patients with highly refractory disease who may have been less likely to respond to any additional therapy. Some studies selected chemotherapy‐naive patients for inclusion (Giaccone 2004 INTACT I; Herbst 2004 INTACT II), whereas others included patients who had received at least one prior platinum‐containing chemotherapy regimen (Kris 2003 IDEAL II; Fukuoka 2003 IDEAL I). Thatcher 2005 ISEL selected patients who had recurrence or progressive disease during treatment or within 90 days of the last dose of chemotherapy.
In some studies, patients who progressed on a certain treatment were allowed the opportunity to switch to the comparison arm. This was reported in some studies (e.g. Mok 2009 IPASS) and in some data were censored accordingly (e.g. Mitsudomi 2010 WJTOG3405). The impact of this cross‐over is difficult to analyse and may contribute to a lack of survival benefit seen in these large phase III studies.
We analysed EGFR mutation positive patients in this review, finding that gefitinib improved progression‐free survival over first‐ and second‐line chemotherapy and over placebo in the maintenance setting. However, patients with EGFR wild type NSCLC were not formally included in this meta‐analysis. Studies such as Zhou 2014 CTONG 0806 were excluded from this meta‐analysis as they selected only EGFR wild type NSCLC. This study showed that second‐line pemetrexed chemotherapy was superior to gefitinib in terms of progression‐free survival but a trend towards improved overall survival was also seen. Thus, this highlights the importance of determining the EGFR mutation status in patients with advanced NSCLC, as this result will guide further management decisions.
Patients with progressive NSCLC who have failed to respond to first‐line chemotherapy have an extremely poor prognosis and often exhibit severe symptoms. One difficulty with meta‐analyses of quality of life data is that outcomes are not consistently reported in the published papers, limiting the pooling of data. Some studies reported changes in FACT‐L and the lung cancer subscale that reached the pre‐defined criteria for clinical significance (Cella 2005; Kris 2003 IDEAL II), whereas others failed to show any improvement (Fukuoka 2003 IDEAL I; Thatcher 2005 ISEL). Cella 2005 reported a correlation between symptom improvement, objective response and survival, and found that 30% of patients showed a quality of life improvement that was correlated with tumour response. Kris 2003 IDEAL II reported that symptoms improved in 96% of patients with partial radiographic responses. Pre‐planned subgroup analysis in Thatcher 2005 ISEL found that gefitinib was associated with a significant improvement in symptom score compared with placebo in never‐smokers and patients of Asian origin.
Quality of the evidence
The 'Risk of bias' tables have enabled a methodical and thorough assessment of the quality of evidence. We included a total of 35 randomised controlled trials (RCTs) randomising 12,089 patients in this review. (Please refer to Figure 2). Trials included in this meta‐analysis generally had a low risk of selection and attrition bias. Unfortunately, differences in reporting of outcomes, such as survival times, and a lack of survival curves, meant that only extractable data could be included in the analyses. The duration of gefitinib treatment and duration of follow‐up may also have affected outcomes in these RCTs. Despite these limitations, the included RCTs were generally consistent with their findings.
For studies that compared gefitinib with first‐line chemotherapy, we judged the quality of evidence as moderate. One study enrolled elderly patients (over 70 years old) and thus we downgraded the quality of evidence as this may be at serious risk of indirectness (Crino 2008 INVITE). When comparing gefitinib with second‐line chemotherapy, we also judged the quality of evidence as moderate as one study was not statistically powered to detect differences in any endpoint and was thus at serious risk of imprecision (Cufer 2006 SIGN). When considering toxicity outcomes, generally the quality of data was high, except for fatigue, which we judged as moderate quality of evidence. We downgraded this outcome one level, as we judged one study as having a serious risk of indirectness for enrolling only patients over the age of 70 years old (Crino 2008 INVITE).
Agreements and disagreements with other studies or reviews
Two published meta‐analyses also examined the effect of gefitinib in NSCLC. The first by Ibrahim 2010 reported on seven studies that included chemotherapy‐naive patients (Crino 2008 INVITE; Giaccone 2004 INTACT I; Goss 2009 INSTEP; Herbst 2004 INTACT II; Kelly 2008 SWOG S0023; Mok 2009 IPASS; Takeda 2010 WJTOG0203), analysing a total of 2545 and 1939 patients in the gefitinib and control arms. The same seven studies also fulfilled the inclusion criteria for this review; however our review included a further 17 studies that analysed the use of gefitinib as second‐ or third‐line and maintenance therapy. The authors were not able to show any benefit in objective response rate, progression‐free survival or overall survival in this general population. In a small subset of patients with EGFR mutations, gefitinib was shown to significantly improve the overall response rate (odds ratio (OR) 2.81, 95% CI 1.71 to 4.62, P < 0.0001). This benefit was not associated with a progression‐free or overall survival advantage in that group. Only three of the included seven studies reported on quality of life, showing a measurable and statistically significant improvement as measured by FACT‐L.
The second meta‐analysis by Jiang 2011 compared gefitinib with docetaxel as second‐line therapy. Four studies were included, all of which were also included in this review (Cufer 2006 SIGN; Kim 2008 INTEREST; Lee 2010 ISTANA; Maruyama 2008 V‐15‐32). A total of 2247 patients received either gefitinib or docetaxel as second‐line therapy. Similar results were also found in this meta‐analysis. There was an improved overall response rate with gefitinib compared with docetaxel (risk ratio (RR) 1.58, 95% CI 1.02 to 2.45, P = 0.04) and quality of life as measured with the FACT‐L and TOI questionnaires (RR 1.55, 95% CI 1.27 to 1.88, P < 0.001; RR 1.86, 95% 1.43 to 2.42, P < 0.001, respectively). There was no benefit in overall survival or progression‐free survival.
Both of these systematic reviews reported results similar to those of this meta‐analysis.
Patients with tumours bearing EGFR mutations derive benefit from gefitinib treatment. It has been shown that in patients of Asian ethnicity with tumours with EGFR mutations, progression‐free survival and overall response rate were significantly improved by the use of gefitinib as first‐line therapy; however there was no effect on overall survival, perhaps because of cross‐over between study interventions.
An interaction between ethnicity, EGFR mutation status and other clinical features is likely to confound a straightforward analysis of factors predictive of a gefitinib response. Patients of Asian descent, who are non‐smokers or with adenocarcinoma histology are also more likely to have tumours harbouring EGFR mutations.
There is increasing evidence to justify the use of molecular markers in clinical practice and the EGFR mutation status appears to be a significant predictor of benefit in terms of progression‐free survival and response to gefitinib. Other markers of EGFR status such as EGFR protein expression and EGFR gene copy number appear to be related to EGFR mutations, but interpretation criteria still need to be established. Further research into optimal sampling, mutation testing methods and the precise spectrum of predictive EGFR mutations is required.

Study flow diagram for searches 1966‐2017.
(EGFR: epidermal growth factor receptor)

'Risk of bias' summary: review authors' judgements about each risk of bias item for each included study.
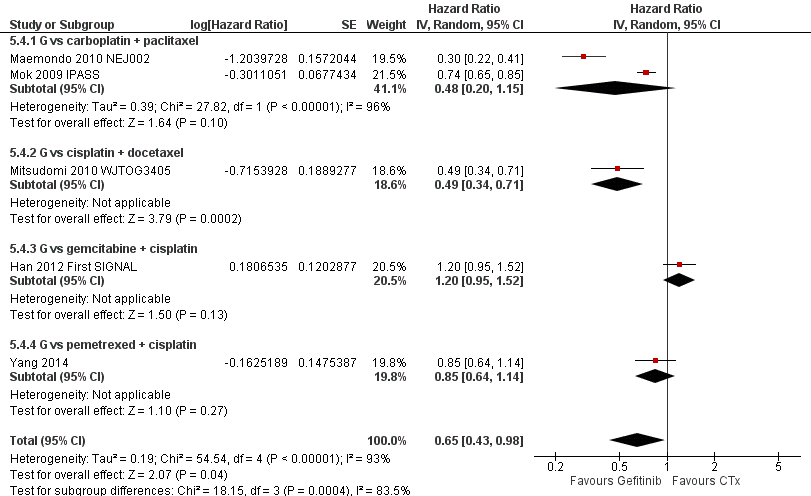
Progression‐free survival: Gefitinib versus first‐line chemotherapy in an Asian population (Analysis 5.4).

Progression‐free survival: Gefitinib versus second‐line chemotherapy in an Asian population (Analysis 5.5).

Progression‐free survival: Gefitinib versus first‐line chemotherapy in an EGFR mutation positive population (Analysis 6.3).

Progression‐free survival: Gefitinib versus second‐line chemotherapy in an EGFR mutation positive population (Analysis 6.4).
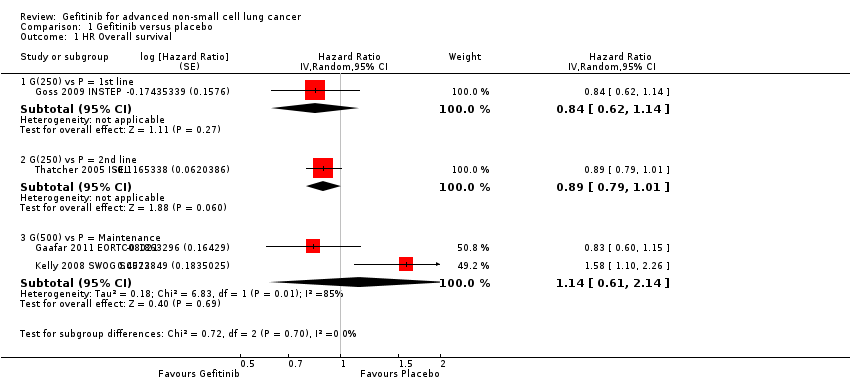
Comparison 1 Gefitinib versus placebo, Outcome 1 HR Overall survival.

Comparison 1 Gefitinib versus placebo, Outcome 2 HR Progression‐free survival.

Comparison 1 Gefitinib versus placebo, Outcome 3 1‐year survival rate.

Comparison 1 Gefitinib versus placebo, Outcome 4 Skin rash.

Comparison 1 Gefitinib versus placebo, Outcome 5 Pruritus.

Comparison 1 Gefitinib versus placebo, Outcome 6 Diarrhoea.

Comparison 1 Gefitinib versus placebo, Outcome 7 Constipation.

Comparison 1 Gefitinib versus placebo, Outcome 8 Nausea.

Comparison 1 Gefitinib versus placebo, Outcome 9 Vomiting.

Comparison 1 Gefitinib versus placebo, Outcome 10 Anorexia.

Comparison 1 Gefitinib versus placebo, Outcome 11 Fatigue.
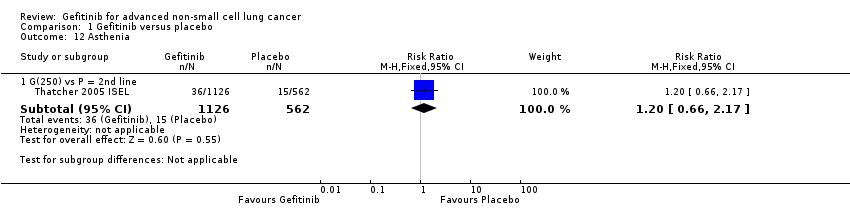
Comparison 1 Gefitinib versus placebo, Outcome 12 Asthenia.

Comparison 1 Gefitinib versus placebo, Outcome 13 Respiratory tract infection.

Comparison 1 Gefitinib versus placebo, Outcome 14 Dyspnoea.
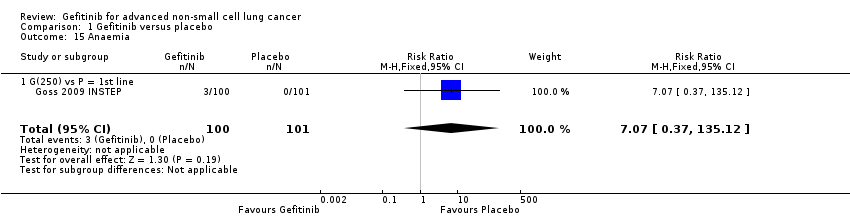
Comparison 1 Gefitinib versus placebo, Outcome 15 Anaemia.

Comparison 1 Gefitinib versus placebo, Outcome 16 Abdominal pain.

Comparison 1 Gefitinib versus placebo, Outcome 17 Increased ALT.

Comparison 1 Gefitinib versus placebo, Outcome 18 Increased AST.

Comparison 1 Gefitinib versus placebo, Outcome 19 Neutropenia.

Comparison 1 Gefitinib versus placebo, Outcome 20 Anaemia.

Comparison 1 Gefitinib versus placebo, Outcome 21 Thrombocytopaenia.

Comparison 1 Gefitinib versus placebo, Outcome 22 Overall response rate.

Comparison 1 Gefitinib versus placebo, Outcome 23 Disease control rate.

Comparison 2 Gefitinib versus placebo (Asian subgroup), Outcome 1 HR Overall survival.
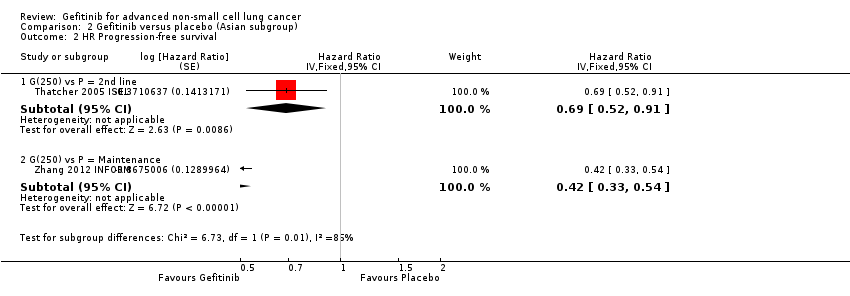
Comparison 2 Gefitinib versus placebo (Asian subgroup), Outcome 2 HR Progression‐free survival.
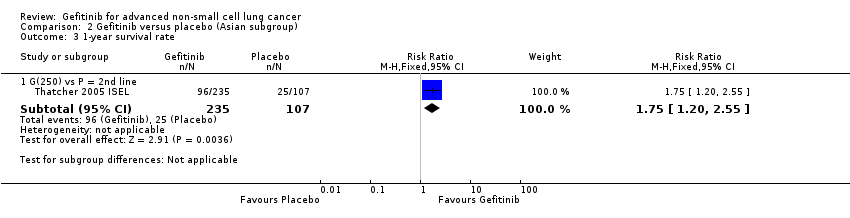
Comparison 2 Gefitinib versus placebo (Asian subgroup), Outcome 3 1‐year survival rate.

Comparison 2 Gefitinib versus placebo (Asian subgroup), Outcome 4 Overall response rate.
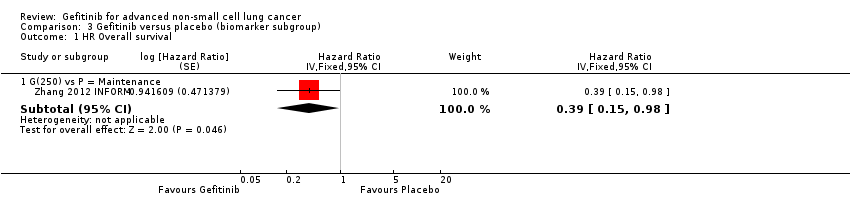
Comparison 3 Gefitinib versus placebo (biomarker subgroup), Outcome 1 HR Overall survival.

Comparison 3 Gefitinib versus placebo (biomarker subgroup), Outcome 2 HR Progression‐free survival.

Comparison 4 Gefitinib versus chemotherapy, Outcome 1 HR Overall survival.

Comparison 4 Gefitinib versus chemotherapy, Outcome 2 HR Progression‐free survival.
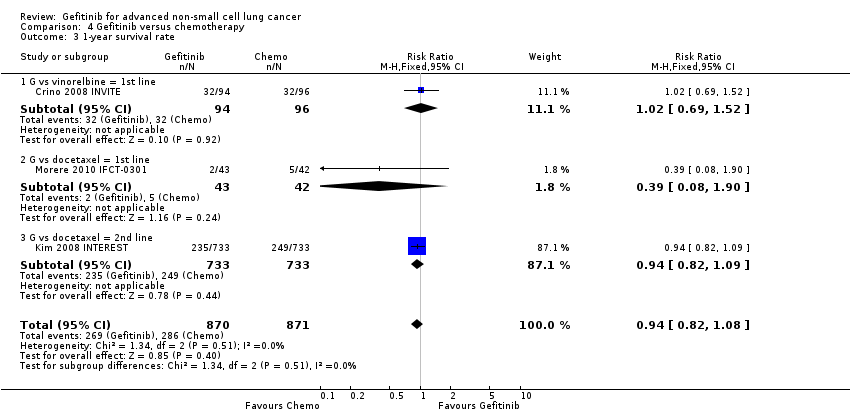
Comparison 4 Gefitinib versus chemotherapy, Outcome 3 1‐year survival rate.

Comparison 4 Gefitinib versus chemotherapy, Outcome 4 Skin rash.
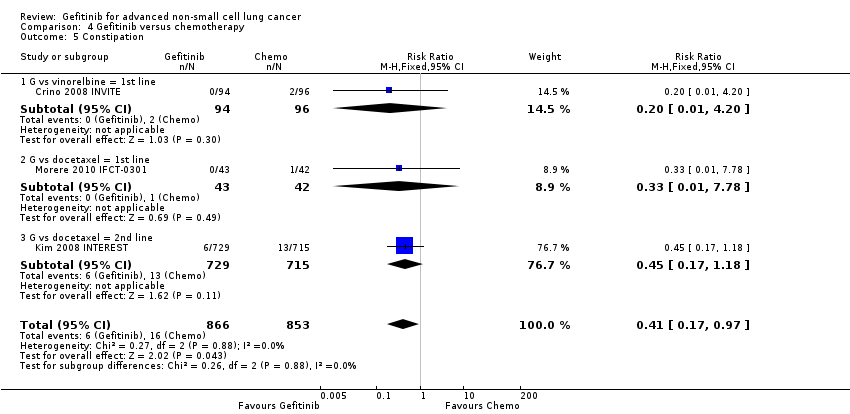
Comparison 4 Gefitinib versus chemotherapy, Outcome 5 Constipation.

Comparison 4 Gefitinib versus chemotherapy, Outcome 6 Fatigue.

Comparison 4 Gefitinib versus chemotherapy, Outcome 7 Asthenia.
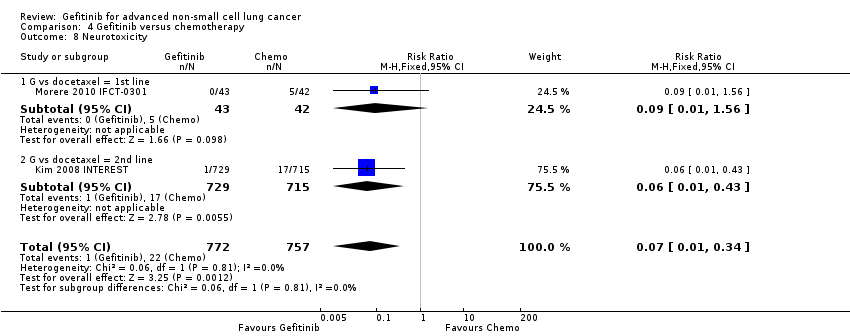
Comparison 4 Gefitinib versus chemotherapy, Outcome 8 Neurotoxicity.

Comparison 4 Gefitinib versus chemotherapy, Outcome 9 Neutropenia.

Comparison 4 Gefitinib versus chemotherapy, Outcome 10 Leukopenia.

Comparison 4 Gefitinib versus chemotherapy, Outcome 11 Febrile neutropenia.

Comparison 4 Gefitinib versus chemotherapy, Outcome 12 Pruritus.
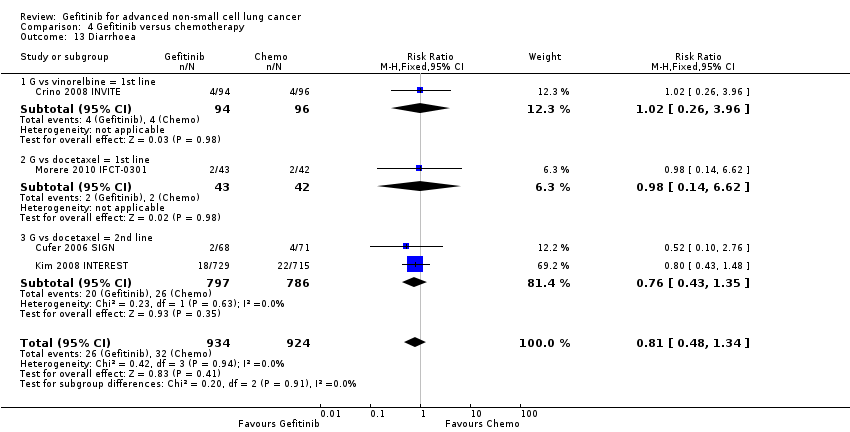
Comparison 4 Gefitinib versus chemotherapy, Outcome 13 Diarrhoea.
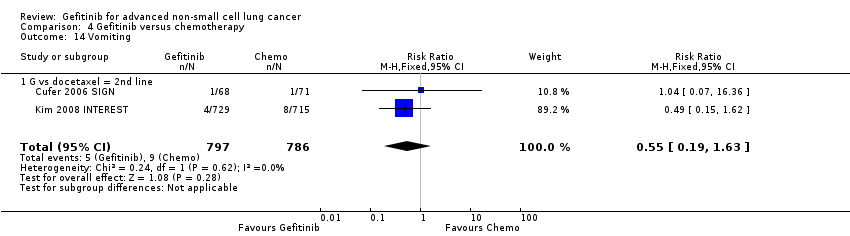
Comparison 4 Gefitinib versus chemotherapy, Outcome 14 Vomiting.
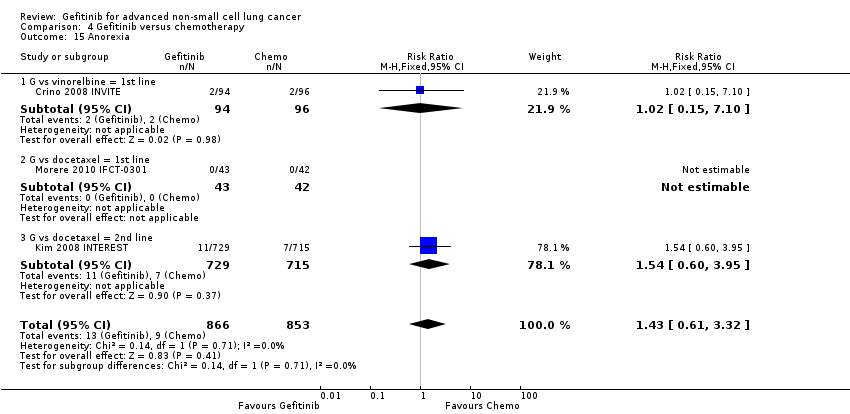
Comparison 4 Gefitinib versus chemotherapy, Outcome 15 Anorexia.
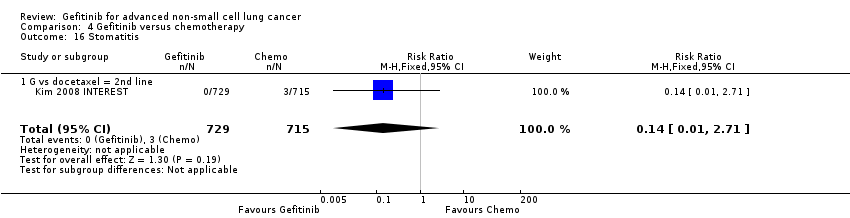
Comparison 4 Gefitinib versus chemotherapy, Outcome 16 Stomatitis.

Comparison 4 Gefitinib versus chemotherapy, Outcome 17 Arthralgia/myalgia.
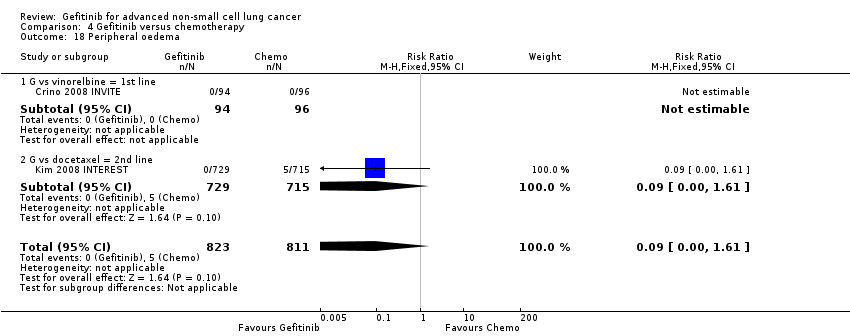
Comparison 4 Gefitinib versus chemotherapy, Outcome 18 Peripheral oedema.

Comparison 4 Gefitinib versus chemotherapy, Outcome 19 Respiratory tract infection.

Comparison 4 Gefitinib versus chemotherapy, Outcome 20 Dyspnoea.

Comparison 4 Gefitinib versus chemotherapy, Outcome 21 Cough.

Comparison 4 Gefitinib versus chemotherapy, Outcome 22 Anaemia.

Comparison 4 Gefitinib versus chemotherapy, Outcome 23 Thrombocytopenia.
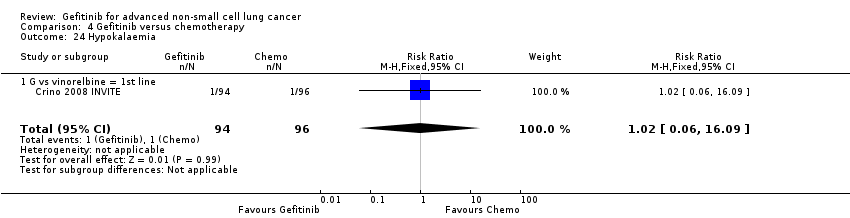
Comparison 4 Gefitinib versus chemotherapy, Outcome 24 Hypokalaemia.

Comparison 4 Gefitinib versus chemotherapy, Outcome 25 Pyrexia.
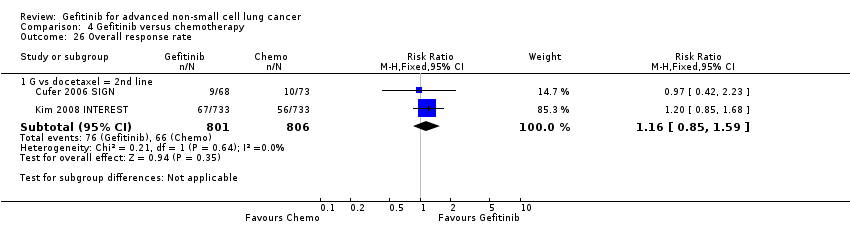
Comparison 4 Gefitinib versus chemotherapy, Outcome 26 Overall response rate.

Comparison 4 Gefitinib versus chemotherapy, Outcome 27 Disease control rate.
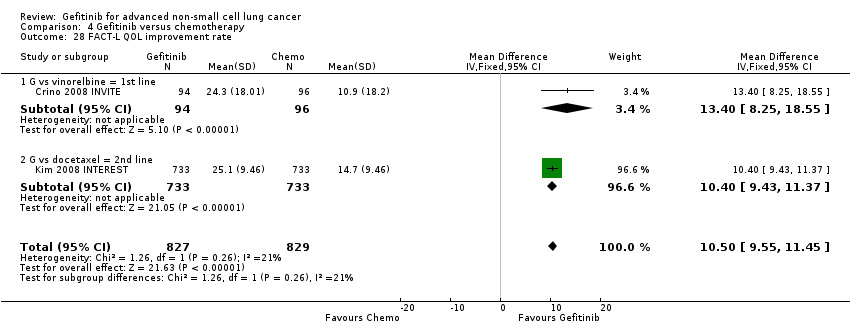
Comparison 4 Gefitinib versus chemotherapy, Outcome 28 FACT‐L QOL improvement rate.

Comparison 4 Gefitinib versus chemotherapy, Outcome 29 LCS QOL improvement rate.

Comparison 4 Gefitinib versus chemotherapy, Outcome 30 TOI QOL improvement rate.

Comparison 4 Gefitinib versus chemotherapy, Outcome 31 PSI QOL improvement rate.

Comparison 5 Gefitinib versus chemotherapy (Asian subgroup), Outcome 1 HR Overall survival = 1st line.

Comparison 5 Gefitinib versus chemotherapy (Asian subgroup), Outcome 2 HR Overall survival = 2nd line.

Comparison 5 Gefitinib versus chemotherapy (Asian subgroup), Outcome 3 HR Overall survival = Maintenance.

Comparison 5 Gefitinib versus chemotherapy (Asian subgroup), Outcome 4 HR Progression‐free survival = 1st line.
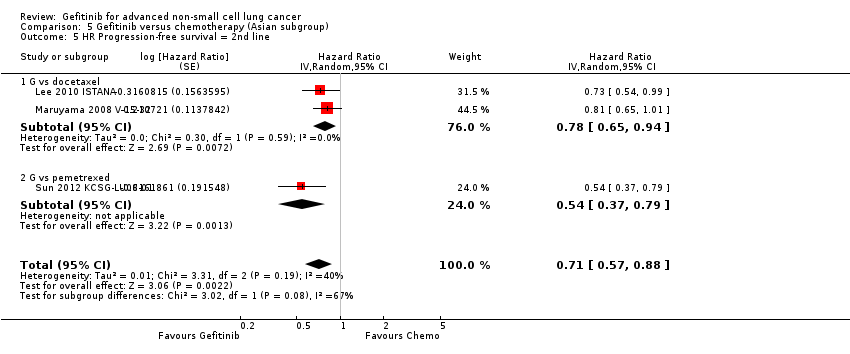
Comparison 5 Gefitinib versus chemotherapy (Asian subgroup), Outcome 5 HR Progression‐free survival = 2nd line.

Comparison 5 Gefitinib versus chemotherapy (Asian subgroup), Outcome 6 HR Progression‐free survival = Maintenance.

Comparison 5 Gefitinib versus chemotherapy (Asian subgroup), Outcome 7 1‐year survival rate.

Comparison 5 Gefitinib versus chemotherapy (Asian subgroup), Outcome 8 Nausea.

Comparison 5 Gefitinib versus chemotherapy (Asian subgroup), Outcome 9 Vomiting.

Comparison 5 Gefitinib versus chemotherapy (Asian subgroup), Outcome 10 Anorexia.

Comparison 5 Gefitinib versus chemotherapy (Asian subgroup), Outcome 11 Fatigue.

Comparison 5 Gefitinib versus chemotherapy (Asian subgroup), Outcome 12 Arthralgia/myalgia.

Comparison 5 Gefitinib versus chemotherapy (Asian subgroup), Outcome 13 Asthenia.

Comparison 5 Gefitinib versus chemotherapy (Asian subgroup), Outcome 14 Neurotoxicity.

Comparison 5 Gefitinib versus chemotherapy (Asian subgroup), Outcome 15 Neutropenia.

Comparison 5 Gefitinib versus chemotherapy (Asian subgroup), Outcome 16 Anaemia.
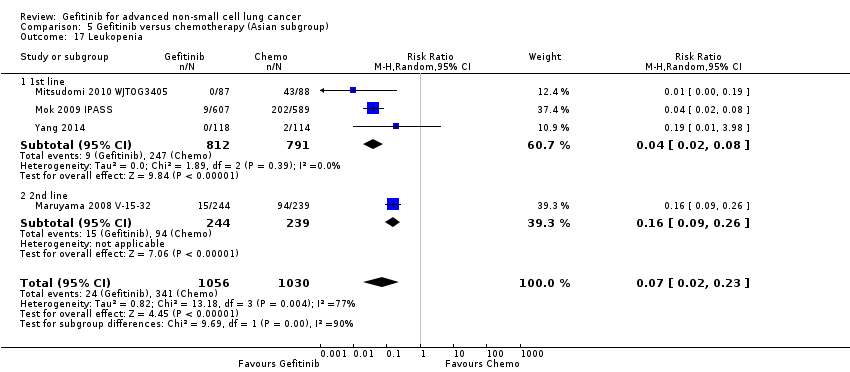
Comparison 5 Gefitinib versus chemotherapy (Asian subgroup), Outcome 17 Leukopenia.

Comparison 5 Gefitinib versus chemotherapy (Asian subgroup), Outcome 18 Thrombocytopenia.
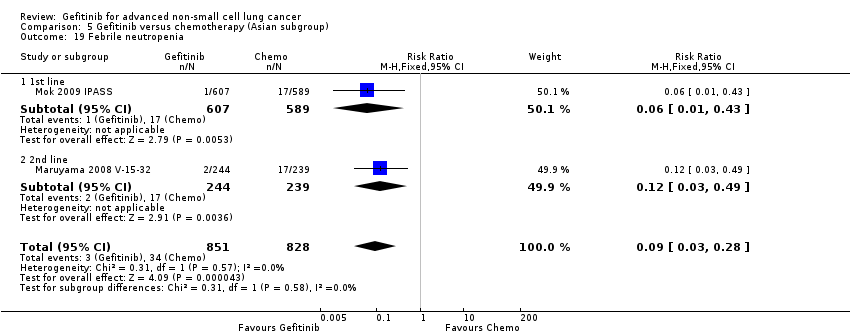
Comparison 5 Gefitinib versus chemotherapy (Asian subgroup), Outcome 19 Febrile neutropenia.

Comparison 5 Gefitinib versus chemotherapy (Asian subgroup), Outcome 20 Skin rash.
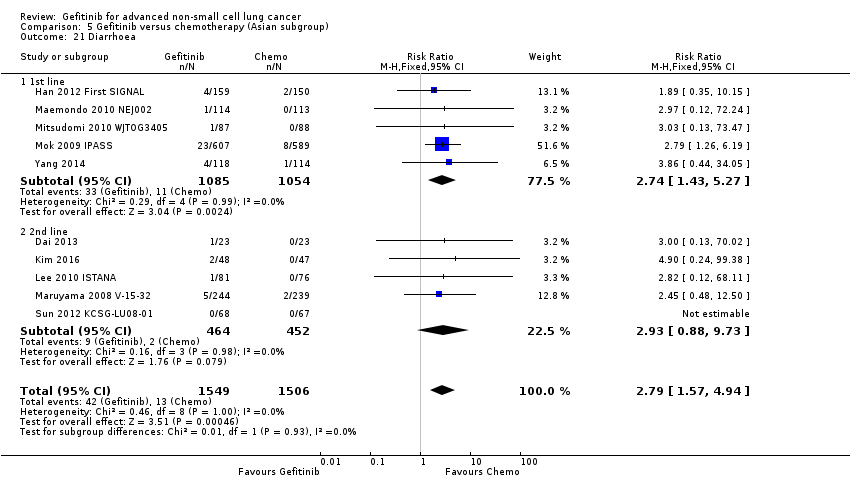
Comparison 5 Gefitinib versus chemotherapy (Asian subgroup), Outcome 21 Diarrhoea.

Comparison 5 Gefitinib versus chemotherapy (Asian subgroup), Outcome 22 Increased ALT.

Comparison 5 Gefitinib versus chemotherapy (Asian subgroup), Outcome 23 Increased AST.

Comparison 5 Gefitinib versus chemotherapy (Asian subgroup), Outcome 24 Overall response rate.
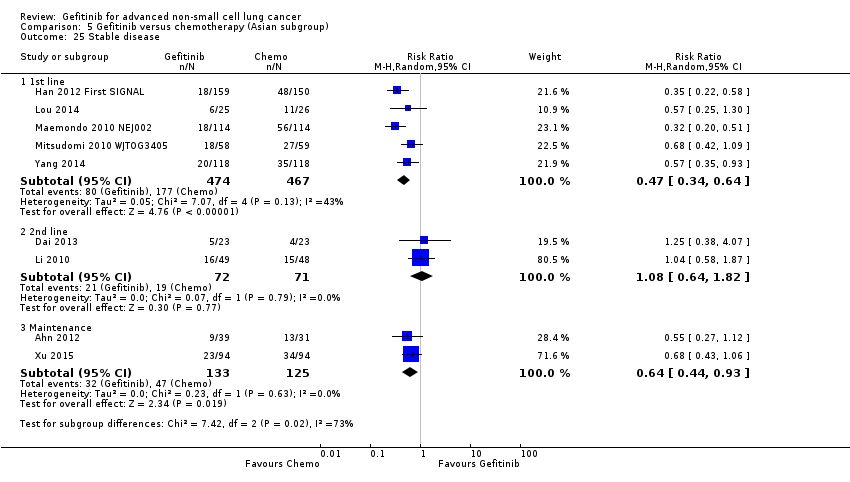
Comparison 5 Gefitinib versus chemotherapy (Asian subgroup), Outcome 25 Stable disease.

Comparison 5 Gefitinib versus chemotherapy (Asian subgroup), Outcome 26 Disease control rate.

Comparison 5 Gefitinib versus chemotherapy (Asian subgroup), Outcome 27 FACT‐L QOL improvement rate.

Comparison 5 Gefitinib versus chemotherapy (Asian subgroup), Outcome 28 LCS QOL improvement rate.
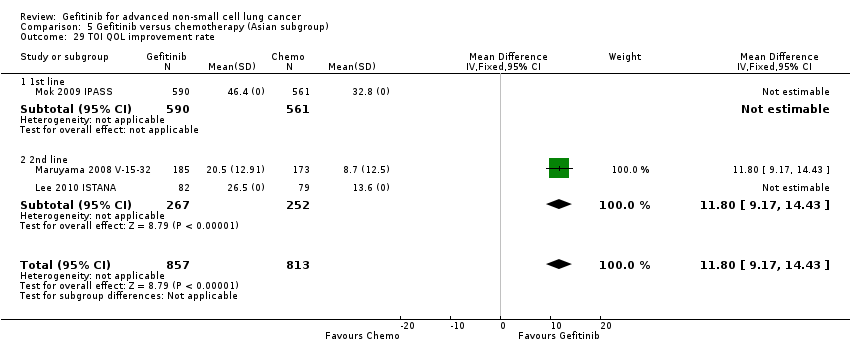
Comparison 5 Gefitinib versus chemotherapy (Asian subgroup), Outcome 29 TOI QOL improvement rate.

Comparison 6 Gefitinib versus chemotherapy (EGFR mutation), Outcome 1 HR Overall survival = 1st line.
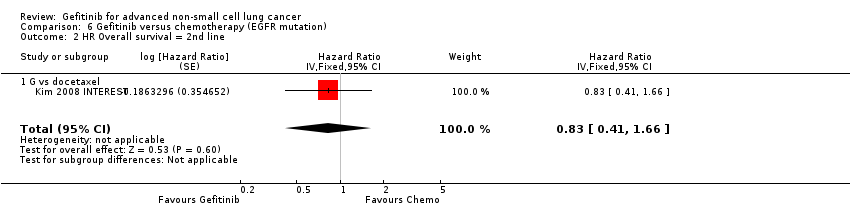
Comparison 6 Gefitinib versus chemotherapy (EGFR mutation), Outcome 2 HR Overall survival = 2nd line.
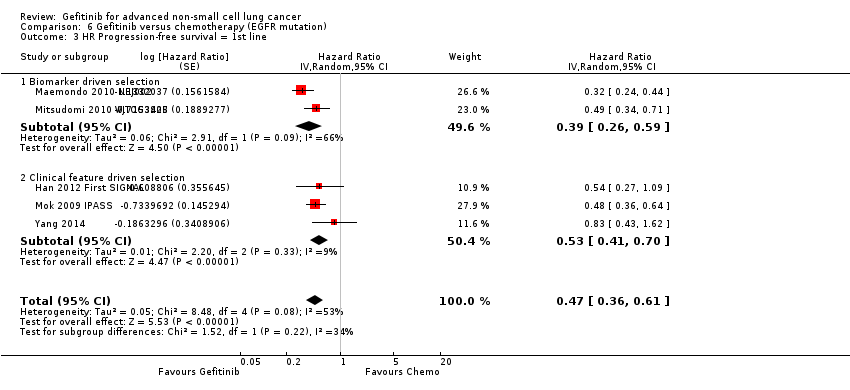
Comparison 6 Gefitinib versus chemotherapy (EGFR mutation), Outcome 3 HR Progression‐free survival = 1st line.
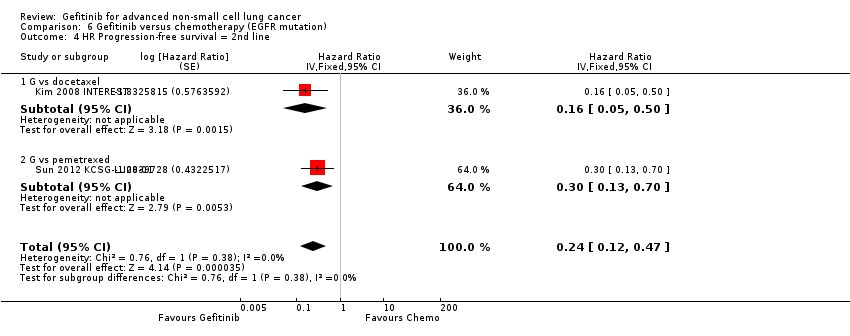
Comparison 6 Gefitinib versus chemotherapy (EGFR mutation), Outcome 4 HR Progression‐free survival = 2nd line.
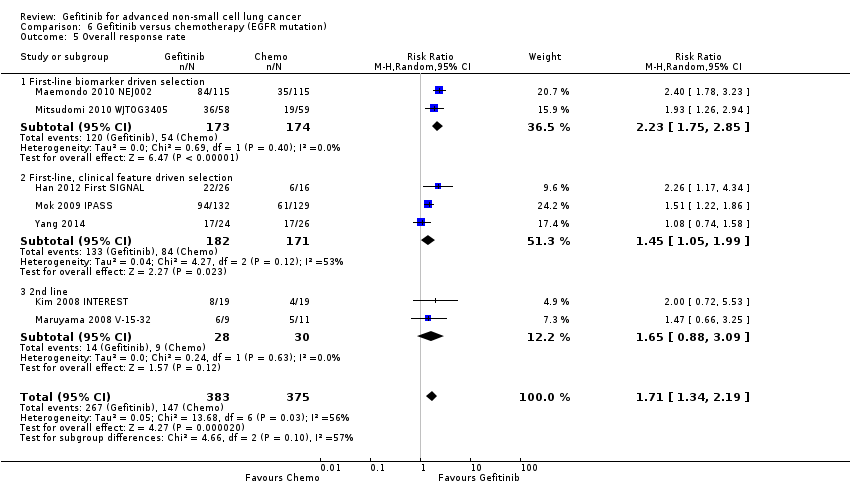
Comparison 6 Gefitinib versus chemotherapy (EGFR mutation), Outcome 5 Overall response rate.
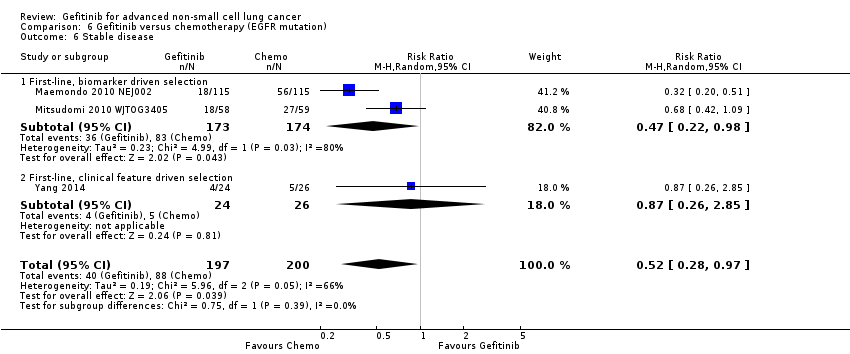
Comparison 6 Gefitinib versus chemotherapy (EGFR mutation), Outcome 6 Stable disease.

Comparison 6 Gefitinib versus chemotherapy (EGFR mutation), Outcome 7 Disease control rate.
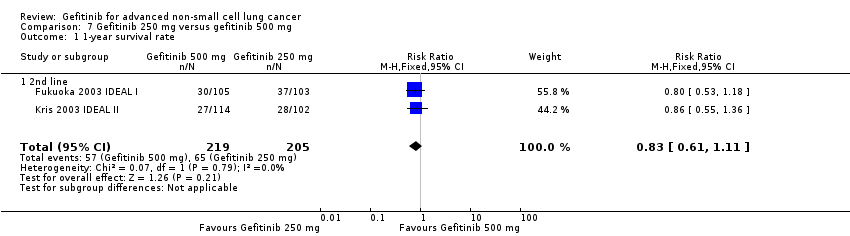
Comparison 7 Gefitinib 250 mg versus gefitinib 500 mg, Outcome 1 1‐year survival rate.

Comparison 7 Gefitinib 250 mg versus gefitinib 500 mg, Outcome 2 Skin rash.
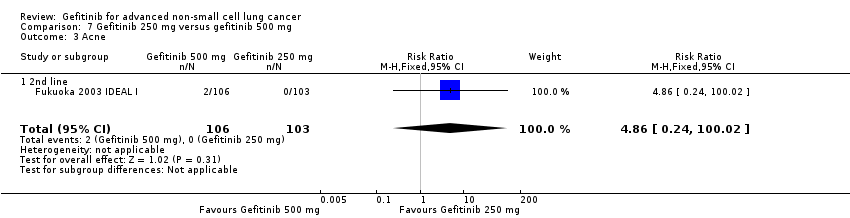
Comparison 7 Gefitinib 250 mg versus gefitinib 500 mg, Outcome 3 Acne.

Comparison 7 Gefitinib 250 mg versus gefitinib 500 mg, Outcome 4 Pruritus.
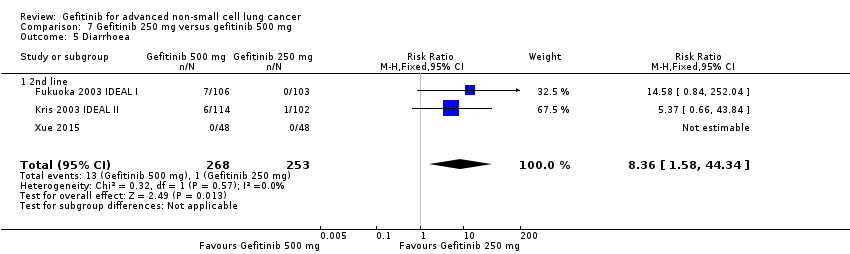
Comparison 7 Gefitinib 250 mg versus gefitinib 500 mg, Outcome 5 Diarrhoea.

Comparison 7 Gefitinib 250 mg versus gefitinib 500 mg, Outcome 6 Nausea.
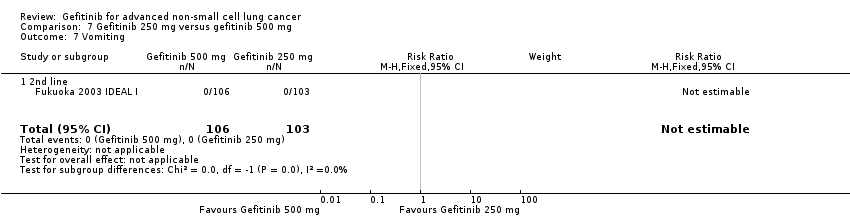
Comparison 7 Gefitinib 250 mg versus gefitinib 500 mg, Outcome 7 Vomiting.

Comparison 7 Gefitinib 250 mg versus gefitinib 500 mg, Outcome 8 Anorexia.

Comparison 7 Gefitinib 250 mg versus gefitinib 500 mg, Outcome 9 Asthenia.

Comparison 7 Gefitinib 250 mg versus gefitinib 500 mg, Outcome 10 Overall response rate.

Comparison 7 Gefitinib 250 mg versus gefitinib 500 mg, Outcome 11 Partial response.
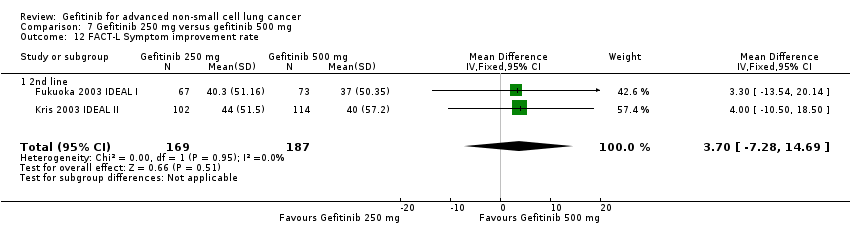
Comparison 7 Gefitinib 250 mg versus gefitinib 500 mg, Outcome 12 FACT‐L Symptom improvement rate.

Comparison 7 Gefitinib 250 mg versus gefitinib 500 mg, Outcome 13 TOI QOL improvement rate.

Comparison 8 Gefitinib versus gefitinib + chemotherapy, Outcome 1 HR Progression‐free survival.

Comparison 8 Gefitinib versus gefitinib + chemotherapy, Outcome 2 1‐year survival rate.
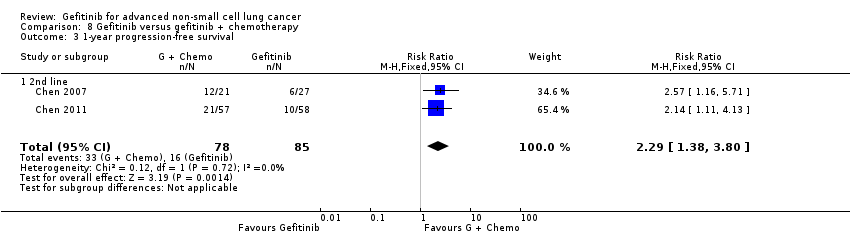
Comparison 8 Gefitinib versus gefitinib + chemotherapy, Outcome 3 1‐year progression‐free survival.
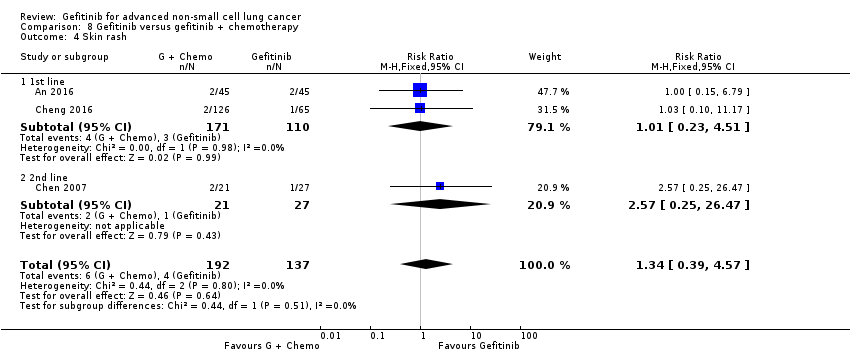
Comparison 8 Gefitinib versus gefitinib + chemotherapy, Outcome 4 Skin rash.

Comparison 8 Gefitinib versus gefitinib + chemotherapy, Outcome 5 Diarrhoea.
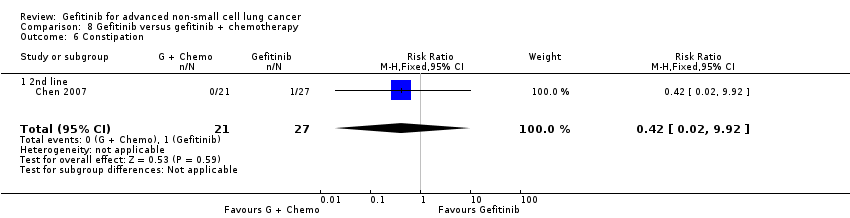
Comparison 8 Gefitinib versus gefitinib + chemotherapy, Outcome 6 Constipation.

Comparison 8 Gefitinib versus gefitinib + chemotherapy, Outcome 7 Fatigue.

Comparison 8 Gefitinib versus gefitinib + chemotherapy, Outcome 8 Leukopenia.

Comparison 8 Gefitinib versus gefitinib + chemotherapy, Outcome 9 Anaemia.

Comparison 8 Gefitinib versus gefitinib + chemotherapy, Outcome 10 Thrombocytopenia.

Comparison 8 Gefitinib versus gefitinib + chemotherapy, Outcome 11 Neutropenia.

Comparison 8 Gefitinib versus gefitinib + chemotherapy, Outcome 12 Increased ALT.

Comparison 8 Gefitinib versus gefitinib + chemotherapy, Outcome 13 Increased AST.

Comparison 8 Gefitinib versus gefitinib + chemotherapy, Outcome 14 Vomiting.

Comparison 8 Gefitinib versus gefitinib + chemotherapy, Outcome 15 Nausea.

Comparison 8 Gefitinib versus gefitinib + chemotherapy, Outcome 16 Overall response rate.

Comparison 8 Gefitinib versus gefitinib + chemotherapy, Outcome 17 Partial response.

Comparison 8 Gefitinib versus gefitinib + chemotherapy, Outcome 18 Stable disease.

Comparison 9 Gefitinib + chemotherapy versus chemotherapy, Outcome 1 HR Overall survival.

Comparison 9 Gefitinib + chemotherapy versus chemotherapy, Outcome 2 HR Progression‐free survival.

Comparison 9 Gefitinib + chemotherapy versus chemotherapy, Outcome 3 1‐year survival rate.

Comparison 9 Gefitinib + chemotherapy versus chemotherapy, Outcome 4 Skin rash.
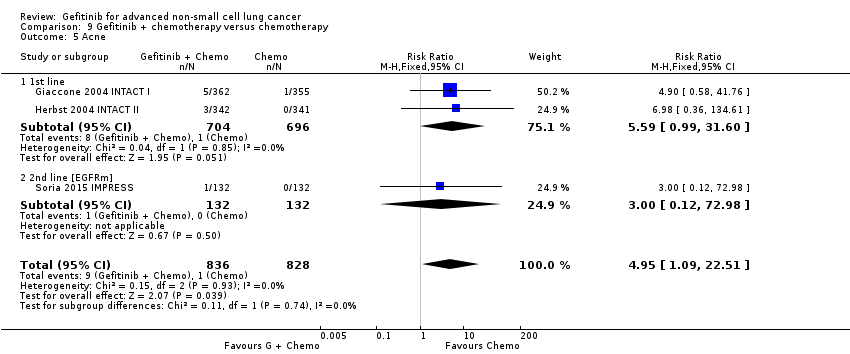
Comparison 9 Gefitinib + chemotherapy versus chemotherapy, Outcome 5 Acne.
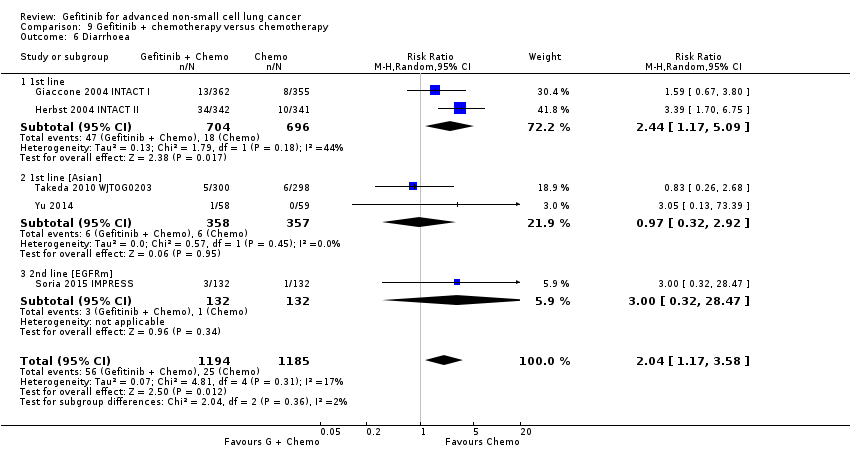
Comparison 9 Gefitinib + chemotherapy versus chemotherapy, Outcome 6 Diarrhoea.

Comparison 9 Gefitinib + chemotherapy versus chemotherapy, Outcome 7 Pruritus.

Comparison 9 Gefitinib + chemotherapy versus chemotherapy, Outcome 8 Vomiting.

Comparison 9 Gefitinib + chemotherapy versus chemotherapy, Outcome 9 Nausea.

Comparison 9 Gefitinib + chemotherapy versus chemotherapy, Outcome 10 Anorexia.

Comparison 9 Gefitinib + chemotherapy versus chemotherapy, Outcome 11 Asthenia.

Comparison 9 Gefitinib + chemotherapy versus chemotherapy, Outcome 12 Dyspnoea.

Comparison 9 Gefitinib + chemotherapy versus chemotherapy, Outcome 13 Anaemia.
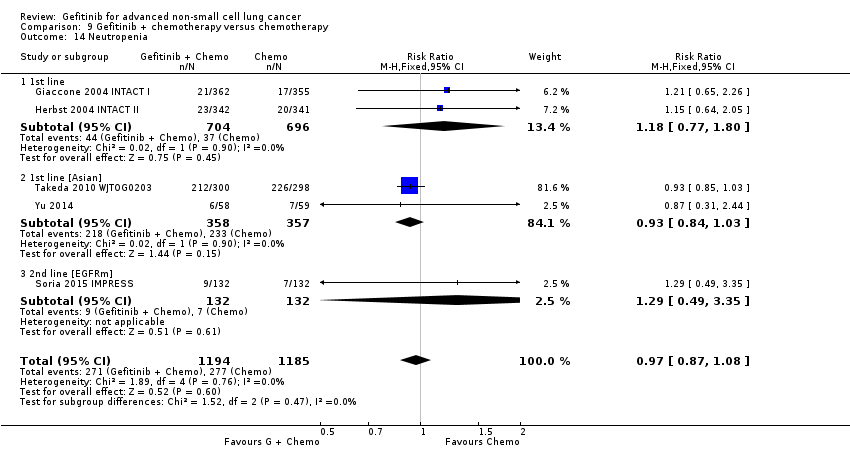
Comparison 9 Gefitinib + chemotherapy versus chemotherapy, Outcome 14 Neutropenia.
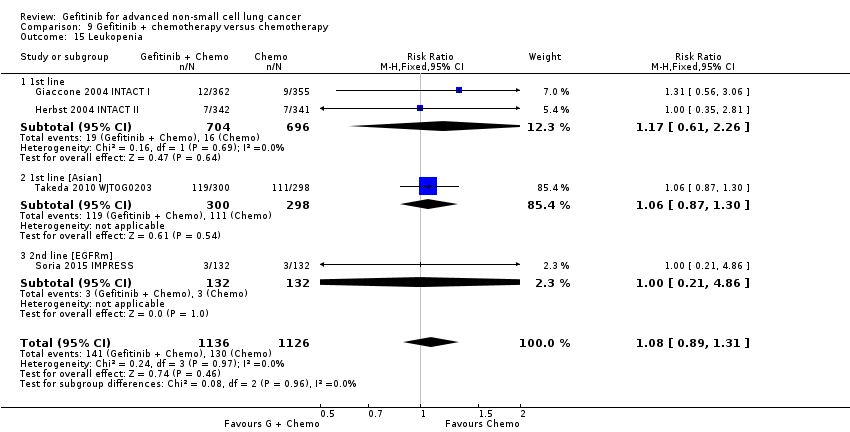
Comparison 9 Gefitinib + chemotherapy versus chemotherapy, Outcome 15 Leukopenia.

Comparison 9 Gefitinib + chemotherapy versus chemotherapy, Outcome 16 Overall response rate.
| Gefitinib compared to chemotherapy for first‐line treatment of advanced NSCLC | ||||||
| Patient or population: advanced NSCLC | ||||||
| Outcomes | Illustrative comparative risks* (95% CI) | Relative effect | No of participants | Quality of the evidence | Comments | |
| Assumed risk | Corresponding risk | |||||
| Chemotherapy | Gefitinib | |||||
| Overall survival (OS) | The mean OS ranged across control groups from 3.5 to 8 months | The mean OS in the intervention group ranged from 2.2 to 5.9 months | HR 0.98 (0.91 to 1.46) | 275 | ⊕⊕⊕⊝ | OS similar in the Asian (HR 0.94, 0.82 to 1.06) and EGFR mutation positive subgroups (HR 0.97, 0.77 to 1.21) |
| Progression‐free survival (PFS) | The PFS ranged across control groups from 2 to 2.9 months | The mean PFS in the intervention group ranged from 1.9 to 2.7 months | HR 1.19 (0.86 to 1.65) | 275 | ⊕⊕⊕⊝ | PFS improved with gefitinib in the Asian subgroup (HR 0.65, 0.43 to 0.98) and the EGFR mutation positive subgroup (HR 0.47, 0.36 to 0.61) |
| *The basis for the assumed risk (e.g. the median control group risk across studies) is provided in footnotes. The corresponding risk (and its 95% confidence interval) is based on the assumed risk in the comparison group and the relative effect of the intervention (and its 95% CI). | ||||||
| GRADE Working Group grades of evidence | ||||||
| 1We downgraded the quality of evidence by one level because of serious indirectness as one study included only elderly patients (> 70 years old). | ||||||
| Gefitinib compared to chemotherapy for second‐line treatment of advanced NSCLC | ||||||
| Patient or population: advanced NSCLC | ||||||
| Outcomes | Illustrative comparative risks* (95% CI) | Relative effect | No of participants | Quality of the evidence | Comments | |
| Assumed risk | Corresponding risk | |||||
| Chemotherapy | Gefitinib | |||||
| Overall survival (OS) | The mean OS ranged across control groups from 7.1 to 8 months | The mean OS in the intervention group ranged from 7.5 to 7.6 months | HR 1.02 (0.91 to 1.15) | 1607 | ⊕⊕⊕⊝ | OS similar in Asian patients (HR 0.94, 0.79 to 1.12) and EGFR mutation positive patients (HR 0.83, 0.41 to 1.66). |
| Progression‐free survival (PFS) | The mean PFS ranged across control groups from 2.7 to 3.4 months | The mean PFS in the intervention group ranged from 2.2 to 3 months | HR 1.04 (0.92 to 1.17) | 1607 | ⊕⊕⊕⊝ | PFS significantly improved in Asian patients (HR 0.71, 0.57 to 0.88) and in patients positive for EGFR mutation (HR 0.24, 0.12 to 0.47) (ranged from 2.7 to 4.1 months versus 4.5 to 7 months). |
| *The basis for the assumed risk (e.g. the median control group risk across studies) is provided in footnotes. The corresponding risk (and its 95% confidence interval) is based on the assumed risk in the comparison group and the relative effect of the intervention (and its 95% CI). | ||||||
| GRADE Working Group grades of evidence | ||||||
| 1We downgraded the quality of evidence by one level because of imprecision based on the wide confidence interval. | ||||||
| Gefitinib compared to chemotherapy for advanced NSCLC | |||||
| Patient or population: advanced NSCLC | |||||
| Outcomes | Illustrative comparative risks* (95% CI) | Relative effect | No of participants | Quality of the evidence | |
| Assumed risk | Corresponding risk | ||||
| Chemotherapy | Gefitinib | ||||
| Skin rash | Study population | RR 2.40 | 1858 | ⊕⊕⊕⊕ | |
| 9 per 1000 | 21 per 1000 | ||||
| Constipation | Study population | RR 0.41 | 1719 | ⊕⊕⊕⊕ | |
| 19 per 1000 | 8 per 1000 | ||||
| Fatigue | Study population | RR 0.16 | 275 | ⊕⊕⊕⊝ | |
| 65 per 1000 | 10 per 1000 | ||||
| Asthenia | Study population | RR 0.51 | 1773 | ⊕⊕⊕⊕ | |
| 79 per 1000 | 40 per 1000 | ||||
| Neurotoxicity | Study population | RR 0.07 | 1529 | ⊕⊕⊕⊕ | |
| 29 per 1000 | 2 per 1000 | ||||
| Neutropenia | Study population | RR 0.04 | 1857 | ⊕⊕⊕⊕ | |
| 505 per 1000 | 20 per 1000 | ||||
| Febrile neutropenia | Study population | RR 0.12 | 1768 | ⊕⊕⊕⊕ | |
| 92 per 1000 | 11 per 1000 | ||||
| *The basis for the assumed risk (e.g. the median control group risk across studies) is provided in footnotes. The corresponding risk (and its 95% confidence interval) is based on the assumed risk in the comparison group and the relative effect of the intervention (and its 95% CI). | |||||
| GRADE Working Group grades of evidence | |||||
| 1We downgraded the quality of evidence by one level because of serious indirectness as one study included only elderly patients (> 70 years old). | |||||
| Author/Year (Study name) | Journal | N | Comparison | Inclusion criteria | Phase | Asian | EGFR mutation | Line? |
| 1. Gefitinib versus placebo | ||||||||
| Goss 2009 (INSTEP) | JCO 27(13):2253‐2260 | 201 | Placebo | Poor PS | II | N | Subgroup | 1st line |
| Thatcher 2005 (ISEL) | Lancet 366:1527‐37 | 1692 | Placebo | — | III | Subset (Chang) | Subgroup (Hirsch) | 2nd line |
| Gaafar 2011 (EORTC08021) | Eur J Cancer (47):2331‐2340 | 173 | Placebo | Maintenance | III | N | N | Maintenance |
| Kelly 2008 (SWOGS0023) | JCO 26(15):2450‐2456 | 243 | Placebo | Consolidation | III | N | N | Maintenance |
| Zhang 2012 (INFORM) | Lancet Oncology 13:466‐475 | 296 | Placebo | Maintenance | III | Y | Subgroup | Maintenance |
| 2. Gefitinib versus chemotherapy | ||||||||
| Crino 2008 (INVITE) | JCO 26(26):4253‐4260 | 196 | Vinorelbine | Elderly patients | II | N | Subgroup | 1st line |
| Lou 2014 | Natl Med J China 94(30): 2337‐2341 | 51 | Carboplatin + paclitaxel | Asian | II | Y | N | 1st line |
| Morere 2010 (IFCT0301) | Lung Cancer 70:301‐307 | 85 | Docetaxel | Poor PS | II | N | N | 1st line |
| Han 2013 (First‐SIGNAL) | JCO 30(10): 1122‐1128 | 313 | Gemcitabine + cisplatin | — | III | Y | Planned Subgroup | 1st line |
| Mok 2009 (IPASS) | NEJM 361(10):947‐957 | 1217 | Carboplatin + paclitaxel | Asian, adenocarcinomas | III | Y | Subgroup | 1st line |
| Maemondo 2010 (NEJ002) | NEJM 362(25):2580‐2588 | 230 | Carboplatin + paclitaxel | Asian, EGFR mutation | III | Y | Y | 1st line |
| Mitsudomi 2010 (WJTOG3405) | Lancet Oncol 11:121‐128 | 177 | Cisplatin + docetaxel | Asian, EGFR mutation | III | Y | Y | 1st line |
| Yang 2014 | Eur J Cancer 50:2219‐2230 | 236 | Pemetrexed + cisplatin | Asian | III | Y | Subgroup | 1st line + maintenance |
| Cufer 2006 (SIGN) | Anti‐cancer Drugs 14:401‐409 | 141 | Docetaxel | Open‐label | II | N | N | 2nd line |
| Dai 2013 | Chin J Lung Cancer 16(8):405‐410 | 46 | Pemetrexed | Asian | II | Y | N | 2nd line |
| Kim 2016 | Cancer Res Treat 48(1):80‐87 | 95 | Pemetrexed | Asian | II | Y | N | 2nd/3rd line |
| Li 2010 | Chinese J Clin Onc 37:16‐18 | 98 | Docetaxel | Asian | II | Y | N | 2nd line |
| Kim 2008 (INTEREST) | Lancet 372:1809‐1818 | 1466 | Docetaxel | — | III | N | Subgroup (Doulliard) | 2nd line |
| Lee 2010 (ISTANA) | Clin Cancer Res 16(4):1307‐1314 | 161 | Docetaxel | Asian | III | Y | N | 2nd/3rd line |
| Maruyama 2008 (V‐15‐32) | JCO 26(26):4244‐4252 | 489 | Docetaxel | Asian | III | Y | Subgroup | 2nd/3rd line |
| Sun 2012 (KSCG‐LU08‐01) | Cancer 118:6234‐6242 | 141 | Pemetrexed | Adenocarcinoma, non‐smoker | III | Y | Subgroup | 2nd line |
| Ahn 2012 | Lung Cancer 77:346‐352 | 73 | Pemetrexed | Asian, never‐smokers | II | Y | N | Maintenance |
| Xu 2015 | Int J Clin Exp Med 8(4):6242‐6246 | 188 | Pemetrexed | Asian | II | Y | N | Maintenance |
| 3. Gefitinib 250 mg versus gefitinib 500 mg | ||||||||
| Fukuoka 2003 (IDEAL I) | JCO 21(12):2237‐2246 | 210 | G250 versus G500 | — | II | N | N | 2rd/3rd line |
| Kris 2003 (IDEAL II) | JAMA 290(16):2149‐2158 | 216 | G250 versus G500 | — | II | N | N | 3rd line |
| Xue 2015 | Int J Clin Exp Med 8(4):6242‐6246 | 188 | G250 versus G500 | Asian | II | Y | N | Maintenance |
| 4. Gefitinib versus gefitinib + chemotherapy | ||||||||
| An 2016 | Pathol Oncol Res 22:763‐768 | 90 | Gefitinib + Pemetrexed | Asian, EGFR mutation | II | Y | Y | 1st line |
| Cheng 2016 | JCO 34(27): 3258‐3266 | 191 | Gefitinib + Pemetrexed | Asian, EGFR mutation | II | Y | Y | 1st line |
| Chen 2007 | Cancer 109:1821‐8 | 48 | Gefitinib + Vinorelbine | Adenocarcinoma | II | N | Subgroup | 3rd line |
| Chen 2011 | J Thor Oncol 6:1110‐1116 | 115 | Gefitinib + Tegafur | Adenocarcinoma | II | Y | Subgroup | 2nd/3rd line |
| 5. Gefitinib + chemotherapy versus chemotherapy | ||||||||
| Giaccone 2004 (INTACT I) | JCO 22(5):777‐784 | 1093 | Gemcitabine + Cisplatin | — | III | N | N | 1st line |
| Herbst 2004 (INTACT II) | JCO 22(5):785‐794 | 1037 | Carboplatin + paclitaxel | — | III | N | N | 1st line |
| Takeda 2010 (WTOG0203) | JCO 28(5):753‐760 | 604 | Platinum doublet | — | III | Y | N | 1st line |
| Yu 2014 | Cancer Biology & Therapy 15:832‐839 | 117 | Pemetrexed + platinum | Asian | II | Y | N | 1st line |
| Soria 2015 (IMPRESS) | Lancet Oncology 16:990‐98 | 265 | Pemetrexed + cisplatin | EGFR mutation positive | III | N | Y | 2nd line |
| EGFR: epidermal growth factor receptor Journals: Cancer Res Treat: Cancer Research and Treatment | ||||||||
| Study | ORR (%) | PFS (months) | OS (months) | ||||||
| 1. Gefitinib versus placebo | Gefitinib | Control | P | Gefitinib | Control | P | Gefitinib | Control | P |
| 1st line | |||||||||
| Goss 2009 | 6 | 1.0 | NS | 1.43 | 1.37 | NS | 3.7 | 2.8 | NS |
| 2nd line | |||||||||
| Thatcher 2005 ISEL | 37.5 | 48.3 | NS | 3 | 2.6 | 0.0006 | 5.6 | 5.1 | 0.087 |
| Maintenance therapy | |||||||||
| Kelly 2008 SWOGS0023 | ‐ | ‐ | ‐ | 8.3 | 11.7 | NS | 23 | 35 | 0.013 |
| Gaafar 2011 EORTC08021 | 12 | 1 | 0.004 | 4.1 | 2.9 | 0.0015 | 10.9 | 9.4 | NS |
| 2. Gefitinib versus placebo (Asian population) | Gefitinib | Control | P | Gefitinib | Control | P | Gefitinib | Control | P |
| Chang 2006 ISEL | 12.4 | 2.1 | 0.01 | 4.4 | 2.2 | 0.008 | 9.5 | 5.5 | 0.01 |
| Zhang 2012 INFORM | 24 | 1 | 0.0001 | 4.8 | 2.6 | < 0.0001 | 18.7 | 16.0 | NS |
| 3. Gefitinib versus placebo (EGFR mutation positive) | Gefitinib | Control | P | Gefitinib | Control | P | Gefitinib | Control | P |
| Zhang 2012 INFORM | ‐ | ‐ | ‐ | 16.6 | 2.8 | 0.0063 | 46.87 | 20.97 | 0.036 |
| Gefitinib vs chemotherapy | |||||||||
| 4. General population | Gefitinib | Chemo | P | Gefitinib | Chemo | P | Gefitinib | Chemo | P |
| versus 1st line chemotherapy | |||||||||
| Crino 2008 INVITE | 3.1 | 5.1 | ‐ | 2.7 | 2.9 | NS | 5.9 | 8 | NS |
| Morere 2010 IFCT0301 | ‐ | ‐ | ‐ | 1.9 | 2 | 0.078 | 2.2 | 3.5 | 0.088 |
| Morere 2010 IFCT0301 (Adenocarcinoma) | ‐ | ‐ | ‐ | 1.9 | 2.1 | 0.272 | 2.3 | 4.4 | NS |
| versus 2nd line chemotherapy | |||||||||
| Cufer 2006 SIGN | 13.2 | 13.7 | NS | 7.5 | 7.1 | NS | 3 | 3.4 | NS |
| Kim 2008 INTEREST | 9.1 | 7.6 | NS | 2.2 | 2.7 | NS | 7.6 | 8 | NS |
| Kim 2008 INTEREST | ‐ | ‐ | ‐ | ‐ | ‐ | ‐ | 8.5 | 8.9 | NS |
| 5. Asian population | Gefitinib | Chemo | P | Gefitinib | Chemo | P | Gefitinib | Chemo | P |
| versus 1st line chemotherapy | |||||||||
| Lou 2014 | 36 | 42.3 | NS | 4.2 | 8.3 | NS | 14.4 | 15 | NS |
| Maemondo 2010 (EGFR mutation positive) | 73.7 | 30.7 | < 0.001 | 10.8 | 5.4 | < 0.001 | 30.5 | 23.6 | NS |
| Mitsudomi 2010 WJTOG (EGFR mutation positive) | 62.1 | 32.2 | < 0.0001 | 9.2 | 6.3 | < 0.0001 | ‐ | ‐ | ‐ |
| Mok 2009 IPASS | 43 | 32.2 | < 0.001 | 5.7 | 5.8 | NS | 18.6 | 17.3 | NS |
| Han 2012 First‐SIGNAL (adenocarcinoma) | 55.4 | 46 | NS | 5.8 | 6.4 | NS | 22.3 | 22.9 | NS |
| Yang 2014 (Asian) | 47.5 | 41.5 | NS | 9.63 | 8.38 | NS | 27.9 | 26.9 | NS |
| versus 2nd line chemotherapy | |||||||||
| Dai 2013 | 17.4 | 13 | NS | 4.4 | 3.1 | NS | ‐ | ‐ | ‐ |
| Kim 2016 | 8 | 13 | NS | 2 | 2 | NS | 8.5 | 8.5 | NS |
| Li 2010 | 22.4 | 18.8 | NS | ‐ | ‐ | ‐ | 7.1 | 6.9 | NS |
| Kim 2008 INTEREST (subgroup) | ‐ | ‐ | ‐ | ‐ | ‐ | ‐ | 10.4 | 12.2 | NS |
| Lee 2010 ISTANA | 28.1 | 7.6 | 0.0007 | 3.3 | 3.4 | NS | 14.1 | 12.2 | NS |
| Maruyama 2008 V‐15‐32 | 22.5 | 12.8 | 0.009 | 2 | 2 | NS | 11.5 | 14 | NS |
| Sun 2012 KCSG‐LU08‐01 (adenocarcinoma, subgroup) | 58.8 | 22.4 | < 0.001 | 9.0 | 3.0 | 0.0006 | 22.2 | 18.9 | NS |
| versus maintenance therapy | |||||||||
| Ahn 2012 (Asian) | 46 | 35 | NS | 9.95 | 6.83 | NS | ‐ | ‐ | ‐ |
| Xu 2015 (Asian) | 18.1 | 29.8 | NS | ‐ | ‐ | ‐ | ‐ | ‐ | ‐ |
| 6. EGFR mutation positive | Gefitinib | Chemo | P | Gefitinib | Chemo | P | Gefitinib | Chemo | P |
| versus 1st line chemotherapy | |||||||||
| Maemondo 2010 (EGFR mutation positive) | 73.7 | 30.7 | < 0.001 | 10.8 | 5.4 | < 0.001 | 30.5 | 23.6 | NS |
| Mitsudomi 2010 WJTOG (EGFR mutation positive) | 62.1 | 32.2 | < 0.0001 | 9.2 | 6.3 | < 0.0001 | ‐ | ‐ | ‐ |
| Mok 2009 IPASS (subgroup) | 71.2 | 47.3 | < 0.001 | ‐ | ‐ | ‐ | ‐ | ‐ | ‐ |
| Han 2012 First‐SIGNAL (subgroup) | 84.6 | 37.5 | 0.002 | ‐ | ‐ | ‐ | ‐ | ‐ | ‐ |
| Yang 2014 (subgroup) | 70.8 | 65.4 | NS | 16.62 | 12.91 | NS | 45.7 | 32.4 | 0.255 |
| versus 2nd line chemotherapy | |||||||||
| INTEREST Doulliard 2010 (subgroup) | 42.1 | 21.1 | 0.04 | 7 | 4.1 | 0.001 | 14.2 | 16.6 | NS |
| Maruyama 2008 (subgroup) | 67 | 46 | ‐ | ‐ | ‐ | ‐ | ‐ | ‐ | ‐ |
| Sun 2012 KCSG‐LU08‐01 (subgroup) | ‐ | ‐ | ‐ | 15.7 | 2.9 | 0.005 | ‐ | ‐ | ‐ |
| 7. Gefitinib 250 mg versus gefitinib 500 mg | 250 mg | 500 mg | P | 250 mg | 500 mg | P | 250 mg | 500 mg | P |
| 2nd+ line | |||||||||
| Fukuoka 2003 | 18.4 | 19 | NS | 2.7 | 2.8 | NS | 7.6 | 8 | NS |
| Kris 2004 | 12 | 9 | NS | ‐ | ‐ | ‐ | 7 | 6 | NS |
| Maintenance therapy | |||||||||
| Xue 2015 (Asian) | 12.5 | 12.5 | NS | ‐ | ‐ | ‐ | ‐ | ‐ | ‐ |
| 8. Gefitinib versus gefitinib + chemotherapy | Gefitinib | G + Chemo | P | Gefitinib | G + Chemo | P | Gefitinib | G + Chemo | P |
| 1st line | |||||||||
| An 2016 | 73.33 | 80 | NS | 14 | 18 | < 0.05 | 32 | 34 | NS |
| Cheng 2016 | 74 | 80 | NS | 10.9 | 15.8 | 0.014 | ‐ | ‐ | ‐ |
| 2nd+ line | |||||||||
| Chen 2007(Asian, adenocarcinoma) | 55.6 | 52.4 | NS | 7.1 | 12.8 | NS | 13.3 | 23.4 | NS |
| Chen 2011(Asian, adenocarcinoma) | 35 | 37 | NS | 5.3 | 8.3 | 0.04 | ‐ | ‐ | ‐ |
| Chen 2011 (EGFR mutation positive subgroup) | ‐ | ‐ | ‐ | 7.6 | 14.4 | 0.0061 | ‐ | ‐ | ‐ |
| 9. Gefitinib + chemotherapy versus chemotherapy | 250 mg + Chemo | Chemo | P | 250 mg + Chemo | Chemo | P | 250 mg + Chemo | Chemo | P |
| 1st line | |||||||||
| Giaccone 2004 | 51.2 | 47.2 | NS | 5.8 | 6 | NS | 9.9 | 10.9 | NS |
| Herbst 2004 | 30.4 | 28.7 | NS | 5.3 | 5 | NS | 9.8 | 9.9 | NS |
| Takeda 2010 (Asian) | 34.2 | 29.3 | NS | 4.3 | 4.6 | < 0.001 | 12.9 | 13.7 | NS |
| Yu 2014 (Asian) | 47.4 | 50 | NS | 7.9 | 7 | NS | 25.4 | 20.5 | NS |
| 2nd line | |||||||||
| Soria 2015 IMPRESS (EGFR mutation positive) | 32 | 34 | NS | 5.4 | 5.4 | NS | 14.8 | 17.2 | NS |
| Chemo: chemotherapy | |||||||||
| Outcome or subgroup title | No. of studies | No. of participants | Statistical method | Effect size |
| 1 HR Overall survival Show forest plot | 4 | Hazard Ratio (Random, 95% CI) | Subtotals only | |
| 1.1 G(250) vs P = 1st line | 1 | Hazard Ratio (Random, 95% CI) | 0.84 [0.62, 1.14] | |
| 1.2 G(250) vs P = 2nd line | 1 | Hazard Ratio (Random, 95% CI) | 0.89 [0.79, 1.01] | |
| 1.3 G(500) vs P = Maintenance | 2 | Hazard Ratio (Random, 95% CI) | 1.14 [0.61, 2.14] | |
| 2 HR Progression‐free survival Show forest plot | 4 | Hazard Ratio (Random, 95% CI) | Subtotals only | |
| 2.1 G(250) vs P = 1st line | 1 | Hazard Ratio (Random, 95% CI) | 0.82 [0.60, 1.12] | |
| 2.2 G(250) vs P = 2nd line | 1 | Hazard Ratio (Random, 95% CI) | 0.82 [0.75, 0.90] | |
| 2.3 G(500) vs P = Maintenance | 2 | Hazard Ratio (Random, 95% CI) | 0.70 [0.53, 0.91] | |
| 3 1‐year survival rate Show forest plot | 2 | Risk Ratio (M‐H, Fixed, 95% CI) | Subtotals only | |
| 3.1 G(250) vs P = 2nd line | 1 | 1439 | Risk Ratio (M‐H, Fixed, 95% CI) | 1.28 [1.05, 1.57] |
| 3.2 G(500) vs P = Maintenance | 1 | 243 | Risk Ratio (M‐H, Fixed, 95% CI) | 0.90 [0.78, 1.04] |
| 4 Skin rash Show forest plot | 3 | 2060 | Risk Ratio (M‐H, Fixed, 95% CI) | 7.92 [1.46, 43.03] |
| 4.1 G(250) vs P = 1st line | 1 | 201 | Risk Ratio (M‐H, Fixed, 95% CI) | 0.0 [0.0, 0.0] |
| 4.2 G(250) vs P = 2nd line | 1 | 1688 | Risk Ratio (M‐H, Fixed, 95% CI) | 8.98 [1.20, 67.13] |
| 4.3 G(250) vs P = Maintenance | 1 | 171 | Risk Ratio (M‐H, Fixed, 95% CI) | 5.06 [0.25, 103.82] |
| 5 Pruritus Show forest plot | 2 | 1889 | Risk Ratio (M‐H, Fixed, 95% CI) | 2.00 [0.22, 17.82] |
| 5.1 G(250) vs P = 1st line | 1 | 201 | Risk Ratio (M‐H, Fixed, 95% CI) | 0.0 [0.0, 0.0] |
| 5.2 G(250) vs P = 2nd line | 1 | 1688 | Risk Ratio (M‐H, Fixed, 95% CI) | 2.00 [0.22, 17.82] |
| 6 Diarrhoea Show forest plot | 3 | 2060 | Risk Ratio (M‐H, Fixed, 95% CI) | 2.48 [1.15, 5.35] |
| 6.1 G(250) vs P = 1st line | 1 | 201 | Risk Ratio (M‐H, Fixed, 95% CI) | 1.01 [0.21, 4.89] |
| 6.2 G(250) vs P = 2nd line | 1 | 1688 | Risk Ratio (M‐H, Fixed, 95% CI) | 3.09 [1.21, 7.91] |
| 6.3 G(250) vs P = Maintenance | 1 | 171 | Risk Ratio (M‐H, Fixed, 95% CI) | 3.03 [0.13, 73.47] |
| 7 Constipation Show forest plot | 1 | 201 | Risk Ratio (M‐H, Fixed, 95% CI) | 1.01 [0.06, 15.93] |
| 7.1 G(250) vs P = 1st line | 1 | 201 | Risk Ratio (M‐H, Fixed, 95% CI) | 1.01 [0.06, 15.93] |
| 8 Nausea Show forest plot | 2 | 1889 | Risk Ratio (M‐H, Random, 95% CI) | 0.65 [0.03, 12.44] |
| 8.1 G(250) vs P = 1st line | 1 | 201 | Risk Ratio (M‐H, Random, 95% CI) | 0.11 [0.01, 2.06] |
| 8.2 G(250) vs P = 2nd line | 1 | 1688 | Risk Ratio (M‐H, Random, 95% CI) | 2.25 [0.49, 10.36] |
| 9 Vomiting Show forest plot | 2 | 1859 | Risk Ratio (M‐H, Fixed, 95% CI) | 3.21 [0.83, 12.38] |
| 9.1 G(250) vs P = 2nd line | 1 | 1688 | Risk Ratio (M‐H, Fixed, 95% CI) | 3.24 [0.73, 14.33] |
| 9.2 G(250) vs P = Maintenance | 1 | 171 | Risk Ratio (M‐H, Fixed, 95% CI) | 3.03 [0.13, 73.47] |
| 10 Anorexia Show forest plot | 3 | 2060 | Risk Ratio (M‐H, Fixed, 95% CI) | 1.22 [0.64, 2.33] |
| 10.1 G(250) vs P = 1st line | 1 | 201 | Risk Ratio (M‐H, Fixed, 95% CI) | 5.05 [0.25, 103.87] |
| 10.2 G(250) vs P = 2nd line | 1 | 1688 | Risk Ratio (M‐H, Fixed, 95% CI) | 1.18 [0.59, 2.37] |
| 10.3 G(250) vs P = Maintenance | 1 | 171 | Risk Ratio (M‐H, Fixed, 95% CI) | 0.34 [0.01, 8.16] |
| 11 Fatigue Show forest plot | 2 | Risk Ratio (M‐H, Fixed, 95% CI) | Subtotals only | |
| 11.1 G(250) vs P = 1st line | 1 | 201 | Risk Ratio (M‐H, Fixed, 95% CI) | 0.76 [0.27, 2.10] |
| 11.2 G(250) vs P = Maintenance | 1 | 171 | Risk Ratio (M‐H, Fixed, 95% CI) | 4.05 [0.46, 35.47] |
| 12 Asthenia Show forest plot | 1 | Risk Ratio (M‐H, Fixed, 95% CI) | Subtotals only | |
| 12.1 G(250) vs P = 2nd line | 1 | 1688 | Risk Ratio (M‐H, Fixed, 95% CI) | 1.20 [0.66, 2.17] |
| 13 Respiratory tract infection Show forest plot | 2 | 1889 | Risk Ratio (M‐H, Random, 95% CI) | 0.53 [0.07, 3.83] |
| 13.1 G(250) vs P = 1st line | 1 | 201 | Risk Ratio (M‐H, Random, 95% CI) | 0.11 [0.01, 2.06] |
| 13.2 G(250) vs P = 2nd line | 1 | 1688 | Risk Ratio (M‐H, Random, 95% CI) | 1.00 [0.54, 1.84] |
| 14 Dyspnoea Show forest plot | 3 | 2060 | Risk Ratio (M‐H, Random, 95% CI) | 0.98 [0.59, 1.63] |
| 14.1 G(250) vs P = 1st line | 1 | 201 | Risk Ratio (M‐H, Random, 95% CI) | 1.85 [0.71, 4.81] |
| 14.2 G(250) vs P = 2nd line | 1 | 1688 | Risk Ratio (M‐H, Random, 95% CI) | 0.83 [0.49, 1.42] |
| 14.3 G(250) vs P = Maintenance | 1 | 171 | Risk Ratio (M‐H, Random, 95% CI) | 0.67 [0.20, 2.31] |
| 15 Anaemia Show forest plot | 1 | 201 | Risk Ratio (M‐H, Fixed, 95% CI) | 7.07 [0.37, 135.12] |
| 15.1 G(250) vs P = 1st line | 1 | 201 | Risk Ratio (M‐H, Fixed, 95% CI) | 7.07 [0.37, 135.12] |
| 16 Abdominal pain Show forest plot | 1 | 201 | Risk Ratio (M‐H, Fixed, 95% CI) | 0.51 [0.05, 5.48] |
| 16.1 G(250) vs P = 1st line | 1 | 201 | Risk Ratio (M‐H, Fixed, 95% CI) | 0.51 [0.05, 5.48] |
| 17 Increased ALT Show forest plot | 1 | 171 | Risk Ratio (M‐H, Fixed, 95% CI) | 9.11 [1.18, 70.32] |
| 17.1 G(250) vs P = Maintenance | 1 | 171 | Risk Ratio (M‐H, Fixed, 95% CI) | 9.11 [1.18, 70.32] |
| 18 Increased AST Show forest plot | 1 | 171 | Risk Ratio (M‐H, Fixed, 95% CI) | 7.08 [0.89, 56.34] |
| 18.1 G(250) vs P = Maintenance | 1 | 171 | Risk Ratio (M‐H, Fixed, 95% CI) | 7.08 [0.89, 56.34] |
| 19 Neutropenia Show forest plot | 1 | 171 | Risk Ratio (M‐H, Fixed, 95% CI) | 3.03 [0.13, 73.47] |
| 19.1 G(250) vs P = Maintenance | 1 | 171 | Risk Ratio (M‐H, Fixed, 95% CI) | 3.03 [0.13, 73.47] |
| 20 Anaemia Show forest plot | 1 | 171 | Risk Ratio (M‐H, Fixed, 95% CI) | 0.20 [0.01, 4.15] |
| 20.1 G(250) vs P = Maintenance | 1 | 171 | Risk Ratio (M‐H, Fixed, 95% CI) | 0.20 [0.01, 4.15] |
| 21 Thrombocytopaenia Show forest plot | 1 | 171 | Risk Ratio (M‐H, Fixed, 95% CI) | 3.03 [0.13, 73.47] |
| 21.1 G(250) vs P = Maintenance | 1 | 171 | Risk Ratio (M‐H, Fixed, 95% CI) | 3.03 [0.13, 73.47] |
| 22 Overall response rate Show forest plot | 3 | Risk Ratio (M‐H, Fixed, 95% CI) | Subtotals only | |
| 22.1 G(250) vs P = 1st line | 1 | 201 | Risk Ratio (M‐H, Fixed, 95% CI) | 6.06 [0.74, 49.43] |
| 22.2 G(250) vs P= 2nd line | 1 | 1439 | Risk Ratio (M‐H, Fixed, 95% CI) | 6.42 [2.82, 14.64] |
| 22.3 G(250) vs P = Maintenance | 1 | 173 | Risk Ratio (M‐H, Fixed, 95% CI) | 10.12 [1.32, 77.33] |
| 23 Disease control rate Show forest plot | 3 | Risk Ratio (M‐H, Fixed, 95% CI) | Subtotals only | |
| 23.1 G(250) vs P = 1st line | 1 | 201 | Risk Ratio (M‐H, Fixed, 95% CI) | 1.36 [0.86, 2.16] |
| 23.2 G(250) vs P = 2nd line | 1 | 1439 | Risk Ratio (M‐H, Fixed, 95% CI) | 1.24 [1.06, 1.44] |
| 23.3 G(250) vs P = Maintenance | 1 | 173 | Risk Ratio (M‐H, Fixed, 95% CI) | 1.21 [1.00, 1.46] |
| Outcome or subgroup title | No. of studies | No. of participants | Statistical method | Effect size |
| 1 HR Overall survival Show forest plot | 2 | Hazard Ratio (Fixed, 95% CI) | Subtotals only | |
| 1.1 G(250) vs P = 2nd line | 1 | Hazard Ratio (Fixed, 95% CI) | 0.66 [0.48, 0.91] | |
| 1.2 G(250) vs P = Maintenance | 1 | Hazard Ratio (Fixed, 95% CI) | 0.88 [0.68, 1.14] | |
| 2 HR Progression‐free survival Show forest plot | 2 | Hazard Ratio (Fixed, 95% CI) | Subtotals only | |
| 2.1 G(250) vs P = 2nd line | 1 | Hazard Ratio (Fixed, 95% CI) | 0.69 [0.52, 0.91] | |
| 2.2 G(250) vs P = Maintenance | 1 | Hazard Ratio (Fixed, 95% CI) | 0.42 [0.33, 0.54] | |
| 3 1‐year survival rate Show forest plot | 1 | Risk Ratio (M‐H, Fixed, 95% CI) | Subtotals only | |
| 3.1 G(250) vs P = 2nd line | 1 | 342 | Risk Ratio (M‐H, Fixed, 95% CI) | 1.75 [1.20, 2.55] |
| 4 Overall response rate Show forest plot | 2 | Risk Ratio (M‐H, Random, 95% CI) | Subtotals only | |
| 4.1 G(250) vs P = 2nd line | 1 | 306 | Risk Ratio (M‐H, Random, 95% CI) | 6.03 [1.46, 24.91] |
| 4.2 G(250) vs P = Maintenance | 1 | 296 | Risk Ratio (M‐H, Random, 95% CI) | 35.00 [4.86, 252.15] |
| Outcome or subgroup title | No. of studies | No. of participants | Statistical method | Effect size |
| 1 HR Overall survival Show forest plot | 1 | Hazard Ratio (Fixed, 95% CI) | Subtotals only | |
| 1.1 G(250) vs P = Maintenance | 1 | Hazard Ratio (Fixed, 95% CI) | 0.39 [0.15, 0.98] | |
| 2 HR Progression‐free survival Show forest plot | 1 | Hazard Ratio (Fixed, 95% CI) | Subtotals only | |
| 2.1 G(250) vs P = Maintenance | 1 | Hazard Ratio (Fixed, 95% CI) | 0.17 [0.07, 0.41] | |
| Outcome or subgroup title | No. of studies | No. of participants | Statistical method | Effect size |
| 1 HR Overall survival Show forest plot | 2 | Hazard Ratio (Fixed, 95% CI) | Subtotals only | |
| 1.1 G vs vinorelbine = 1st line | 1 | Hazard Ratio (Fixed, 95% CI) | 0.98 [0.66, 1.46] | |
| 1.2 G vs docetaxel = 2nd line | 1 | Hazard Ratio (Fixed, 95% CI) | 1.02 [0.91, 1.15] | |
| 2 HR Progression‐free survival Show forest plot | 2 | Hazard Ratio (Fixed, 95% CI) | Subtotals only | |
| 2.1 G vs vinorelbine = 1st line | 1 | Hazard Ratio (Fixed, 95% CI) | 1.19 [0.86, 1.65] | |
| 2.2 G vs docetaxel = 2nd line | 1 | Hazard Ratio (Fixed, 95% CI) | 1.04 [0.92, 1.17] | |
| 3 1‐year survival rate Show forest plot | 3 | 1741 | Risk Ratio (M‐H, Fixed, 95% CI) | 0.94 [0.82, 1.08] |
| 3.1 G vs vinorelbine = 1st line | 1 | 190 | Risk Ratio (M‐H, Fixed, 95% CI) | 1.02 [0.69, 1.52] |
| 3.2 G vs docetaxel = 1st line | 1 | 85 | Risk Ratio (M‐H, Fixed, 95% CI) | 0.39 [0.08, 1.90] |
| 3.3 G vs docetaxel = 2nd line | 1 | 1466 | Risk Ratio (M‐H, Fixed, 95% CI) | 0.94 [0.82, 1.09] |
| 4 Skin rash Show forest plot | 4 | 1858 | Risk Ratio (M‐H, Fixed, 95% CI) | 2.40 [1.08, 5.31] |
| 4.1 G vs vinorelbine = 1st line | 1 | 190 | Risk Ratio (M‐H, Fixed, 95% CI) | 5.11 [0.25, 104.94] |
| 4.2 G vs docetaxel = 1st line | 1 | 85 | Risk Ratio (M‐H, Fixed, 95% CI) | 0.49 [0.05, 5.19] |
| 4.3 G vs docetaxel = 2nd line | 2 | 1583 | Risk Ratio (M‐H, Fixed, 95% CI) | 2.82 [1.11, 7.13] |
| 5 Constipation Show forest plot | 3 | 1719 | Risk Ratio (M‐H, Fixed, 95% CI) | 0.41 [0.17, 0.97] |
| 5.1 G vs vinorelbine = 1st line | 1 | 190 | Risk Ratio (M‐H, Fixed, 95% CI) | 0.20 [0.01, 4.20] |
| 5.2 G vs docetaxel = 1st line | 1 | 85 | Risk Ratio (M‐H, Fixed, 95% CI) | 0.33 [0.01, 7.78] |
| 5.3 G vs docetaxel = 2nd line | 1 | 1444 | Risk Ratio (M‐H, Fixed, 95% CI) | 0.45 [0.17, 1.18] |
| 6 Fatigue Show forest plot | 2 | 275 | Risk Ratio (M‐H, Fixed, 95% CI) | 0.16 [0.03, 0.88] |
| 6.1 G vs vinorelbine = 1st line | 1 | 190 | Risk Ratio (M‐H, Fixed, 95% CI) | 0.07 [0.00, 1.18] |
| 6.2 G vs docetaxel = 1st line | 1 | 85 | Risk Ratio (M‐H, Fixed, 95% CI) | 0.49 [0.05, 5.19] |
| 7 Asthenia Show forest plot | 3 | 1773 | Risk Ratio (M‐H, Fixed, 95% CI) | 0.51 [0.35, 0.75] |
| 7.1 G vs vinorelbine = 1st line | 1 | 190 | Risk Ratio (M‐H, Fixed, 95% CI) | 0.15 [0.01, 2.79] |
| 7.2 G vs docetaxel = 2nd line | 2 | 1583 | Risk Ratio (M‐H, Fixed, 95% CI) | 0.53 [0.36, 0.78] |
| 8 Neurotoxicity Show forest plot | 2 | 1529 | Risk Ratio (M‐H, Fixed, 95% CI) | 0.07 [0.01, 0.34] |
| 8.1 G vs docetaxel = 1st line | 1 | 85 | Risk Ratio (M‐H, Fixed, 95% CI) | 0.09 [0.01, 1.56] |
| 8.2 G vs docetaxel = 2nd line | 1 | 1444 | Risk Ratio (M‐H, Fixed, 95% CI) | 0.06 [0.01, 0.43] |
| 9 Neutropenia Show forest plot | 4 | 1857 | Risk Ratio (M‐H, Fixed, 95% CI) | 0.04 [0.02, 0.06] |
| 9.1 G vs vinorelbine = 1st line | 1 | 190 | Risk Ratio (M‐H, Fixed, 95% CI) | 0.03 [0.00, 0.43] |
| 9.2 G vs docetaxel = 1st line | 1 | 85 | Risk Ratio (M‐H, Fixed, 95% CI) | 0.15 [0.04, 0.63] |
| 9.3 G vs docetaxel = 2nd line | 2 | 1582 | Risk Ratio (M‐H, Fixed, 95% CI) | 0.04 [0.02, 0.06] |
| 10 Leukopenia Show forest plot | 2 | 324 | Risk Ratio (M‐H, Fixed, 95% CI) | 0.03 [0.00, 0.22] |
| 10.1 G vs vinorelbine = 1st line | 1 | 190 | Risk Ratio (M‐H, Fixed, 95% CI) | 0.07 [0.00, 1.18] |
| 10.2 G vs docetaxel = 2nd line | 1 | 134 | Risk Ratio (M‐H, Fixed, 95% CI) | 0.02 [0.00, 0.32] |
| 11 Febrile neutropenia Show forest plot | 3 | 1768 | Risk Ratio (M‐H, Fixed, 95% CI) | 0.12 [0.06, 0.23] |
| 11.1 G vs vinorelbine = 1st line | 1 | 190 | Risk Ratio (M‐H, Fixed, 95% CI) | 0.07 [0.00, 1.18] |
| 11.2 G vs docetaxel = 2nd line | 2 | 1578 | Risk Ratio (M‐H, Fixed, 95% CI) | 0.13 [0.06, 0.24] |
| 12 Pruritus Show forest plot | 1 | 139 | Risk Ratio (M‐H, Fixed, 95% CI) | 5.22 [0.26, 106.74] |
| 12.1 G vs docetaxel = 2nd line | 1 | 139 | Risk Ratio (M‐H, Fixed, 95% CI) | 5.22 [0.26, 106.74] |
| 13 Diarrhoea Show forest plot | 4 | 1858 | Risk Ratio (M‐H, Fixed, 95% CI) | 0.81 [0.48, 1.34] |
| 13.1 G vs vinorelbine = 1st line | 1 | 190 | Risk Ratio (M‐H, Fixed, 95% CI) | 1.02 [0.26, 3.96] |
| 13.2 G vs docetaxel = 1st line | 1 | 85 | Risk Ratio (M‐H, Fixed, 95% CI) | 0.98 [0.14, 6.62] |
| 13.3 G vs docetaxel = 2nd line | 2 | 1583 | Risk Ratio (M‐H, Fixed, 95% CI) | 0.76 [0.43, 1.35] |
| 14 Vomiting Show forest plot | 2 | 1583 | Risk Ratio (M‐H, Fixed, 95% CI) | 0.55 [0.19, 1.63] |
| 14.1 G vs docetaxel = 2nd line | 2 | 1583 | Risk Ratio (M‐H, Fixed, 95% CI) | 0.55 [0.19, 1.63] |
| 15 Anorexia Show forest plot | 3 | 1719 | Risk Ratio (M‐H, Fixed, 95% CI) | 1.43 [0.61, 3.32] |
| 15.1 G vs vinorelbine = 1st line | 1 | 190 | Risk Ratio (M‐H, Fixed, 95% CI) | 1.02 [0.15, 7.10] |
| 15.2 G vs docetaxel = 1st line | 1 | 85 | Risk Ratio (M‐H, Fixed, 95% CI) | 0.0 [0.0, 0.0] |
| 15.3 G vs docetaxel = 2nd line | 1 | 1444 | Risk Ratio (M‐H, Fixed, 95% CI) | 1.54 [0.60, 3.95] |
| 16 Stomatitis Show forest plot | 1 | 1444 | Risk Ratio (M‐H, Fixed, 95% CI) | 0.14 [0.01, 2.71] |
| 16.1 G vs docetaxel = 2nd line | 1 | 1444 | Risk Ratio (M‐H, Fixed, 95% CI) | 0.14 [0.01, 2.71] |
| 17 Arthralgia/myalgia Show forest plot | 2 | 1529 | Risk Ratio (M‐H, Fixed, 95% CI) | 0.25 [0.03, 2.19] |
| 17.1 G vs docetaxel = 1st line | 1 | 85 | Risk Ratio (M‐H, Fixed, 95% CI) | 0.0 [0.0, 0.0] |
| 17.2 G vs docetaxel = 2nd line | 1 | 1444 | Risk Ratio (M‐H, Fixed, 95% CI) | 0.25 [0.03, 2.19] |
| 18 Peripheral oedema Show forest plot | 2 | 1634 | Risk Ratio (M‐H, Fixed, 95% CI) | 0.09 [0.00, 1.61] |
| 18.1 G vs vinorelbine = 1st line | 1 | 190 | Risk Ratio (M‐H, Fixed, 95% CI) | 0.0 [0.0, 0.0] |
| 18.2 G vs docetaxel = 2nd line | 1 | 1444 | Risk Ratio (M‐H, Fixed, 95% CI) | 0.09 [0.00, 1.61] |
| 19 Respiratory tract infection Show forest plot | 1 | 1444 | Risk Ratio (M‐H, Fixed, 95% CI) | 0.90 [0.52, 1.57] |
| 19.1 G vs docetaxel = 2nd line | 1 | 1444 | Risk Ratio (M‐H, Fixed, 95% CI) | 0.90 [0.52, 1.57] |
| 20 Dyspnoea Show forest plot | 3 | 1773 | Risk Ratio (M‐H, Fixed, 95% CI) | 0.82 [0.57, 1.16] |
| 20.1 G vs vinorelbine = 1st line | 1 | 190 | Risk Ratio (M‐H, Fixed, 95% CI) | 0.26 [0.03, 2.24] |
| 20.2 G vs docetaxel = 2nd line | 2 | 1583 | Risk Ratio (M‐H, Fixed, 95% CI) | 0.85 [0.59, 1.22] |
| 21 Cough Show forest plot | 2 | 1583 | Risk Ratio (M‐H, Fixed, 95% CI) | 1.18 [0.36, 3.84] |
| 21.1 G vs docetaxel = 2nd line | 2 | 1583 | Risk Ratio (M‐H, Fixed, 95% CI) | 1.18 [0.36, 3.84] |
| 22 Anaemia Show forest plot | 4 | 1853 | Risk Ratio (M‐H, Fixed, 95% CI) | 0.70 [0.36, 1.36] |
| 22.1 G vs vinorelbine = 1st line | 1 | 190 | Risk Ratio (M‐H, Fixed, 95% CI) | 0.34 [0.01, 8.25] |
| 22.2 G vs docetaxel = 1st line | 1 | 85 | Risk Ratio (M‐H, Fixed, 95% CI) | 0.14 [0.01, 2.62] |
| 22.3 G vs docetaxel = 2nd line | 2 | 1578 | Risk Ratio (M‐H, Fixed, 95% CI) | 0.86 [0.42, 1.75] |
| 23 Thrombocytopenia Show forest plot | 2 | 219 | Risk Ratio (M‐H, Fixed, 95% CI) | 3.0 [0.12, 72.35] |
| 23.1 G vs docetaxel = 1st line | 1 | 85 | Risk Ratio (M‐H, Fixed, 95% CI) | 0.0 [0.0, 0.0] |
| 23.2 G vs docetaxel = 2nd line | 1 | 134 | Risk Ratio (M‐H, Fixed, 95% CI) | 3.0 [0.12, 72.35] |
| 24 Hypokalaemia Show forest plot | 1 | 190 | Risk Ratio (M‐H, Fixed, 95% CI) | 1.02 [0.06, 16.09] |
| 24.1 G vs vinorelbine = 1st line | 1 | 190 | Risk Ratio (M‐H, Fixed, 95% CI) | 1.02 [0.06, 16.09] |
| 25 Pyrexia Show forest plot | 3 | 1773 | Risk Ratio (M‐H, Fixed, 95% CI) | 0.59 [0.14, 2.47] |
| 25.1 G vs vinorelbine = 1st line | 1 | 190 | Risk Ratio (M‐H, Fixed, 95% CI) | 1.02 [0.06, 16.09] |
| 25.2 G vs docetaxel = 2nd line | 2 | 1583 | Risk Ratio (M‐H, Fixed, 95% CI) | 0.49 [0.09, 2.67] |
| 26 Overall response rate Show forest plot | 2 | Risk Ratio (M‐H, Fixed, 95% CI) | Subtotals only | |
| 26.1 G vs docetaxel = 2nd line | 2 | 1607 | Risk Ratio (M‐H, Fixed, 95% CI) | 1.16 [0.85, 1.59] |
| 27 Disease control rate Show forest plot | 2 | Risk Ratio (M‐H, Fixed, 95% CI) | Subtotals only | |
| 27.1 G vs docetaxel = 1st line | 1 | 190 | Risk Ratio (M‐H, Fixed, 95% CI) | 0.82 [0.61, 1.10] |
| 27.2 G vs docetaxel = 2nd line | 1 | 141 | Risk Ratio (M‐H, Fixed, 95% CI) | 1.07 [0.82, 1.40] |
| 28 FACT‐L QOL improvement rate Show forest plot | 2 | 1656 | Mean Difference (IV, Fixed, 95% CI) | 10.50 [9.55, 11.45] |
| 28.1 G vs vinorelbine = 1st line | 1 | 190 | Mean Difference (IV, Fixed, 95% CI) | 13.4 [8.25, 18.55] |
| 28.2 G vs docetaxel = 2nd line | 1 | 1466 | Mean Difference (IV, Fixed, 95% CI) | 10.40 [9.43, 11.37] |
| 29 LCS QOL improvement rate Show forest plot | 2 | 1656 | Mean Difference (IV, Fixed, 95% CI) | 3.63 [3.08, 4.19] |
| 29.1 G vs vinorelbine = 1st line | 1 | 190 | Mean Difference (IV, Fixed, 95% CI) | 3.80 [2.42, 5.18] |
| 29.2 G vs docetaxel = 2nd line | 1 | 1466 | Mean Difference (IV, Fixed, 95% CI) | 3.60 [2.99, 4.21] |
| 30 TOI QOL improvement rate Show forest plot | 2 | 1656 | Mean Difference (IV, Random, 95% CI) | 9.87 [1.26, 18.48] |
| 30.1 G vs vinorelbine = 1st line | 1 | 190 | Mean Difference (IV, Random, 95% CI) | 16.60 [4.61, 28.59] |
| 30.2 G vs docetaxel = 2nd line | 1 | 1466 | Mean Difference (IV, Random, 95% CI) | 7.0 [5.97, 8.03] |
| 31 PSI QOL improvement rate Show forest plot | 1 | 190 | Mean Difference (IV, Fixed, 95% CI) | 5.60 [3.55, 7.65] |
| 31.1 G vs vinorelbine = 1st line | 1 | 190 | Mean Difference (IV, Fixed, 95% CI) | 5.60 [3.55, 7.65] |
| Outcome or subgroup title | No. of studies | No. of participants | Statistical method | Effect size |
| 1 HR Overall survival = 1st line Show forest plot | 4 | Hazard Ratio (Random, 95% CI) | 0.94 [0.82, 1.06] | |
| 1.1 G vs carboplatin + paclitaxel | 2 | Hazard Ratio (Random, 95% CI) | 1.09 [0.64, 1.84] | |
| 1.2 G vs gemcitabine + cisplatin | 1 | Hazard Ratio (Random, 95% CI) | 0.93 [0.72, 1.21] | |
| 1.3 G vs pemetrexed + cisplatin | 1 | Hazard Ratio (Random, 95% CI) | 0.94 [0.68, 1.30] | |
| 2 HR Overall survival = 2nd line Show forest plot | 3 | Hazard Ratio (Random, 95% CI) | 0.94 [0.79, 1.12] | |
| 2.1 G vs docetaxel | 2 | Hazard Ratio (Random, 95% CI) | 0.97 [0.80, 1.17] | |
| 2.2 G vs pemetrexed | 1 | Hazard Ratio (Random, 95% CI) | 0.80 [0.50, 1.28] | |
| 3 HR Overall survival = Maintenance Show forest plot | 1 | Hazard Ratio (Random, 95% CI) | 2.15 [0.83, 5.55] | |
| 3.1 G vs pemetrexed | 1 | Hazard Ratio (Random, 95% CI) | 2.15 [0.83, 5.55] | |
| 4 HR Progression‐free survival = 1st line Show forest plot | 5 | Hazard Ratio (Random, 95% CI) | 0.65 [0.43, 0.98] | |
| 4.1 G vs carboplatin + paclitaxel | 2 | Hazard Ratio (Random, 95% CI) | 0.48 [0.20, 1.15] | |
| 4.2 G vs cisplatin + docetaxel | 1 | Hazard Ratio (Random, 95% CI) | 0.49 [0.34, 0.71] | |
| 4.3 G vs gemcitabine + cisplatin | 1 | Hazard Ratio (Random, 95% CI) | 1.20 [0.95, 1.52] | |
| 4.4 G vs pemetrexed + cisplatin | 1 | Hazard Ratio (Random, 95% CI) | 0.85 [0.64, 1.14] | |
| 5 HR Progression‐free survival = 2nd line Show forest plot | 3 | Hazard Ratio (Random, 95% CI) | 0.71 [0.57, 0.88] | |
| 5.1 G vs docetaxel | 2 | Hazard Ratio (Random, 95% CI) | 0.78 [0.65, 0.94] | |
| 5.2 G vs pemetrexed | 1 | Hazard Ratio (Random, 95% CI) | 0.54 [0.37, 0.79] | |
| 6 HR Progression‐free survival = Maintenance Show forest plot | 1 | Hazard Ratio (Random, 95% CI) | 0.53 [0.27, 1.04] | |
| 6.1 G vs pemetrexed | 1 | Hazard Ratio (Random, 95% CI) | 0.53 [0.27, 1.04] | |
| 7 1‐year survival rate Show forest plot | 7 | Risk Ratio (M‐H, Fixed, 95% CI) | Subtotals only | |
| 7.1 1st line | 3 | 1754 | Risk Ratio (M‐H, Fixed, 95% CI) | 1.03 [0.97, 1.09] |
| 7.2 2nd line | 3 | 681 | Risk Ratio (M‐H, Fixed, 95% CI) | 0.94 [0.81, 1.11] |
| 7.3 Maintenance | 1 | 70 | Risk Ratio (M‐H, Fixed, 95% CI) | 0.79 [0.65, 0.98] |
| 8 Nausea Show forest plot | 10 | 2898 | Risk Ratio (M‐H, Fixed, 95% CI) | 0.34 [0.17, 0.64] |
| 8.1 1st line | 4 | 1912 | Risk Ratio (M‐H, Fixed, 95% CI) | 0.19 [0.06, 0.54] |
| 8.2 2nd line | 5 | 916 | Risk Ratio (M‐H, Fixed, 95% CI) | 0.59 [0.22, 1.60] |
| 8.3 Maintenance | 1 | 70 | Risk Ratio (M‐H, Fixed, 95% CI) | 0.53 [0.09, 2.98] |
| 9 Vomiting Show forest plot | 6 | 2447 | Risk Ratio (M‐H, Random, 95% CI) | 0.19 [0.05, 0.77] |
| 9.1 1st line | 3 | 1737 | Risk Ratio (M‐H, Random, 95% CI) | 0.08 [0.02, 0.29] |
| 9.2 2nd line | 2 | 640 | Risk Ratio (M‐H, Random, 95% CI) | 1.31 [0.30, 5.77] |
| 9.3 Maintenance | 1 | 70 | Risk Ratio (M‐H, Random, 95% CI) | 0.20 [0.02, 1.69] |
| 10 Anorexia Show forest plot | 10 | 2950 | Risk Ratio (M‐H, Fixed, 95% CI) | 0.36 [0.27, 0.49] |
| 10.1 1st line | 4 | 1964 | Risk Ratio (M‐H, Fixed, 95% CI) | 0.32 [0.23, 0.45] |
| 10.2 2nd line | 5 | 916 | Risk Ratio (M‐H, Fixed, 95% CI) | 0.53 [0.27, 1.02] |
| 10.3 Maintenance | 1 | 70 | Risk Ratio (M‐H, Fixed, 95% CI) | 0.79 [0.05, 12.20] |
| 11 Fatigue Show forest plot | 10 | 1960 | Risk Ratio (M‐H, Fixed, 95% CI) | 0.32 [0.22, 0.46] |
| 11.1 1st line | 4 | 943 | Risk Ratio (M‐H, Fixed, 95% CI) | 0.26 [0.17, 0.40] |
| 11.2 2nd line | 4 | 759 | Risk Ratio (M‐H, Fixed, 95% CI) | 0.26 [0.06, 1.03] |
| 11.3 Maintenance | 2 | 258 | Risk Ratio (M‐H, Fixed, 95% CI) | 1.09 [0.41, 2.89] |
| 12 Arthralgia/myalgia Show forest plot | 4 | 2063 | Risk Ratio (M‐H, Fixed, 95% CI) | 0.14 [0.03, 0.61] |
| 12.1 1st line | 2 | 1423 | Risk Ratio (M‐H, Fixed, 95% CI) | 0.14 [0.03, 0.61] |
| 12.2 2nd line | 2 | 640 | Risk Ratio (M‐H, Fixed, 95% CI) | 0.0 [0.0, 0.0] |
| 13 Asthenia Show forest plot | 4 | 1755 | Risk Ratio (M‐H, Fixed, 95% CI) | 0.22 [0.08, 0.58] |
| 13.1 1st line | 3 | 1598 | Risk Ratio (M‐H, Fixed, 95% CI) | 0.21 [0.07, 0.61] |
| 13.2 2nd line | 1 | 157 | Risk Ratio (M‐H, Fixed, 95% CI) | 0.31 [0.03, 2.94] |
| 14 Neurotoxicity Show forest plot | 4 | 1797 | Risk Ratio (M‐H, Fixed, 95% CI) | 0.07 [0.02, 0.24] |
| 14.1 1st line | 2 | 1505 | Risk Ratio (M‐H, Fixed, 95% CI) | 0.07 [0.02, 0.24] |
| 14.2 2nd line | 2 | 292 | Risk Ratio (M‐H, Fixed, 95% CI) | 0.0 [0.0, 0.0] |
| 15 Neutropenia Show forest plot | 10 | 3061 | Risk Ratio (M‐H, Random, 95% CI) | 0.11 [0.05, 0.27] |
| 15.1 1st line | 5 | 2139 | Risk Ratio (M‐H, Random, 95% CI) | 0.05 [0.03, 0.07] |
| 15.2 2nd line | 3 | 664 | Risk Ratio (M‐H, Random, 95% CI) | 0.12 [0.08, 0.18] |
| 15.3 Maintenance | 2 | 258 | Risk Ratio (M‐H, Random, 95% CI) | 1.20 [0.49, 2.96] |
| 16 Anaemia Show forest plot | 9 | 2538 | Risk Ratio (M‐H, Fixed, 95% CI) | 0.18 [0.12, 0.29] |
| 16.1 1st line | 5 | 2139 | Risk Ratio (M‐H, Fixed, 95% CI) | 0.16 [0.10, 0.26] |
| 16.2 2nd line | 2 | 141 | Risk Ratio (M‐H, Fixed, 95% CI) | 0.20 [0.02, 1.61] |
| 16.3 Maintenance | 2 | 258 | Risk Ratio (M‐H, Fixed, 95% CI) | 1.36 [0.24, 7.87] |
| 17 Leukopenia Show forest plot | 4 | 2086 | Risk Ratio (M‐H, Random, 95% CI) | 0.07 [0.02, 0.23] |
| 17.1 1st line | 3 | 1603 | Risk Ratio (M‐H, Random, 95% CI) | 0.04 [0.02, 0.08] |
| 17.2 2nd line | 1 | 483 | Risk Ratio (M‐H, Random, 95% CI) | 0.16 [0.09, 0.26] |
| 18 Thrombocytopenia Show forest plot | 7 | 1070 | Risk Ratio (M‐H, Fixed, 95% CI) | 0.32 [0.14, 0.72] |
| 18.1 1st line | 2 | 536 | Risk Ratio (M‐H, Fixed, 95% CI) | 0.14 [0.04, 0.51] |
| 18.2 2nd line | 3 | 276 | Risk Ratio (M‐H, Fixed, 95% CI) | 0.25 [0.03, 2.15] |
| 18.3 Maintenance | 2 | 258 | Risk Ratio (M‐H, Fixed, 95% CI) | 3.63 [0.42, 31.44] |
| 19 Febrile neutropenia Show forest plot | 2 | 1679 | Risk Ratio (M‐H, Fixed, 95% CI) | 0.09 [0.03, 0.28] |
| 19.1 1st line | 1 | 1196 | Risk Ratio (M‐H, Fixed, 95% CI) | 0.06 [0.01, 0.43] |
| 19.2 2nd line | 1 | 483 | Risk Ratio (M‐H, Fixed, 95% CI) | 0.12 [0.03, 0.49] |
| 20 Skin rash Show forest plot | 10 | 3174 | Risk Ratio (M‐H, Random, 95% CI) | 3.11 [1.28, 7.55] |
| 20.1 1st line | 5 | 2141 | Risk Ratio (M‐H, Random, 95% CI) | 5.09 [2.21, 11.72] |
| 20.2 2nd line | 3 | 775 | Risk Ratio (M‐H, Random, 95% CI) | 2.54 [0.46, 13.95] |
| 20.3 Maintenance | 2 | 258 | Risk Ratio (M‐H, Random, 95% CI) | 0.91 [0.24, 3.44] |
| 21 Diarrhoea Show forest plot | 10 | 3055 | Risk Ratio (M‐H, Fixed, 95% CI) | 2.79 [1.57, 4.94] |
| 21.1 1st line | 5 | 2139 | Risk Ratio (M‐H, Fixed, 95% CI) | 2.74 [1.43, 5.27] |
| 21.2 2nd line | 5 | 916 | Risk Ratio (M‐H, Fixed, 95% CI) | 2.93 [0.88, 9.73] |
| 22 Increased ALT Show forest plot | 7 | 1542 | Risk Ratio (M‐H, Fixed, 95% CI) | 10.03 [5.23, 19.26] |
| 22.1 1st line | 4 | 943 | Risk Ratio (M‐H, Fixed, 95% CI) | 11.66 [5.13, 26.49] |
| 22.2 2nd line | 2 | 529 | Risk Ratio (M‐H, Fixed, 95% CI) | 13.22 [3.18, 54.99] |
| 22.3 Maintenance | 1 | 70 | Risk Ratio (M‐H, Fixed, 95% CI) | 0.27 [0.01, 6.33] |
| 23 Increased AST Show forest plot | 4 | 762 | Risk Ratio (M‐H, Fixed, 95% CI) | 7.73 [2.78, 21.46] |
| 23.1 1st line | 3 | 716 | Risk Ratio (M‐H, Fixed, 95% CI) | 7.73 [2.78, 21.46] |
| 23.2 2nd line | 1 | 46 | Risk Ratio (M‐H, Fixed, 95% CI) | 0.0 [0.0, 0.0] |
| 24 Overall response rate Show forest plot | 14 | Risk Ratio (M‐H, Random, 95% CI) | Subtotals only | |
| 24.1 1st line | 6 | 2158 | Risk Ratio (M‐H, Random, 95% CI) | 1.43 [1.13, 1.82] |
| 24.2 2nd line | 6 | 921 | Risk Ratio (M‐H, Random, 95% CI) | 1.43 [0.92, 2.22] |
| 24.3 Maintenance | 2 | 258 | Risk Ratio (M‐H, Random, 95% CI) | 0.88 [0.41, 1.87] |
| 25 Stable disease Show forest plot | 9 | Risk Ratio (M‐H, Random, 95% CI) | Subtotals only | |
| 25.1 1st line | 5 | 941 | Risk Ratio (M‐H, Random, 95% CI) | 0.47 [0.34, 0.64] |
| 25.2 2nd line | 2 | 143 | Risk Ratio (M‐H, Random, 95% CI) | 1.08 [0.64, 1.82] |
| 25.3 Maintenance | 2 | 258 | Risk Ratio (M‐H, Random, 95% CI) | 0.64 [0.44, 0.93] |
| 26 Disease control rate Show forest plot | 9 | Risk Ratio (M‐H, Random, 95% CI) | Subtotals only | |
| 26.1 1st line | 5 | 1848 | Risk Ratio (M‐H, Random, 95% CI) | 0.99 [0.86, 1.13] |
| 26.2 2nd line | 3 | 528 | Risk Ratio (M‐H, Random, 95% CI) | 0.99 [0.78, 1.25] |
| 26.3 Maintenance | 1 | 188 | Risk Ratio (M‐H, Random, 95% CI) | 0.65 [0.49, 0.85] |
| 27 FACT‐L QOL improvement rate Show forest plot | 3 | 1670 | Mean Difference (IV, Fixed, 95% CI) | 9.50 [7.95, 11.05] |
| 27.1 1st line | 1 | 1151 | Mean Difference (IV, Fixed, 95% CI) | 0.0 [0.0, 0.0] |
| 27.2 2nd line | 2 | 519 | Mean Difference (IV, Fixed, 95% CI) | 9.50 [7.95, 11.05] |
| 28 LCS QOL improvement rate Show forest plot | 3 | 1748 | Mean Difference (IV, Fixed, 95% CI) | 2.30 [1.53, 3.07] |
| 28.1 1st line | 1 | 1151 | Mean Difference (IV, Fixed, 95% CI) | 0.0 [0.0, 0.0] |
| 28.2 2nd line | 2 | 597 | Mean Difference (IV, Fixed, 95% CI) | 2.30 [1.53, 3.07] |
| 29 TOI QOL improvement rate Show forest plot | 3 | 1670 | Mean Difference (IV, Fixed, 95% CI) | 11.8 [9.17, 14.43] |
| 29.1 1st line | 1 | 1151 | Mean Difference (IV, Fixed, 95% CI) | 0.0 [0.0, 0.0] |
| 29.2 2nd line | 2 | 519 | Mean Difference (IV, Fixed, 95% CI) | 11.8 [9.17, 14.43] |
| Outcome or subgroup title | No. of studies | No. of participants | Statistical method | Effect size |
| 1 HR Overall survival = 1st line Show forest plot | 5 | Hazard Ratio (Fixed, 95% CI) | 0.97 [0.77, 1.21] | |
| 1.1 Biomarker driven selection | 2 | Hazard Ratio (Fixed, 95% CI) | 0.98 [0.72, 1.33] | |
| 1.2 Clinical feature driven selection | 3 | Hazard Ratio (Fixed, 95% CI) | 0.95 [0.68, 1.33] | |
| 2 HR Overall survival = 2nd line Show forest plot | 1 | Hazard Ratio (Fixed, 95% CI) | 0.83 [0.41, 1.66] | |
| 2.1 G vs docetaxel | 1 | Hazard Ratio (Fixed, 95% CI) | 0.83 [0.41, 1.66] | |
| 3 HR Progression‐free survival = 1st line Show forest plot | 5 | Hazard Ratio (Random, 95% CI) | 0.47 [0.36, 0.61] | |
| 3.1 Biomarker driven selection | 2 | Hazard Ratio (Random, 95% CI) | 0.39 [0.26, 0.59] | |
| 3.2 Clinical feature driven selection | 3 | Hazard Ratio (Random, 95% CI) | 0.53 [0.41, 0.70] | |
| 4 HR Progression‐free survival = 2nd line Show forest plot | 2 | Hazard Ratio (Fixed, 95% CI) | 0.24 [0.12, 0.47] | |
| 4.1 G vs docetaxel | 1 | Hazard Ratio (Fixed, 95% CI) | 0.16 [0.05, 0.50] | |
| 4.2 G vs pemetrexed | 1 | Hazard Ratio (Fixed, 95% CI) | 0.30 [0.13, 0.70] | |
| 5 Overall response rate Show forest plot | 7 | 758 | Risk Ratio (M‐H, Random, 95% CI) | 1.71 [1.34, 2.19] |
| 5.1 First‐line biomarker driven selection | 2 | 347 | Risk Ratio (M‐H, Random, 95% CI) | 2.23 [1.75, 2.85] |
| 5.2 First‐line, clinical feature driven selection | 3 | 353 | Risk Ratio (M‐H, Random, 95% CI) | 1.45 [1.05, 1.99] |
| 5.3 2nd line | 2 | 58 | Risk Ratio (M‐H, Random, 95% CI) | 1.65 [0.88, 3.09] |
| 6 Stable disease Show forest plot | 3 | 397 | Risk Ratio (M‐H, Random, 95% CI) | 0.52 [0.28, 0.97] |
| 6.1 First‐line, biomarker driven selection | 2 | 347 | Risk Ratio (M‐H, Random, 95% CI) | 0.47 [0.22, 0.98] |
| 6.2 First‐line, clinical feature driven selection | 1 | 50 | Risk Ratio (M‐H, Random, 95% CI) | 0.87 [0.26, 2.85] |
| 7 Disease control rate Show forest plot | 5 | 2001 | Risk Ratio (M‐H, Random, 95% CI) | 1.05 [0.93, 1.19] |
| 7.1 First‐line, biomarker driven selection | 2 | 347 | Risk Ratio (M‐H, Random, 95% CI) | 1.15 [1.05, 1.26] |
| 7.2 First‐line, clinical feature driven selection | 2 | 1267 | Risk Ratio (M‐H, Random, 95% CI) | 0.93 [0.87, 0.99] |
| 7.3 Second‐line | 1 | 387 | Risk Ratio (M‐H, Random, 95% CI) | 1.03 [0.77, 1.36] |
| Outcome or subgroup title | No. of studies | No. of participants | Statistical method | Effect size |
| 1 1‐year survival rate Show forest plot | 2 | 424 | Risk Ratio (M‐H, Fixed, 95% CI) | 0.83 [0.61, 1.11] |
| 1.1 2nd line | 2 | 424 | Risk Ratio (M‐H, Fixed, 95% CI) | 0.83 [0.61, 1.11] |
| 2 Skin rash Show forest plot | 2 | 290 | Risk Ratio (M‐H, Fixed, 95% CI) | 8.13 [1.51, 43.72] |
| 2.1 2nd line | 1 | 209 | Risk Ratio (M‐H, Fixed, 95% CI) | 6.80 [0.85, 54.32] |
| 2.2 Maintenance | 1 | 81 | Risk Ratio (M‐H, Fixed, 95% CI) | 10.41 [0.61, 176.21] |
| 3 Acne Show forest plot | 1 | 209 | Risk Ratio (M‐H, Fixed, 95% CI) | 4.86 [0.24, 100.02] |
| 3.1 2nd line | 1 | 209 | Risk Ratio (M‐H, Fixed, 95% CI) | 4.86 [0.24, 100.02] |
| 4 Pruritus Show forest plot | 1 | 209 | Risk Ratio (M‐H, Fixed, 95% CI) | 2.92 [0.12, 70.77] |
| 4.1 2nd line | 1 | 209 | Risk Ratio (M‐H, Fixed, 95% CI) | 2.92 [0.12, 70.77] |
| 5 Diarrhoea Show forest plot | 3 | 521 | Risk Ratio (M‐H, Fixed, 95% CI) | 8.36 [1.58, 44.34] |
| 5.1 2nd line | 3 | 521 | Risk Ratio (M‐H, Fixed, 95% CI) | 8.36 [1.58, 44.34] |
| 6 Nausea Show forest plot | 1 | 209 | Risk Ratio (M‐H, Fixed, 95% CI) | 0.97 [0.06, 15.33] |
| 6.1 2nd line | 1 | 209 | Risk Ratio (M‐H, Fixed, 95% CI) | 0.97 [0.06, 15.33] |
| 7 Vomiting Show forest plot | 1 | 209 | Risk Ratio (M‐H, Fixed, 95% CI) | 0.0 [0.0, 0.0] |
| 7.1 2nd line | 1 | 209 | Risk Ratio (M‐H, Fixed, 95% CI) | 0.0 [0.0, 0.0] |
| 8 Anorexia Show forest plot | 1 | 209 | Risk Ratio (M‐H, Fixed, 95% CI) | 2.92 [0.12, 70.77] |
| 8.1 2nd line | 1 | 209 | Risk Ratio (M‐H, Fixed, 95% CI) | 2.92 [0.12, 70.77] |
| 9 Asthenia Show forest plot | 1 | 209 | Risk Ratio (M‐H, Fixed, 95% CI) | 2.92 [0.12, 70.77] |
| 9.1 2nd line | 1 | 209 | Risk Ratio (M‐H, Fixed, 95% CI) | 2.92 [0.12, 70.77] |
| 10 Overall response rate Show forest plot | 3 | Risk Ratio (M‐H, Fixed, 95% CI) | Subtotals only | |
| 10.1 2nd line | 2 | 424 | Risk Ratio (M‐H, Fixed, 95% CI) | 0.92 [0.58, 1.46] |
| 10.2 Maintenance | 1 | 96 | Risk Ratio (M‐H, Fixed, 95% CI) | 1.0 [0.35, 2.88] |
| 11 Partial response Show forest plot | 1 | 216 | Risk Ratio (M‐H, Fixed, 95% CI) | 0.75 [0.34, 1.65] |
| 11.1 2nd line | 1 | 216 | Risk Ratio (M‐H, Fixed, 95% CI) | 0.75 [0.34, 1.65] |
| 12 FACT‐L Symptom improvement rate Show forest plot | 2 | 356 | Mean Difference (IV, Fixed, 95% CI) | 3.70 [‐7.28, 14.69] |
| 12.1 2nd line | 2 | 356 | Mean Difference (IV, Fixed, 95% CI) | 3.70 [‐7.28, 14.69] |
| 13 TOI QOL improvement rate Show forest plot | 2 | 424 | Mean Difference (IV, Fixed, 95% CI) | 7.38 [‐2.30, 17.05] |
| 13.1 2nd line | 2 | 424 | Mean Difference (IV, Fixed, 95% CI) | 7.38 [‐2.30, 17.05] |
| Outcome or subgroup title | No. of studies | No. of participants | Statistical method | Effect size |
| 1 HR Progression‐free survival Show forest plot | 2 | Hazard Ratio (Random, 95% CI) | Subtotals only | |
| 1.1 1st line | 1 | Hazard Ratio (Random, 95% CI) | 0.69 [0.49, 0.96] | |
| 1.2 2nd line | 1 | Hazard Ratio (Random, 95% CI) | 0.65 [0.43, 0.97] | |
| 2 1‐year survival rate Show forest plot | 2 | 163 | Risk Ratio (M‐H, Fixed, 95% CI) | 1.15 [0.92, 1.43] |
| 2.1 2nd line | 2 | 163 | Risk Ratio (M‐H, Fixed, 95% CI) | 1.15 [0.92, 1.43] |
| 3 1‐year progression‐free survival Show forest plot | 2 | 163 | Risk Ratio (M‐H, Fixed, 95% CI) | 2.29 [1.38, 3.80] |
| 3.1 2nd line | 2 | 163 | Risk Ratio (M‐H, Fixed, 95% CI) | 2.29 [1.38, 3.80] |
| 4 Skin rash Show forest plot | 3 | 329 | Risk Ratio (M‐H, Fixed, 95% CI) | 1.34 [0.39, 4.57] |
| 4.1 1st line | 2 | 281 | Risk Ratio (M‐H, Fixed, 95% CI) | 1.01 [0.23, 4.51] |
| 4.2 2nd line | 1 | 48 | Risk Ratio (M‐H, Fixed, 95% CI) | 2.57 [0.25, 26.47] |
| 5 Diarrhoea Show forest plot | 3 | 329 | Risk Ratio (M‐H, Fixed, 95% CI) | 1.16 [0.21, 6.34] |
| 5.1 1st line | 2 | 281 | Risk Ratio (M‐H, Fixed, 95% CI) | 1.16 [0.21, 6.34] |
| 5.2 2nd line | 1 | 48 | Risk Ratio (M‐H, Fixed, 95% CI) | 0.0 [0.0, 0.0] |
| 6 Constipation Show forest plot | 1 | 48 | Risk Ratio (M‐H, Fixed, 95% CI) | 0.42 [0.02, 9.92] |
| 6.1 2nd line | 1 | 48 | Risk Ratio (M‐H, Fixed, 95% CI) | 0.42 [0.02, 9.92] |
| 7 Fatigue Show forest plot | 3 | 329 | Risk Ratio (M‐H, Fixed, 95% CI) | 2.68 [0.60, 11.90] |
| 7.1 1st line | 2 | 281 | Risk Ratio (M‐H, Fixed, 95% CI) | 2.68 [0.60, 11.90] |
| 7.2 2nd line | 1 | 48 | Risk Ratio (M‐H, Fixed, 95% CI) | 0.0 [0.0, 0.0] |
| 8 Leukopenia Show forest plot | 2 | 138 | Risk Ratio (M‐H, Fixed, 95% CI) | 1.50 [0.48, 4.70] |
| 8.1 1st line | 1 | 90 | Risk Ratio (M‐H, Fixed, 95% CI) | 1.25 [0.36, 4.35] |
| 8.2 2nd line | 1 | 48 | Risk Ratio (M‐H, Fixed, 95% CI) | 3.82 [0.16, 89.24] |
| 9 Anaemia Show forest plot | 3 | 329 | Risk Ratio (M‐H, Fixed, 95% CI) | 3.22 [0.66, 15.72] |
| 9.1 1st line | 2 | 281 | Risk Ratio (M‐H, Fixed, 95% CI) | 3.06 [0.49, 19.15] |
| 9.2 2nd line | 1 | 48 | Risk Ratio (M‐H, Fixed, 95% CI) | 3.82 [0.16, 89.24] |
| 10 Thrombocytopenia Show forest plot | 2 | 138 | Risk Ratio (M‐H, Fixed, 95% CI) | 0.0 [0.0, 0.0] |
| 10.1 1st line | 1 | 90 | Risk Ratio (M‐H, Fixed, 95% CI) | 0.0 [0.0, 0.0] |
| 10.2 2nd line | 1 | 48 | Risk Ratio (M‐H, Fixed, 95% CI) | 0.0 [0.0, 0.0] |
| 11 Neutropenia Show forest plot | 3 | 329 | Risk Ratio (M‐H, Fixed, 95% CI) | 1.47 [0.71, 3.02] |
| 11.1 1st line | 2 | 281 | Risk Ratio (M‐H, Fixed, 95% CI) | 1.36 [0.65, 2.88] |
| 11.2 2nd line | 1 | 48 | Risk Ratio (M‐H, Fixed, 95% CI) | 3.82 [0.16, 89.24] |
| 12 Increased ALT Show forest plot | 2 | 281 | Risk Ratio (M‐H, Fixed, 95% CI) | 2.57 [1.09, 6.04] |
| 12.1 1st line | 2 | 281 | Risk Ratio (M‐H, Fixed, 95% CI) | 2.57 [1.09, 6.04] |
| 13 Increased AST Show forest plot | 2 | 281 | Risk Ratio (M‐H, Fixed, 95% CI) | 1.47 [0.56, 3.88] |
| 13.1 1st line | 2 | 281 | Risk Ratio (M‐H, Fixed, 95% CI) | 1.47 [0.56, 3.88] |
| 14 Vomiting Show forest plot | 1 | 191 | Risk Ratio (M‐H, Fixed, 95% CI) | 1.56 [0.06, 37.74] |
| 14.1 1st line | 1 | 191 | Risk Ratio (M‐H, Fixed, 95% CI) | 1.56 [0.06, 37.74] |
| 15 Nausea Show forest plot | 1 | 191 | Risk Ratio (M‐H, Fixed, 95% CI) | 1.56 [0.06, 37.74] |
| 15.1 1st line | 1 | 191 | Risk Ratio (M‐H, Fixed, 95% CI) | 1.56 [0.06, 37.74] |
| 16 Overall response rate Show forest plot | 2 | 281 | Risk Ratio (M‐H, Fixed, 95% CI) | 1.02 [0.89, 1.17] |
| 16.1 1st line | 2 | 281 | Risk Ratio (M‐H, Fixed, 95% CI) | 1.02 [0.89, 1.17] |
| 17 Partial response Show forest plot | 4 | 444 | Risk Ratio (M‐H, Fixed, 95% CI) | 1.01 [0.88, 1.16] |
| 17.1 1st line | 2 | 281 | Risk Ratio (M‐H, Fixed, 95% CI) | 1.01 [0.88, 1.16] |
| 17.2 2nd line | 2 | 163 | Risk Ratio (M‐H, Fixed, 95% CI) | 1.02 [0.71, 1.47] |
| 18 Stable disease Show forest plot | 4 | 444 | Risk Ratio (M‐H, Fixed, 95% CI) | 0.97 [0.69, 1.37] |
| 18.1 1st line | 2 | 281 | Risk Ratio (M‐H, Fixed, 95% CI) | 0.67 [0.39, 1.16] |
| 18.2 2nd line | 2 | 163 | Risk Ratio (M‐H, Fixed, 95% CI) | 1.30 [0.84, 2.03] |
| Outcome or subgroup title | No. of studies | No. of participants | Statistical method | Effect size |
| 1 HR Overall survival Show forest plot | 3 | Hazard Ratio (Fixed, 95% CI) | Subtotals only | |
| 1.1 1st line [Asian] | 2 | Hazard Ratio (Fixed, 95% CI) | 0.86 [0.72, 1.02] | |
| 1.2 2nd line [EGFRm] | 1 | Hazard Ratio (Fixed, 95% CI) | 1.62 [1.05, 2.50] | |
| 2 HR Progression‐free survival Show forest plot | 3 | Hazard Ratio (Fixed, 95% CI) | Subtotals only | |
| 2.1 1st line [Asian] | 2 | Hazard Ratio (Fixed, 95% CI) | 0.69 [0.62, 0.77] | |
| 2.2 2nd line [EGFRm] | 1 | Hazard Ratio (Fixed, 95% CI) | 0.86 [0.65, 1.13] | |
| 3 1‐year survival rate Show forest plot | 2 | 1411 | Risk Ratio (M‐H, Fixed, 95% CI) | 0.95 [0.84, 1.08] |
| 3.1 1st line | 2 | 1411 | Risk Ratio (M‐H, Fixed, 95% CI) | 0.95 [0.84, 1.08] |
| 4 Skin rash Show forest plot | 5 | 2379 | Risk Ratio (M‐H, Fixed, 95% CI) | 2.98 [1.54, 5.77] |
| 4.1 1st line | 2 | 1400 | Risk Ratio (M‐H, Fixed, 95% CI) | 2.64 [1.23, 5.63] |
| 4.2 1st line [Asian] | 2 | 715 | Risk Ratio (M‐H, Fixed, 95% CI) | 4.23 [1.08, 16.54] |
| 4.3 2nd line [EGFRm] | 1 | 264 | Risk Ratio (M‐H, Fixed, 95% CI) | 0.0 [0.0, 0.0] |
| 5 Acne Show forest plot | 3 | 1664 | Risk Ratio (M‐H, Fixed, 95% CI) | 4.95 [1.09, 22.51] |
| 5.1 1st line | 2 | 1400 | Risk Ratio (M‐H, Fixed, 95% CI) | 5.59 [0.99, 31.60] |
| 5.2 2nd line [EGFRm] | 1 | 264 | Risk Ratio (M‐H, Fixed, 95% CI) | 3.0 [0.12, 72.98] |
| 6 Diarrhoea Show forest plot | 5 | 2379 | Risk Ratio (M‐H, Random, 95% CI) | 2.04 [1.17, 3.58] |
| 6.1 1st line | 2 | 1400 | Risk Ratio (M‐H, Random, 95% CI) | 2.44 [1.17, 5.09] |
| 6.2 1st line [Asian] | 2 | 715 | Risk Ratio (M‐H, Random, 95% CI) | 0.97 [0.32, 2.92] |
| 6.3 2nd line [EGFRm] | 1 | 264 | Risk Ratio (M‐H, Random, 95% CI) | 3.0 [0.32, 28.47] |
| 7 Pruritus Show forest plot | 2 | 1400 | Risk Ratio (M‐H, Fixed, 95% CI) | 1.99 [0.18, 21.89] |
| 7.1 1st line | 2 | 1400 | Risk Ratio (M‐H, Fixed, 95% CI) | 1.99 [0.18, 21.89] |
| 8 Vomiting Show forest plot | 5 | 2379 | Risk Ratio (M‐H, Fixed, 95% CI) | 1.24 [0.81, 1.89] |
| 8.1 1st line | 2 | 1400 | Risk Ratio (M‐H, Fixed, 95% CI) | 1.05 [0.53, 2.06] |
| 8.2 1st line [Asian] | 2 | 715 | Risk Ratio (M‐H, Fixed, 95% CI) | 1.28 [0.70, 2.32] |
| 8.3 2nd line [EGFRm] | 1 | 264 | Risk Ratio (M‐H, Fixed, 95% CI) | 2.0 [0.51, 7.83] |
| 9 Nausea Show forest plot | 5 | 2379 | Risk Ratio (M‐H, Fixed, 95% CI) | 0.82 [0.58, 1.17] |
| 9.1 1st line | 2 | 1400 | Risk Ratio (M‐H, Fixed, 95% CI) | 1.06 [0.51, 2.18] |
| 9.2 1st line [Asian] | 2 | 715 | Risk Ratio (M‐H, Fixed, 95% CI) | 0.74 [0.48, 1.14] |
| 9.3 2nd line [EGFRm] | 1 | 264 | Risk Ratio (M‐H, Fixed, 95% CI) | 0.83 [0.26, 2.66] |
| 10 Anorexia Show forest plot | 5 | 2379 | Risk Ratio (M‐H, Fixed, 95% CI) | 0.82 [0.55, 1.20] |
| 10.1 1st line | 2 | 1400 | Risk Ratio (M‐H, Fixed, 95% CI) | 1.98 [0.36, 10.76] |
| 10.2 1st line [Asian] | 2 | 715 | Risk Ratio (M‐H, Fixed, 95% CI) | 0.80 [0.53, 1.20] |
| 10.3 2nd line [EGFRm] | 1 | 264 | Risk Ratio (M‐H, Fixed, 95% CI) | 0.33 [0.04, 3.16] |
| 11 Asthenia Show forest plot | 3 | 1664 | Risk Ratio (M‐H, Random, 95% CI) | 0.80 [0.21, 2.99] |
| 11.1 1st line | 2 | 1400 | Risk Ratio (M‐H, Random, 95% CI) | 0.90 [0.10, 7.76] |
| 11.2 2nd line [EGFRm] | 1 | 264 | Risk Ratio (M‐H, Random, 95% CI) | 0.5 [0.09, 2.68] |
| 12 Dyspnoea Show forest plot | 2 | 947 | Risk Ratio (M‐H, Fixed, 95% CI) | 1.00 [0.25, 3.96] |
| 12.1 1st line | 1 | 683 | Risk Ratio (M‐H, Fixed, 95% CI) | 1.99 [0.18, 21.89] |
| 12.2 2nd line [EGFRm] | 1 | 264 | Risk Ratio (M‐H, Fixed, 95% CI) | 0.67 [0.11, 3.93] |
| 13 Anaemia Show forest plot | 3 | 979 | Risk Ratio (M‐H, Fixed, 95% CI) | 0.74 [0.53, 1.03] |
| 13.1 1st line [Asian] | 2 | 715 | Risk Ratio (M‐H, Fixed, 95% CI) | 0.63 [0.44, 0.90] |
| 13.2 2nd line [EGFRm] | 1 | 264 | Risk Ratio (M‐H, Fixed, 95% CI) | 2.2 [0.79, 6.16] |
| 14 Neutropenia Show forest plot | 5 | 2379 | Risk Ratio (M‐H, Fixed, 95% CI) | 0.97 [0.87, 1.08] |
| 14.1 1st line | 2 | 1400 | Risk Ratio (M‐H, Fixed, 95% CI) | 1.18 [0.77, 1.80] |
| 14.2 1st line [Asian] | 2 | 715 | Risk Ratio (M‐H, Fixed, 95% CI) | 0.93 [0.84, 1.03] |
| 14.3 2nd line [EGFRm] | 1 | 264 | Risk Ratio (M‐H, Fixed, 95% CI) | 1.29 [0.49, 3.35] |
| 15 Leukopenia Show forest plot | 4 | 2262 | Risk Ratio (M‐H, Fixed, 95% CI) | 1.08 [0.89, 1.31] |
| 15.1 1st line | 2 | 1400 | Risk Ratio (M‐H, Fixed, 95% CI) | 1.17 [0.61, 2.26] |
| 15.2 1st line [Asian] | 1 | 598 | Risk Ratio (M‐H, Fixed, 95% CI) | 1.06 [0.87, 1.30] |
| 15.3 2nd line [EGFRm] | 1 | 264 | Risk Ratio (M‐H, Fixed, 95% CI) | 1.0 [0.21, 4.86] |
| 16 Overall response rate Show forest plot | 5 | 2314 | Risk Ratio (M‐H, Fixed, 95% CI) | 1.08 [0.97, 1.20] |
| 16.1 1st line | 2 | 1343 | Risk Ratio (M‐H, Fixed, 95% CI) | 1.07 [0.94, 1.22] |
| 16.2 1st line [Asian] | 2 | 706 | Risk Ratio (M‐H, Fixed, 95% CI) | 1.14 [0.93, 1.40] |
| 16.3 2nd line [EGFRm] | 1 | 265 | Risk Ratio (M‐H, Fixed, 95% CI) | 0.93 [0.66, 1.31] |