Oscillating devices for airway clearance in people with cystic fibrosis
Información
- DOI:
- https://doi.org/10.1002/14651858.CD006842.pub4Copiar DOI

- Base de datos:
-
- Cochrane Database of Systematic Reviews
- Versión publicada:
-
- 04 mayo 2017see what's new
- Tipo:
-
- Intervention
- Etapa:
-
- Review
- Grupo Editorial Cochrane:
-
Grupo Cochrane de Fibrosis quística y enfermedades genéticas
- Copyright:
-
- Copyright © 2017 The Cochrane Collaboration. Published by John Wiley & Sons, Ltd.
Cifras del artículo
Altmetric:
Citado por:
Autores
Contributions of authors
LM conceived and drafted the protocol and the review. JA commented on the protocol and the review. Both authors independently selected studies for inclusion in the review and extracted data.
From the 2017 update, JA stepped down from the review team and SI took on the role of co‐author.
LM acts as guarantor for this review.
Sources of support
Internal sources
-
No sources of support supplied
External sources
-
National Institute for Health Research, UK.
This systematic review was supported by the National Institute for Health Research, via Cochrane Infrastructure funding to the Cochrane Cystic Fibrosis and Genetic Disorders Group.
Declarations of interest
Lisa Morrison declares that she has no interest in any of the papers or references within this document and has received no funding in whole or in part for any of this work.
Stephanie Innes: none known.
Acknowledgements
The review authors would like to acknowledge the previous contribution of Jennifer Agnew who was part of the original review team.
The review authors would like to acknowledge the patient assistance of our Managing Editors, Mrs Nikki Jahnke (without whose invaluable support this review would not have reached completion), Miss Tracey Remmington, and our editor, Professor Alan Smyth.
This project was supported by the National Institute for Health Research, via Cochrane Infrastructure funding to the Cochrane Cystic Fibrosis and Genetic Disorders Group. The views and opinions expressed therein are those of the authors and do not necessarily reflect those of the Systematic Reviews Programme, NIHR, NHS or the Department of Health.
Version history
| Published | Title | Stage | Authors | Version |
| 2020 Apr 30 | Oscillating devices for airway clearance in people with cystic fibrosis | Review | Lisa Morrison, Stephanie Milroy | |
| 2017 May 04 | Oscillating devices for airway clearance in people with cystic fibrosis | Review | Lisa Morrison, Stephanie Milroy | |
| 2014 Jul 20 | Oscillating devices for airway clearance in people with cystic fibrosis | Review | Lisa Morrison, Jennifer Agnew | |
| 2009 Jan 21 | Oscillating devices for airway clearance in people with cystic fibrosis | Review | Lisa Morrison, Jennifer Agnew | |
| 2007 Oct 17 | Oscillating devices for airway clearance in people with cystic fibrosis | Protocol | Lisa Morrison, Jennifer Agnew | |
Differences between protocol and review
Update 2017
We originally planned to group outcome data those measured at one, three, six, 12 months and annually thereafter. We subsequently considered these time points and felt that to combine data measured at two weeks with data measured at four weeks was inappropriate. Therefore we have split the original proposed time point of one month and separately reported data at up to two weeks and at over two weeks and up to one month.
We have also amended the wording of our eligibility criteria so it is clear we are only considering randomised or quasi‐randomised studies and not all controlled clinical studies (which may not have any random element involved in allocation to treatment groups).
Update 2014
Two further devices (MetaNeb® and VibraLung®) have been added to the list of possible oscillatory devices in 'Types of interventions'. The data for these devices are only included in abstract form and we await full publication or additional information. The references to the studies of these devices are included under 'Characteristics of studies awaiting classification'.
Update 2010
Since the publication of the protocol there has been a new version of the RevMan software released. The full review has been developed using the RevMan 5 programme and consequently there are several sections now included which were previously not available.
A further device (Quake®) has been added to the list of possible oscillatory devices in 'Types of interventions'. There are currently no trial data published for this device.
Original review
A new team of review authors have worked on the review and taken on the protocol from the previous review team. They have added a further planned subgroup analysis which they felt was clinically relevant. Furthermore in a second post hoc change, they decided to perform a sensitivity analysis including and excluding the studies with a cross‐over design to assess whether the study design had an effect on the results.
Keywords
MeSH
Medical Subject Headings (MeSH) Keywords
- *Mucociliary Clearance;
- Breathing Exercises;
- Chest Wall Oscillation [*instrumentation];
- Cystic Fibrosis [*complications, physiopathology];
- Disease Progression;
- Forced Expiratory Flow Rates;
- Forced Expiratory Volume;
- Lung Diseases, Obstructive [etiology, *therapy];
- Mucus [*metabolism];
- Patient Satisfaction;
- Randomized Controlled Trials as Topic;
- Sputum [metabolism];
- Vibration [*therapeutic use];
Medical Subject Headings Check Words
Adolescent; Adult; Child; Humans; Middle Aged;
PICO
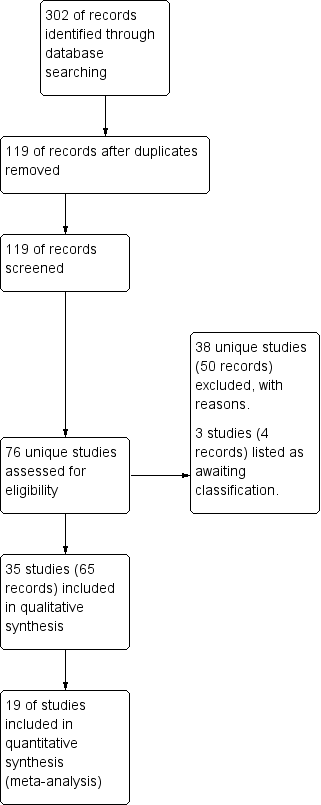
Study flow diagram.

Risk of bias: review authors' judgments about each risk of bias item presented as percentages across all included studies.

Risk of bias summary: review authors' judgements about each risk of bias item for each included study.
![Comparison 1 Oscillating devices (OD) versus positive expiratory pressure (PEP), Outcome 1 FEV₁ post‐intervention [% predicted].](/es/cdsr/doi/10.1002/14651858.CD006842.pub4/media/CDSR/CD006842/rel0004/CD006842/image_n/nCD006842-CMP-001-01.png)
Comparison 1 Oscillating devices (OD) versus positive expiratory pressure (PEP), Outcome 1 FEV₁ post‐intervention [% predicted].
![Comparison 1 Oscillating devices (OD) versus positive expiratory pressure (PEP), Outcome 2 FEV₁ change from baseline [% predicted].](/es/cdsr/doi/10.1002/14651858.CD006842.pub4/media/CDSR/CD006842/rel0004/CD006842/image_n/nCD006842-CMP-001-02.png)
Comparison 1 Oscillating devices (OD) versus positive expiratory pressure (PEP), Outcome 2 FEV₁ change from baseline [% predicted].
![Comparison 1 Oscillating devices (OD) versus positive expiratory pressure (PEP), Outcome 3 FEF25‐75 post intervention [% predicted].](/es/cdsr/doi/10.1002/14651858.CD006842.pub4/media/CDSR/CD006842/rel0004/CD006842/image_n/nCD006842-CMP-001-03.png)
Comparison 1 Oscillating devices (OD) versus positive expiratory pressure (PEP), Outcome 3 FEF25‐75 post intervention [% predicted].
![Comparison 1 Oscillating devices (OD) versus positive expiratory pressure (PEP), Outcome 4 FEF25‐75 change from baseline [% predicted].](/es/cdsr/doi/10.1002/14651858.CD006842.pub4/media/CDSR/CD006842/rel0004/CD006842/image_n/nCD006842-CMP-001-04.png)
Comparison 1 Oscillating devices (OD) versus positive expiratory pressure (PEP), Outcome 4 FEF25‐75 change from baseline [% predicted].
![Comparison 1 Oscillating devices (OD) versus positive expiratory pressure (PEP), Outcome 5 FVC post intervention [% predicted].](/es/cdsr/doi/10.1002/14651858.CD006842.pub4/media/CDSR/CD006842/rel0004/CD006842/image_n/nCD006842-CMP-001-05.png)
Comparison 1 Oscillating devices (OD) versus positive expiratory pressure (PEP), Outcome 5 FVC post intervention [% predicted].
![Comparison 1 Oscillating devices (OD) versus positive expiratory pressure (PEP), Outcome 6 FVC change from baseline [% predicted].](/es/cdsr/doi/10.1002/14651858.CD006842.pub4/media/CDSR/CD006842/rel0004/CD006842/image_n/nCD006842-CMP-001-06.png)
Comparison 1 Oscillating devices (OD) versus positive expiratory pressure (PEP), Outcome 6 FVC change from baseline [% predicted].
![Comparison 1 Oscillating devices (OD) versus positive expiratory pressure (PEP), Outcome 7 Sputum volume [ml].](/es/cdsr/doi/10.1002/14651858.CD006842.pub4/media/CDSR/CD006842/rel0004/CD006842/image_n/nCD006842-CMP-001-07.png)
Comparison 1 Oscillating devices (OD) versus positive expiratory pressure (PEP), Outcome 7 Sputum volume [ml].
![Comparison 1 Oscillating devices (OD) versus positive expiratory pressure (PEP), Outcome 8 Sputum weight [g].](/es/cdsr/doi/10.1002/14651858.CD006842.pub4/media/CDSR/CD006842/rel0004/CD006842/image_n/nCD006842-CMP-001-08.png)
Comparison 1 Oscillating devices (OD) versus positive expiratory pressure (PEP), Outcome 8 Sputum weight [g].

Comparison 1 Oscillating devices (OD) versus positive expiratory pressure (PEP), Outcome 9 Quality of life indices.

Comparison 1 Oscillating devices (OD) versus positive expiratory pressure (PEP), Outcome 10 Number of hospitalizations.

Comparison 1 Oscillating devices (OD) versus positive expiratory pressure (PEP), Outcome 11 Pulmonary exacerbations (at 1 year).

Comparison 1 Oscillating devices (OD) versus positive expiratory pressure (PEP), Outcome 12 Exercise performance % change from baseline.
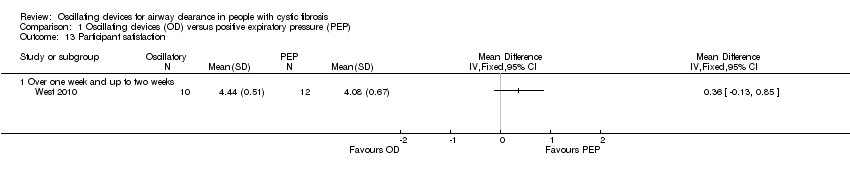
Comparison 1 Oscillating devices (OD) versus positive expiratory pressure (PEP), Outcome 13 Participant satisfaction.
![Comparison 2 Oscillating devices (OD) versus breathing techniques, Outcome 1 FEV₁ post‐intervention [% predicted].](/es/cdsr/doi/10.1002/14651858.CD006842.pub4/media/CDSR/CD006842/rel0004/CD006842/image_n/nCD006842-CMP-002-01.png)
Comparison 2 Oscillating devices (OD) versus breathing techniques, Outcome 1 FEV₁ post‐intervention [% predicted].
![Comparison 2 Oscillating devices (OD) versus breathing techniques, Outcome 2 FVC post‐intervention [% predicted].](/es/cdsr/doi/10.1002/14651858.CD006842.pub4/media/CDSR/CD006842/rel0004/CD006842/image_n/nCD006842-CMP-002-02.png)
Comparison 2 Oscillating devices (OD) versus breathing techniques, Outcome 2 FVC post‐intervention [% predicted].
![Comparison 2 Oscillating devices (OD) versus breathing techniques, Outcome 3 Sputum volume [g].](/es/cdsr/doi/10.1002/14651858.CD006842.pub4/media/CDSR/CD006842/rel0004/CD006842/image_n/nCD006842-CMP-002-03.png)
Comparison 2 Oscillating devices (OD) versus breathing techniques, Outcome 3 Sputum volume [g].
![Comparison 2 Oscillating devices (OD) versus breathing techniques, Outcome 4 Sputum weight (wet) [g].](/es/cdsr/doi/10.1002/14651858.CD006842.pub4/media/CDSR/CD006842/rel0004/CD006842/image_n/nCD006842-CMP-002-04.png)
Comparison 2 Oscillating devices (OD) versus breathing techniques, Outcome 4 Sputum weight (wet) [g].
![Comparison 3 Oscillating devices (OD) versus conventional physiotherapy (CPT), Outcome 1 FEV₁ post intervention [% predicted].](/es/cdsr/doi/10.1002/14651858.CD006842.pub4/media/CDSR/CD006842/rel0004/CD006842/image_n/nCD006842-CMP-003-01.png)
Comparison 3 Oscillating devices (OD) versus conventional physiotherapy (CPT), Outcome 1 FEV₁ post intervention [% predicted].
![Comparison 3 Oscillating devices (OD) versus conventional physiotherapy (CPT), Outcome 2 FEV₁ change from baseline [% predicted].](/es/cdsr/doi/10.1002/14651858.CD006842.pub4/media/CDSR/CD006842/rel0004/CD006842/image_n/nCD006842-CMP-003-02.png)
Comparison 3 Oscillating devices (OD) versus conventional physiotherapy (CPT), Outcome 2 FEV₁ change from baseline [% predicted].
![Comparison 3 Oscillating devices (OD) versus conventional physiotherapy (CPT), Outcome 3 FEF25‐75 post intervention [% predicted].](/es/cdsr/doi/10.1002/14651858.CD006842.pub4/media/CDSR/CD006842/rel0004/CD006842/image_n/nCD006842-CMP-003-03.png)
Comparison 3 Oscillating devices (OD) versus conventional physiotherapy (CPT), Outcome 3 FEF25‐75 post intervention [% predicted].
![Comparison 3 Oscillating devices (OD) versus conventional physiotherapy (CPT), Outcome 4 FEF25‐75 change from baseline [% predicted].](/es/cdsr/doi/10.1002/14651858.CD006842.pub4/media/CDSR/CD006842/rel0004/CD006842/image_n/nCD006842-CMP-003-04.png)
Comparison 3 Oscillating devices (OD) versus conventional physiotherapy (CPT), Outcome 4 FEF25‐75 change from baseline [% predicted].
![Comparison 3 Oscillating devices (OD) versus conventional physiotherapy (CPT), Outcome 5 FVC [% predicted].](/es/cdsr/doi/10.1002/14651858.CD006842.pub4/media/CDSR/CD006842/rel0004/CD006842/image_n/nCD006842-CMP-003-05.png)
Comparison 3 Oscillating devices (OD) versus conventional physiotherapy (CPT), Outcome 5 FVC [% predicted].
![Comparison 3 Oscillating devices (OD) versus conventional physiotherapy (CPT), Outcome 6 Residual volume [% change from baseline].](/es/cdsr/doi/10.1002/14651858.CD006842.pub4/media/CDSR/CD006842/rel0004/CD006842/image_n/nCD006842-CMP-003-06.png)
Comparison 3 Oscillating devices (OD) versus conventional physiotherapy (CPT), Outcome 6 Residual volume [% change from baseline].
![Comparison 3 Oscillating devices (OD) versus conventional physiotherapy (CPT), Outcome 7 Sputum weight (dry) [g].](/es/cdsr/doi/10.1002/14651858.CD006842.pub4/media/CDSR/CD006842/rel0004/CD006842/image_n/nCD006842-CMP-003-07.png)
Comparison 3 Oscillating devices (OD) versus conventional physiotherapy (CPT), Outcome 7 Sputum weight (dry) [g].
![Comparison 3 Oscillating devices (OD) versus conventional physiotherapy (CPT), Outcome 8 Sputum weight (wet) [g].](/es/cdsr/doi/10.1002/14651858.CD006842.pub4/media/CDSR/CD006842/rel0004/CD006842/image_n/nCD006842-CMP-003-08.png)
Comparison 3 Oscillating devices (OD) versus conventional physiotherapy (CPT), Outcome 8 Sputum weight (wet) [g].
![Comparison 3 Oscillating devices (OD) versus conventional physiotherapy (CPT), Outcome 9 Six minute walking distance [metres].](/es/cdsr/doi/10.1002/14651858.CD006842.pub4/media/CDSR/CD006842/rel0004/CD006842/image_n/nCD006842-CMP-003-09.png)
Comparison 3 Oscillating devices (OD) versus conventional physiotherapy (CPT), Outcome 9 Six minute walking distance [metres].
![Comparison 3 Oscillating devices (OD) versus conventional physiotherapy (CPT), Outcome 10 Oxygen saturation (SaO2 ) [% change from baseline].](/es/cdsr/doi/10.1002/14651858.CD006842.pub4/media/CDSR/CD006842/rel0004/CD006842/image_n/nCD006842-CMP-003-10.png)
Comparison 3 Oscillating devices (OD) versus conventional physiotherapy (CPT), Outcome 10 Oxygen saturation (SaO2 ) [% change from baseline].
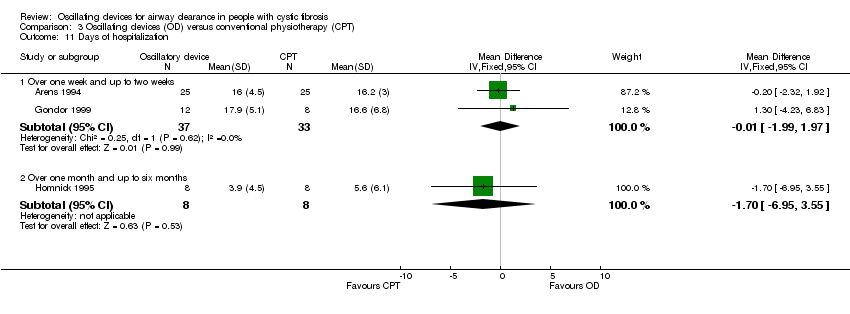
Comparison 3 Oscillating devices (OD) versus conventional physiotherapy (CPT), Outcome 11 Days of hospitalization.

Comparison 3 Oscillating devices (OD) versus conventional physiotherapy (CPT), Outcome 12 Patient satisfaction / overall preference (short term).
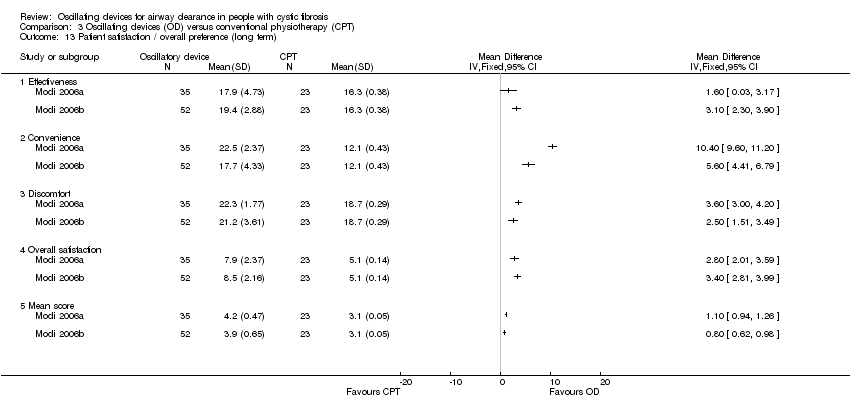
Comparison 3 Oscillating devices (OD) versus conventional physiotherapy (CPT), Outcome 13 Patient satisfaction / overall preference (long term).
![Comparison 4 Flutter versus HFCWO, Outcome 1 FEV1 [% predicted].](/es/cdsr/doi/10.1002/14651858.CD006842.pub4/media/CDSR/CD006842/rel0004/CD006842/image_n/nCD006842-CMP-004-01.png)
Comparison 4 Flutter versus HFCWO, Outcome 1 FEV1 [% predicted].
![Comparison 4 Flutter versus HFCWO, Outcome 2 FEF25‐75 [% predicted].](/es/cdsr/doi/10.1002/14651858.CD006842.pub4/media/CDSR/CD006842/rel0004/CD006842/image_n/nCD006842-CMP-004-02.png)
Comparison 4 Flutter versus HFCWO, Outcome 2 FEF25‐75 [% predicted].
![Comparison 4 Flutter versus HFCWO, Outcome 3 FVC [% predicted].](/es/cdsr/doi/10.1002/14651858.CD006842.pub4/media/CDSR/CD006842/rel0004/CD006842/image_n/nCD006842-CMP-004-03.png)
Comparison 4 Flutter versus HFCWO, Outcome 3 FVC [% predicted].
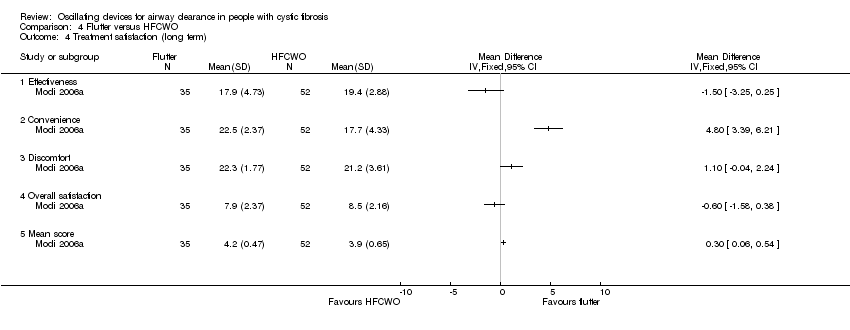
Comparison 4 Flutter versus HFCWO, Outcome 4 Treatment satisfaction (long term).
| Oscillating devices compared with positive expiratory pressure (PEP) for cystic fibrosis | ||||||
| Patient or population: adults and children with cystic fibrosis Settings: outpatients and hospitalised patients Intervention: oscillating devices Comparison: positive expiratory pressure (PEP) | ||||||
| Outcomes | Illustrative comparative risks* (95% CI) | Relative effect | No of participants | Quality of the evidence | Comments | |
| Assumed risk | Corresponding risk | |||||
| PEP | Oscillating devices1 | |||||
| FEV₁: % predicted Follow‐up: less than 1 week to 1 year | There were no statistically significant differences between oscillating devices and PEP in terms of FEV₁ % predicted post‐intervention or change from baseline at any time point. | NA | 510 | ⊕⊝⊝⊝ | ||
| FEF25‐75 : % predicted Follow‐up: less than 1 week to 1 year | There were no statistically significant differences between oscillating devices and PEP in terms of FEF25‐75 % predicted post‐intervention or change from baseline at any time point. | NA | 355 | ⊕⊝⊝⊝ | ||
| FVC Follow‐up: less than 1 week to 1 year | There were no statistically significant differences between oscillating devices and PEP in terms of FVC post‐intervention or change from baseline at any time point. | NA | 362 | ⊕⊝⊝⊝ | ||
| Sputum: volume (mL) Follow‐up: up to 1 week | The mean sputum volume in the PEP group was 8.5 mL. | The mean sputum volume in the oscillating device group was 1.8 mL lower (6.6 mL lower to 3.0 mL higher). | NA | 23 | ⊕⊕⊝⊝ | A second study recruiting 30 participants reported that there was an increase in sputum volume when HFCWO was compared to participants' usual ACT; however, it was not clear exactly what interventions were included in the usual ACT treatment arm. |
| Sputum: weight (dry or wet) (g) Follow‐up: up to 2 weeks | 3 out of 4 studies reported no statistically significant difference between oscillating devices and PEP in terms of sputum weight (g). 1 study reported that a significantly greater weight of sputum was yielded using PEP compared to HFCWO. | NA | 104 | ⊕⊕⊝⊝ | ||
| Frequency of exacerbations2 Follow‐up: up to one year | 2 out of 4 studies reported no statistically significant difference between oscillating devices and PEP. 2 out of 4 studies reported that significantly more hospitalizations or participants requiring antibiotics in the oscillating devices groups compared to the PEP groups. | NA | 219 | ⊕⊕⊝⊝ | ||
| Participant‐reported satisfaction with treatment intervention Follow‐up: less than 1 week to 1 year | Some differences were reported between treatment groups in single domains of satisfaction questionnaires or measurement scales (in favour of or against oscillating devices). Overall across the 7 studies, no consistent differences were reported in terms of satisfaction of any treatment intervention. | NA | 242 (7 studies) | ⊕⊝⊝⊝ | ||
| *The basis for the assumed risk (e.g. the median control group risk across studies) is provided in footnotes. The corresponding risk (and its 95% confidence interval) is based on the assumed risk in the comparison group and the relative effect of the intervention (and its 95% CI). | ||||||
| GRADE Working Group grades of evidence | ||||||
| 1. The oscillating devices included in the trials under this comparison were HFCWO, flutter, IPV, acapella and cornet. 2. Frequency of exacerbations were measured as defined by Rosenfeld as a consequence of the treatment intervention (Rosenfeld 2001). 3. Downgraded twice due to serious risk of bias; many judgements of high risk of bias across the included studies due to reasons such as inadequate allocation concealment, lack of blinding of participants, clinicians and outcome assessors, incomplete outcome data and selective reporting (see Risk of bias in included studies for further information). 4. Downgraded once due to imprecision: many included studies had very small sample sizes, short treatment durations and employed cross‐over designs. As results were not presented from paired analyses for these studies, we treated the cross‐over trials as if they were parallel trials which is a conservative approach as it does not take into account within‐patient correlation. Sensitivity analyses indicates that results were robust to this approach. 5. Downgraded once due to unclear risk of bias; the study was published as an abstract only and very limited information was available regarding the study design. 6. Downgraded once due to risk of bias; judgements of high risk of bias across some of the included studies due to reasons such as inadequate allocation concealment, lack of blinding of participants clinicians and outcome assessors, incomplete outcome data and selective reporting (see Risk of bias in included studies for further information). 7. Downgraded once due to applicability; three of the studies reported anecdotal findings in terms of participant satisfaction or preference for a treatment arm without numerical results to support these findings. | ||||||
| Oscillating devices compared with breathing techniques for cystic fibrosis | ||||||
| Patient or population: adults and children with cystic fibrosis Settings: outpatients and hospitalised patients Intervention: oscillating devices Comparison: breathing techniques | ||||||
| Outcomes | Illustrative comparative risks* (95% CI) | Relative effect | No of participants | Quality of the evidence | Comments | |
| Assumed risk | Corresponding risk | |||||
| Breathing techniques | Oscillating devices1 | |||||
| FEV₁: % predicted or L Follow‐up: less than 1 week to 1 year | 6 out of 7 studies reported no statistically significant differences between oscillating devices and breathing techniques in terms of FEV₁ (% predicted or L). 1 study reported a significant advantage for active cycle of breathing techniques compared to HFWCO in terms of FEV₁ (L). | NA | 184 (7 studies) | ⊕⊕⊝⊝ | ||
| FEF25‐75 Follow‐up: 5 days | There were no statistically significant differences between oscillating devices and breathing techniques in terms of FEF25‐75. | NA | 7 | ⊕⊝⊝⊝ | ||
| FVC Follow‐up: less than 1 week to 1 year | 4 out of 5 studies reported no statistically significant differences between oscillating devices and breathing techniques in terms of FVC. 1 study reported a significant advantage for active cycle of breathing techniques compared to HFWCO in terms of FVC % predicted. | NA | 154 | ⊕⊕⊝⊝ | ||
| Sputum: volume (g) Follow‐up: up to 1 month | The mean sputum volume in the breathing technique group was 3.6 g. | The mean sputum volume in the oscillating device group was 0.9 g higher (1.72 g lower to 3.52 g higher). | NA | 14 | ⊕⊕⊝⊝ | |
| Sputum: weight (dry or wet) (g) Follow‐up: up to 2 weeks | 3 out of 5 studies reported no statistically significant difference between oscillating devices and breathing technique in terms of sputum weight (g). 2 out of 5 studies reported that a significantly greater weight of sputum was yielded using breathing techniques compared to oscillating devices. | NA | 92 | ⊕⊕⊝⊝ | ||
| Frequency of exacerbations2 Follow‐up: NA | Outcome not reported in any study. | NA | NA | NA | ||
| Participant‐reported satisfaction with treatment intervention Follow‐up: up to 2 weeks | Some differences were reported between treatment groups in single domains of satisfaction questionnaires or measurement scales (in favour of or against oscillating devices). Overall across the 5 studies, no consistent differences were reported in terms of satisfaction of any treatment intervention. | NA | 92 | ⊕⊕⊝⊝ | ||
| *The basis for the assumed risk (e.g. the median control group risk across studies) is provided in footnotes. The corresponding risk (and its 95% confidence interval) is based on the assumed risk in the comparison group and the relative effect of the intervention (and its 95% CI). CI: confidence interval; FEF25‐75 : mid‐expiratory flow; FEV₁: forced expiratory volume at one second;FVC: forced vital capacity; HFCWO: high frequency chest wall oscillation;L: litres; MD: mean difference; NA: not applicable. | ||||||
| GRADE Working Group grades of evidence | ||||||
| 1. The oscillating devices included in the trials under this comparison were HFCWO, flutter and cornet. 2. Frequency of exacerbations were measured as defined by Rosenfeld as a consequence of the treatment intervention (Rosenfeld 2001). 3. Downgraded once due to risk of bias; judgements of high risk of bias across some of the included studies due to reasons such as lack of blinding of participants clinicians and outcome assessors, incomplete outcome data and selective reporting (see Risk of bias in included studies for further information) 4. Downgraded once due to imprecision: many included studies had very small sample sizes, short treatment durations and employed cross‐over designs. As results were not presented from paired analyses for these studies, we treated the cross‐over trials as if they were parallel trials which is a conservative approach as it does not take into account within‐patient correlation. Sensitivity analyses indicates that results were robust to this approach. 5. Downgraded once due to risk of bias: the single included study was at high risk of bias due to lack of blinding and reported limited information regarding other aspects of the methodological design 6. Downgraded once due to serious imprecision: a single cross‐over study recruiting only seven participants over a 5‐day period contributed to the outcome and no numerical data were available. 7. Downgraded once due to imprecision: a single cross‐over study recruiting only 14 participants contributed to the outcome. | ||||||
| Oscillating devices compared with conventional physiotherapy for cystic fibrosis | ||||||
| Patient or population: adults and children with cystic fibrosis Settings: outpatients and hospitalised patients Intervention: oscillating devices Comparison: conventional physiotherapy | ||||||
| Outcomes | Illustrative comparative risks* (95% CI) | Relative effect | No of participants | Quality of the evidence | Comments | |
| Assumed risk | Corresponding risk | |||||
| Conventional physiotherapy | Oscillating devices1 | |||||
| FEV₁: % predicted Follow‐up: less than 1 week up to 3 years | There were no statistically significant differences between oscillating devices and conventional physiotherapy in terms of FEV₁ % predicted post‐intervention or change from baseline at any time point. | NA | 363 | ⊕⊝⊝⊝ | ||
| FEF25‐75: % predicted Follow‐up: less than 1ne week up to 3 years | There were no statistically significant differences between oscillating devices and conventional physiotherapy in terms of FEF25‐75 % predicted post‐intervention or change from baseline at any time point. | NA | 319 | ⊕⊝⊝⊝ | ||
| FVC Follow‐up: less than 1 week up to 3 years | There were no statistically significant differences between oscillating devices and conventional physiotherapy in terms of FVC post‐intervention or change from baseline at any time point. | NA | 268 (7 studies) | ⊕⊝⊝⊝ | ||
| Sputum: volume Follow‐up: up to 1 week | Both studies found a statistically significant advantage for the oscillating device compared to the conventional physiotherapy in terms of volume of sputum. | NA | 17 | ⊕⊕⊝⊝ | ||
| Sputum: weight (dry or wet) | 6 out of 8 studies reported no statistically significant difference between oscillating devices and conventional physiotherapy in terms of sputum weight (g). 1 study reported that a significantly greater weight of sputum was yielded using conventional physiotherapy compared to HFCWO. 1 study reported that a significantly greater weight of sputum was yielded using HFCWO compared to conventional physiotherapy. | NA | 188 | ⊕⊝⊝⊝ | ||
| Frequency of exacerbations2 Follow‐up: less than 1 week up to 3 years | There were no significant differences between oscillating devices and conventional physiotherapy in terms of days of hospitalisation or time to next pulmonary exacerbation. | NA | 262 | ⊕⊝⊝⊝ | ||
| Participant‐reported satisfaction with treatment intervention Follow‐up: less than 1 week up to 3 years | Some differences were reported between treatment groups in single domains of satisfaction questionnaires or measurement scales (in favour of or against oscillating devices). Overall across the 9 studies, no consistent differences were reported in terms of satisfaction of any treatment intervention. | NA | 345 | ⊕⊝⊝⊝ | ||
| *The basis for the assumed risk (e.g. the median control group risk across studies) is provided in footnotes. The corresponding risk (and its 95% confidence interval) is based on the assumed risk in the comparison group and the relative effect of the intervention (and its 95% CI). | ||||||
| GRADE Working Group grades of evidence | ||||||
| 1. The oscillating devices included in the trials under this comparison were HFCWO, flutter and IPV. 2. Frequency of exacerbations were measured as defined by Rosenfeld as a consequence of the treatment intervention (Rosenfeld 2001). 3. Downgraded twice due to serious risk of bias; many judgements of high risk of bias across the included studies due to reasons such as inadequate allocation concealment, lack of blinding of participants, clinicians and outcome assessors, incomplete outcome data and selective reporting (see Risk of bias in included studies for further information). 4. Downgraded once due to imprecision: many included studies had very small sample sizes, short treatment durations and employed cross‐over designs. As results were not presented from paired analyses for these studies, we treated the cross‐over trials as if they were parallel trials which is a conservative approach as it does not take into account within‐patient correlation. Sensitivity analyses indicates that results were robust to this approach. 5. Downgraded once due to unclear risk of bias; limited information was available regarding the methodological designs of the 2 studies. 6. Downgraded once due to applicability; 4 of the studies reported anecdotal findings in terms of participant satisfaction or preference for a treatment arm without numerical results to support these findings. | ||||||
| Oscillating devices compared with different oscillating devices for cystic fibrosis | ||||||
| Patient or population: adults and children with cystic fibrosis Settings: outpatients and hospitalised patients Intervention: oscillating devices Comparison: a different oscillating device | ||||||
| Outcomes | Illustrative comparative risks* (95% CI) | Relative effect | No of participants | Quality of the evidence | Comments | |
| Assumed risk | Corresponding risk | |||||
| Oscillating Devices1 | Oscillating devices1 | |||||
| FEV₁ Follow‐up: less than 1e week up to 3 years | There were no statistically significant differences between oscillating devices in terms of FEV₁ at any time point. | NA | 316 (5 studies) | ⊕⊝⊝⊝ | ||
| FEF25‐75 Follow‐up: less than 1 week up to 3 years | There were no statistically significant differences between oscillating devices in terms of FEF25‐75 at any time point. | NA | 211 | ⊕⊝⊝⊝ | ||
| FVC Follow‐up: less than 1 week up to 3 years | There were no statistically significant differences between oscillating devices in terms of FVC at any time point. | NA | 286 | ⊕⊝⊝⊝ | ||
| Sputum: volume Follow‐up: NA | Outcome not reported. | NA | NA | NA | ||
| Sputum: weight (dry or wet) Folllow‐up: 6 days | The results of the study showed that wet and dry sputum weight in the IPV group was significantly greater than in the HFCWO group. | NA | 24 (1 study) | ⊕⊕⊝⊝ | ||
| Frequency of exacerbations2 Follow‐up: 24 weeks | There were no statistically significant differences between oscillating devices in terms of frequency of hospitalisations or need for home intravenous therapies. | NA | 16 | ⊕⊝⊝⊝ | ||
| Participant‐reported satisfaction with treatment intervention Follow‐up: less than 1 week up to 3 years | Some differences were reported between treatment groups in single domains of satisfaction questionnaires or measurement scales (in favour of or against oscillating devices). Overall across the 5 studies, no consistent differences were reported in terms of satisfaction of any treatment intervention. | NA | 265 | ⊕⊝⊝⊝ | ||
| *The basis for the assumed risk (e.g. the median control group risk across studies) is provided in footnotes. The corresponding risk (and its 95% confidence interval) is based on the assumed risk in the comparison group and the relative effect of the intervention (and its 95% CI). | ||||||
| GRADE Working Group grades of evidence | ||||||
| 1. The oscillating devices included in the trials under this comparison were HFCWO, flutter, IPV and cornet. 2. Frequency of exacerbations were measured as defined by Rosenfeld as a consequence of the treatment intervention (Rosenfeld 2001). 3. Downgraded twice due to serious risk of bias; many judgements of high risk of bias across the included studies due to reasons such as lack of blinding of participants, clinicians and outcome assessors, incomplete outcome data and selective reporting (see Risk of bias in included studies for further information). 4. Downgraded once due to imprecision: many included studies had very small sample sizes, short treatment durations and employed cross‐over designs. As results were not presented from paired analyses for these studies, we treated the cross‐over trials as if they were parallel trials which is a conservative approach as it does not take into account within‐patient correlation. Sensitivity analyses indicates that results were robust to this approach. 5. Downgraded once due to unclear risk of bias; the study was potentially as risk of bias due to the administration of the interventions and limited information was available regarding the study design. 6. Downgraded once due to serious risk of bias; the study was at risk of attrition bias and selective reporting bias. 7. Downgraded once due to imprecision: the study recruited only 16 participants and numerical data were not available for the outcome. | ||||||
| Outcome or subgroup title | No. of studies | No. of participants | Statistical method | Effect size |
| 1 FEV₁ post‐intervention [% predicted] Show forest plot | 4 | Std. Mean Difference (IV, Fixed, 95% CI) | Subtotals only | |
| 1.1 Up to one week | 2 | 78 | Std. Mean Difference (IV, Fixed, 95% CI) | ‐0.03 [‐0.48, 0.41] |
| 1.2 Over one week and up to two weeks | 1 | 30 | Std. Mean Difference (IV, Fixed, 95% CI) | 0.12 [‐0.60, 0.84] |
| 1.3 Over two weeks and up to one month | 1 | 44 | Std. Mean Difference (IV, Fixed, 95% CI) | 0.49 [‐0.11, 1.09] |
| 2 FEV₁ change from baseline [% predicted] Show forest plot | 5 | Mean Difference (IV, Fixed, 95% CI) | Subtotals only | |
| 2.1 Over one week and up to two weeks | 1 | 22 | Mean Difference (IV, Fixed, 95% CI) | 9.37 [‐6.16, 24.90] |
| 2.2 Over two weeks and up to one month | 1 | 12 | Mean Difference (IV, Fixed, 95% CI) | ‐4.08 [‐12.82, 4.66] |
| 2.3 At one year | 3 | 162 | Mean Difference (IV, Fixed, 95% CI) | 1.54 [‐1.97, 5.06] |
| 3 FEF25‐75 post intervention [% predicted] Show forest plot | 4 | Mean Difference (IV, Fixed, 95% CI) | Subtotals only | |
| 3.1 Up to one week | 2 | 78 | Mean Difference (IV, Fixed, 95% CI) | 0.09 [‐9.33, 9.52] |
| 3.2 Over one week and up to two weeks | 1 | 30 | Mean Difference (IV, Fixed, 95% CI) | ‐1.0 [‐27.84, 25.84] |
| 3.3 Over two weeks and up to one month | 1 | 44 | Mean Difference (IV, Fixed, 95% CI) | ‐1.0 [‐3.95, 1.95] |
| 4 FEF25‐75 change from baseline [% predicted] Show forest plot | 5 | Mean Difference (IV, Fixed, 95% CI) | Subtotals only | |
| 4.1 Over one week and up to two weeks | 1 | 22 | Mean Difference (IV, Fixed, 95% CI) | 15.26 [‐10.12, 40.64] |
| 4.2 Over two weeks and up to one month | 1 | 12 | Mean Difference (IV, Fixed, 95% CI) | ‐20.07 [‐43.00, 4.86] |
| 4.3 At one year | 3 | 162 | Mean Difference (IV, Fixed, 95% CI) | 0.13 [‐4.46, 4.72] |
| 5 FVC post intervention [% predicted] Show forest plot | 4 | Mean Difference (IV, Fixed, 95% CI) | Subtotals only | |
| 5.1 Up to one week | 2 | 78 | Mean Difference (IV, Fixed, 95% CI) | ‐0.66 [‐8.71, 7.40] |
| 5.2 Over one week and up to two weeks | 1 | 30 | Mean Difference (IV, Fixed, 95% CI) | 3.0 [‐10.60, 16.60] |
| 5.3 Over two weeks and up to one month | 1 | 44 | Mean Difference (IV, Fixed, 95% CI) | 2.0 [‐0.09, 4.09] |
| 6 FVC change from baseline [% predicted] Show forest plot | 4 | Mean Difference (IV, Random, 95% CI) | Subtotals only | |
| 6.1 Over one week and up to two weeks | 1 | 22 | Mean Difference (IV, Random, 95% CI) | 5.40 [‐9.21, 20.01] |
| 6.2 At one year | 3 | 162 | Mean Difference (IV, Random, 95% CI) | 0.25 [‐6.14, 6.65] |
| 7 Sputum volume [ml] Show forest plot | 1 | Mean Difference (IV, Fixed, 95% CI) | Totals not selected | |
| 7.1 Up to 1 week | 1 | Mean Difference (IV, Fixed, 95% CI) | 0.0 [0.0, 0.0] | |
| 8 Sputum weight [g] Show forest plot | 1 | Mean Difference (IV, Fixed, 95% CI) | Totals not selected | |
| 8.1 Over one week and up to two weeks | 1 | Mean Difference (IV, Fixed, 95% CI) | 0.0 [0.0, 0.0] | |
| 9 Quality of life indices Show forest plot | 2 | Mean Difference (IV, Fixed, 95% CI) | Totals not selected | |
| 9.1 Quality of well being score | 1 | Mean Difference (IV, Fixed, 95% CI) | 0.0 [0.0, 0.0] | |
| 9.2 CRQ Disease specific interviewer administered questionnaire | 1 | Mean Difference (IV, Fixed, 95% CI) | 0.0 [0.0, 0.0] | |
| 9.3 CFQ: physical domain | 1 | Mean Difference (IV, Fixed, 95% CI) | 0.0 [0.0, 0.0] | |
| 9.4 CFQ: emotional domain | 1 | Mean Difference (IV, Fixed, 95% CI) | 0.0 [0.0, 0.0] | |
| 9.5 CFQ: treatment burden domain | 1 | Mean Difference (IV, Fixed, 95% CI) | 0.0 [0.0, 0.0] | |
| 9.6 CFQ: respiratory domain | 1 | Mean Difference (IV, Fixed, 95% CI) | 0.0 [0.0, 0.0] | |
| 9.7 CFQ: digestion/weight domain | 1 | Mean Difference (IV, Fixed, 95% CI) | 0.0 [0.0, 0.0] | |
| 10 Number of hospitalizations Show forest plot | 1 | Mean Difference (IV, Fixed, 95% CI) | Totals not selected | |
| 10.1 At one year | 1 | Mean Difference (IV, Fixed, 95% CI) | 0.0 [0.0, 0.0] | |
| 11 Pulmonary exacerbations (at 1 year) Show forest plot | 1 | Odds Ratio (M‐H, Fixed, 95% CI) | Totals not selected | |
| 11.1 Total number of patient requiring antibiotics for exacerbations | 1 | Odds Ratio (M‐H, Fixed, 95% CI) | 0.0 [0.0, 0.0] | |
| 11.2 Number of patients requiring IV antibiotics for exacerbations | 1 | Odds Ratio (M‐H, Fixed, 95% CI) | 0.0 [0.0, 0.0] | |
| 12 Exercise performance % change from baseline Show forest plot | 1 | Mean Difference (IV, Fixed, 95% CI) | Totals not selected | |
| 12.1 Over one week and up to two weeks | 1 | Mean Difference (IV, Fixed, 95% CI) | 0.0 [0.0, 0.0] | |
| 13 Participant satisfaction Show forest plot | 1 | Mean Difference (IV, Fixed, 95% CI) | Totals not selected | |
| 13.1 Over one week and up to two weeks | 1 | Mean Difference (IV, Fixed, 95% CI) | 0.0 [0.0, 0.0] | |
| Outcome or subgroup title | No. of studies | No. of participants | Statistical method | Effect size |
| 1 FEV₁ post‐intervention [% predicted] Show forest plot | 1 | Mean Difference (IV, Fixed, 95% CI) | Totals not selected | |
| 1.1 Over two weeks and up to one month | 1 | Mean Difference (IV, Fixed, 95% CI) | 0.0 [0.0, 0.0] | |
| 2 FVC post‐intervention [% predicted] Show forest plot | 1 | Mean Difference (IV, Fixed, 95% CI) | Totals not selected | |
| 2.1 Over two weeks and up to one month | 1 | Mean Difference (IV, Fixed, 95% CI) | 0.0 [0.0, 0.0] | |
| 3 Sputum volume [g] Show forest plot | 1 | Mean Difference (IV, Fixed, 95% CI) | Totals not selected | |
| 3.1 Over two weeks and up to one month | 1 | Mean Difference (IV, Fixed, 95% CI) | 0.0 [0.0, 0.0] | |
| 4 Sputum weight (wet) [g] Show forest plot | 1 | Mean Difference (IV, Fixed, 95% CI) | Totals not selected | |
| 4.1 Up to one week | 1 | Mean Difference (IV, Fixed, 95% CI) | 0.0 [0.0, 0.0] | |
| Outcome or subgroup title | No. of studies | No. of participants | Statistical method | Effect size |
| 1 FEV₁ post intervention [% predicted] Show forest plot | 4 | Mean Difference (IV, Fixed, 95% CI) | Subtotals only | |
| 1.1 Up to one week | 2 | 52 | Mean Difference (IV, Fixed, 95% CI) | 4.24 [‐7.96, 16.44] |
| 1.2 Over one week and up to two weeks | 1 | 20 | Mean Difference (IV, Fixed, 95% CI) | 18.0 [‐5.54, 41.54] |
| 1.3 Over two weeks and up to one month | 1 | 28 | Mean Difference (IV, Fixed, 95% CI) | 2.0 [‐2.83, 6.83] |
| 1.4 Over one month and up to six months | 1 | 16 | Mean Difference (IV, Fixed, 95% CI) | 10.0 [‐3.72, 23.72] |
| 2 FEV₁ change from baseline [% predicted] Show forest plot | 2 | Mean Difference (IV, Fixed, 95% CI) | Totals not selected | |
| 2.1 Up to one week | 1 | Mean Difference (IV, Fixed, 95% CI) | 0.0 [0.0, 0.0] | |
| 2.2 Over one week and up to two weeks | 1 | Mean Difference (IV, Fixed, 95% CI) | 0.0 [0.0, 0.0] | |
| 2.3 Over two weeks and up to one month | 1 | Mean Difference (IV, Fixed, 95% CI) | 0.0 [0.0, 0.0] | |
| 3 FEF25‐75 post intervention [% predicted] Show forest plot | 3 | Std. Mean Difference (IV, Random, 95% CI) | Subtotals only | |
| 3.1 Up to one week | 2 | 52 | Std. Mean Difference (IV, Random, 95% CI) | 0.24 [‐0.35, 0.83] |
| 3.2 Over one week and up to two weeks | 1 | 20 | Std. Mean Difference (IV, Random, 95% CI) | 0.65 [‐0.27, 1.58] |
| 3.3 Over one month and up to six months | 1 | 16 | Std. Mean Difference (IV, Random, 95% CI) | 0.29 [‐0.70, 1.28] |
| 4 FEF25‐75 change from baseline [% predicted] Show forest plot | 2 | Mean Difference (IV, Fixed, 95% CI) | Totals not selected | |
| 4.1 Up to one week | 1 | Mean Difference (IV, Fixed, 95% CI) | 0.0 [0.0, 0.0] | |
| 4.2 Over one week and up to two weeks | 1 | Mean Difference (IV, Fixed, 95% CI) | 0.0 [0.0, 0.0] | |
| 4.3 Over two weeks and up to one month | 1 | Mean Difference (IV, Fixed, 95% CI) | 0.0 [0.0, 0.0] | |
| 5 FVC [% predicted] Show forest plot | 4 | Mean Difference (IV, Fixed, 95% CI) | Subtotals only | |
| 5.1 Up to one week | 2 | 52 | Mean Difference (IV, Fixed, 95% CI) | 2.60 [‐8.63, 13.84] |
| 5.2 Over one week and up to two weeks | 1 | 20 | Mean Difference (IV, Fixed, 95% CI) | 13.0 [‐10.54, 36.54] |
| 5.3 Over two weeks and up to one month | 1 | 28 | Mean Difference (IV, Fixed, 95% CI) | 3.0 [‐0.78, 6.78] |
| 5.4 Over one month and up to six months | 1 | 16 | Mean Difference (IV, Fixed, 95% CI) | 11.0 [‐2.86, 24.86] |
| 6 Residual volume [% change from baseline] Show forest plot | 1 | Mean Difference (IV, Fixed, 95% CI) | Totals not selected | |
| 6.1 Up to one week | 1 | Mean Difference (IV, Fixed, 95% CI) | 0.0 [0.0, 0.0] | |
| 6.2 Over one week and up to two weeks | 1 | Mean Difference (IV, Fixed, 95% CI) | 0.0 [0.0, 0.0] | |
| 7 Sputum weight (dry) [g] Show forest plot | 6 | Mean Difference (IV, Fixed, 95% CI) | Subtotals only | |
| 7.1 Up to one week | 5 | 228 | Mean Difference (IV, Fixed, 95% CI) | ‐0.03 [‐0.13, 0.06] |
| 7.2 Over one week and up to two weeks | 1 | 24 | Mean Difference (IV, Fixed, 95% CI) | 0.13 [‐0.16, 0.42] |
| 7.3 Over two weeks and up to one month | 1 | 28 | Mean Difference (IV, Fixed, 95% CI) | 0.10 [‐0.35, 0.55] |
| 8 Sputum weight (wet) [g] Show forest plot | 6 | Mean Difference (IV, Fixed, 95% CI) | Subtotals only | |
| 8.1 Up to one week | 5 | 228 | Mean Difference (IV, Fixed, 95% CI) | 1.11 [‐0.60, 2.83] |
| 8.2 Over one week and up to two weeks | 1 | 24 | Mean Difference (IV, Fixed, 95% CI) | 4.04 [‐2.69, 10.77] |
| 8.3 Over two weeks and up to one month | 1 | 28 | Mean Difference (IV, Fixed, 95% CI) | 1.0 [‐2.56, 4.56] |
| 9 Six minute walking distance [metres] Show forest plot | 1 | Mean Difference (IV, Fixed, 95% CI) | Totals not selected | |
| 9.1 Over one week and up to two weeks | 1 | Mean Difference (IV, Fixed, 95% CI) | 0.0 [0.0, 0.0] | |
| 10 Oxygen saturation (SaO2 ) [% change from baseline] Show forest plot | 1 | Mean Difference (IV, Fixed, 95% CI) | Subtotals only | |
| 10.1 Up to one week | 1 | 50 | Mean Difference (IV, Fixed, 95% CI) | ‐0.20 [‐1.51, 1.11] |
| 10.2 Over one week and up to two weeks | 1 | 50 | Mean Difference (IV, Fixed, 95% CI) | ‐0.10 [‐1.51, 1.31] |
| 11 Days of hospitalization Show forest plot | 3 | Mean Difference (IV, Fixed, 95% CI) | Subtotals only | |
| 11.1 Over one week and up to two weeks | 2 | 70 | Mean Difference (IV, Fixed, 95% CI) | ‐0.01 [‐1.99, 1.97] |
| 11.2 Over one month and up to six months | 1 | 16 | Mean Difference (IV, Fixed, 95% CI) | ‐1.70 [‐6.95, 3.55] |
| 12 Patient satisfaction / overall preference (short term) Show forest plot | 2 | Mean Difference (IV, Fixed, 95% CI) | Totals not selected | |
| 12.1 up to one week | 2 | Mean Difference (IV, Fixed, 95% CI) | 0.0 [0.0, 0.0] | |
| 13 Patient satisfaction / overall preference (long term) Show forest plot | 2 | Mean Difference (IV, Fixed, 95% CI) | Totals not selected | |
| 13.1 Effectiveness | 2 | Mean Difference (IV, Fixed, 95% CI) | 0.0 [0.0, 0.0] | |
| 13.2 Convenience | 2 | Mean Difference (IV, Fixed, 95% CI) | 0.0 [0.0, 0.0] | |
| 13.3 Discomfort | 2 | Mean Difference (IV, Fixed, 95% CI) | 0.0 [0.0, 0.0] | |
| 13.4 Overall satisfaction | 2 | Mean Difference (IV, Fixed, 95% CI) | 0.0 [0.0, 0.0] | |
| 13.5 Mean score | 2 | Mean Difference (IV, Fixed, 95% CI) | 0.0 [0.0, 0.0] | |
| Outcome or subgroup title | No. of studies | No. of participants | Statistical method | Effect size |
| 1 FEV1 [% predicted] Show forest plot | 1 | Mean Difference (IV, Fixed, 95% CI) | Totals not selected | |
| 1.1 Over two weeks and up to one month | 1 | Mean Difference (IV, Fixed, 95% CI) | 0.0 [0.0, 0.0] | |
| 2 FEF25‐75 [% predicted] Show forest plot | 1 | Mean Difference (IV, Fixed, 95% CI) | Totals not selected | |
| 2.1 Over two weeks and up to one month | 1 | Mean Difference (IV, Fixed, 95% CI) | 0.0 [0.0, 0.0] | |
| 3 FVC [% predicted] Show forest plot | 1 | Mean Difference (IV, Fixed, 95% CI) | Totals not selected | |
| 3.1 Over two weeks and up to one month | 1 | Mean Difference (IV, Fixed, 95% CI) | 0.0 [0.0, 0.0] | |
| 4 Treatment satisfaction (long term) Show forest plot | 1 | Mean Difference (IV, Fixed, 95% CI) | Totals not selected | |
| 4.1 Effectiveness | 1 | Mean Difference (IV, Fixed, 95% CI) | 0.0 [0.0, 0.0] | |
| 4.2 Convenience | 1 | Mean Difference (IV, Fixed, 95% CI) | 0.0 [0.0, 0.0] | |
| 4.3 Discomfort | 1 | Mean Difference (IV, Fixed, 95% CI) | 0.0 [0.0, 0.0] | |
| 4.4 Overall satisfaction | 1 | Mean Difference (IV, Fixed, 95% CI) | 0.0 [0.0, 0.0] | |
| 4.5 Mean score | 1 | Mean Difference (IV, Fixed, 95% CI) | 0.0 [0.0, 0.0] | |