Vibrationsgeräte zur Atemwegsreinigung für Menschen mit Zystischer Fibrose (Mukoviszidose)
Abstract
Background
Chest physiotherapy is widely prescribed to assist the clearance of airway secretions in people with cystic fibrosis. Oscillating devices generate intra‐ or extra‐thoracic oscillations orally or external to the chest wall. Internally they create variable resistances within the airways, generating controlled oscillating positive pressure which mobilises mucus. Extra‐thoracic oscillations are generated by forces outside the respiratory system, e.g. high frequency chest wall oscillation. This is an update of a previously published review.
Objectives
To identify whether oscillatory devices, oral or chest wall, are effective for mucociliary clearance and whether they are equivalent or superior to other forms of airway clearance in the successful management of secretions in people with cystic fibrosis.
Search methods
We searched the Cochrane Cystic Fibrosis and Genetic Disorders Group Trials Register comprising references identified from comprehensive electronic database searches and hand searches of relevant journals and abstract books of conference proceedings. Latest search of the Cystic Fibrosis Trials Register: 27 April 2017.
In addition we searched the trials databases ClinicalTrials.gov and the WHO International Clinical Trials Registry Platform. Latest search of trials databases: 26 April 2017.
Selection criteria
Randomised controlled studies and controlled clinical studies of oscillating devices compared with any other form of physiotherapy in people with cystic fibrosis. Single‐treatment interventions (therapy technique used only once in the comparison) were excluded.
Data collection and analysis
Two authors independently applied the inclusion criteria to publications and assessed the quality of the included studies.
Main results
The searches identified 76 studies (302 references); 35 studies (total of 1138 participants) met the inclusion criteria. Studies varied in duration from up to one week to one year; 20 of the studies were cross‐over in design. The studies also varied in type of intervention and the outcomes measured, data were not published in sufficient detail in most of these studies, so meta‐analysis was limited. Few studies were considered to have a low risk of bias in any domain. It is not possible to blind participants and clinicians to physiotherapy interventions, but 11 studies did blind the outcome assessors.
Forced expiratory volume in one second was the most frequently measured outcome and while many of the studies reported an improvement in those people using a vibrating device compared to before the study, there were few differences when comparing the different devices to each other or to other airway clearance techniques. One study identified an increase in frequency of exacerbations requiring antibiotics whilst using high frequency chest wall oscillation when compared to positive expiratory pressure. There were some small but significant changes in secondary outcome variables such as sputum volume or weight, but not wholly in favour of oscillating devices. Participant satisfaction was reported in 15 studies but this was not specifically in favour of an oscillating device, as some participants preferred breathing techniques or techniques used prior to the study interventions. The results for the remaining outcome measures were not examined or reported in sufficient detail to provide any high level evidence.
Authors' conclusions
There was no clear evidence that oscillation was a more or less effective intervention overall than other forms of physiotherapy; furthermore there was no evidence that one device is superior to another. The findings from one study showing an increase in frequency of exacerbations requiring antibiotics whilst using an oscillating device compared to positive expiratory pressure may have significant resource implications. More adequately‐powered long‐term randomised controlled trials are necessary and outcomes measured should include frequency of exacerbations, individual preference, adherence to therapy and general satisfaction with treatment. Increased adherence to therapy may then lead to improvements in other parameters, such as exercise tolerance and respiratory function. Additional evidence is needed to evaluate whether oscillating devices combined with other forms of airway clearance is efficacious in people with cystic fibrosis.There may also be a requirement to consider the cost implication of devices over other forms of equally advantageous airway clearance techniques. Using the GRADE method to assess the quality of the evidence, we judged this to be low or very low quality, which suggests that further research is very likely to have an impact on confidence in any estimate of effect generated by future interventions.
PICO
Laienverständliche Zusammenfassung
Der Einsatz von Vibrationsgeräten, um Menschen mit Zystischer Fibrose (Mukoviszidose) bei der Befreiung ihrer Atemwege von Schleim zu unterstützen
Reviewfrage
Wir haben die Evidenz (den wissenschaftlichen Beleg) zur Wirkung von Vibrationsgeräten (z.B. Flutter, Acapella, RC‐Cornet, Quake®, Intrapulmonale Perkussive Ventilation, hochfrequente Brustwandoszillatoren (z.B. Vest®), VibraLung® und MetaNeb®), begutachtet, die Menschen mit Zystischer Fibrose dabei unterstützen, ihre Atemwege von Schleim zu befreien. Dies ist eine Aktualisierung eines zuvor veröffentlichten Reviews.
Hintergrund
Menschen mit Zystischer Fibrose haben zu viel zähen Schleim in ihren Lungen, was zu ständigen Infekten und Entzündungen führen kann. Mit der Zeit schädigt dies ihre Atemwege und verschlechtert die Lungenfunktion. Menschen mit Zystischer Fibrose setzen Atemphysiotherapie zur Befreiung ihrer Lungen von Schleim ein. Sie können verschiedene Methoden allein oder in Kombination mit anderen anwenden ‐ manuelle Techniken, Atemtechniken und mechanische Geräte. Vibrationsgeräte (teilweise auch bekannt als Oszillatoren) nutzen einen entweder innerhalb oder außerhalb des Körpers erzeugten Druck zur Befreiung vom Schleim.
Recherchedatum
Die Evidenz (der wissenschaftliche Beleg) ist auf dem Stand vom 26. April 2017.
Studienmerkmale
In diesen Review wurden 35 Studien mit 1138 Menschen mit Zystischer Fibrose im Alter zwischen 4 und 63 Jahren eingeschlossen.Die Studien verglichen verschiedene physiotherapeutische Behandlungen; die Patienten wurden der einen oder anderen Behandlung zufällig zugeteilt. Nur wenige Studien betrachteten die gleiche Art Physiotherapie über die gleiche Dauer; die Studiendauer lag zwischen zwei Tagen und 13 Monaten.
Hauptergebnisse
Aufgrund der Unterschiede im Studiendesign (der Gestaltung der Studien) war es schwierig, die Ergebnisse der Studien auf eine sinnvolle Weise zusammenzufassen.
Wir fanden keine eindeutige Evidenz dafür, dass Vibrationsgeräte besser sind als jegliche andere Form von Physiotherapie, mit der sie in diesen Studien verglichen wurden, oder dass ein Gerät besser ist als ein anderes. Eine Studie ergab, dass Patienten, die ein Vibrationsgerät verwendeten, häufiger zusätzliche Antibiotika aufgrund eines Atemwegsinfektes benötigten, als Patienten, die positiven Ausatmungsdruck anwandten. Für die Empfehlung der am besten geeigneten Methode der Atemwegsreinigung sollten Physiotherapeuten die Bedürfnisse ihrer Patienten berücksichtigen.
Zukünftig werden größere und länger dauernde Studien benötigt, um die Häufigkeit von Lungeninfekten sowie Vorlieben, Behandlungstreue und ‐zufriedenheit zu messen. Zudem sollten finanzielle Aspekte berücksichtigt werden. Aus unserer Sicht ist die Behandlungstreue bedeutsam, denn wenn Menschen mit Zystischer Fibrose dazu bereit sind, ihr physiotherapeutisches Behandlungsprogramm einzuhalten, könnten Verbesserungen weiterer Ziele, wie beispielsweise der Belastungsverträglichkeit und Atemfunktion, möglich sein.
Qualität der Evidenz
Insgesamt waren wir der Ansicht, dass es in den meisten Studien methodische Probleme gab, die das Vertrauen in einige der Ergebnisse beeinflussen könnten. Bei etwa einem Viertel der Studien gab es Bedenken, dass die Berichterstattung nicht für alle Ergebnisse klar war, und bei etwa einem Drittel der Studien fehlte eine genaue Erklärung, warum Teilnehmer die Studie abbrachen. Bei Vergleichen verschiedener Formen von Physiotherapie wissen die Patienten und ihre Physiotherapeuten grundsätzlich, welche Behandlung sie erhalten, und dies kann ihre Antwort auf einige Fragen beeinflussen, wie zum Beispiel durch welche Behandlung sie sich besser fühlen; aus unserer Sicht war dies jedoch nur in wenigen Studien ein Problem. Zur Bewertung der Qualität der Evidenz benutzten wir ein Bewertungssystem namens GRADE. Wir bewerteten die Qualität als entweder niedrig oder sehr niedrig, was darauf hinweist, dass zukünftige Forschung sehr wahrscheinlich einen Einfluss auf das Vertrauen in die in diesem Review dargestellten Ergebnisse für alle untersuchten Interventionen haben wird.
Authors' conclusions
Summary of findings
| Oscillating devices compared with positive expiratory pressure (PEP) for cystic fibrosis | ||||||
| Patient or population: adults and children with cystic fibrosis Settings: outpatients and hospitalised patients Intervention: oscillating devices Comparison: positive expiratory pressure (PEP) | ||||||
| Outcomes | Illustrative comparative risks* (95% CI) | Relative effect | No of participants | Quality of the evidence | Comments | |
| Assumed risk | Corresponding risk | |||||
| PEP | Oscillating devices1 | |||||
| FEV₁: % predicted Follow‐up: less than 1 week to 1 year | There were no statistically significant differences between oscillating devices and PEP in terms of FEV₁ % predicted post‐intervention or change from baseline at any time point. | NA | 510 | ⊕⊝⊝⊝ | ||
| FEF25‐75 : % predicted Follow‐up: less than 1 week to 1 year | There were no statistically significant differences between oscillating devices and PEP in terms of FEF25‐75 % predicted post‐intervention or change from baseline at any time point. | NA | 355 | ⊕⊝⊝⊝ | ||
| FVC Follow‐up: less than 1 week to 1 year | There were no statistically significant differences between oscillating devices and PEP in terms of FVC post‐intervention or change from baseline at any time point. | NA | 362 | ⊕⊝⊝⊝ | ||
| Sputum: volume (mL) Follow‐up: up to 1 week | The mean sputum volume in the PEP group was 8.5 mL. | The mean sputum volume in the oscillating device group was 1.8 mL lower (6.6 mL lower to 3.0 mL higher). | NA | 23 | ⊕⊕⊝⊝ | A second study recruiting 30 participants reported that there was an increase in sputum volume when HFCWO was compared to participants' usual ACT; however, it was not clear exactly what interventions were included in the usual ACT treatment arm. |
| Sputum: weight (dry or wet) (g) Follow‐up: up to 2 weeks | 3 out of 4 studies reported no statistically significant difference between oscillating devices and PEP in terms of sputum weight (g). 1 study reported that a significantly greater weight of sputum was yielded using PEP compared to HFCWO. | NA | 104 | ⊕⊕⊝⊝ | ||
| Frequency of exacerbations2 Follow‐up: up to one year | 2 out of 4 studies reported no statistically significant difference between oscillating devices and PEP. 2 out of 4 studies reported that significantly more hospitalizations or participants requiring antibiotics in the oscillating devices groups compared to the PEP groups. | NA | 219 | ⊕⊕⊝⊝ | ||
| Participant‐reported satisfaction with treatment intervention Follow‐up: less than 1 week to 1 year | Some differences were reported between treatment groups in single domains of satisfaction questionnaires or measurement scales (in favour of or against oscillating devices). Overall across the 7 studies, no consistent differences were reported in terms of satisfaction of any treatment intervention. | NA | 242 (7 studies) | ⊕⊝⊝⊝ | ||
| *The basis for the assumed risk (e.g. the median control group risk across studies) is provided in footnotes. The corresponding risk (and its 95% confidence interval) is based on the assumed risk in the comparison group and the relative effect of the intervention (and its 95% CI). | ||||||
| GRADE Working Group grades of evidence | ||||||
| 1. The oscillating devices included in the trials under this comparison were HFCWO, flutter, IPV, acapella and cornet. 2. Frequency of exacerbations were measured as defined by Rosenfeld as a consequence of the treatment intervention (Rosenfeld 2001). 3. Downgraded twice due to serious risk of bias; many judgements of high risk of bias across the included studies due to reasons such as inadequate allocation concealment, lack of blinding of participants, clinicians and outcome assessors, incomplete outcome data and selective reporting (see Risk of bias in included studies for further information). 4. Downgraded once due to imprecision: many included studies had very small sample sizes, short treatment durations and employed cross‐over designs. As results were not presented from paired analyses for these studies, we treated the cross‐over trials as if they were parallel trials which is a conservative approach as it does not take into account within‐patient correlation. Sensitivity analyses indicates that results were robust to this approach. 5. Downgraded once due to unclear risk of bias; the study was published as an abstract only and very limited information was available regarding the study design. 6. Downgraded once due to risk of bias; judgements of high risk of bias across some of the included studies due to reasons such as inadequate allocation concealment, lack of blinding of participants clinicians and outcome assessors, incomplete outcome data and selective reporting (see Risk of bias in included studies for further information). 7. Downgraded once due to applicability; three of the studies reported anecdotal findings in terms of participant satisfaction or preference for a treatment arm without numerical results to support these findings. | ||||||
| Oscillating devices compared with breathing techniques for cystic fibrosis | ||||||
| Patient or population: adults and children with cystic fibrosis Settings: outpatients and hospitalised patients Intervention: oscillating devices Comparison: breathing techniques | ||||||
| Outcomes | Illustrative comparative risks* (95% CI) | Relative effect | No of participants | Quality of the evidence | Comments | |
| Assumed risk | Corresponding risk | |||||
| Breathing techniques | Oscillating devices1 | |||||
| FEV₁: % predicted or L Follow‐up: less than 1 week to 1 year | 6 out of 7 studies reported no statistically significant differences between oscillating devices and breathing techniques in terms of FEV₁ (% predicted or L). 1 study reported a significant advantage for active cycle of breathing techniques compared to HFWCO in terms of FEV₁ (L). | NA | 184 (7 studies) | ⊕⊕⊝⊝ | ||
| FEF25‐75 Follow‐up: 5 days | There were no statistically significant differences between oscillating devices and breathing techniques in terms of FEF25‐75. | NA | 7 | ⊕⊝⊝⊝ | ||
| FVC Follow‐up: less than 1 week to 1 year | 4 out of 5 studies reported no statistically significant differences between oscillating devices and breathing techniques in terms of FVC. 1 study reported a significant advantage for active cycle of breathing techniques compared to HFWCO in terms of FVC % predicted. | NA | 154 | ⊕⊕⊝⊝ | ||
| Sputum: volume (g) Follow‐up: up to 1 month | The mean sputum volume in the breathing technique group was 3.6 g. | The mean sputum volume in the oscillating device group was 0.9 g higher (1.72 g lower to 3.52 g higher). | NA | 14 | ⊕⊕⊝⊝ | |
| Sputum: weight (dry or wet) (g) Follow‐up: up to 2 weeks | 3 out of 5 studies reported no statistically significant difference between oscillating devices and breathing technique in terms of sputum weight (g). 2 out of 5 studies reported that a significantly greater weight of sputum was yielded using breathing techniques compared to oscillating devices. | NA | 92 | ⊕⊕⊝⊝ | ||
| Frequency of exacerbations2 Follow‐up: NA | Outcome not reported in any study. | NA | NA | NA | ||
| Participant‐reported satisfaction with treatment intervention Follow‐up: up to 2 weeks | Some differences were reported between treatment groups in single domains of satisfaction questionnaires or measurement scales (in favour of or against oscillating devices). Overall across the 5 studies, no consistent differences were reported in terms of satisfaction of any treatment intervention. | NA | 92 | ⊕⊕⊝⊝ | ||
| *The basis for the assumed risk (e.g. the median control group risk across studies) is provided in footnotes. The corresponding risk (and its 95% confidence interval) is based on the assumed risk in the comparison group and the relative effect of the intervention (and its 95% CI). CI: confidence interval; FEF25‐75 : mid‐expiratory flow; FEV₁: forced expiratory volume at one second;FVC: forced vital capacity; HFCWO: high frequency chest wall oscillation;L: litres; MD: mean difference; NA: not applicable. | ||||||
| GRADE Working Group grades of evidence | ||||||
| 1. The oscillating devices included in the trials under this comparison were HFCWO, flutter and cornet. 2. Frequency of exacerbations were measured as defined by Rosenfeld as a consequence of the treatment intervention (Rosenfeld 2001). 3. Downgraded once due to risk of bias; judgements of high risk of bias across some of the included studies due to reasons such as lack of blinding of participants clinicians and outcome assessors, incomplete outcome data and selective reporting (see Risk of bias in included studies for further information) 4. Downgraded once due to imprecision: many included studies had very small sample sizes, short treatment durations and employed cross‐over designs. As results were not presented from paired analyses for these studies, we treated the cross‐over trials as if they were parallel trials which is a conservative approach as it does not take into account within‐patient correlation. Sensitivity analyses indicates that results were robust to this approach. 5. Downgraded once due to risk of bias: the single included study was at high risk of bias due to lack of blinding and reported limited information regarding other aspects of the methodological design 6. Downgraded once due to serious imprecision: a single cross‐over study recruiting only seven participants over a 5‐day period contributed to the outcome and no numerical data were available. 7. Downgraded once due to imprecision: a single cross‐over study recruiting only 14 participants contributed to the outcome. | ||||||
| Oscillating devices compared with conventional physiotherapy for cystic fibrosis | ||||||
| Patient or population: adults and children with cystic fibrosis Settings: outpatients and hospitalised patients Intervention: oscillating devices Comparison: conventional physiotherapy | ||||||
| Outcomes | Illustrative comparative risks* (95% CI) | Relative effect | No of participants | Quality of the evidence | Comments | |
| Assumed risk | Corresponding risk | |||||
| Conventional physiotherapy | Oscillating devices1 | |||||
| FEV₁: % predicted Follow‐up: less than 1 week up to 3 years | There were no statistically significant differences between oscillating devices and conventional physiotherapy in terms of FEV₁ % predicted post‐intervention or change from baseline at any time point. | NA | 363 | ⊕⊝⊝⊝ | ||
| FEF25‐75: % predicted Follow‐up: less than 1ne week up to 3 years | There were no statistically significant differences between oscillating devices and conventional physiotherapy in terms of FEF25‐75 % predicted post‐intervention or change from baseline at any time point. | NA | 319 | ⊕⊝⊝⊝ | ||
| FVC Follow‐up: less than 1 week up to 3 years | There were no statistically significant differences between oscillating devices and conventional physiotherapy in terms of FVC post‐intervention or change from baseline at any time point. | NA | 268 (7 studies) | ⊕⊝⊝⊝ | ||
| Sputum: volume Follow‐up: up to 1 week | Both studies found a statistically significant advantage for the oscillating device compared to the conventional physiotherapy in terms of volume of sputum. | NA | 17 | ⊕⊕⊝⊝ | ||
| Sputum: weight (dry or wet) | 6 out of 8 studies reported no statistically significant difference between oscillating devices and conventional physiotherapy in terms of sputum weight (g). 1 study reported that a significantly greater weight of sputum was yielded using conventional physiotherapy compared to HFCWO. 1 study reported that a significantly greater weight of sputum was yielded using HFCWO compared to conventional physiotherapy. | NA | 188 | ⊕⊝⊝⊝ | ||
| Frequency of exacerbations2 Follow‐up: less than 1 week up to 3 years | There were no significant differences between oscillating devices and conventional physiotherapy in terms of days of hospitalisation or time to next pulmonary exacerbation. | NA | 262 | ⊕⊝⊝⊝ | ||
| Participant‐reported satisfaction with treatment intervention Follow‐up: less than 1 week up to 3 years | Some differences were reported between treatment groups in single domains of satisfaction questionnaires or measurement scales (in favour of or against oscillating devices). Overall across the 9 studies, no consistent differences were reported in terms of satisfaction of any treatment intervention. | NA | 345 | ⊕⊝⊝⊝ | ||
| *The basis for the assumed risk (e.g. the median control group risk across studies) is provided in footnotes. The corresponding risk (and its 95% confidence interval) is based on the assumed risk in the comparison group and the relative effect of the intervention (and its 95% CI). | ||||||
| GRADE Working Group grades of evidence | ||||||
| 1. The oscillating devices included in the trials under this comparison were HFCWO, flutter and IPV. 2. Frequency of exacerbations were measured as defined by Rosenfeld as a consequence of the treatment intervention (Rosenfeld 2001). 3. Downgraded twice due to serious risk of bias; many judgements of high risk of bias across the included studies due to reasons such as inadequate allocation concealment, lack of blinding of participants, clinicians and outcome assessors, incomplete outcome data and selective reporting (see Risk of bias in included studies for further information). 4. Downgraded once due to imprecision: many included studies had very small sample sizes, short treatment durations and employed cross‐over designs. As results were not presented from paired analyses for these studies, we treated the cross‐over trials as if they were parallel trials which is a conservative approach as it does not take into account within‐patient correlation. Sensitivity analyses indicates that results were robust to this approach. 5. Downgraded once due to unclear risk of bias; limited information was available regarding the methodological designs of the 2 studies. 6. Downgraded once due to applicability; 4 of the studies reported anecdotal findings in terms of participant satisfaction or preference for a treatment arm without numerical results to support these findings. | ||||||
| Oscillating devices compared with different oscillating devices for cystic fibrosis | ||||||
| Patient or population: adults and children with cystic fibrosis Settings: outpatients and hospitalised patients Intervention: oscillating devices Comparison: a different oscillating device | ||||||
| Outcomes | Illustrative comparative risks* (95% CI) | Relative effect | No of participants | Quality of the evidence | Comments | |
| Assumed risk | Corresponding risk | |||||
| Oscillating Devices1 | Oscillating devices1 | |||||
| FEV₁ Follow‐up: less than 1e week up to 3 years | There were no statistically significant differences between oscillating devices in terms of FEV₁ at any time point. | NA | 316 (5 studies) | ⊕⊝⊝⊝ | ||
| FEF25‐75 Follow‐up: less than 1 week up to 3 years | There were no statistically significant differences between oscillating devices in terms of FEF25‐75 at any time point. | NA | 211 | ⊕⊝⊝⊝ | ||
| FVC Follow‐up: less than 1 week up to 3 years | There were no statistically significant differences between oscillating devices in terms of FVC at any time point. | NA | 286 | ⊕⊝⊝⊝ | ||
| Sputum: volume Follow‐up: NA | Outcome not reported. | NA | NA | NA | ||
| Sputum: weight (dry or wet) Folllow‐up: 6 days | The results of the study showed that wet and dry sputum weight in the IPV group was significantly greater than in the HFCWO group. | NA | 24 (1 study) | ⊕⊕⊝⊝ | ||
| Frequency of exacerbations2 Follow‐up: 24 weeks | There were no statistically significant differences between oscillating devices in terms of frequency of hospitalisations or need for home intravenous therapies. | NA | 16 | ⊕⊝⊝⊝ | ||
| Participant‐reported satisfaction with treatment intervention Follow‐up: less than 1 week up to 3 years | Some differences were reported between treatment groups in single domains of satisfaction questionnaires or measurement scales (in favour of or against oscillating devices). Overall across the 5 studies, no consistent differences were reported in terms of satisfaction of any treatment intervention. | NA | 265 | ⊕⊝⊝⊝ | ||
| *The basis for the assumed risk (e.g. the median control group risk across studies) is provided in footnotes. The corresponding risk (and its 95% confidence interval) is based on the assumed risk in the comparison group and the relative effect of the intervention (and its 95% CI). | ||||||
| GRADE Working Group grades of evidence | ||||||
| 1. The oscillating devices included in the trials under this comparison were HFCWO, flutter, IPV and cornet. 2. Frequency of exacerbations were measured as defined by Rosenfeld as a consequence of the treatment intervention (Rosenfeld 2001). 3. Downgraded twice due to serious risk of bias; many judgements of high risk of bias across the included studies due to reasons such as lack of blinding of participants, clinicians and outcome assessors, incomplete outcome data and selective reporting (see Risk of bias in included studies for further information). 4. Downgraded once due to imprecision: many included studies had very small sample sizes, short treatment durations and employed cross‐over designs. As results were not presented from paired analyses for these studies, we treated the cross‐over trials as if they were parallel trials which is a conservative approach as it does not take into account within‐patient correlation. Sensitivity analyses indicates that results were robust to this approach. 5. Downgraded once due to unclear risk of bias; the study was potentially as risk of bias due to the administration of the interventions and limited information was available regarding the study design. 6. Downgraded once due to serious risk of bias; the study was at risk of attrition bias and selective reporting bias. 7. Downgraded once due to imprecision: the study recruited only 16 participants and numerical data were not available for the outcome. | ||||||
Background
Description of the condition
Cystic fibrosis (CF) is a common inherited life‐limiting genetic disorder. The genetic defect causes mucus hypersecretion within the airways leading to airway obstruction and mucus plugging (Zach 1990). Airway damage and progressive loss of respiratory function is a consequence of persistent infection and inflammation within the lungs (Cantin 1995; Konstan 1997).
Description of the intervention
Chest physiotherapy is currently implemented at initial diagnosis. It is recommended that it should be carried out for the maintenance of a clear chest with an additional recognition for altered or more aggressive therapies during times of respiratory exacerbation. Dependent on the age of the individual, chest physiotherapy will traditionally take the form of manual therapies. Conventional manual therapies would require the assistance of another person to perform the techniques of percussion and vibrations, with the addition of postural drainage when this was felt to add to the technique. With the advent of a more modern approach to physiotherapy, self‐administered techniques are more frequently used. These self‐administered techniques do not necessitate postural drainage or indeed the assistance of another person. They can be done in a sitting position (if preferred) and use different methods of breathing or different devices to assist mucus clearance. Oscillatory devices are designed to interrupt the expiratory airflow. These devices are either intra‐ or extra‐thoracic. Intra‐thoracic oscillatory devices are placed in the mouth and provide resistance during exhalation which results in the airways vibrating thus loosening the mucus. Extra‐thoracic oscillatory devices, such as an inflatable vest attached to a machine, vibrate at variable frequencies and intensities as set by the operator to ensure the individual's comfort and associated concordance. Fuller descriptions of all the interventions to be compared in the review can be found below in Types of interventions.
In this review we have considered the use of oscillation and oscillatory devices as a means of airway clearance and the consequent impact this type of intervention has on the individual with CF and in particular when compared with other recognised forms of airway clearance.
How the intervention might work
Respiratory infections are the primary cause of morbidity and mortality in CF and therefore chest physiotherapy is considered to be an important treatment for the assistance and clearance of the sticky mucus found within the airways of people with CF.
Oscillations, or interruptions in expiratory airflow have been postulated to mechanically reduce the viscoelasticity of sputum and enhance mucociliary clearance (Newbold 2005). Oscillations, both internally and externally, have also been considered to improve airway patency by preventing spontaneous compression through the introduction of alternating positive pressure where the consequent vibration loosens mucus allowing ease of expectoration (Oermann 2001; Pryor 1994).
Why it is important to do this review
Other Cochrane Reviews have considered the benefits of different forms of chest physiotherapy in people with CF (Main 2005;; McIlwaine 2015; McKoy 2016). They compare oscillatory devices with another recognised single therapy; conventional chest physiotherapy (Main 2005), positive expiratory pressure (PEP) (McIlwaine 2015) and active cycle of breathing techniques (ACBT) (McKoy 2016). It is the intention of this review to complement the information previously provided. This review will examine the effect and acceptability of oscillatory devices when compared to all other techniques including comparing types of oscillatory device currently used for airway clearance.
This is an updated version of previous reviews (Morrison 2007; Morrison 2009; Morrison 2014).
Objectives
To identify whether oscillatory devices, oral or chest wall, are effective for mucociliary clearance and whether they are equivalent or superior to other forms of airway clearance in the successful management of secretions in people with CF.
Methods
Criteria for considering studies for this review
Types of studies
Randomised controlled trials (RCTs) and quasi ‐RCT's.
Types of participants
Children (aged up to 16 years) and adults (16 years and above) with any degree of disease severity, with defined CF, diagnosed clinically and by sweat or genetic testing. Trials with participants enrolled during a period of stability or during a pulmonary exacerbation were both considered.
Types of interventions
Oscillatory devices, both oral and chest wall, for airway clearance compared with another recognised airway clearance technique either as a single technique (e.g. oscillation versus active cycle of breathing technique (ACBT)) or in conjunction with another recognised airway clearance technique (e.g. oscillation and ACBT versus ACBT alone).
Interventions of variable duration would be considered and separated according to term of intervention. Single treatment interventions (where the therapy technique was used only once in the comparison) were not considered.
Specific techniques considered for comparison are likely to fall in to one of the following categories:
1. Oscillatory devices
Devices which have an oscillatory component which consider intra‐ or extra‐thoracic oscillations.
Intra‐thoracic oscillations are generated orally and created using variable resistances within the airways generating controlled oscillating positive pressure which mobilises respiratory secretions. When the oscillation frequency approximates the resonance frequency of the pulmonary system, endobronchial pressure oscillations are amplified and result in vibrations of the airways. These vibrations loosen mucus from the airway walls. The intermittent increases in endobronchial pressure reduce the collapsibility of the airways during exhalation, increasing the likelihood of clearing mucus from the tracheobronchial tract. The airflow accelerations increase the velocity of the air being exhaled, facilitating the movement of mucus up the airways (Konstan 1994). Exhalation through these devices generates both oscillations of positive pressure in the airways and repeated accelerations of expiratory airflow that have been shown to result in improved sputum clearance (Rogers 2005).
The devices frequently employed for this purpose are:
a. Flutter
A small plastic device containing a large ball bearing which repeatedly interrupts the outward flow of air (Konstan 1994; Pryor 1999).
b. Acapella
A flow operated oscillatory PEP device, which uses a counterweighted plug and magnet to generate the oscillatory resistance (Volsko 2003).
c. Cornet
A horn‐shaped tube which houses a rubber inner tube. The degree of rotation of this inner tube reflects the resistance generated. As the individual exhales through the horn the inner tube unfurls generating a rhythmic bending and unbending of the inner tube within the horn throughout the expiration phase (Pryor 1999).
d. Quake® (Thayer Medical, Tucson, Arizona, USA)
This device oscillates a column of air in both inspiratory and expiratory phases of respiration. It does not rely on an oscillating valve like the Flutter and the acapella, as it uses a manually turned cylinder that fits within another cylinder. Airflow occurs only when slots within the two cylinders line up. Therefore, the airflow is interrupted at regular intervals as the user turns the crank. The rate at which the device is cranked will determine the frequency of the flow interruption. Since the resulting vibration is not determined by the patients rate of flow, the Quake® theoretically may be more helpful for patients with severe obstructive lung disease who are unable to generate high peak expiratory flow rates.
e. Intrapulmonary percussive ventilation (IPV)
This provides continuous oscillation to the airways via the mouth (Homnick 1995).
f. Extra‐ thoracic oscillations (HFCWO)
Extra‐thoracic oscillations are generated by forces external to the respiratory system, e.g. high frequency chest wall oscillation (HFCWO) (Warwick 1991). External chest wall oscillations are applied using an inflatable vest attached to a machine which vibrates at a variable frequencies and intensities as set by the operator to ensure the individual's comfort and associated concordance. This type of device can also be called the Vest® or Hayek Oscillator.
g. The VibraLung®
The VibraLung® is an acoustic percussor, where sound waves are applied directly to the tracheobronchial tract at frequencies that cover the range of resonant frequencies of the human tracheobronchial tract (5 to 1,200 Hz). This causes a vibration within the airways and mucus directly, instead of indirectly through the chest wall. Additionally, the VibraLung® incorporates positive expiratory pressure (PEP) through its mouthpiece design with the inclusion of two tiny holes to provide resistance to exhalation (Wheatley 2013).
h. Metaneb®
The MetaNeb® System is a pneumatic compressor system which delivers continuous high frequency oscillation (CHFO) and continuous positive expiratory pressure (CPEP) to facilitate the clearance of mucus from the lungs, provide aerosol delivery and lung expansion therapy. Flow, pressure and percussive rate are all adjustable (Patel 2013).
2. Positive expiratory pressure (PEP)
Positive expiratory pressure is another well‐recognised and well‐utilised clearance method. Devices can be used to open up and recruit obstructed lung, allowing air to move behind secretions and assist in mobilising them. Breathing out against a slight resistance (10 to 20 cm H₂O) prevents the smaller bronchial tubes from collapsing down and thus permits the continuing upward movement of any secretions (McIlwaine 2015). Masks, mouthpieces or a novel Bubble PEP system offer more choice when considering this approach.
Hi‐PEP is a modification of PEP which involves the full forced expiration against a fixed mechanical resistance usually between 80 to 140 cm H₂O (Prasad 1993) .
3. Breathing techniques
When the individual is considered to be moving toward independence and chooses not to use a device, the techniques frequently adopted are autogenic drainage (AD) and the active cycle of breathing technique (ACBT).
a. Autogenic drainage
This term describes a series of breathing exercises devised by the Belgian physiotherapist Jean Chevaillier. The aim is to dislodge and collect mucus from the lungs and then clear these secretions by breathing at various lung volumes (Chevaillier 1984; Schöni 1989). There are three phases ‐ the Unstick, Collect and Evacuate when breathing at low, mid and high lung volumes to mobilise, collect and expectorate secretions respectively.
b. Active cycle of breathing technique
(Pryor 1999; Webber 1986; Webber 1990)
This consists of three breathing techniques: breathing control is used between other techniques to allow relaxation; thoracic (chest) expansion exercises with the emphasis on inspiration, expiration being quiet and relaxed; and the forced expiration technique or huff is used to mobilise and clear secretions. One or two forced expirations are combined with a period of breathing control. A huff from high lung volume (when a breath has been taken in) will clear secretions from the upper airways and a huff from mid to low lung volume will clear secretions from the lower more peripheral airways.
4. Conventional chest physiotherapy
Conventional therapy techniques typically consisting of techniques such as modified postural drainage, percussion and manual vibrations or shakings are likely to have been introduced in infancy, or if the initial diagnosis was made in childhood (Prasad 1993). They may also include huffing and directed cough (Main 2005). If the diagnosis of CF was made during adolescence or indeed adulthood, many people prefer to use techniques which enable independence from an operator and which can easily be fitted around an active lifestyle.
As a consequence of many different descriptions of therapy techniques it was considered by the authors that certain manual therapies could be combined and considered as one 'type' of therapy. For this reason we have grouped the techniques of postural drainage and percussion (PD&P), postural drainage and clapping (PD& C) and postural drainage percussion and vibration (PDPV) under the term conventional physiotherapy (CPT), for unless otherwise stated we have assumed that CPT is a derivative of, or comparable to, the other terms used in the grouping.
5. Exercise
Where an individual with CF has few respiratory symptoms, exercise can often be the treatment of choice as a means of airway clearance or as an adjunct to other techniques. It has been recognised as contributing to enhanced quality of life (QoL) and improvements in functional exercise tolerance in people with chronic respiratory diseases such as CF. In addition exercise has been shown to increase respiratory muscle endurance, increase sputum expectoration and preserve respiratory function in some individuals with CF, where a higher level of aerobic fitness also correlated with a decreased risk of mortality (Radtke 2015; Webb 1995).
Types of outcome measures
Primary outcomes
-
Respiratory function
-
forced expiratory volume at one second (FEV₁)
-
mid‐expiratory flow (FEF25‐75 )
-
forced vital capacity (FVC)
-
expiratory reserve volume (ERV) or reserve volume (RV)
-
Secondary outcomes
-
Sputum
-
volume
-
weight (dry or wet)
-
-
Exercise tolerance (as measured by recognised standard exercise tests e.g. walk tests, step tests or cycle ergometry)
-
Quality of life (QoL) indices, e.g. CF QOL questionnaire
-
Level of oxygen saturation in response to treatment
-
Frequency of exacerbations (as defined by Rosenfeld (Rosenfeld 2001)) as a consequence of the treatment intervention
-
Participant reported satisfaction with treatment intervention
-
Lung clearance index
Search methods for identification of studies
There are no restrictions regarding language or publication status.
Electronic searches
We identified relevant trials from the Group's Cystic Fibrosis Trials Register using the term: 'oscillating devices'.
The Cystic Fibrosis Trials Register is compiled from electronic searches of the Cochrane Central Register of Controlled Trials (CENTRAL) (updated each new issue of the Cochrane Library), weekly searches of MEDLINE, a search of Embase to 1995 and the prospective handsearching of two journals ‐ Pediatric Pulmonology and the Journal of Cystic Fibrosis. Unpublished work is identified by searching the abstract books of three major cystic fibrosis conferences: the International Cystic Fibrosis Conference; the European Cystic Fibrosis Conference and the North American Cystic Fibrosis Conference. For full details of all searching activities for the register, please see the relevant sections of the Group's website.
Date of last search of the Cystic Fibrosis Trials Register: 27 April 2017.
We also searched the relevant clinical trials databases clinicaltrials.gov/ and WHO ICTRP using the terms 'cystic fibrosis' AND 'oscillation". Date of the latest search: 26 April 2017.
Data collection and analysis
Selection of studies
Two authors (LM and JA) independently reviewed all citations and abstracts identified by the search to determine which papers assessed should be included. If disagreement had occurred, the authors planned to seek resolution by consensus.
Data extraction and management
Both authors (LM and JA) independently performed data extraction and recorded data on forms developed for this purpose. If disagreement had occurred, the authors planned to seek resolution by consensus.
We planned to group outcome data those measured at one, three, six, 12 months and annually thereafter. If outcome data were recorded at other time periods, then we planned to consider examining these as well. We have subsequently considered these time points and felt that to combine data measured at two weeks with data measured at four weeks was inappropriate. Therefore, we have split the original proposed time point of one month and reported data at up to two weeks (Arens 1994; Braggion 1995; Darbee 2005; Davies 2012; Gondor 1999; Grzincich 2008; Hare 2002; Kluft 1996; Milne 2004; Osman 2010; Phillips 2004; Pike 1999; Varekojis 2003a; Warwick 1990; West 2010) and at over two weeks and up to one month (Homnick 1998; Padman 1999a).
We have considered trials identifying interventions of varying duration separately; we considered those of one to 12 weeks as short term; those over 12 to 24 weeks medium term; and those over 24 weeks as long term. We did not consider single‐treatment interventions, as it is unlikely that an individual can be instructed in the most appropriate usage of such devices or treatment techniques in a single session. We have identified three multiple‐arm trials which consider more than one oscillatory device when compared with conventional physiotherapy. In order to achieve a comparison we have set up 'dummy' study ID's which allow the data from the study to be entered more than once on the same graph (Modi 2006b; Padman 1999b; Varekojis 2003b). In addition, there are other trials which consider two or more therapies. Due to the limitations of the analysis we are able to carry out in RevMan 5, the participants in the control groups will appear in more than one comparison, i.e. be counted twice, and we would caution the reader to consider this when interpreting the graphs.
Assessment of risk of bias in included studies
Cochrane Reviews incorporate a recommended approach for assessing risk of bias in included studies. It is a two‐part tool, addressing the six specific domains (namely sequence generation, allocation concealment, blinding, incomplete outcome data, selective outcome reporting and ‘other issues’). Each domain includes one or more specific entries in a ‘Risk of bias’ table. Within each entry, the first part of the tool involves describing what was reported to have happened in the study. The second part of the tool involves assigning a judgement relating to the risk of bias for that entry. This is achieved by answering a pre‐specified question about the adequacy of the study in relation to the entry, such that a judgement of ‘Yes’ indicates low risk of bias, ‘No’ indicates high risk of bias, and ‘Unclear’ indicates unclear or unknown risk of bias.
In order to establish the risk of bias in the included studies, the two authors independently assessed the methodological rigour and quality of selected studies and reported on the six domains as recommended by theCochrane Handbook for Systematic Reviews of Interventions (Higgins 2011) and incorporated the criteria on quality assessment described by Jüni (Jüni 2001).
Generation of allocation sequence
We considered this as adequate, and a low risk of bias, if a computer algorithm or a similar process based on chance was used to randomise participants to treatment groups. We identified this as inadequate, and a high risk of bias, if sequences which could be attributed to prognosis, degree of disease severity, age etc were employed. We considered this unclear, and thus the risk of bias was also be unclear, where the generation of allocation sequence has not been identified.
Concealment of allocation
We considered concealment of allocation adequate where it was not possible for the investigators to foresee the allocation of participants to a particular treatment group, e.g. centralised or pharmacy‐controlled randomisation, pre‐numbered or coded identical containers administered serially to participants, on‐site locked computer system, or sequentially numbered, sealed , opaque envelopes. This means the study has a low risk of bias. We considered the concealment of allocation inadequate if the investigator was able to predict the allocation, e.g., alternation; the use of case record numbers, dates of birth or day of the week; thus the study has a high risk of bias. We graded this (and the risk of bias) as unclear if the concealment of allocation has not been described.
Blinding
We reported on the degree of blinding employed in each study. Given the treatment interventions and the specific devices for chest clearance which we have considered in this review, blinding of the investigator and participants was not possible: however, blinding of the person analysing the data was possible. The risk of bias is likely to be lower when these aspects of the trial are blinded, but frequently when the study compares the use of a device this is not practically possible.
Incomplete outcome data and intention‐to‐treat analysis
We described the completeness of outcome data for each main outcome and commented on attrition and exclusions from the study. If there was a discrepancy between total numbers randomised and numbers in each intervention group we reported on these and any reasons given for this occurrence.
We reported on whether the original investigators employed an intention‐to‐treat analysis (analysis based on the initial treatment allocation, not on the treatment eventually administered). We assessed whether the numbers and reasons for dropouts and withdrawals in all intervention groups were described or whether it was specified that there were no dropouts or withdrawals. If information is lacking on missing data, the risk of bias will increase.
Selective reporting
We considered the possibility that selective reporting influences the number of published articles and for this reason have also included abstracts and articles of non‐English language in our review. Following translation, we have included these articles in the review and entered data into the meta‐analysis where available.
We considered there to be selective reporting, if statistically non‐significant results were selectively withheld from publication. The most common reasons for non‐publication of results are ‘lack of clinical importance’ or lack of statistical significance. Therefore, meta‐analyses excluding unpublished outcomes are likely to overestimate intervention effects. We have tried where possible to include all identified outcomes within the meta‐analysis whether they demonstrated statistical significance or not and consequently reducing the likelihood of selective reporting within this review.
Within this review we have highlighted those references where selective reporting may have occurred. Examples of this include where we were unable to compare the original protocol of the study with the final paper and so we were unable to determine whether exclusions had occurred. Additionally, there were articles which identified particular variables in their outcome measures; however, these were not fully reported in their results. In these instances we have highlighted the discrepancies in the tables Characteristics of included studies and reported within the text of the review.
Other potential sources of bias
We considered that external bias could also influence the number of published articles and again this can be noted from the tables Characteristics of included studies. It is apparent that funding may have been sought, or indeed researchers identified, to consider mechanical or other devices, and their benefits, when compared to other techniques that do not necessitate potentially expensive equipment. This fact may limit the frequency of studies that include expensive equipment as research may be limited due to lack of funding streams.
Measures of treatment effect
For binary outcome measures, we planned to seek data on the number of participants with each outcome event, by allocated treated group, irrespective of compliance and whether or not the individual was later thought to be ineligible or otherwise excluded from treatment or follow up. We aimed to calculate a pooled estimate of the treatment effect for each outcome across studies using relative risk where appropriate.
For continuous outcomes, we recorded either mean relative change from baseline for each group or mean post‐treatment or intervention values and their standard deviations (these will be presented separately). If standard errors were reported, we planned to calculate the standard deviations if possible. We calculated a pooled estimate of treatment effect by calculating the mean difference.
Unit of analysis issues
When conducting a meta‐analysis combining results from cross‐over trials we planned to use the methods recommended by Elbourne (Elbourne 2002). However, only limited data were available and we entered the first‐arm data only from one trial (Oermann 2001); for the remainder we treated the cross‐over trials as if they were parallel trials. Elbourne states that this approach will produce conservative results as it does not take into account within‐patient correlation (Elbourne 2002). Also each participant appears in both the treatment and control group, so the two groups are not independent.
This review comprises data from both parallel and cross‐over studies, in the analysis of the data we have combined the results from both types of trial. In order to minimise the carry‐over effect from one arm to another, we have included only the data from the first arm of the cross‐over trial where possible as suggested by Curtin (Curtin 2002a); although taking data from the first arm of the trial reduces carry‐over it may offer a less efficient treatment estimate consequently leading to selection bias.
There were several studies which examined multiple treatment arms where more than one device was compared to conventional chest physiotherapy (Modi 2006a; Padman 1999a; Varekojis 2003a). We created duplicate references for each of these studies to enable data from both types of oscillatory device to be entered into the analysis. There was one paper where oscillatory devices were compared with the "usual" airway clearance technique (which encompassed a number of alternative therapies); however, we did not consider it meaningful to extract these data for inclusion in the analysis (Osman 2010). One further paper compared five different devices and again we were not able to extract the data in a clinically relevant way to be included in the analysis (Pryor 2010).
A further consideration noted in the study by Varekojis was that the data collected referred to the number of sputum samples rather than number of participants included in the study (Varekojis 2003a). This does accurately reflect how the comparison influenced sputum expectorated by participants, particularly as the number of samples compared were not equal. There were 24 participants in this study with six sets of sputum data anticipated for each treatment option; however, some of the sputum cups were contaminated by hemetemesis, one dried prior to wet weight being measured and one sputum cup was lost prior to weighing, leading to a discrepancy in terms of sputum samples across the intervention groups i.e. 142 compared to 143.
Dealing with missing data
If data were missing from the original trial reports, we planned to seek clarification from the authors. In the instance of a discrepancy between data in abstracts and the published article we sought clarification from the author and acted appropriately when considering data analysis.
Assessment of heterogeneity
The greater the consistency between the primary studies in a meta‐analysis, the more generalisable are the results. Heterogeneity refers to the genuine differences between studies rather than those that occur by chance. We planned to test for heterogeneity using the I² statistic (Higgins 2003). The values of I² lie between 0% to 100%, and we planned to use a simplified categorization of heterogeneity where we judge heterogeneity as low if the I² value is up to 25%, moderate up to 50% and high up to 75% (Higgins 2003). If this value were to be greater than 75% we would consider heterogeneity as extremely high.
Assessment of reporting biases
Many of the papers measured the outcome variables routinely and often during clinic visits. In the analysis of the papers, where possible, we have included the appropriate time points; however, it was often the case that measurements were recorded on completion of the study and it is these data that have been included in the tables of analyses. We examined the papers to assess when outcome variables were measured and which time points were reported. We recorded the data for each time point reported and noted if data were not presented for any of the outcomes. We looked for sponsorship of the trials by companies and whether this had been acknowledged in the papers. Furthermore, we noted if adverse events which could be a direct consequence of the use of the oscillating devices were reported in these papers.
Data synthesis
We analysed data using a fixed‐effect model, but if we had included sufficient studies for each outcome (at least four) and we had identified significant heterogeneity (where heterogeneity was 50% or greater), we planned to use a random‐effects model in the final analysis of the data.
Subgroup analysis and investigation of heterogeneity
There were insufficient combined data in the meta‐analysis for each comparison and outcome to allow for any of the planned subgroup analysis. If we had included a sufficient number of studies in the review and had identified moderate or high degrees of heterogeneity between studies in the meta‐analyses, we planned to investigate this by performing subgroup analysis of the following:
-
children (up to 16 years) compared to adults;
-
different treatment regimens (frequency per day and duration of treatment sessions) and concomitant medications (e.g. the use of bronchodilators or hypertonic saline);
-
participants with acute exacerbations compared to those with stable disease.
Sensitivity analysis
We also planned to perform the following sensitivity analyses to assess how robust the results of our meta‐analysis are:
-
study quality i.e. RCT compared to quasi‐RCT;
-
differing baseline characteristics of studies (specifically disease severity as measured by FEV₁ and defined as severely (FEV₁ < 45% predicted), moderately (FEV₁ > 46% to < 65% predicted) and minimally affected (FEV₁ > 65% predicted)).
The studies we included in the review were a mixture of cross‐over and parallel designed studies. In a post hoc change we decided to perform a sensitivity analysis including and excluding the studies with a cross‐over design to assess whether the study design had an effect on the results.
Summary of findings tables
In a post hoc change in line with current Cochrane guidance, at the 2017 update we added a summary of findings table for each comparison presented in the review. We selected the following seven outcomes to report (chosen based on relevance to clinicians and consumers):
-
FEV₁
-
FEF25‐75
-
FVC
-
Sputum volume
-
Sputum weight (dry or wet)
-
Frequency of exacerbations (as defined by Rosenfeld (Rosenfeld 2001)) as a consequence of the treatment intervention
-
Participant reported satisfaction with treatment intervention
We determined the quality of the evidence using the GRADE approach; and downgraded evidence in the presence of a high risk of bias in at least one study, indirectness of the evidence, unexplained heterogeneity or inconsistency, imprecision of results, high probability of publication bias. We downgraded evidence by one level if they considered the limitation to be serious and by two levels if very serious.
Results
Description of studies
Results of the search
A total of 302 references were identified from searches of the Cystic Fibrosis and Genetic Disorders Group's Cystic Fibrosis Trials Register combined with studies identified through attendance at international conferences. Searches of the international trials databases did not provide any further relevant studies for inclusion in this review. After initial consideration, those studies obviously not relevant to the review question or duplicated were discounted, leaving 119 references to 76 studies requiring closer inspection. Following further examination, 38 studies (50 references) were excluded, details of which can be found in the tables (Characteristics of excluded studies). There are 35 studies (65 references) included in the review, details of which are provided in the tables and and summarised in the text below (Characteristics of included studies). Three studies (four references), each as yet presented only as abstracts (Herrero 2016; Patel 2013; Wheatley 2013), have been listed under 'Studies awaiting classification' pending publication of the full study reports (Characteristics of studies awaiting classification). This is summarised in a study flow diagram (Figure 1).

Study flow diagram.
Included studies
Of the included studies, 11 were published as abstracts only (Davies 2012; Giles 1996; Gotz 1995; Grzincich 2008; Hare 2002; Lyons 1992; Marks 2001; Modi 2006a; Pike 1999; Prasad 2005; Warwick 1990), with only two of these providing data that could be included in the meta‐analyses (Giles 1996; Grzincich 2008).
Trial design
A cross‐over design was used in 20 studies, and the remaining 15 studies used a parallel design. A total of 16 studies were generated by research carried out in the USA and 15 of these were single centre. The UK generated eight single‐centre studies, and the remaining 11 studies came from Europe, Canada and Australia. In addition there were four multi‐centre studies, two from the USA and one from Canada and one from Germany. Study duration varied widely; ranging from two days (Braggion 1995) up to 2.8 years (Modi 2006a) and duration was unspecified in three studies analysed.
Participants
The 35 included studies involved a total of 1138 participants and the numbers in each trial varied from five (Hansen 1990) to 166 (Modi 2006a). Participant age (when identified) varied from four years to 63 years of age; on closer inspection 19 of the studies included children younger than 16 years of age. Eight studies did not describe their gender split, and in the 27 studies which did, 22 of them had a greater number of male participants. There were 16 studies which did not identify whether participants were in a stable condition or experiencing an exacerbation. In the 19 studies that did report this factor, seven studies included participants who were deemed stable at the time of study initiation and 12 studies included participants who were admitted to hospital for the management of clinical exacerbations.
Interventions
As a consequence of many different descriptions of therapy techniques, it was considered by the authors that certain manual therapies could be combined and considered as one 'type' of therapy. For this reason we have grouped the techniques of postural drainage and percussion (PD&P), postural drainage and clapping (PD&C) and postural drainage percussion and vibration (PDPV) under the term conventional physiotherapy (CPT). Unless otherwise stated we have assumed that CPT is a derivative of, or comparable to, the other terms used in the grouping.
There were 10 studies which failed to identify the frequency of interventions performed on a daily basis. Where this was reported, the most common frequency of treatment interventions was twice daily with a range of one to four times daily. Where there were treatment comparisons, these were done at the same time of day and the same frequency of interventions occurred.
Outcomes measured
Once again the diversity of outcomes measured was great. However, the most frequently used clinical outcome measure was respiratory function (28 studies included respiratory function parameters in their outcome data), followed by sputum weight (14 studies) and individual satisfaction (11 studies).
Excluded studies
A total of 38 studies were excluded.
The authors consider it unlikely that an individual can be instructed in the appropriate usage of therapy devices or treatment techniques in a single session and consequently 21 studies were excluded using this criteria (Borka 2012; Dosman 2003; Dunn 2013; Dwyer 2017; Elkins 2004; Elkins 2005; Fainardi 2011; Grosse‐Onnebrink 2017; Hartsell 1978; Kempainen 2007; Konstan 1994; Lagerkvist 2006; Lindemann 1992; Marks 1998; Marks 2004; McCarren 2006; Natale 1994; Newhouse 1998; Scherer 1998; Stites 2006; Van Ginderdeuren 2008). Despite best efforts in specifying appropriate search terms 10 studies had to be excluded on the grounds that they did not concern either the population under review (Cegla 1993) or indeed the types of devices we were comparing on this occasion (Cantin 2005; Jarad 2010; Kraemer 1996; Kirkpatrick 1995; Liedtke 1996; Morris 1982; Salh 1989; Skopnik 1986; Webber 1984). One study was excluded as a consequence of incomplete data being reported in the abstract and the authors not being available for a response to requests for the missing data (Roos 1987). A further study was excluded as it did not contain any of the outcome measures we had identified as useful to this review (Majaesic 1996). One study of hypertonic saline in conjunction with acapella was excluded as the only difference between treatment groups was the timing of hypertonic saline administration (O'Neil 2017) The remaining four studies were excluded as (following translation of the full papers) were not RCTs (Amelina 2014; Orlik 2000a; Orlik 2000b; Orlik 2001).
Studies awaiting classification
Three studies, which have only been presented as abstracts, are awaiting further assessment pending further publications to clarify eligibility criteria (Herrero 2016; Patel 2013; Wheatley 2013) and details are given in the tables (Characteristics of studies awaiting classification).
The Herrero study is a cross‐over RCT comparing a combined therapy (nebulised hypertonic saline plus oscillatory PEP (Acapella®) to nebulised hypertonic saline alone. Each treatment arm lasted five days (running consecutively) with a one‐week washout period in between arms. The study was conducted across seven CF centres in Spain and recruited 19 participants with stable CF. Outcomes measured included sputum volume, pulmonary function, cough and personal preference (Herrero 2016).
The Patel study compared HFCWO to the Metaneb® during a 14‐day study period. The primary outcome measure was the time to cessation of sputum expectorated, with data for respiratory function and participant satisfaction also collected (Patel 2013).
The Wheatley study had two phases, but only the second phase will likely be eligible for inclusion in the review. This part of the study includes 12 participants in a hospital setting and compares the VibraLung® to the Vest® over a five‐day period of two sessions per day (Wheatley 2013).
We will further assess these studies for inclusion in the review when the full papers have been published and more data are available.
Risk of bias in included studies
Further details can be found in the risk of bias sections of the Characteristics of included studies tables.
Allocation
Considering the risk of bias graphs (Figure 2; Figure 3), we can determine that approximately 10% of the published studies had a high risk of allocation bias. This was apparent where there was no clear evidence that the allocation sequence could not be compromised by those entering participants into the studies. Methods of allocation were frequently omitted or described as alternate, and means of randomisation, concealment and sequence generation were not clearly identified. Approximately a further 85% of published studies had an unclear risk of bias, leaving only 5% of studies with a low risk of allocation bias.

Risk of bias: review authors' judgments about each risk of bias item presented as percentages across all included studies.

Risk of bias summary: review authors' judgements about each risk of bias item for each included study.
Generation of sequence
Six studies were judged to have a low risk of bias (Braggion 1995; Darbee 2005; McIlwaine 2013; Newbold 2005; Osman 2010; West 2010). Randomisation according to Latin square design described by Williams (Williams 1949) was used in only one study (Braggion 1995). Darbee used a coin toss to decide which group the first participant was allocated to (Darbee 2005). A random numbers table and block randomisation were used in only one study which used sealed envelopes to conceal allocation; the envelopes were opened in sequence, which may itself be a form of allocation bias (Newbold 2005). A computer‐generated randomisation table was used in two studies (McIlwaine 2013; Osman 2010). In one study, the allocation sequence was generated by placing 36 pieces of paper (18 PEP mask and 18 acapella) in double‐sealed envelopes one of which was opened for each enrolled participant by a research assistant not otherwise involved with the study and then the envelope was discarded (West 2010).
The remaining studies (n = 29) had an unclear risk of bias.
Concealment of allocation
We judged four studies to have a low risk of bias (McIlwaine 2013; Newbold 2005; Phillips 2004; West 2010). The McIlwaine study used a process of central allocation by an independent statistician, following which the allocation sequence was sent to the study coordinator, thus reducing the risk of bias significantly (McIlwaine 2013). The three remaining studies used sealed envelopes to conceal allocation (Newbold 2005; Phillips 2004; West 2010). Three studies were judged to have a high risk of bias (Darbee 2005; Hare 2002; Homnick 1998). Darbee used a coin toss to decide which group the first participant was allocated to, thereafter allocation was by alternation i.e. could be foretold; therefore we judged there to be a high risk of bias from this method (Darbee 2005). The other two studies with a high risk of bias also used alternate allocation (Hare 2002; Homnick 1998). In the remaining studies (n = 28), allocation concealment was not discussed and we judged these to have an unclear risk of bias.
Blinding
As the therapies being compared require participant participation and on occasion the inclusion of a device, it is not possible to blind participants and the clinicians who are implementing the treatments to the treatment group. However, it is possible to blind those individuals collecting data and assessing outcomes. Of the 35 studies available for analysis, only 11 studies identified that blinding of some or all of the outcome assessors or investigators had taken place and hence were judged to have a low risk of bias (Gondor 1999; McIlwaine 2001; McIlwaine 2013; Newbold 2005; Osman 2010; Phillips 2004; Pike 1999; Pryor 1994; Pryor 2010; van Winden 1998; West 2010). Of the remaining 24 studies, 16 were characterised as unclear on the subject of blinding, principally as this had not been discussed throughout the paper (Darbee 2005;Davies 2012; Giles 1996; Grzincich 2008; Hansen 1990; Hare 2002; Homnick 1995; Homnick 1998; Khan 2014; Kluft 1996; Lyons 1992; Marks 2001; Modi 2006a; Oermann 2001; Padman 1999a; Varekojis 2003a); eight studies had not used any recognisable means of blinding assessors and were judged to have a high risk of bias (App 1998; Arens 1994; Braggion 1995; Gotz 1995; Milne 2004; Prasad 2005; Warwick 1990; Warwick 2004).
Incomplete outcome data
Incomplete data were essentially due to participant dropout. Reasons for withdrawal were given in 13 studies, which we judged to have a low risk of bias (App 1998; Arens 1994; Homnick 1998; Kluft 1996; McIlwaine 2001; McIlwaine 2013; Milne 2004; Newbold 2005; Oermann 2001; Osman 2010; Phillips 2004; van Winden 1998; West 2010). Principally this was reported as being: due to chest infections leading to withdrawal by the investigators (App 1998; McIlwaine 2001; McIlwaine 2013; Oermann 2001); early discharge and consequent incomplete data collection (Osman 2010; West 2010); and failure to comply with the treatment regimen (Arens 1994; Kluft 1996; McIlwaine 2001; McIlwaine 2013; Newbold 2005). In the remaining 22 studies, reasons for any withdrawals that occurred were not given, leading to a potentially higher risk of bias.
Selective reporting
Many of the papers measured the outcome variables routinely and often during clinic visits. In the analysis of the papers, where possible, we have included the appropriate time points. However, it was often the case that measurements were recorded on completion of the study and it is these data that have been included in the tables of analyses. The authors found occasionally that some parameters, e.g, blood oxygen measurements, were taken but were not commented upon in the published paper. Four studies were thought to have the potential for selective reporting where information had been collected but no further comments were made; e.g., days lost from work or school although identified as being an outcome variable had not been reported in the results (App 1998; Braggion 1995; Marks 2001; Modi 2006a).
Other potential sources of bias
The possibility of bias due to order of the treatments was unlikely as in all of the studies where a cross‐over occurred, the order of treatment interventions were randomised or alternated. Study fatigue is always a consideration when using small populations such as those with CF; and indeed one study by Newbold identified this as a reason why some participants declined inclusion into the study (Newbold 2005). However, as the majority of the studies included in this review are short term, one might surmise that there was little opportunity for study fatigue to impact upon adherence and this was not an outcome we chose to measure.
The possibility of publication bias is an important point to consider. The effect of this is that published studies may not be truly representative of all valid studies undertaken, and this bias may distort meta‐analyses and systematic reviews of large numbers of studies. The problem may be particularly significant when the research is sponsored by entities that may have a financial interest in achieving favourable results.
When specific devices were used, there was some evidence of sponsorship by way of provision of equipment by the manufacturers and this may be considered as a source of bias. However, this did not necessarily favour the device over other modalities. The original authors in the seven studies where this occurred, acknowledged the manufacturers for their sponsorship (Darbee 2005; Gondor 1999; Hare 2002; McIlwaine 2013; Modi 2006a; Osman 2010; Padman 1999a). There were few reported incidences of adverse reactions to the therapy regimens implemented, and in the unlikely event of an adverse event occurring, it was not found to have occurred as a consequence of the device under scrutiny. This may be due to the safety of these devices or indeed may reflect reporting bias; however, we are unable to reach a firm conclusion about this.
One paper also reports that a natural competition between two different therapists was created leading to the potential that the data could be skewed depending on how competitive or enthusiastic the therapists were (Warwick 2004).
Three papers had a discrepancy between number of participants and a greater number of data sets collected (Homnick 1998; Pryor 2010; Varekojis 2003a). Whilst the papers acknowledged this fact, it may have led to duplication of data and a consequent skewing of results.
One study reported that the measured levels of oxygen saturation were higher at baseline in the HFCWO group than in the group using their 'usual' airway clearance techniques, which could be a potential source of bias as groups were not balanced at the beginning of the intervention (Osman 2010).
In the West study, there were clear differences at baseline for age, FEV₁, and exercise performance; participants allocated to the PEP arm of the study were older, had a greater FEV₁ and exercise ability than those in the acapella arm (West 2010). These discrepancies were attributed to the smaller than proposed sample size.
In addition, where the studies included children under 16 years of age, it is a possibility that parental influence may have occurred as there appeared to be no measures in place to eliminate or reduce this possibility.
Effects of interventions
See: Summary of findings for the main comparison Oscillating devices compared with positive expiratory pressure (PEP) for cystic fibrosis; Summary of findings 2 Oscillating devices compared with breathing techniques for cystic fibrosis; Summary of findings 3 Oscillating devices compared with conventional physiotherapy for cystic fibrosis; Summary of findings 4 Oscillating devices compared with different oscillating devices for cystic fibrosis
Oscillating devices versus PEP
A total of 15 studies reported on this comparison (Braggion 1995; Darbee 2005; Davies 2012; Gotz 1995; Grzincich 2008; McIlwaine 2001; McIlwaine 2013; Newbold 2005; Oermann 2001; Osman 2010; Padman 1999a; Prasad 2005; Pryor 2010; van Winden 1998; West 2010). When comparing oscillatory devices with PEP, there were studies which used PEP alone as the control and other studies where oscillatory treatments were compared to treatment regimens which may also have included PEP, e.g. two studies compared two different oscillating devices (HFCWO, Flutter or Cornet) to PEP (Osman 2010; Pryor 2010). A number of different oscillating devices were used in this comparison: five used HFCWO (Braggion 1995; Darbee 2005; Grzincich 2008; McIlwaine 2013; Osman 2010;); five used flutter (McIlwaine 2001; Newbold 2005; Osman 2010; Pryor 2010; van Winden 1998); one used IPV (Gotz 1995); one used acapella (West 2010) and two used cornet (Prasad 2005; Pryor 2010). The Padman study was comprised of three arms comparing flutter to PEP and CPT, but in this section we present only the data from the comparison of flutter and PEP (Padman 1999a).
The Pryor study compared flutter, cornet, PEP, ACBT and AD; however, due to the multiple comparators we have not included the data in our meta‐analysis. Khan, Davies and Osman compared an oscillating device to 'usual airway clearance technique' which included several comparator interventions combined and we found it difficult to breakdown the data meaningfully and therefore have not included it in our meta‐analysis (Davies 2012; Khan 2014; Osman 2010).
Darbee measured outcomes pre‐ and post‐treatment at admission and at discharge (mean number of days in hospital was nine) (Darbee 2005). We have reported the post‐treatment values at discharge and entered these under the 'over one week and up to two week' time point.
Primary outcomes
1. Respiratory function
a. FEV₁
A total of 15 studies reported on this outcome; however, only nine had data that could be entered into the meta‐analysis (Braggion 1995; Darbee 2005; Grzincich 2008; McIlwaine 2001; McIlwaine 2013; Newbold 2005; Padman 1999a; van Winden 1998; West 2010) and six reported information we were only able to include narratively (Davies 2012; Gotz 1995; Khan 2014; Osman 2010; Prasad 2005; Pryor 2010).
Four studies reported post‐intervention data for FEV₁ per cent (%) predicted (Braggion 1995; Darbee 2005; Grzincich 2008; van Winden 1998). Grzincich recorded FEV₁ pre and 30 minutes post each treatment intervention during a three‐day study period (Grzincich 2008). Braggion evaluated the time points of up to one week in their analysis for HFCWO compared with PEP (Braggion 1995). Darbee also compared HFCWO and PEP and reported data at hospital discharge (average duration nine days) (Darbee 2005). Another study evaluated FEV₁ % predicted when comparing flutter and PEP at over two weeks and up to one month (van Winden 1998). None of these were statistically significant (Analysis 1.1).
Five studies reported FEV₁ % predicted as the change from baseline (McIlwaine 2001; McIlwaine 2013; Newbold 2005; Padman 1999a; West 2010). One study reported data collected at up to two weeks (West 2010). One study reported data at over two weeks and up to one month (Padman 1999a). Only three studies published data which could be combined and which evaluated FEV₁ % predicted as change from baseline at one year (McIlwaine 2001; McIlwaine 2013; Newbold 2005). There were no statistically significant changes identified for the change from baseline in FEV₁ % predicted at any of the time points evaluated in the meta‐analysis (Analysis 1.2).
There were six studies which did not have data available for inclusion in our meta‐analysis and these reported FEV₁ narratively (Davies 2012; Gotz 1995; Khan 2014; Osman 2010; Prasad 2005; Pryor 2010). The paper by Gotz considered the comparison of IPV with PEP for a period of two months; the study investigators felt IPV was not superior to PEP when FEV₁ was evaluated using a repeated measures analysis of variance, but there were no data given to support this finding (Gotz 1995). Prasad compared the cornet to PEP and the primary outcome measured was FEV₁ (Prasad 2005). However, there were no statistically significant differences identified despite a small increase in FEV₁ % predicted from baseline in both treatment arms (PEP 2.2% and cornet 4.3%) over the 12‐month study period. In concurrence with this finding, the Pryor study (n = 75) compared five different therapy techniques over a 12‐month period and found no statistically significant differences among any of the treatment modalities in the primary outcome of the change from baseline in FEV₁ % predicted (P = 0.35); the authors also noted that there was significant decline across the entire study population over the 12‐month period (P = 0.02) (Pryor 2010). Three studies comparing HFCWO to 'usual ACT' reported on FEV₁ % predicted (Davies 2012; Khan 2014; Osman 2010). Davies and Osman both reported that there was no significant change in FEV₁ between groups using HFCWO or their normal ACT (Davies 2012; Osman 2010). Khan (paper written in Russian with data translated) suggested that there was a change in FEV₁ using HFCWO as compared to control but this was not identified as significant (Khan 2014).
b. FEF25‐75
Nine studies reported on this outcome (Braggion 1995; Darbee 2005; Grzincich 2008; McIlwaine 2001; McIlwaine 2013; Newbold 2005; Padman 1999a; Pryor 2010; van Winden 1998); we were able to enter data from eight of these into the tables, but one study did not report data we could enter into our analysis (Pryor 2010).
Two studies evaluated the time points of up to one week in their analysis and considered FEF25‐75 % predicted for HFCWO compared with PEP, but there were no statistically significant results (Braggion 1995; Grzincich 2008). One further study also measured FEF25‐75 % predicted, with no statistical differences between flutter and PEP after one week and up to two weeks of treatment (Darbee 2005); the same was true of a fourth study which reported at two weeks of treatment (van Winden 1998) (Analysis 1.3).
Five studies reported on the change from baseline in FEF25‐75 % predicted ; none of these results were statistically significant (Analysis 1.4). One study reported no statistically significant differences between PEP and acapella after 10 days of treatment when evaluating FEF25‐75 % predicted (West 2010), When analysed in this review at the 'up to two weeks' time point. One of these showed no statistical differences between PEP and flutter at over two weeks and up to one month (Padman 1999a). In three studies no significant difference in the mean change or annual rate of change was found when FEF25‐75 was measured at one year and compared between PEP and flutter (McIlwaine 2001; McIlwaine 2013; Newbold 2005). The main publication for the later McIlwaine study reported that FEF25‐75 % predicted was trending downwards in the HFCWO group, but increased again between visit 5 (at 9 months) and visit 6 (at 12 months). The researchers found 30 out of 46 participants in the HFCWO group required antibiotics for a pulmonary exacerbation during this time, which they suggested could be a treatment effect and may be the reason for the (statistically non‐significant) increase in FEF25‐75 % predicted (McIlwaine 2013).
One study reported no statistically significant differences between the treatment modalities of PEP and oscillatory devices of either flutter or cornet when evaluating FEF25‐75 (Pryor 2010).
c. FVC
Nine studies reported on this outcome (Braggion 1995; Darbee 2005; Grzincich 2008; McIlwaine 2001; McIlwaine 2013; Newbold 2005; Pryor 2010; van Winden 1998; West 2010); eight studies were included in our meta‐analysis, but again there were no data from the Pryor paper available to enter into our analysis (Pryor 2010).
Two studies evaluated the time points of up to one week in their analysis and considered FVC % predicted for HFCWO compared with PEP; there were no statistically significant changes (Braggion 1995; Grzincich 2008). Further studies showed no significant differences in FVC % predicted between flutter and PEP after over one week and up to two weeks of treatment (Darbee 2005) or after two weeks and up to one month (van Winden 1998) (Analysis 1.5).
The remaining four studies in our meta‐analysis reported on the change from baseline in FVC % predicted (McIlwaine 2001; McIlwaine 2013; Newbold 2005; West 2010). West compared PEP and acapella and reported data at up to two weeks (West 2010). The remaining three studies compared PEP and flutter and we found no significant difference in the mean change or annual rate of change (McIlwaine 2001; McIlwaine 2013; Newbold 2005) (Analysis 1.6). We initially analysed these data using a fixed‐effects analysis, but identified a high degree of heterogeneity (I² = 71%). As stated in our methods, we re‐analysed the data using a random‐effects analysis, but in both cases the result was not statistically significant. As for FEV₁, close contact and phone calls from study coordinators may also have contributed to increased adherence identified in the later McIlwaine study and this high adherence may explain the increase in FVC % predicted in both groups from their baseline measurements (McIlwaine 2013).
Finally, Pryor reported no statistically significant difference between any of the treatment modalities for FVC (Pryor 2010).
d. expiratory reserve volume (ERV) or reserve volume (RV)
One study reported on this outcome, but did not provide data we were able to enter into the tables (Pryor 2010).
The investigators found no statistically significant difference between the treatment modalities in the parameter of RV as a percentage of total lung capacity (Pryor 2010).
Secondary outcomes
1. Sputum
a. volume
Two studies reported on this outcome (Grzincich 2008; Khan 2014). Only one study provided data for analysis (Grzincich 2008); sputum was collected following each treatment session when HFCWO was compared with PEP but results were not statistically significant (Analysis 1.7). The second study reported that there was an increase in sputum volume when HFCWO was compared to participants' usual ACT; however there were no data included and we are unaware of what interventions were included in the usual ACT treatment arm (Khan 2014).
b. weight (dry or wet)
Four studies reported on this outcome; only one had data for analysis (West 2010), the remaining three had no data to enter (Braggion 1995; Davies 2012; Osman 2010). When West compared PEP to acapella this was found to clear more sputum; however, this was not statistically significant (Analysis 1.8). These data, as with any wet sputum data, may not be clinically relevant as frequently wet sputum is mixed with salivary secretions and consequently may be misinterpreted as a greater volume and or weight of sputum collected. This is a point which is true for all wet weight sputum collected and not specific to this particular paper. Two studies of the studies which did not present data reported no statistical difference in the wet or dry weight of sputum expectorated when HFCWO was compared with PEP (Braggion 1995) or 'usual' airway clearance (Davies 2012). The remaining study was of a short duration (up to one week) and the investigators reported that a significantly greater weight of sputum was yielded when using usual ACT (which included PEP) (P < 0.001) compared to HFCWO (Osman 2010).
2. Exercise tolerance
Two studies reported on this outcome (Pryor 2010; West 2010). West assessed exercise performance by measuring the % change in distance achieved in the modified 10 m shuttle test (West 2010). Data showed no difference between treatments at up to two weeks (Analysis 1.12); however, the authors reported that 13 out of 22 participants had an improvement in exercise performance of greater than 10%, which they considered to be clinically significant. We were unable to enter data in the meta‐analysis for the second study (Pryor 2010). The study compared both cornet and flutter as oscillatory devices to PEP (and breathing techniques of AD and ACBT which will be discussed later in this review) and there were no statistical differences reported for exercise tolerance using the modified shuttle walk test (Pryor 2010).
3. QoL
Four studies reported on QoL indices (McIlwaine 2013; Newbold 2005; Prasad 2005; Pryor 2010). We able to enter data from the McIlwaine and Newbold studies into our analysis (McIlwaine 2013; Newbold 2005).
The McIlwaine study did not demonstrate a statistically significant difference in any domain evaluated (McIlwaine 2013). The Newbold study demonstrated that there were no significant differences between flutter and PEP in either of the two QoL scores utilised, which were the Quality of Well‐being Scale (QWBS) and the Chronic Respiratory Disease Index Questionnaire (CRQ) (Newbold 2005) (Analysis 1.9). One study comparing the cornet against PEP reported that there was a significant correlation between changes over 12 months in all parameters in the QWBS where current health was assessed, but no correlation when retrospective health over the previous 12 months was evaluated (Prasad 2005). The authors suggested the use of a more sensitive measure when evaluating perceived changes, particularly when children are considered (Prasad 2005). In the final study the investigators found no statistically significant differences among the treatment modalities in QoL indices (Pryor 2010).
4. Level of oxygen saturation in response to treatment
Interpretation of oxygen saturation is done using a finger probe and is most frequently written as SaO₂; however, some studies have recorded this as SpO₂, for ease of clarity we will be consistent in our reporting and use the abbreviation of SaO₂ for oxygen saturation values. Five studies reported on this outcome, but none of these had data available for analysis (Darbee 2005; Gotz 1995; Osman 2010; Padman 1999a; van Winden 1998).
The Darbee paper reported % SaO₂ but only within group differences and not between group data, thus we were not able to enter this into our analysis (Darbee 2005). The paper stated that PEP breathing was associated with increases in SaO₂ during treatment (P < 0.00004), but HFCWO therapy resulted in decreases in SaO₂ (P < 0.00004) (Darbee 2005). One study evaluated the value of IPV compared with PEP and found there to be no significant difference between the two techniques when considering the change in SaO₂ (Gotz 1995). Padman reported that the level of oxygen saturation remained over 95% in all participants; those in the PEP group had a tendency towards a further increase, although neither result was identified as statistically significant (Padman 1999a). The Osman paper measured the change in SaO₂ where measured data were higher in the HFCWO arm at baseline, during treatment and 30 minutes following treatment (however these were not significant) and as a consequence of their study grouping multiple comparators (breathing exercises, flutter, PEP and CPT) when compared with HFCWO, we felt it was difficult to breakdown the data meaningfully and so have not included the data in the meta analysis (Osman 2010). The fifth study found no significant difference in transcutaneous SaO₂ either before, immediately after or 30 minutes after completion of the physiotherapy treatments of PEP or flutter (van Winden 1998). There was some evidence of desaturation to under 92% identified in one participant using the PEP and six participants using the flutter; in all but one of these participants this episode of desaturation lasted less than two minutes.
5. Frequency of exacerbations
Four studies reported on the frequency of exacerbations (McIlwaine 2001; McIlwaine 2013; Newbold 2005; Prasad 2005); two of which had data which could be entered into our analysis (McIlwaine 2013; Newbold 2005).
The Newbold study found no significant difference in the mean number of hospitalizations owing to pulmonary exacerbations when flutter was compared with PEP (P = 0.2) (Newbold 2005) (Analysis 1.10). In the later study by McIlwaine, the number of pulmonary exacerbations per participant was reported as 1.14 in the PEP group as compared to 2.0 per participant in the HFCWO group (P = 0.007) (McIlwaine 2013). Additionally in this study, whilst the overall incidence was low, the number of pulmonary exacerbations requiring IV antibiotics in the HFCWO group was three times more than the PEP group (19 as compared to 6). After contact with the study investigators, we have received data that can be entered into our analysis for the number of participants experiencing an exacerbation requiring antibiotics. Significantly fewer participants in the PEP group than in the HFCWO group required antibiotics for a pulmonary exacerbation, OR 4.10 (95% CI 1.42 to 11.84); however, this result was no longer significant when considering just IV antibiotics (Analysis 1.11).
In an earlier study comparing flutter and PEP, McIlwaine suggested a statistically significant difference between the two groups in hospitalizations for a decline in pulmonary function; there were five hospitalizations in the PEP group and 18 in the flutter group (P = 0.03) (McIlwaine 2001). We were not able to enter these data in the meta‐analysis as it is not clear how many individuals experienced these hospitalizations. It is important to state that these hospitalizations did not occur until at least the sixth month of this year‐long study and there was a disproportionate number of participants using the flutter being admitted. Despite this being the case, there were no further withdrawals from the study because of significant clinical deterioration (McIlwaine 2001). The fourth study found no difference in pulmonary exacerbations requiring antibiotics when the cornet was compared with PEP over a 12‐month study period (Prasad 2005).
6. Participant‐reported satisfaction with treatment intervention
Seven studies reported on this outcome (Braggion 1995; McIlwaine 2013; Osman 2010; Padman 1999a; Prasad 2005; van Winden 1998; West 2010). Only one had data available for our analysis (West 2010).
West reported on user satisfaction using a five‐point scale to rate their satisfaction with aspects of efficacy, convenience, comfort, and overall satisfaction (West 2010). There was no significant difference between acapella and PEP (Analysis 1.13).
Osman reported on participant satisfaction based on comfort, efficacy, preference and frequency of urinary leakage; as a consequence of their study grouping multiple comparators (breathing exercises, flutter, PEP and CPT) when compared with HFCWO. We felt it was difficult to breakdown the data meaningfully and so have not included the data in the meta analysis (Osman 2010). However, in this paper 17 participants (55%) who completed the study, expressed a preference for their usual ACT over HFCWO (Osman 2010).
Tolerance to the treatments of HFCWO and PEP were discussed in the paper by Braggion, who referred to the results as good, but without statistical or other evidence to support this finding (Braggion 1995). Similarly in the paper by McIlwaine, participant satisfaction based on comfort, independence and flexibility showed no difference in the comfort and independence parameters, but PEP scored more highly when considering flexibility (P > 0.001) (McIlwaine 2013). When flutter was compared to PEP in the study by Padman, all participants reported they felt better and ease of expectoration was cited as having improved, although there were no data provided to support this finding (Padman 1999a). Prasad compared the cornet to PEP, with no significant changes in parameters over the year‐long study or indeed between treatment groups (Prasad 2005). One child in each group withdrew, with the reasons given being the device was either too difficult to clean or they preferred their original device. There was no correlation in the decision to continue with the device at the end of the study. The remaining study reported finding no statistical differences in satisfaction between the techniques of flutter and PEP (van Winden 1998).
7. Lung clearance index (LCI)
Only one study reported on this outcome (Prasad 2005). Despite no statistical evidence of effect of the treatment, the authors felt that LCI was a more sensitive measure of abnormal lung function and further studies should be directed at the clinical relevance of LCI as an outcome measure when conventional outcomes appear normal (Prasad 2005).
Oscillating devices versus breathing techniques
Seven studies reported on this comparison (App 1998; Milne 2004; Osman 2010; Phillips 2004; Pike 1999; Pryor 1994; Pryor 2010). Again, a variety of oscillating devices were employed: three studies compared flutter to breathing techniques (App 1998; Milne 2004; Pike 1999) and two studies compared HFWCO to breathing techniques (Osman 2010; Phillips 2004). The earlier Pryor study compared flutter combined with ACBT to ACBT alone (Pryor 1994) and the later Pryor study compared flutter, cornet, PEP, ACBT and AD and reported no statistically significant differences between the techniques for any outcome (Pryor 2010). In the Osman paper, as a consequence of their study grouping multiple comparators (breathing exercises, flutter, PEP and CPT) when compared with HFCWO, we felt it was difficult to breakdown the data meaningfully and so have not included the data in the meta‐analysis (Osman 2010).
Primary outcomes
1. Respiratory function
a. FEV₁
Seven studies reported on this outcome (App 1998; Milne 2004; Osman 2010; Phillips 2004; Pike 1999; Pryor 1994; Pryor 2010). We were able to enter data from the App study for FEV₁ % predicted at the time point 'over two weeks and up to one month' into our analysis (App 1998), and these showed no significant results when comparing flutter with AD (Analysis 2.1).
Five of the studies were of short duration and reported results up to one week, but no data were available for analysis. The Milne study found no statistical difference between flutter and ACBT (Milne 2004). Osman reported that there was no significant change in FEV₁ between groups using HFCWO or their normal ACT (Osman 2010). In the study comparing HFCWO to ACBT, Phillips reported statistically significant results for FEV₁ (L) (P = 0.03) in favour of ACBT (Phillips 2004). The study by Pike did not report any significant differences between treatments for pulmonary function (Pike 1999). The earlier Pryor study showed no statistical differences between ACBT and flutter and ACBT combined (Pryor 1994).
The later study by Pryor, which was 12 months in duration, found no statistical differences between treatment techniques of ACBT, AD, cornet, flutter and PEP when considering FEV₁ (P = 0.35) during the study period (Pryor 2010).
b. FEF25‐75
One study reported on this outcome and the investigators found no statistical difference between flutter and ACBT (Milne 2004).
c. FVC
Six studies reported on this outcome (App 1998; Milne 2004; Phillips 2004; Pike 1999; Pryor 1994; Pryor 2010)); but we were only able to analyse data from one of these (App 1998).
App found no significant changes throughout the study period of one month when comparing flutter and AD in a cross‐over study (Analysis 2.2). The investigators did, however, identify a tendency towards improvement of up to 6.5% from baseline in both groups, but attributed this to non‐specific improvement or the possibility of a training effect (App 1998).
Four studies were of short duration and reported results up to one week, but no data were available for analysis. Phillips compared HFCWO with the breathing techniques of ACBT and reported statistically significant results for FVC in favour of ACBT (Phillips 2004). The remaining three short‐duration studies demonstrated no significant differences between treatments for pulmonary function (Milne 2004; Pike 1999; Pryor 1994).
The later 12‐month study by Pryor found no statistical differences between treatment techniques of ACBT, AD, cornet, flutter and PEP (Pryor 2010).
d. ERV or RV
No studies reported on this outcome.
Secondary outcomes
1. Sputum
a. volume
One study reported on this outcome and provided data to enter into the analysis (App 1998).
App considered the use of flutter and AD, but there was no statistically significant difference between the two techniques, despite acknowledging a tendency for expectorated sputum volume to be greater following treatment with the flutter regardless of therapeutic order (Analysis 2.3).
b. weight (dry or wet)
Five studies reported on this outcome (Milne 2004; Osman 2010; Phillips 2004; Pike 1999; Pryor 1994); but data were only available for the analysis from one study (Milne 2004).
The Milne data showed no significant difference in sputum weight in the short‐term study when flutter was compared to ACBT (Analysis 2.4).
In the study by Phillips, it was stated that the weight of expectorated sputum was greater with sessions of ACBT that with HFCC, but this was not significant at the 24‐hour time point (Phillips 2004).
Pike also considered the outcome of wet sputum weight (Pike 1999). Using the cross‐over paired t‐test and McNemar's Chi² test for statistical analysis, they found no significant differences between treatments of flutter and ACBT when measuring wet sputum weight. As with the Pryor study, one of the monitored sessions was in supine (Pike 1999; Pryor 1994). It is not clear whether the participants had previously carried out their flutter therapy prior to adopting this position. It is not possible to use flutter in a postural drainage position other than sitting unless adaptations were made, and the implementation of adaptation was not apparent from the study methodology. Pryor considers the variables of ACBT alone versus ACBT with flutter (Pryor 1994). They report that there was a significant increase in the weight of sputum expectorated (P < 0.001) when ACBT alone was used.The remaining study was of a short duration (up to one week) and the investigators demonstrated that a significantly greater weight of sputum was yielded when using usual airway clearance techniques (of which included breathing techniques) (P < 0.001) compared to HFCWO (Osman 2010).
2. Exercise tolerance
One study reported on this outcome and found no statistical differences between treatment techniques of ACBT, AD, cornet, flutter and PEP when considering modified shuttle walk scores (Pryor 2010).
3. QoL
One study reported on this outcome and found no statistical differences between treatment techniques of ACBT, AD, Cornet, Flutter and PEP when considering the QoL score of CRQ and Short Form‐36 (Pryor 2010).
4. Level of oxygen saturation in response to treatment
Two studies reported on this outcome, but neither had any data available for analysis (Osman 2010; Pike 1999). In the cross‐over trial with two treatments per day, Pike reported that there was no statistically significant difference in SaO₂ between treatments (flutter or ACBT) (Pike 1999). The Osman paper measured the change in SaO₂ where measured data were higher in the HFCWO arm at baseline, during treatment and 30 minutes following treatment; however, these were not significant. As previously stated, due to the study design we felt it was difficult to breakdown the data meaningfully and so have not included the data in the analysis (Osman 2010).
5. Frequency of exacerbations as a consequence of the treatment intervention
There were no studies reporting on this outcome for this comparison.
6. Participant reported satisfaction with treatment intervention
FIve studies of short duration (up to two weeks) reported on this outcome, but none had any data which we could enter into our analysis (Milne 2004; Osman 2010; Phillips 2004; Pike 1999; Pryor 1994).
Milne considered satisfaction and whether participants were likely to change their preferred therapy following the study period; there were no statistical differences in satisfaction between the techniques and approximately 45% chose to continue with flutter either independently or in conjunction with ACBT (Milne 2004). Osman considered participant satisfaction in terms of comfort, efficacy and urinary leakage; however, these data are from combined interventions and we were unable to breakdown the data meaningfully in order to include it in our meta‐analysis (Osman 2010). The investigators in the Osman study identified that 55% of their study population preferred their normal ACT compared to HFCWO; in this study the normal ACT was either ACBT or AD 83% of control participants (Osman 2010). Phillips found that all participants in their cohort of 10 found the technique of ACBT to be comfortable (Phillips 2004). In the same study, 40% of participants found the HFCWO to be comfortable, but difficult to clear secretions (80%); however, all participants felt ACBT made it easier to clear secretions (Phillips 2004). Participant preference was reported in the Pike study, with 100% recommending ACBT and 55% flutter (P < 0.008) (Pike 1999). Comfort and convenience were considered in the Pryor study, with the addition of effect on breathlessness and if the participants were likely to change their regimen based on preference (Pryor 1994). Here participants found both treatments easy to use but most preferred ACBT due to helpfulness at clearing secretions. The three participants who did indicate a preference for flutter had discontinued within the month following completion of the study (Pryor 1994).
7. Lung clearance index
No studies reported on this outcome.
Oscillating devices versus conventional physiotherapy
A total of 16 studies reported on this comparison (Arens 1994; Braggion 1995; Giles 1996; Gondor 1999; Hansen 1990; Hare 2002; Homnick 1995; Homnick 1998; Kluft 1996; Lyons 1992; Modi 2006a; Padman 1999b; Osman 2010; Varekojis 2003a; Warwick 1990; Warwick 2004). There were three studies considering multiple treatment arms where more than one oscillatory device was compared to conventional chest physiotherapy (Modi 2006a; Padman 1999a; Varekojis 2003a). For each of these studies a duplicate reference was created to enable data from both types of oscillatory device to be entered into the analysis.
Six studies compared HFCWO to CPT (Arens 1994; Braggion 1995; Hansen 1990; Kluft 1996; Warwick 1990; Warwick 2004); three studies compared flutter to CPT (Giles 1996; Gondor 1999; Homnick 1998); and two studies compared IPV to CPT (Hare 2002; Homnick 1995). Four further studies compared multiple oscillating devices and CPT (Modi 2006a; Osman 2010; Padman 1999b; Varekojis 2003b). One study compared flutter, HFCWO and PD&P (Modi 2006a; Modi 2006b); another study compared flutter, PEP and CPT (Padman 1999a; Padman 1999b); the third study compared IPV, HFCWO and PD&P (Varekojis 2003a; Varekojis 2003b). These three studies presented data for different oscillating devices compared to a single arm of conventional physiotherapy and these data will be presented separately in this review as follows: flutter versus PD&P (Modi 2006a), HFCWO versus PD&P (Modi 2006b), flutter versus PEP (Padman 1999a), flutter versus CPT (Padman 1999b), IPV versus PD&P (Varekojis 2003a) and HFCWO versus PD&P (Varekojis 2003b). As a consequence of the Osman study grouping multiple interventions (breathing exercises, flutter, PEP and CPT) when compared with HFCWO, we have not included the results in the meta‐analysis (Osman 2010).
Primary outcomes
1. Respiratory function
a. FEV₁
A total of 10 studies reported 11 data sets on this outcome (Arens 1994; Braggion 1995; Giles 1996;Gondor 1999; Hare 2002; Homnick 1995; Homnick 1998; Modi 2006a; Modi 2006b; Osman 2010; Padman 1999b).
Four studies reported on absolute post treatment values for FEV₁ % predicted which we entered into our analysis (Braggion 1995; Giles 1996; Gondor 1999; Homnick 1995). These were reported at different time points and we were only able to combine data for the time point 'up to one week' (Analysis 3.1). Braggion compared FEV₁ % predicted for HFCWO compared with CPT and reported data at the time point of 'up to one week' but found no statistically significant differences between groups (Braggion 1995). The Gondor paper presents absolute data at day 7 and day 14 for this outcome, neither of which showed a significant difference between groups in our analysis (Analysis 3.1). However, the Gondor paper reports that there was a significant improvement in FEV₁ in both treatment groups over the two‐week treatment period, with the flutter group having a significantly higher increase from baseline by day 7 than the CPT group; further increases in FEV₁ from day 7 to the end of treatment were not significant and the investigators did not find any statistical difference between the treatment groups (Gondor 1999). Giles also reported this outcome and demonstrated no significant difference between flutter and CPT during or after the treatment periods (Giles 1996). The Homnick data also showed no significant differences in FEV₁ % predicted between IPV and CPT at the end of the six‐month study period (Homnick 1995).
Hare noted significant improvements from admission to discharge in the IPV group for FEV₁, but data were not provided to support this claim (Hare 2002). In the later Homnick study, investigators found no significant differences between flutter and CPT in % predicted FEV₁ (Homnick 1998).
Two studies reported data on the change in FEV₁ % predicted from baseline which we were able to enter into the analysis (Arens 1994; Padman 1999b). Arens reported data for the change from baseline in FEV₁ % predicted at time points of 'up to one week' and 'over one week and up to two weeks' for the comparison between HFCWO and CPT (Arens 1994); Padman reported data for this outcome at 'over two weeks and up to one month' (Padman 1999b). Analysis showed no significant differences between treatment groups at any time point (Analysis 3.2).
Osman reported that there was no significant change in FEV₁ between groups using HFCWO or their normal ACT (Osman 2010). As already stated, these data are from several comparator interventions combined and not included it in our meta‐analysis.
In the Modi study, no differences were identified between the three therapies (PD&P, FD, HFCWO) in FEV₁ % predicted (Modi 2006a; Modi 2006b). The data presented in the paper can not be analysed here as they report longitudinal decline in respiratory function as % predicted from baseline adjusted for BMI rather than a post intervention or change from baseline measure of lung function.
b. FEF25‐75
Eight studies reported nine data sets on this outcome (Arens 1994; Braggion 1995; Gondor 1999; Hare 2002; Homnick 1995; Homnick 1998; Modi 2006a; Modi 2006b; Padman 1999a). Only five had data suitable for analysis; of these, four presented data for absolute values of FEF25‐75 % predicted (Braggion 1995; Gondor 1999; Homnick 1995) (Analysis 3.3) and two presented change data (Arens 1994; Padman 1999a) (Analysis 3.4).
Two studies evaluated FEF25‐75 % predicted at the time point of up to one week (Braggion 1995; Gondor 1999). There were no statistically significant differences when comparing HFCWO with CPT (Braggion 1995), or when comparing flutter with CPT (Gondor 1999). The combined results also showed no significant difference (Analysis 3.3). In the earlier Homnick study, no significant differences were noted between IPV and CPT at the end of the six‐month study period (Homnick 1995).
Arens reported on the change from baseline in FEF25‐75 % predicted; the analysis did not show any statistically significant differences between HFCWO and CPT at either up to one week or over one week and up to two weeks (Arens 1994). Padman presented data for the time point over two weeks and up to one month which were similarly non‐significant (Analysis 3.4).
Two studies did not present data which could be entered into the meta‐analysis (Hare 2002; Homnick 1998). Significant improvements were described in the Hare study from hospital admission to discharge in the IPV group for FEF 25‐75, but data were not provided to support this claim when IPV was compared with CPT (Hare 2002). The later Homnick study reported no significant difference in FEF25‐75 % predicted at hospital discharge after admission for an exacerbation (Homnick 1998).
In the Modi study no statistically significant differences were identified between PD&P and FD or PD&P and HFCWO for FEF25–75% predicted however with FD and HFCWO there was considered to be a significant difference P=0.035 (Modi 2006a; Modi 2006b). The data presented in the paper can not be analysed here as they report longitudinal decline in respiratory function as % predicted from baseline adjusted for BMI rather than a post intervention or change from baseline measure of lung function.
c. FVC
Seven studies (eight data sets) reported on this outcome (Braggion 1995; Giles 1996; Gondor 1999; Hare 2002; Homnick 1995; Homnick 1998; Modi 2006a; Modi 2006b). Four of which had data suitable for analysis (Braggion 1995; Giles 1996; Gondor 1999; Homnick 1995).
Two studies evaluated FVC % predicted at up to one week in a comparison of HFCWO and CPT (Braggion 1995) and flutter and CPT (Gondor 1999). When entered into our meta‐analysis the data show no significant differences between treatment groups (Analysis 3.5). In the study by Giles, there was no significant difference between flutter and CPT during or after the treatment period of over two weeks and up to one month (Giles 1996). In the earlier Homnick study, no significant differences were noted between IPV and CPT at the end of the six‐month study period (Homnick 1995).
The later Homnick study compared flutter to CPT and reported no significant difference in FVC % predicted at hospital discharge after admission for an exacerbation (Homnick 1998). Hare compared IPV to CPT and also noted no significant difference between treatment groups at the end of the treatment period (Hare 2002).
In the Modi study, no differences were identified between the three therapies (PD&P, FD, HFCWO) in FVC % predicted (Modi 2006a; Modi 2006b).The data presented in the paper can not be analysed here as they report longitudinal decline in respiratory function as % predicted from baseline adjusted for BMI rather than a post intervention or change from baseline measure of lung function.
d. ERV or RV
Three studies reported on this outcome (Arens 1994; Hare 2002; Homnick 1998). Data were only available from the Arens study for the change from baseline at time points of 'up to one week' and 'over one week and up to two weeks' (Arens 1994). There was no significant difference for RV when comparing HFCWO and CPT at either time point (Analysis 3.6).
The remaining two studies reported on time points of 'up to two weeks' (Hare 2002; Homnick 1998). In the Hare study, significant improvements were noted from admission to discharge in the IPV group for RV, but again no data were supplied to support this finding (Hare 2002). In the study by Homnick, no significant differences were found between flutter and CPT, although RV improved significantly in each group from baseline to discharge (Homnick 1998).
Secondary outcomes
1. Sputum
a. volume
Two studies of short duration with time points of 'up to one week' reported on this outcome, but data were not suitable to enter into our analysis (Hansen 1990; Lyons 1992).
Hansen compared the HFCWO with CPT and reported a statistical difference in the volume of mucus cleared in favour of HFCWO (P < 0.001) (Hansen 1990). In the Lyons paper, the authors report the only statistically significant variable was sputum volume, where less sputum was produced on the "flutter only" day (P = 0.0015) (Lyons 1992). The suggestion therefore made by the authors is that flutter cannot be substituted for CPT.
b. weight (dry or wet)
Eight studies reported nine sets of information on this outcome (Arens 1994; Braggion 1995; Giles 1996; Kluft 1996; Osman 2010; Varekojis 2003a; Varekojis 2003b; Warwick 1990; Warwick 2004). There are two sets of data from the Varekojis study, one for IPV compared to PD&P (Varekojis 2003a) and one for HFCWO compared to PD&P (Varekojis 2003b). Six data sets were available to enter into the analysis from five studies (Arens 1994; Giles 1996; Kluft 1996; Varekojis 2003b; Warwick 2004).
FIve studies presented six sets of data for up to one week for both dry (Analysis 3.7) and wet sputum weight (Analysis 3.8). There were no overall significant differences between oscillating devices and CPT for either outcome at this time point (Analysis 3.7; Analysis 3.8). Although not significant in our analysis, Kluft reported a significant result in favour of HFCWO in the published paper for dry weight (P < 0.01, using a Wilcoxon signed rank test) (Kluft 1996). The results from the Kluft study for wet sputum weight significantly favoured oscillating devices compared to CPT when entered into our analysis, MD 3.90 g (95 % CI 0.08 g to 7.72 g) (Kluft 1996). When the duration of sampling was further analysed it would appear that the sputum was collected over a six‐day period (Kluft 1996), yielding a greater sampling period than the other studies in the comparison which were collected over a 1‐hour to a 24‐hour period. One study reported sputum weights at over one week and up to two weeks (Warwick 2004); and only one further study reported sputum weights over two weeks (Giles 1996).
The remaining three studies do not have data available to enter into the meta‐analysis. The first of these studies, no data were provided, but the investigators noted that there was no significant difference in sputum weight (either wet or dry) between the HFCWO group or the CPT group when measured at the end of the treatment period (Braggion 1995). The second study was of a short duration (up to one week) and the investigators demonstrated that a significantly greater weight of sputum was yielded when using breathing techniques (P < 0.001) compared to HFCWO (Osman 2010). However, as a consequence of this study using multiple comparators we found it difficult to break down the data meaningfully and have not included the data in the meta‐analysis. In the remaining study, Warwick measured both wet and dry sputum weight following treatments of either CPT and HFCWO in his 1990 abstract. He found that there was no statistical difference (P = 0.221) for the wet weights but a significant difference for dry weights (P = 0.046)favouring the HFCWO in the 13 pairs of samples analysed (Warwick 1990).
2. Exercise tolerance
One study reported on this outcome using the six‐minute walk test (Gondor 1999). The analysis showed no significant differences between treatment groups when walk distance was evaluated after two weeks of treatment (Analysis 3.9).
3. QoL
The Modi study reports health‐related QoL for 12 domains in the CFQ (Modi 2006a; Modi 2006b). The ITT analysis of data from the final questionnaire revealed a mean (SD) difference between treatment groups only in the domain of 'Body Image' (PD&P = 87.9 (3.1), flutter = 82.6 (3.4), HFCWO = 78.2 (3.1), P = 0.03). The change in each CFQ domain from baseline to the first or fifth assessment after randomization, and the change from baseline to the final CFQ assessment obtained (ITT analysis) only showed a difference in the 'Social' domain at the final assessment. However, after correcting for multiple comparisons in the CFQ analyses, these results were non‐significant. The CFQ 'Respiratory Domain' score was positively correlated with the overall satisfaction score in the Treatment Satisfaction Survey (TSS) at the final assessment point (R = 0.23, P < 0.006).
4. Level of oxygen saturation in response to treatment
Four studies reported on this outcome (Arens 1994; Gondor 1999; Osman 2010; Padman 1999b), but only one provided data which could be entered into our analysis (Arens 1994).Data from both time points, up to one week and over one week and up to two weeks, did not favour either treatment (Analysis 3.10). However, the clinical relevance of this result is questionable as frequently activities such as ACTs correspond with a transient decrease in SaO₂ and there is no suggestion that it did not return to normal pre‐treatment values within a reasonable time period (e.g. 20 minutes).
Gondor monitored SaO₂ during the study period and reported no significant differences between treatment with either flutter or CPT (Gondor 1999). Padman reported that SaO₂ was higher than 95% in all participants, with no statistical difference between treatments (Padman 1999b). The Osman paper measured the change in SaO₂ during treatment and 30 minutes following treatment; SaO₂ levels were higher in the HFCWO arm at baseline, however, the differences between groups were not significant (Osman 2010). As already stated, the study grouped multiple comparators (breathing exercises, flutter, PEP and CPT) to compare with HFCWO and so we have not included the data in the meta‐analysis.
5. Frequency of exacerbations as a consequence of the treatment intervention
Four studies reported on this outcome, with three providing data for analysis on the number of days of hospitalisation (Arens 1994; Gondor 1999; Homnick 1995; Modi 2006a; Modi 2006b). Our analysis showed no significant difference between oscillating devices or CPT at either 'up to one week' or 'over one week and up to two weeks' (Analysis 3.11). The Modi study reported no significant difference in the time to next pulmonary exacerbation across the comparators (Modi 2006a; Modi 2006b).
6. Participant reported satisfaction with treatment intervention
Nine studies with eleven separate comparisons reported on this outcome (Arens 1994; Braggion 1995; Giles 1996; Hare 2002; Homnick 1995; Modi 2006a; Modi 2006b; Osman 2010; Padman 1999b; Varekojis 2003a; Varekojis 2003b). We were only able to enter data from the Varekojis study and the Modi study in our analysis for this outcome (Modi 2006a; Modi 2006b; Varekojis 2003a; Varekojis 2003b).
In the short term, Varekojis looked at the comparisons of IPV and PD&P (Varekojis 2003a) and HFCWO and PD&P (Varekojis 2003b). There was no statistical difference reported by the investigators in either treatment arm compared to PD&P when participant satisfaction was measured by Friedmans test. Similarly, our analysis also showed no significant difference between groups (Analysis 3.12). Conversely, when Modi reported on the long‐term treatment satisfaction (up to three years) looking at subsets of comfort, convenience and efficacy as well as overall satisfaction, significant differences were found for all measures favouring both flutter and HFCWO over PD&P (Analysis 3.13). When the investigators carried out sub‐analysis of the data according to age, they found that oscillating devices gave adolescent participants a degree of independence from their care givers which may have impacted on their improved preference over PD&P. It should be noted that the last reported TSS scores were associated with participant withdrawal from the study, indicating individuals with lower TSS were more likely to withdraw. (Modi 2006a; Modi 2006b).
Arens reported participant satisfaction from the HFCWO arm of the trial only; 88% (22 participants) in this treatment group expressed satisfaction with this technique and requested this therapy in the management of further exacerbations (Arens 1994). Braggion discussed tolerance to the treatments of HFCWO and PD&P and referred to the results as "good", but without statistical or other evidence to support this finding (Braggion 1995). Giles reported that flutter was preferred by participants based on comfort and convenience (Giles 1996). In the paper by Hare, participants in the IPV group were reported to be generally satisfied with the device (Hare 2002). Homnick evaluated participant satisfaction in the IPV group (the questionnaire was not given to the CPT group) and reported that all eight respondents would continue to use the IPV device if given the opportunity (Homnick 1995).In the Padman study, it was reported that participants felt they were in control of all their therapies, felt physically better and mucus was more easily expectorated with no preference given to any modality (Padman 1999b). The Osman study considered participant satisfaction in terms of comfort, efficacy and urinary leakage; however, these data are from combined interventions and we felt we were unable to breakdown the data meaningfully therefore have not included this data in the meta‐analysis. Investigators reported that 55% of the study population preferred their normal ACT compared to HFCWO (Osman 2010).
7. Lung clearance index
No studies reported on this outcome.
Different oscillating devices compared
Six studies (eight data sets) compared different oscillating devices (Marks 2001; Modi 2006a; Modi 2006b; Oermann 2001; Osman 2010; Pryor 2010; Varekojis 2003a; Varekojis 2003b). One study compared flutter and IPV (Marks 2001); three data sets compared flutter to HFCWO (Modi 2006a; Modi 2006b; Oermann 2001; Osman 2010); one study compared flutter to cornet (Pryor 2010); and the final study compared IPV and HFCWO (Varekojis 2003a; Varekojis 2003b). In order to avoid making this review more complicated, we have only listed below the outcomes for which we have any information. As a consequence of the investigators of the Osman study grouping several interventions (breathing exercises, flutter, PEP and CPT) when compared with HFCWO, we were unable to breakdown the data meaningfully and therefore have not included the results in the meta‐analysis; however, we would suggest that the reader consider the previous sections for general statements on relevant results within this paper (Osman 2010).
Flutter compared to IPV
Primary outcomes
1. Respiratory function
a. FEV₁
Marks reported no significant difference (P = 0.208) at the end of the 24‐week treatment period (Marks 2001).
b. FEF25‐75
Marks reported no significant difference (P = 0.126) at the end of the 24‐week treatment period (Marks 2001).
c. FVC
Marks reported no significant difference (P = 0.292) at the end of the 24‐week treatment period (Marks 2001).
Secondary outcomes
5. Frequency of exacerbations as a consequence of the treatment intervention
No difference was reported between groups when frequency of hospitalisations or need for home intravenous therapies was considered (Marks 2001).
6. Participant‐reported satisfaction with treatment intervention
Marks reported that IPV was well‐tolerated with 67% of participants wanting to continue using it instead of other ACTs (Marks 2001).
Flutter compared to HFCWO
Primary outcomes
1. Respiratory function
a. FEV₁
Three reported on this outcome (Modi 2006a; Oermann 2001; Osman 2010). Modi reported non significant change over the 12 months period between the different comparators (Modi 2006a). Oermann was a cross‐over trial and we have presented data from the first arm of the trial only (at one month) (Oermann 2001). Oermann reports absolute values for FEV₁ % predicted and the analysis shows these were not statistically significant, although tending to favour flutter (Analysis 4.1). The Osman study reported that no statistically significant change in FEV₁ % predicted was observed within or between either regimen of HFCWO or usual ACTs when compared with baseline (data not able to be meaningfully analysed in this review) (Osman 2010).
b. FEF25‐75
Oermann also reported on FEF25‐75 % predicted and again we have presented first‐arm data only (Oermann 2001). Absolute values for FEF25‐75 % predicted were not statistically significant, although again tending to favour flutter (Analysis 4.2).The Modi study reported that there was considered to be a significant difference in FEF 25‐75 between FD and HFCWO P=0.035 (Modi 2006a).
c. FVC
Oermann reported on this outcome with data for FVC % predicted and we have presented only data from the first arm of the trial (Oermann 2001). Results for FVC % predicted were not statistically significant, but tended to favour flutter (Analysis 4.3). Modi reported a non significant change over the 12 months period between the different comparators (Modi 2006a).
Secondary outcomes
4. Level of oxygen saturation in response to treatment
One study reported on this outcome but, as stated above, we have not been able to include any data in the meta‐analysis (Osman 2010).
6. Participant‐reported satisfaction with treatment intervention
Three studies reported on this outcome (Modi 2006a; Modi 2006b; Oermann 2001; Osman 2010), but we were only able to enter data into the analysis for one of these (Modi 2006a; Modi 2006b). Modi reported on differences between flutter and HFCWO regarding treatment satisfaction (Modi 2006a; Modi 2006b) with results clearly favouring flutter for convenience, whilst all other scores showed no difference, but the strong result for convenience means that the overall score is just significant in favour of flutter. Oermann also conducted a participant satisfaction survey considering efficacy, convenience and comfort. Whilst no significant difference was found between therapies for comfort, flutter was found to score significantly more for convenience (P < 0.02), as was seen in the Modi study, and HFCWO scored highest for efficacy (P < 0.02) (Oermann 2001). However, the investigators also reported that 13% of participants preferred their pre‐study therapy regimen of PD&P because of familiarity with the technique (Oermann 2001). Osman considered participant satisfaction in terms of comfort, efficacy and urinary leakage; the study identified that 55% of their study population preferred their normal ACT compared to HFCWO (Osman 2010).
Flutter compared to Cornet
Primary outcomes
1. Respiratory function
a. FEV₁
Pryor reported no statistical differences between treatment techniques of flutter and cornet when considering FEV₁ (P = 0.35) (Pryor 2010).
c. FVC
Pryor found no statistical differences between flutter and cornet for FVC (Pryor 2010).
Secondary outcomes
2. Exercise tolerance
Pryor used the modified shuttle walk score and found no statistical differences between flutter and cornet (Pryor 2010).
3. QoL
Pryor used the CRQ to assess QoL and found no statistical differences between flutter and cornet (Pryor 2010).
IPV and HFCWO
Secondary outcomes
1. Sputum
b. weight (dry or wet)
In the Varekojis study, the investigators collected 142 sputum samples from the IPV group and 143 samples from the HFCWO group. The paper states that the wet sputum weight in the IPV group was significantly greater than in the HFCWO group (P < 0.05, by Tukey's honest significant difference test) (Varekojis 2003a; Varekojis 2003b). However, on inspection of the data it became apparent that this evaluation was based on the number of samples in the analysis rather that the number of participants and their relevant corresponding sputum samples.The number of samples compared were not equal; 24 participants were included in the study with six sets of sputum data anticipated for each treatment option. However, some of the sputum cups were contaminated by hemetemesis (vomiting of blood), one dried prior to wet weight being measured and one sputum cup was lost prior to weighing, which accounts for the discrepancy in terms of sputum samples across the intervention groups.
6. Participant‐reported satisfaction with treatment intervention
Using a Friedmans test comparing the HFCWO and IPV, Varekojis reported no significant difference in preference between the techniques (Varekojis 2003b).
Discussion
Summary of main results
The initial aim of this review was to determine whether oscillatory devices as used in cystic fibrosis (CF) were effective for airway clearance and, if so, were they equivalent to, or superior to other recognised airway clearance techniques or devices. Outcomes included pulmonary function, sputum weight and volume, individual preference, quality of life (QoL) measures and number of hospitalisations per study period. Frequency of exacerbations was identified as an outcome and analysed as "days of hospitalizations" throughout the literature reviewed. Single‐treatment studies were excluded. There were no studies identified through the search process that compared exercise with any form of oscillatory device, or indeed where the acapella or Quake® were included as a comparison with any other form of airway clearance. We have also not yet been able to include data from studies of the newer devices (Metaneb® and VibraLung®). Therefore, these have not been included in the analysis or any further comments made. None of the intended subgroup analyses were possible due to either the small numbers of studies or to insufficient detail allowing the separating of subgroup data within any study.
There were no significant differences between participants on enrolment to studies when considering demographics, spirometry, anthropometrics and clinical scores. Most studies identified improvements in outcome measures from the beginning to the end of the study periods, although between‐group differences were most frequently not significant. Where there have been small but significant changes in secondary outcome variables, such as sputum volume or weight, this has not been wholly in favour of oscillatory devices. Sputum weight and volume may be considered to be somewhat misleading as an outcome variable as some individuals have difficulty expectorating and have a tendency to swallow their secretions. This can therefore significantly alter the results obtained.
It is the authors' opinion that oscillatory devices can be effective in clearing secretions, but despite evidence showing improvement in sputum volume, there is no statistically significant evidence to suggest that the use of these devices is superior to other physiotherapy techniques when respiratory function is the primary outcome in the short term. A study by Newbold compared flutter with positive expiratory pressure (PEP) in a 13‐month intervention and found there to be no statistical differences in respiratory function or health‐related QoL over the study period (Newbold 2005). In the most recent study looking at high frequency chest wall oscillation (HFCWO) versus PEP over a 12‐month period, results significantly favour the use of PEP over HFCWO when considering the number of exacerbations requiring antibiotics (but not those specifically requiring intravenous antibiotics) occurring in each group (McIlwaine 2013). When comparing the different types of oscillatory devices, there have been no statistical differences noted between any of the primary or secondary outcomes evaluated. On occasion, there were reported preferences for flutter over HFCWO; however, these did not reach statistical significance. It would appear therefore that oscillatory devices are a recognised therapy, but they are not superior to any other form of airway clearance or that one device is superior to another. It should also be acknowledged that longer‐term studies are essential when considering the differences between alternative airway clearance therapies.
Overall completeness and applicability of evidence
The literature appears to be representative of the airway clearance techniques available to participants with CF. Apart from the lack of evidence with regard to either acapella, Quake® or exercise, all therapy techniques are included, with recognition that alternative devices are in development (e.g., the Metaneb® and VibraLung®) and we await further information before being able to fully present these options. The literature also includes representation from both children and adults with mild to severe disease. Oscillatory devices have been compared with each other and all other recognised airway clearance techniques.
A total of 20 studies involved flutter as a comparison, 15 studies included HFCWO, five included IPV, two included cornet and one included acapella. There were no studies comparing, Quake®, Metaneb® or VibraLung® with any other treatment. These are more recently developed devices and that may account for the limited, or lack of, literature evaluating the efficacy of these devices. These devices may be included in future comparative studies as the variety of treatment options become more readily available for all people with CF.
Most studies have been short term and the literature recognises that short‐term studies demonstrating improved sputum clearance have not demonstrated preservation of respiratory function,decreased morbidity or shown improved QoL over the long term (Varekojis 2003a; Varekojis 2003b). Modi was unable to identify differences in clinical effectiveness as measured by FEV₁ decline over the duration of this three‐year study; however, perceived effectiveness as suggested by treatment satisfaction and convenience may lead to better adherence and result in long‐term improvements (Modi 2006a; Modi 2006b). In 2004, Milne also reported that in short‐term studies, it would be unlikely that changes, if they existed, would be apparent in single‐treatment days (Milne 2004). Whilst we did not include studies where one treatment session was compared with another, we did include those studies where a single day of treatment was included, if the therapy was conducted more than once during that day.
The greater the consistency between the primary studies in a meta‐analysis, the more generalisable are the results. Heterogeneity refers to substantial differences between studies rather than those that occur by chance. We planned to test for heterogeneity using the I² statistic (Higgins 2003); however, due to the limited data available for meta‐analysis, testing for heterogeneity was not always applicable.
Three instances of moderate to high heterogeneity were identified in our analysis. In the test for subgroup differences in the analysis, an I² value of 59% was calculated for the comparison oscillating devices versus PEP for the change from baseline in mid‐peak expiratory flow (FEF25‐75) (% predicted) between one study lasting one month (Padman 1999a) and three studies with a study period of one year (McIlwaine 2001; McIlwaine 2013; Newbold 2005); we believe this is due to the difference in study duration (Analysis 1.4). Between the same three studies, a value for I² of 71% was calculated for the change from baseline in FVC (% predicted) when we analysed the data using a fixed‐effect model (McIlwaine 2001; McIlwaine 2013; Newbold 2005). We re‐analysed these data using a random‐effects model, but the result remained statistically not significant (Analysis 1.6). These studies seem to be very diverse; however, due to the low number of studies, we were unable to investigate the causes of these instances of heterogeneity further.
Of the studies reviewed, 26 were less than three months in duration; and of these, 13 were considered to be of less than one‐week duration.
It is recognised that three of the studies have multiple treatment arms and in the analysis we have considered each treatment separately (Modi 2006a; Modi 2006b; Padman 1999a; Padman 1999b; Varekojis 2003a; Varekojis 2003b). It is potentially possible to conduct a multiple treatment analysis where all the treatments are assessed simultaneously across studies; however, it was not within the capabilities of the authors to conduct such an analysis, but this should be considered in future studies to ensure clarity of the meta‐analysis.Two of the studies included in the 2017 update have compared oscillatory devices with 'usual' airway clearance techniques, but the data for each individual technique were not identifiable and the authors were not able to extract data for analysis.
Quality of the evidence
The following limitations all highlight the need for further good quality RCTs.
Methodological quality of included studies
For the purposes of this review we have included only randomised controlled trials (RCTs) and quasi‐RCTs, which are the highest quality of research studies available. This has led to the inclusion of 35 individual studies, one third of which were published only as abstracts, thus limiting the amount of salient information we were able to retrieve from them with respect to methodology and data available for analysis.
Few studies were considered to be of relatively high methodological quality, and therefore at a low risk of bias, e.g. where there was definite evidence of allocation concealment and blinding of some of the researchers (Newbold 2005; Phillips 2004; McIlwaine 2013; West 2010). Only four studies reported blinded allocation to treatment, it is not possible to blind the participants to the physiotherapy interventions included in this review; however, in nine studies there was evidence that those researchers who were collecting lung function or sputum samples or performing other relevant testing were blinded to the treatment intervention. The potential for a high risk of bias due to lack of blinding in all these studies cannot be excluded.
A sensitivity analysis for those outcomes where data from parallel studies were compared with data from cross‐over studies was performed (Analysis 3.2; Analysis 3.3; Analysis 3.4; Analysis 3.5; Analysis 3.7; Analysis 3.8). The results however remained non‐significant and we conclude that the results are therefore robust.
Small numbers
There were relatively small numbers of participants enrolled in the included studies (range 5 to 166) and 50% of those studies included children. We appreciate the hypotheses by Newbold that adults have “fixed damage” and therefore less potential improvement as a consequence of chest physiotherapy (CPT) and that also the mean rate of decline in adults tends to be slower (Newbold 2005). This may have an impact on the accuracy of evidence when measuring the effect of a device on lung function irrespective of the duration of the study.
Inconsistency in study design
The included studies employed different interventions and outcome measures and therefore many could not be combined for inclusion into the meta‐analysis. As CPT is delivered by a therapist it must be considered that differences in technique delivery may have an impact on results achieved. This factor is most apparent in the Warwick study where competition between therapists was encouraged (Warwick 2004).
Applicability to present day practice
Ten of the included studies were conducted over 20 years ago. Applicability of the results to present day practice may be compromised due to changes in population characteristics and interventions, including more aggressive management of lung infection and improvements in antibiotics.
Quality of evidence
The quality of the evidence was assessed using the GRADE methodology and four Summary of Findings tables were generated (one for each comparison presented) (summary of findings Table for the main comparison; summary of findings Table 2; summary of findings Table 3; summary of findings Table 4). All of the included studies were graded as having low or very low quality evidence. Downgrading of evidence occurred for a number of reasons including small sample size, short duration of treatment and the use of a cross‐over design rather than a parallel design. There were also inadequacies noted in allocation concealment, a lack of blinding and incomplete data which suggested a high risk of bias. Anecdotal evidence and limited information on some of the intervention methodology further downgraded the evidence. This low or very low quality evidence suggests that if further research was conducted and resolution of these inadequacies existed then results would significantly influence the confidence in the estimate of effect of the interventions.
Potential biases in the review process
Several of the studies reported that they had received funding from the manufacturers of specific devices. In particular Hill‐Rom (manufacturers of "the Vest®") sponsored three studies (Darbee 2005; Modi 2006a; Osman 2010). Two of the studies evaluating flutter were provided with the devices by Scandipharm (Gondor 1999; Padman 1999a); and one intrapulmonary percussive ventilation (IPV) study was provided with the equipment by Vortran Ltd (Hare 2002). One study comparing HFCWO and PEP were loaned or provided with the devices respectively (McIlwaine 2013).
The risk of bias due to the carry‐over effect is also a major problem of combined design meta‐analysis on the assumption that the first period is devoid of bias, but this may lead to a biased subset of studies in a meta‐analysis and it is the price of a less efficient treatment estimate (Curtin 2002b). There is a possibility that this type of bias may have occurred in our meta‐analyses since the pooled data includes 11 studies of a cross‐over design and six of a parallel design. In addition, whilst the studies have considered treatment of participants when they are in a "stable" state and generally excluded participants who have had an increase in symptomology (either before inclusion or during the study) it is possible that participants have had different disease severity or levels of anxiety associated to their disease. As stated by Curtin, "such differences in study populations could be a source of heterogeneity in the treatment effect which is not caused by the design but confounded by it" (Curtin 2002a). As there were insufficient studies with data to allow sub‐group analysis it is not possible to further investigate the issue of heterogeneity.
Two studies reported flutter therapy in the supine position, but no supportive evidence was given to suggest how this was achieved (Pike 1999; Pryor 1994). Under normal circumstances, the manufacturers' guidelines are to use the flutter in a sitting position.
In his 1998 study, Homnick also suggested that the sample size of each comparison group should be 219 participants to achieve 80% power when considering FEV₁ as a quality primary outcome variable (Homnick 1998). With this factor in mind, all of the studies included in this review would be under‐powered and consequently any evidence of no improvement should be regarded with some caution, as the issue of power is more important when the findings are of no difference between interventions.
One particular study reported that when some of the eligible participants were approached regarding entry to the study, they felt that they were happy with their current therapy regimen and on occasion they felt they had been over‐studied (Newbold 2005).
Adherence to therapies has a major impact upon outcome measures; however, few of the studies considered this as a factor when evaluating the treatment intervention. Only those participants who adhered to twice‐daily treatment (based on diary records) at a level of 85% were included in the McIlwaine study (McIlwaine 2001). Although we did not specifically address adherence as an outcome measure, we did consider other subjective parameters such as QoL indices, tolerance and participant‐reported satisfaction, all of which ultimately impact upon a person's adherence to the therapy in question. Interest in participating in a study due to perceived effectiveness of a treatment, may have led to improved adherence and treatment satisfaction (McIlwaine 2013). Close contact and phone calls from study coordinators may also have contributed to increased adherence identified in the McIlwaine study; and the high adherence may explain the significant increase in percent predicted FEV₁ in both groups from their baseline measurements, which was reported in the paper (no data provided) (McIlwaine 2013).
One further point is the pooling of data between adults and children. Monitoring of the flutter technique is more challenging in children than adults, where the child may be less sensitive to the requirement for adjusting the gradient of the flutter to enable optimum oscillation. This could therefore reflect a difference in outcome if, in children, the treatment is not being optimised because of lack of understanding of the technique. However, if in practice children and adults are treated the same, a random‐effects analysis will be appropriate to give the average treatment effect across all adults and children.
Agreements and disagreements with other studies or reviews
The literature recognises that there is little, if any, evidence to support the use of one airway clearance technique or device over another. The findings of this review agree with the previous Cochrane Reviews which looked at PEP physiotherapy and CPT in people with CF (McIlwaine 2015; Main 2005).
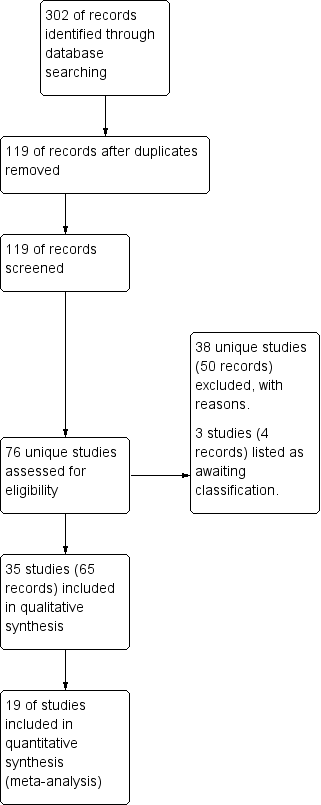
Study flow diagram.

Risk of bias: review authors' judgments about each risk of bias item presented as percentages across all included studies.

Risk of bias summary: review authors' judgements about each risk of bias item for each included study.
![Comparison 1 Oscillating devices (OD) versus positive expiratory pressure (PEP), Outcome 1 FEV₁ post‐intervention [% predicted].](/es/cdsr/doi/10.1002/14651858.CD006842.pub4/media/CDSR/CD006842/rel0004/CD006842/image_n/nCD006842-CMP-001-01.png)
Comparison 1 Oscillating devices (OD) versus positive expiratory pressure (PEP), Outcome 1 FEV₁ post‐intervention [% predicted].
![Comparison 1 Oscillating devices (OD) versus positive expiratory pressure (PEP), Outcome 2 FEV₁ change from baseline [% predicted].](/es/cdsr/doi/10.1002/14651858.CD006842.pub4/media/CDSR/CD006842/rel0004/CD006842/image_n/nCD006842-CMP-001-02.png)
Comparison 1 Oscillating devices (OD) versus positive expiratory pressure (PEP), Outcome 2 FEV₁ change from baseline [% predicted].
![Comparison 1 Oscillating devices (OD) versus positive expiratory pressure (PEP), Outcome 3 FEF25‐75 post intervention [% predicted].](/es/cdsr/doi/10.1002/14651858.CD006842.pub4/media/CDSR/CD006842/rel0004/CD006842/image_n/nCD006842-CMP-001-03.png)
Comparison 1 Oscillating devices (OD) versus positive expiratory pressure (PEP), Outcome 3 FEF25‐75 post intervention [% predicted].
![Comparison 1 Oscillating devices (OD) versus positive expiratory pressure (PEP), Outcome 4 FEF25‐75 change from baseline [% predicted].](/es/cdsr/doi/10.1002/14651858.CD006842.pub4/media/CDSR/CD006842/rel0004/CD006842/image_n/nCD006842-CMP-001-04.png)
Comparison 1 Oscillating devices (OD) versus positive expiratory pressure (PEP), Outcome 4 FEF25‐75 change from baseline [% predicted].
![Comparison 1 Oscillating devices (OD) versus positive expiratory pressure (PEP), Outcome 5 FVC post intervention [% predicted].](/es/cdsr/doi/10.1002/14651858.CD006842.pub4/media/CDSR/CD006842/rel0004/CD006842/image_n/nCD006842-CMP-001-05.png)
Comparison 1 Oscillating devices (OD) versus positive expiratory pressure (PEP), Outcome 5 FVC post intervention [% predicted].
![Comparison 1 Oscillating devices (OD) versus positive expiratory pressure (PEP), Outcome 6 FVC change from baseline [% predicted].](/es/cdsr/doi/10.1002/14651858.CD006842.pub4/media/CDSR/CD006842/rel0004/CD006842/image_n/nCD006842-CMP-001-06.png)
Comparison 1 Oscillating devices (OD) versus positive expiratory pressure (PEP), Outcome 6 FVC change from baseline [% predicted].
![Comparison 1 Oscillating devices (OD) versus positive expiratory pressure (PEP), Outcome 7 Sputum volume [ml].](/es/cdsr/doi/10.1002/14651858.CD006842.pub4/media/CDSR/CD006842/rel0004/CD006842/image_n/nCD006842-CMP-001-07.png)
Comparison 1 Oscillating devices (OD) versus positive expiratory pressure (PEP), Outcome 7 Sputum volume [ml].
![Comparison 1 Oscillating devices (OD) versus positive expiratory pressure (PEP), Outcome 8 Sputum weight [g].](/es/cdsr/doi/10.1002/14651858.CD006842.pub4/media/CDSR/CD006842/rel0004/CD006842/image_n/nCD006842-CMP-001-08.png)
Comparison 1 Oscillating devices (OD) versus positive expiratory pressure (PEP), Outcome 8 Sputum weight [g].

Comparison 1 Oscillating devices (OD) versus positive expiratory pressure (PEP), Outcome 9 Quality of life indices.

Comparison 1 Oscillating devices (OD) versus positive expiratory pressure (PEP), Outcome 10 Number of hospitalizations.

Comparison 1 Oscillating devices (OD) versus positive expiratory pressure (PEP), Outcome 11 Pulmonary exacerbations (at 1 year).

Comparison 1 Oscillating devices (OD) versus positive expiratory pressure (PEP), Outcome 12 Exercise performance % change from baseline.
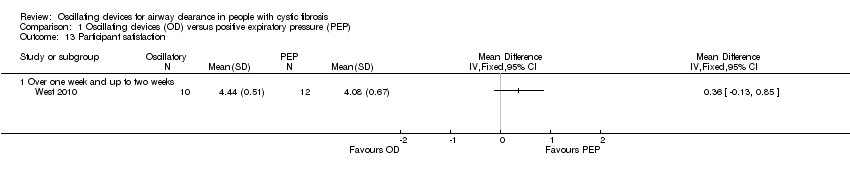
Comparison 1 Oscillating devices (OD) versus positive expiratory pressure (PEP), Outcome 13 Participant satisfaction.
![Comparison 2 Oscillating devices (OD) versus breathing techniques, Outcome 1 FEV₁ post‐intervention [% predicted].](/es/cdsr/doi/10.1002/14651858.CD006842.pub4/media/CDSR/CD006842/rel0004/CD006842/image_n/nCD006842-CMP-002-01.png)
Comparison 2 Oscillating devices (OD) versus breathing techniques, Outcome 1 FEV₁ post‐intervention [% predicted].
![Comparison 2 Oscillating devices (OD) versus breathing techniques, Outcome 2 FVC post‐intervention [% predicted].](/es/cdsr/doi/10.1002/14651858.CD006842.pub4/media/CDSR/CD006842/rel0004/CD006842/image_n/nCD006842-CMP-002-02.png)
Comparison 2 Oscillating devices (OD) versus breathing techniques, Outcome 2 FVC post‐intervention [% predicted].
![Comparison 2 Oscillating devices (OD) versus breathing techniques, Outcome 3 Sputum volume [g].](/es/cdsr/doi/10.1002/14651858.CD006842.pub4/media/CDSR/CD006842/rel0004/CD006842/image_n/nCD006842-CMP-002-03.png)
Comparison 2 Oscillating devices (OD) versus breathing techniques, Outcome 3 Sputum volume [g].
![Comparison 2 Oscillating devices (OD) versus breathing techniques, Outcome 4 Sputum weight (wet) [g].](/es/cdsr/doi/10.1002/14651858.CD006842.pub4/media/CDSR/CD006842/rel0004/CD006842/image_n/nCD006842-CMP-002-04.png)
Comparison 2 Oscillating devices (OD) versus breathing techniques, Outcome 4 Sputum weight (wet) [g].
![Comparison 3 Oscillating devices (OD) versus conventional physiotherapy (CPT), Outcome 1 FEV₁ post intervention [% predicted].](/es/cdsr/doi/10.1002/14651858.CD006842.pub4/media/CDSR/CD006842/rel0004/CD006842/image_n/nCD006842-CMP-003-01.png)
Comparison 3 Oscillating devices (OD) versus conventional physiotherapy (CPT), Outcome 1 FEV₁ post intervention [% predicted].
![Comparison 3 Oscillating devices (OD) versus conventional physiotherapy (CPT), Outcome 2 FEV₁ change from baseline [% predicted].](/es/cdsr/doi/10.1002/14651858.CD006842.pub4/media/CDSR/CD006842/rel0004/CD006842/image_n/nCD006842-CMP-003-02.png)
Comparison 3 Oscillating devices (OD) versus conventional physiotherapy (CPT), Outcome 2 FEV₁ change from baseline [% predicted].
![Comparison 3 Oscillating devices (OD) versus conventional physiotherapy (CPT), Outcome 3 FEF25‐75 post intervention [% predicted].](/es/cdsr/doi/10.1002/14651858.CD006842.pub4/media/CDSR/CD006842/rel0004/CD006842/image_n/nCD006842-CMP-003-03.png)
Comparison 3 Oscillating devices (OD) versus conventional physiotherapy (CPT), Outcome 3 FEF25‐75 post intervention [% predicted].
![Comparison 3 Oscillating devices (OD) versus conventional physiotherapy (CPT), Outcome 4 FEF25‐75 change from baseline [% predicted].](/es/cdsr/doi/10.1002/14651858.CD006842.pub4/media/CDSR/CD006842/rel0004/CD006842/image_n/nCD006842-CMP-003-04.png)
Comparison 3 Oscillating devices (OD) versus conventional physiotherapy (CPT), Outcome 4 FEF25‐75 change from baseline [% predicted].
![Comparison 3 Oscillating devices (OD) versus conventional physiotherapy (CPT), Outcome 5 FVC [% predicted].](/es/cdsr/doi/10.1002/14651858.CD006842.pub4/media/CDSR/CD006842/rel0004/CD006842/image_n/nCD006842-CMP-003-05.png)
Comparison 3 Oscillating devices (OD) versus conventional physiotherapy (CPT), Outcome 5 FVC [% predicted].
![Comparison 3 Oscillating devices (OD) versus conventional physiotherapy (CPT), Outcome 6 Residual volume [% change from baseline].](/es/cdsr/doi/10.1002/14651858.CD006842.pub4/media/CDSR/CD006842/rel0004/CD006842/image_n/nCD006842-CMP-003-06.png)
Comparison 3 Oscillating devices (OD) versus conventional physiotherapy (CPT), Outcome 6 Residual volume [% change from baseline].
![Comparison 3 Oscillating devices (OD) versus conventional physiotherapy (CPT), Outcome 7 Sputum weight (dry) [g].](/es/cdsr/doi/10.1002/14651858.CD006842.pub4/media/CDSR/CD006842/rel0004/CD006842/image_n/nCD006842-CMP-003-07.png)
Comparison 3 Oscillating devices (OD) versus conventional physiotherapy (CPT), Outcome 7 Sputum weight (dry) [g].
![Comparison 3 Oscillating devices (OD) versus conventional physiotherapy (CPT), Outcome 8 Sputum weight (wet) [g].](/es/cdsr/doi/10.1002/14651858.CD006842.pub4/media/CDSR/CD006842/rel0004/CD006842/image_n/nCD006842-CMP-003-08.png)
Comparison 3 Oscillating devices (OD) versus conventional physiotherapy (CPT), Outcome 8 Sputum weight (wet) [g].
![Comparison 3 Oscillating devices (OD) versus conventional physiotherapy (CPT), Outcome 9 Six minute walking distance [metres].](/es/cdsr/doi/10.1002/14651858.CD006842.pub4/media/CDSR/CD006842/rel0004/CD006842/image_n/nCD006842-CMP-003-09.png)
Comparison 3 Oscillating devices (OD) versus conventional physiotherapy (CPT), Outcome 9 Six minute walking distance [metres].
![Comparison 3 Oscillating devices (OD) versus conventional physiotherapy (CPT), Outcome 10 Oxygen saturation (SaO2 ) [% change from baseline].](/es/cdsr/doi/10.1002/14651858.CD006842.pub4/media/CDSR/CD006842/rel0004/CD006842/image_n/nCD006842-CMP-003-10.png)
Comparison 3 Oscillating devices (OD) versus conventional physiotherapy (CPT), Outcome 10 Oxygen saturation (SaO2 ) [% change from baseline].
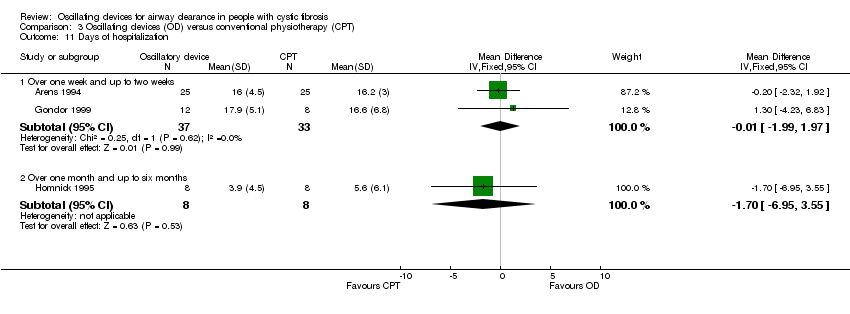
Comparison 3 Oscillating devices (OD) versus conventional physiotherapy (CPT), Outcome 11 Days of hospitalization.

Comparison 3 Oscillating devices (OD) versus conventional physiotherapy (CPT), Outcome 12 Patient satisfaction / overall preference (short term).
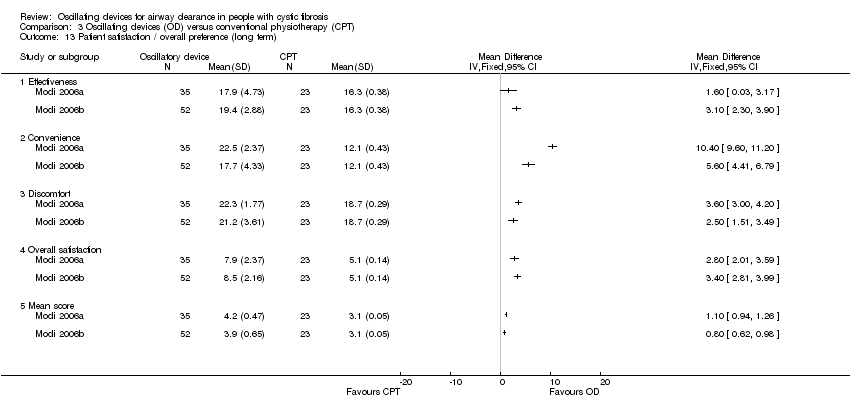
Comparison 3 Oscillating devices (OD) versus conventional physiotherapy (CPT), Outcome 13 Patient satisfaction / overall preference (long term).
![Comparison 4 Flutter versus HFCWO, Outcome 1 FEV1 [% predicted].](/es/cdsr/doi/10.1002/14651858.CD006842.pub4/media/CDSR/CD006842/rel0004/CD006842/image_n/nCD006842-CMP-004-01.png)
Comparison 4 Flutter versus HFCWO, Outcome 1 FEV1 [% predicted].
![Comparison 4 Flutter versus HFCWO, Outcome 2 FEF25‐75 [% predicted].](/es/cdsr/doi/10.1002/14651858.CD006842.pub4/media/CDSR/CD006842/rel0004/CD006842/image_n/nCD006842-CMP-004-02.png)
Comparison 4 Flutter versus HFCWO, Outcome 2 FEF25‐75 [% predicted].
![Comparison 4 Flutter versus HFCWO, Outcome 3 FVC [% predicted].](/es/cdsr/doi/10.1002/14651858.CD006842.pub4/media/CDSR/CD006842/rel0004/CD006842/image_n/nCD006842-CMP-004-03.png)
Comparison 4 Flutter versus HFCWO, Outcome 3 FVC [% predicted].
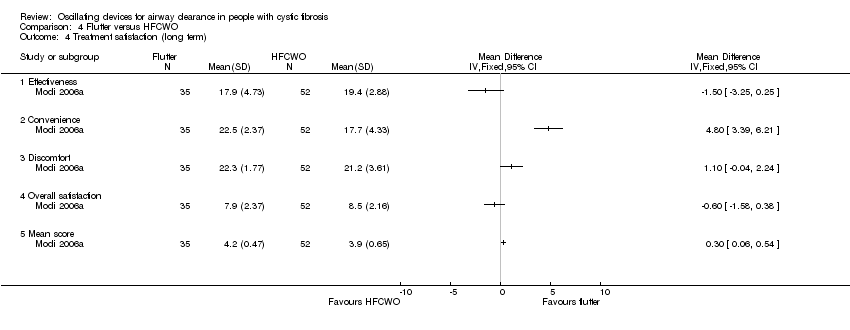
Comparison 4 Flutter versus HFCWO, Outcome 4 Treatment satisfaction (long term).
| Oscillating devices compared with positive expiratory pressure (PEP) for cystic fibrosis | ||||||
| Patient or population: adults and children with cystic fibrosis Settings: outpatients and hospitalised patients Intervention: oscillating devices Comparison: positive expiratory pressure (PEP) | ||||||
| Outcomes | Illustrative comparative risks* (95% CI) | Relative effect | No of participants | Quality of the evidence | Comments | |
| Assumed risk | Corresponding risk | |||||
| PEP | Oscillating devices1 | |||||
| FEV₁: % predicted Follow‐up: less than 1 week to 1 year | There were no statistically significant differences between oscillating devices and PEP in terms of FEV₁ % predicted post‐intervention or change from baseline at any time point. | NA | 510 | ⊕⊝⊝⊝ | ||
| FEF25‐75 : % predicted Follow‐up: less than 1 week to 1 year | There were no statistically significant differences between oscillating devices and PEP in terms of FEF25‐75 % predicted post‐intervention or change from baseline at any time point. | NA | 355 | ⊕⊝⊝⊝ | ||
| FVC Follow‐up: less than 1 week to 1 year | There were no statistically significant differences between oscillating devices and PEP in terms of FVC post‐intervention or change from baseline at any time point. | NA | 362 | ⊕⊝⊝⊝ | ||
| Sputum: volume (mL) Follow‐up: up to 1 week | The mean sputum volume in the PEP group was 8.5 mL. | The mean sputum volume in the oscillating device group was 1.8 mL lower (6.6 mL lower to 3.0 mL higher). | NA | 23 | ⊕⊕⊝⊝ | A second study recruiting 30 participants reported that there was an increase in sputum volume when HFCWO was compared to participants' usual ACT; however, it was not clear exactly what interventions were included in the usual ACT treatment arm. |
| Sputum: weight (dry or wet) (g) Follow‐up: up to 2 weeks | 3 out of 4 studies reported no statistically significant difference between oscillating devices and PEP in terms of sputum weight (g). 1 study reported that a significantly greater weight of sputum was yielded using PEP compared to HFCWO. | NA | 104 | ⊕⊕⊝⊝ | ||
| Frequency of exacerbations2 Follow‐up: up to one year | 2 out of 4 studies reported no statistically significant difference between oscillating devices and PEP. 2 out of 4 studies reported that significantly more hospitalizations or participants requiring antibiotics in the oscillating devices groups compared to the PEP groups. | NA | 219 | ⊕⊕⊝⊝ | ||
| Participant‐reported satisfaction with treatment intervention Follow‐up: less than 1 week to 1 year | Some differences were reported between treatment groups in single domains of satisfaction questionnaires or measurement scales (in favour of or against oscillating devices). Overall across the 7 studies, no consistent differences were reported in terms of satisfaction of any treatment intervention. | NA | 242 (7 studies) | ⊕⊝⊝⊝ | ||
| *The basis for the assumed risk (e.g. the median control group risk across studies) is provided in footnotes. The corresponding risk (and its 95% confidence interval) is based on the assumed risk in the comparison group and the relative effect of the intervention (and its 95% CI). | ||||||
| GRADE Working Group grades of evidence | ||||||
| 1. The oscillating devices included in the trials under this comparison were HFCWO, flutter, IPV, acapella and cornet. 2. Frequency of exacerbations were measured as defined by Rosenfeld as a consequence of the treatment intervention (Rosenfeld 2001). 3. Downgraded twice due to serious risk of bias; many judgements of high risk of bias across the included studies due to reasons such as inadequate allocation concealment, lack of blinding of participants, clinicians and outcome assessors, incomplete outcome data and selective reporting (see Risk of bias in included studies for further information). 4. Downgraded once due to imprecision: many included studies had very small sample sizes, short treatment durations and employed cross‐over designs. As results were not presented from paired analyses for these studies, we treated the cross‐over trials as if they were parallel trials which is a conservative approach as it does not take into account within‐patient correlation. Sensitivity analyses indicates that results were robust to this approach. 5. Downgraded once due to unclear risk of bias; the study was published as an abstract only and very limited information was available regarding the study design. 6. Downgraded once due to risk of bias; judgements of high risk of bias across some of the included studies due to reasons such as inadequate allocation concealment, lack of blinding of participants clinicians and outcome assessors, incomplete outcome data and selective reporting (see Risk of bias in included studies for further information). 7. Downgraded once due to applicability; three of the studies reported anecdotal findings in terms of participant satisfaction or preference for a treatment arm without numerical results to support these findings. | ||||||
| Oscillating devices compared with breathing techniques for cystic fibrosis | ||||||
| Patient or population: adults and children with cystic fibrosis Settings: outpatients and hospitalised patients Intervention: oscillating devices Comparison: breathing techniques | ||||||
| Outcomes | Illustrative comparative risks* (95% CI) | Relative effect | No of participants | Quality of the evidence | Comments | |
| Assumed risk | Corresponding risk | |||||
| Breathing techniques | Oscillating devices1 | |||||
| FEV₁: % predicted or L Follow‐up: less than 1 week to 1 year | 6 out of 7 studies reported no statistically significant differences between oscillating devices and breathing techniques in terms of FEV₁ (% predicted or L). 1 study reported a significant advantage for active cycle of breathing techniques compared to HFWCO in terms of FEV₁ (L). | NA | 184 (7 studies) | ⊕⊕⊝⊝ | ||
| FEF25‐75 Follow‐up: 5 days | There were no statistically significant differences between oscillating devices and breathing techniques in terms of FEF25‐75. | NA | 7 | ⊕⊝⊝⊝ | ||
| FVC Follow‐up: less than 1 week to 1 year | 4 out of 5 studies reported no statistically significant differences between oscillating devices and breathing techniques in terms of FVC. 1 study reported a significant advantage for active cycle of breathing techniques compared to HFWCO in terms of FVC % predicted. | NA | 154 | ⊕⊕⊝⊝ | ||
| Sputum: volume (g) Follow‐up: up to 1 month | The mean sputum volume in the breathing technique group was 3.6 g. | The mean sputum volume in the oscillating device group was 0.9 g higher (1.72 g lower to 3.52 g higher). | NA | 14 | ⊕⊕⊝⊝ | |
| Sputum: weight (dry or wet) (g) Follow‐up: up to 2 weeks | 3 out of 5 studies reported no statistically significant difference between oscillating devices and breathing technique in terms of sputum weight (g). 2 out of 5 studies reported that a significantly greater weight of sputum was yielded using breathing techniques compared to oscillating devices. | NA | 92 | ⊕⊕⊝⊝ | ||
| Frequency of exacerbations2 Follow‐up: NA | Outcome not reported in any study. | NA | NA | NA | ||
| Participant‐reported satisfaction with treatment intervention Follow‐up: up to 2 weeks | Some differences were reported between treatment groups in single domains of satisfaction questionnaires or measurement scales (in favour of or against oscillating devices). Overall across the 5 studies, no consistent differences were reported in terms of satisfaction of any treatment intervention. | NA | 92 | ⊕⊕⊝⊝ | ||
| *The basis for the assumed risk (e.g. the median control group risk across studies) is provided in footnotes. The corresponding risk (and its 95% confidence interval) is based on the assumed risk in the comparison group and the relative effect of the intervention (and its 95% CI). CI: confidence interval; FEF25‐75 : mid‐expiratory flow; FEV₁: forced expiratory volume at one second;FVC: forced vital capacity; HFCWO: high frequency chest wall oscillation;L: litres; MD: mean difference; NA: not applicable. | ||||||
| GRADE Working Group grades of evidence | ||||||
| 1. The oscillating devices included in the trials under this comparison were HFCWO, flutter and cornet. 2. Frequency of exacerbations were measured as defined by Rosenfeld as a consequence of the treatment intervention (Rosenfeld 2001). 3. Downgraded once due to risk of bias; judgements of high risk of bias across some of the included studies due to reasons such as lack of blinding of participants clinicians and outcome assessors, incomplete outcome data and selective reporting (see Risk of bias in included studies for further information) 4. Downgraded once due to imprecision: many included studies had very small sample sizes, short treatment durations and employed cross‐over designs. As results were not presented from paired analyses for these studies, we treated the cross‐over trials as if they were parallel trials which is a conservative approach as it does not take into account within‐patient correlation. Sensitivity analyses indicates that results were robust to this approach. 5. Downgraded once due to risk of bias: the single included study was at high risk of bias due to lack of blinding and reported limited information regarding other aspects of the methodological design 6. Downgraded once due to serious imprecision: a single cross‐over study recruiting only seven participants over a 5‐day period contributed to the outcome and no numerical data were available. 7. Downgraded once due to imprecision: a single cross‐over study recruiting only 14 participants contributed to the outcome. | ||||||
| Oscillating devices compared with conventional physiotherapy for cystic fibrosis | ||||||
| Patient or population: adults and children with cystic fibrosis Settings: outpatients and hospitalised patients Intervention: oscillating devices Comparison: conventional physiotherapy | ||||||
| Outcomes | Illustrative comparative risks* (95% CI) | Relative effect | No of participants | Quality of the evidence | Comments | |
| Assumed risk | Corresponding risk | |||||
| Conventional physiotherapy | Oscillating devices1 | |||||
| FEV₁: % predicted Follow‐up: less than 1 week up to 3 years | There were no statistically significant differences between oscillating devices and conventional physiotherapy in terms of FEV₁ % predicted post‐intervention or change from baseline at any time point. | NA | 363 | ⊕⊝⊝⊝ | ||
| FEF25‐75: % predicted Follow‐up: less than 1ne week up to 3 years | There were no statistically significant differences between oscillating devices and conventional physiotherapy in terms of FEF25‐75 % predicted post‐intervention or change from baseline at any time point. | NA | 319 | ⊕⊝⊝⊝ | ||
| FVC Follow‐up: less than 1 week up to 3 years | There were no statistically significant differences between oscillating devices and conventional physiotherapy in terms of FVC post‐intervention or change from baseline at any time point. | NA | 268 (7 studies) | ⊕⊝⊝⊝ | ||
| Sputum: volume Follow‐up: up to 1 week | Both studies found a statistically significant advantage for the oscillating device compared to the conventional physiotherapy in terms of volume of sputum. | NA | 17 | ⊕⊕⊝⊝ | ||
| Sputum: weight (dry or wet) | 6 out of 8 studies reported no statistically significant difference between oscillating devices and conventional physiotherapy in terms of sputum weight (g). 1 study reported that a significantly greater weight of sputum was yielded using conventional physiotherapy compared to HFCWO. 1 study reported that a significantly greater weight of sputum was yielded using HFCWO compared to conventional physiotherapy. | NA | 188 | ⊕⊝⊝⊝ | ||
| Frequency of exacerbations2 Follow‐up: less than 1 week up to 3 years | There were no significant differences between oscillating devices and conventional physiotherapy in terms of days of hospitalisation or time to next pulmonary exacerbation. | NA | 262 | ⊕⊝⊝⊝ | ||
| Participant‐reported satisfaction with treatment intervention Follow‐up: less than 1 week up to 3 years | Some differences were reported between treatment groups in single domains of satisfaction questionnaires or measurement scales (in favour of or against oscillating devices). Overall across the 9 studies, no consistent differences were reported in terms of satisfaction of any treatment intervention. | NA | 345 | ⊕⊝⊝⊝ | ||
| *The basis for the assumed risk (e.g. the median control group risk across studies) is provided in footnotes. The corresponding risk (and its 95% confidence interval) is based on the assumed risk in the comparison group and the relative effect of the intervention (and its 95% CI). | ||||||
| GRADE Working Group grades of evidence | ||||||
| 1. The oscillating devices included in the trials under this comparison were HFCWO, flutter and IPV. 2. Frequency of exacerbations were measured as defined by Rosenfeld as a consequence of the treatment intervention (Rosenfeld 2001). 3. Downgraded twice due to serious risk of bias; many judgements of high risk of bias across the included studies due to reasons such as inadequate allocation concealment, lack of blinding of participants, clinicians and outcome assessors, incomplete outcome data and selective reporting (see Risk of bias in included studies for further information). 4. Downgraded once due to imprecision: many included studies had very small sample sizes, short treatment durations and employed cross‐over designs. As results were not presented from paired analyses for these studies, we treated the cross‐over trials as if they were parallel trials which is a conservative approach as it does not take into account within‐patient correlation. Sensitivity analyses indicates that results were robust to this approach. 5. Downgraded once due to unclear risk of bias; limited information was available regarding the methodological designs of the 2 studies. 6. Downgraded once due to applicability; 4 of the studies reported anecdotal findings in terms of participant satisfaction or preference for a treatment arm without numerical results to support these findings. | ||||||
| Oscillating devices compared with different oscillating devices for cystic fibrosis | ||||||
| Patient or population: adults and children with cystic fibrosis Settings: outpatients and hospitalised patients Intervention: oscillating devices Comparison: a different oscillating device | ||||||
| Outcomes | Illustrative comparative risks* (95% CI) | Relative effect | No of participants | Quality of the evidence | Comments | |
| Assumed risk | Corresponding risk | |||||
| Oscillating Devices1 | Oscillating devices1 | |||||
| FEV₁ Follow‐up: less than 1e week up to 3 years | There were no statistically significant differences between oscillating devices in terms of FEV₁ at any time point. | NA | 316 (5 studies) | ⊕⊝⊝⊝ | ||
| FEF25‐75 Follow‐up: less than 1 week up to 3 years | There were no statistically significant differences between oscillating devices in terms of FEF25‐75 at any time point. | NA | 211 | ⊕⊝⊝⊝ | ||
| FVC Follow‐up: less than 1 week up to 3 years | There were no statistically significant differences between oscillating devices in terms of FVC at any time point. | NA | 286 | ⊕⊝⊝⊝ | ||
| Sputum: volume Follow‐up: NA | Outcome not reported. | NA | NA | NA | ||
| Sputum: weight (dry or wet) Folllow‐up: 6 days | The results of the study showed that wet and dry sputum weight in the IPV group was significantly greater than in the HFCWO group. | NA | 24 (1 study) | ⊕⊕⊝⊝ | ||
| Frequency of exacerbations2 Follow‐up: 24 weeks | There were no statistically significant differences between oscillating devices in terms of frequency of hospitalisations or need for home intravenous therapies. | NA | 16 | ⊕⊝⊝⊝ | ||
| Participant‐reported satisfaction with treatment intervention Follow‐up: less than 1 week up to 3 years | Some differences were reported between treatment groups in single domains of satisfaction questionnaires or measurement scales (in favour of or against oscillating devices). Overall across the 5 studies, no consistent differences were reported in terms of satisfaction of any treatment intervention. | NA | 265 | ⊕⊝⊝⊝ | ||
| *The basis for the assumed risk (e.g. the median control group risk across studies) is provided in footnotes. The corresponding risk (and its 95% confidence interval) is based on the assumed risk in the comparison group and the relative effect of the intervention (and its 95% CI). | ||||||
| GRADE Working Group grades of evidence | ||||||
| 1. The oscillating devices included in the trials under this comparison were HFCWO, flutter, IPV and cornet. 2. Frequency of exacerbations were measured as defined by Rosenfeld as a consequence of the treatment intervention (Rosenfeld 2001). 3. Downgraded twice due to serious risk of bias; many judgements of high risk of bias across the included studies due to reasons such as lack of blinding of participants, clinicians and outcome assessors, incomplete outcome data and selective reporting (see Risk of bias in included studies for further information). 4. Downgraded once due to imprecision: many included studies had very small sample sizes, short treatment durations and employed cross‐over designs. As results were not presented from paired analyses for these studies, we treated the cross‐over trials as if they were parallel trials which is a conservative approach as it does not take into account within‐patient correlation. Sensitivity analyses indicates that results were robust to this approach. 5. Downgraded once due to unclear risk of bias; the study was potentially as risk of bias due to the administration of the interventions and limited information was available regarding the study design. 6. Downgraded once due to serious risk of bias; the study was at risk of attrition bias and selective reporting bias. 7. Downgraded once due to imprecision: the study recruited only 16 participants and numerical data were not available for the outcome. | ||||||
| Outcome or subgroup title | No. of studies | No. of participants | Statistical method | Effect size |
| 1 FEV₁ post‐intervention [% predicted] Show forest plot | 4 | Std. Mean Difference (IV, Fixed, 95% CI) | Subtotals only | |
| 1.1 Up to one week | 2 | 78 | Std. Mean Difference (IV, Fixed, 95% CI) | ‐0.03 [‐0.48, 0.41] |
| 1.2 Over one week and up to two weeks | 1 | 30 | Std. Mean Difference (IV, Fixed, 95% CI) | 0.12 [‐0.60, 0.84] |
| 1.3 Over two weeks and up to one month | 1 | 44 | Std. Mean Difference (IV, Fixed, 95% CI) | 0.49 [‐0.11, 1.09] |
| 2 FEV₁ change from baseline [% predicted] Show forest plot | 5 | Mean Difference (IV, Fixed, 95% CI) | Subtotals only | |
| 2.1 Over one week and up to two weeks | 1 | 22 | Mean Difference (IV, Fixed, 95% CI) | 9.37 [‐6.16, 24.90] |
| 2.2 Over two weeks and up to one month | 1 | 12 | Mean Difference (IV, Fixed, 95% CI) | ‐4.08 [‐12.82, 4.66] |
| 2.3 At one year | 3 | 162 | Mean Difference (IV, Fixed, 95% CI) | 1.54 [‐1.97, 5.06] |
| 3 FEF25‐75 post intervention [% predicted] Show forest plot | 4 | Mean Difference (IV, Fixed, 95% CI) | Subtotals only | |
| 3.1 Up to one week | 2 | 78 | Mean Difference (IV, Fixed, 95% CI) | 0.09 [‐9.33, 9.52] |
| 3.2 Over one week and up to two weeks | 1 | 30 | Mean Difference (IV, Fixed, 95% CI) | ‐1.0 [‐27.84, 25.84] |
| 3.3 Over two weeks and up to one month | 1 | 44 | Mean Difference (IV, Fixed, 95% CI) | ‐1.0 [‐3.95, 1.95] |
| 4 FEF25‐75 change from baseline [% predicted] Show forest plot | 5 | Mean Difference (IV, Fixed, 95% CI) | Subtotals only | |
| 4.1 Over one week and up to two weeks | 1 | 22 | Mean Difference (IV, Fixed, 95% CI) | 15.26 [‐10.12, 40.64] |
| 4.2 Over two weeks and up to one month | 1 | 12 | Mean Difference (IV, Fixed, 95% CI) | ‐20.07 [‐43.00, 4.86] |
| 4.3 At one year | 3 | 162 | Mean Difference (IV, Fixed, 95% CI) | 0.13 [‐4.46, 4.72] |
| 5 FVC post intervention [% predicted] Show forest plot | 4 | Mean Difference (IV, Fixed, 95% CI) | Subtotals only | |
| 5.1 Up to one week | 2 | 78 | Mean Difference (IV, Fixed, 95% CI) | ‐0.66 [‐8.71, 7.40] |
| 5.2 Over one week and up to two weeks | 1 | 30 | Mean Difference (IV, Fixed, 95% CI) | 3.0 [‐10.60, 16.60] |
| 5.3 Over two weeks and up to one month | 1 | 44 | Mean Difference (IV, Fixed, 95% CI) | 2.0 [‐0.09, 4.09] |
| 6 FVC change from baseline [% predicted] Show forest plot | 4 | Mean Difference (IV, Random, 95% CI) | Subtotals only | |
| 6.1 Over one week and up to two weeks | 1 | 22 | Mean Difference (IV, Random, 95% CI) | 5.40 [‐9.21, 20.01] |
| 6.2 At one year | 3 | 162 | Mean Difference (IV, Random, 95% CI) | 0.25 [‐6.14, 6.65] |
| 7 Sputum volume [ml] Show forest plot | 1 | Mean Difference (IV, Fixed, 95% CI) | Totals not selected | |
| 7.1 Up to 1 week | 1 | Mean Difference (IV, Fixed, 95% CI) | 0.0 [0.0, 0.0] | |
| 8 Sputum weight [g] Show forest plot | 1 | Mean Difference (IV, Fixed, 95% CI) | Totals not selected | |
| 8.1 Over one week and up to two weeks | 1 | Mean Difference (IV, Fixed, 95% CI) | 0.0 [0.0, 0.0] | |
| 9 Quality of life indices Show forest plot | 2 | Mean Difference (IV, Fixed, 95% CI) | Totals not selected | |
| 9.1 Quality of well being score | 1 | Mean Difference (IV, Fixed, 95% CI) | 0.0 [0.0, 0.0] | |
| 9.2 CRQ Disease specific interviewer administered questionnaire | 1 | Mean Difference (IV, Fixed, 95% CI) | 0.0 [0.0, 0.0] | |
| 9.3 CFQ: physical domain | 1 | Mean Difference (IV, Fixed, 95% CI) | 0.0 [0.0, 0.0] | |
| 9.4 CFQ: emotional domain | 1 | Mean Difference (IV, Fixed, 95% CI) | 0.0 [0.0, 0.0] | |
| 9.5 CFQ: treatment burden domain | 1 | Mean Difference (IV, Fixed, 95% CI) | 0.0 [0.0, 0.0] | |
| 9.6 CFQ: respiratory domain | 1 | Mean Difference (IV, Fixed, 95% CI) | 0.0 [0.0, 0.0] | |
| 9.7 CFQ: digestion/weight domain | 1 | Mean Difference (IV, Fixed, 95% CI) | 0.0 [0.0, 0.0] | |
| 10 Number of hospitalizations Show forest plot | 1 | Mean Difference (IV, Fixed, 95% CI) | Totals not selected | |
| 10.1 At one year | 1 | Mean Difference (IV, Fixed, 95% CI) | 0.0 [0.0, 0.0] | |
| 11 Pulmonary exacerbations (at 1 year) Show forest plot | 1 | Odds Ratio (M‐H, Fixed, 95% CI) | Totals not selected | |
| 11.1 Total number of patient requiring antibiotics for exacerbations | 1 | Odds Ratio (M‐H, Fixed, 95% CI) | 0.0 [0.0, 0.0] | |
| 11.2 Number of patients requiring IV antibiotics for exacerbations | 1 | Odds Ratio (M‐H, Fixed, 95% CI) | 0.0 [0.0, 0.0] | |
| 12 Exercise performance % change from baseline Show forest plot | 1 | Mean Difference (IV, Fixed, 95% CI) | Totals not selected | |
| 12.1 Over one week and up to two weeks | 1 | Mean Difference (IV, Fixed, 95% CI) | 0.0 [0.0, 0.0] | |
| 13 Participant satisfaction Show forest plot | 1 | Mean Difference (IV, Fixed, 95% CI) | Totals not selected | |
| 13.1 Over one week and up to two weeks | 1 | Mean Difference (IV, Fixed, 95% CI) | 0.0 [0.0, 0.0] | |
| Outcome or subgroup title | No. of studies | No. of participants | Statistical method | Effect size |
| 1 FEV₁ post‐intervention [% predicted] Show forest plot | 1 | Mean Difference (IV, Fixed, 95% CI) | Totals not selected | |
| 1.1 Over two weeks and up to one month | 1 | Mean Difference (IV, Fixed, 95% CI) | 0.0 [0.0, 0.0] | |
| 2 FVC post‐intervention [% predicted] Show forest plot | 1 | Mean Difference (IV, Fixed, 95% CI) | Totals not selected | |
| 2.1 Over two weeks and up to one month | 1 | Mean Difference (IV, Fixed, 95% CI) | 0.0 [0.0, 0.0] | |
| 3 Sputum volume [g] Show forest plot | 1 | Mean Difference (IV, Fixed, 95% CI) | Totals not selected | |
| 3.1 Over two weeks and up to one month | 1 | Mean Difference (IV, Fixed, 95% CI) | 0.0 [0.0, 0.0] | |
| 4 Sputum weight (wet) [g] Show forest plot | 1 | Mean Difference (IV, Fixed, 95% CI) | Totals not selected | |
| 4.1 Up to one week | 1 | Mean Difference (IV, Fixed, 95% CI) | 0.0 [0.0, 0.0] | |
| Outcome or subgroup title | No. of studies | No. of participants | Statistical method | Effect size |
| 1 FEV₁ post intervention [% predicted] Show forest plot | 4 | Mean Difference (IV, Fixed, 95% CI) | Subtotals only | |
| 1.1 Up to one week | 2 | 52 | Mean Difference (IV, Fixed, 95% CI) | 4.24 [‐7.96, 16.44] |
| 1.2 Over one week and up to two weeks | 1 | 20 | Mean Difference (IV, Fixed, 95% CI) | 18.0 [‐5.54, 41.54] |
| 1.3 Over two weeks and up to one month | 1 | 28 | Mean Difference (IV, Fixed, 95% CI) | 2.0 [‐2.83, 6.83] |
| 1.4 Over one month and up to six months | 1 | 16 | Mean Difference (IV, Fixed, 95% CI) | 10.0 [‐3.72, 23.72] |
| 2 FEV₁ change from baseline [% predicted] Show forest plot | 2 | Mean Difference (IV, Fixed, 95% CI) | Totals not selected | |
| 2.1 Up to one week | 1 | Mean Difference (IV, Fixed, 95% CI) | 0.0 [0.0, 0.0] | |
| 2.2 Over one week and up to two weeks | 1 | Mean Difference (IV, Fixed, 95% CI) | 0.0 [0.0, 0.0] | |
| 2.3 Over two weeks and up to one month | 1 | Mean Difference (IV, Fixed, 95% CI) | 0.0 [0.0, 0.0] | |
| 3 FEF25‐75 post intervention [% predicted] Show forest plot | 3 | Std. Mean Difference (IV, Random, 95% CI) | Subtotals only | |
| 3.1 Up to one week | 2 | 52 | Std. Mean Difference (IV, Random, 95% CI) | 0.24 [‐0.35, 0.83] |
| 3.2 Over one week and up to two weeks | 1 | 20 | Std. Mean Difference (IV, Random, 95% CI) | 0.65 [‐0.27, 1.58] |
| 3.3 Over one month and up to six months | 1 | 16 | Std. Mean Difference (IV, Random, 95% CI) | 0.29 [‐0.70, 1.28] |
| 4 FEF25‐75 change from baseline [% predicted] Show forest plot | 2 | Mean Difference (IV, Fixed, 95% CI) | Totals not selected | |
| 4.1 Up to one week | 1 | Mean Difference (IV, Fixed, 95% CI) | 0.0 [0.0, 0.0] | |
| 4.2 Over one week and up to two weeks | 1 | Mean Difference (IV, Fixed, 95% CI) | 0.0 [0.0, 0.0] | |
| 4.3 Over two weeks and up to one month | 1 | Mean Difference (IV, Fixed, 95% CI) | 0.0 [0.0, 0.0] | |
| 5 FVC [% predicted] Show forest plot | 4 | Mean Difference (IV, Fixed, 95% CI) | Subtotals only | |
| 5.1 Up to one week | 2 | 52 | Mean Difference (IV, Fixed, 95% CI) | 2.60 [‐8.63, 13.84] |
| 5.2 Over one week and up to two weeks | 1 | 20 | Mean Difference (IV, Fixed, 95% CI) | 13.0 [‐10.54, 36.54] |
| 5.3 Over two weeks and up to one month | 1 | 28 | Mean Difference (IV, Fixed, 95% CI) | 3.0 [‐0.78, 6.78] |
| 5.4 Over one month and up to six months | 1 | 16 | Mean Difference (IV, Fixed, 95% CI) | 11.0 [‐2.86, 24.86] |
| 6 Residual volume [% change from baseline] Show forest plot | 1 | Mean Difference (IV, Fixed, 95% CI) | Totals not selected | |
| 6.1 Up to one week | 1 | Mean Difference (IV, Fixed, 95% CI) | 0.0 [0.0, 0.0] | |
| 6.2 Over one week and up to two weeks | 1 | Mean Difference (IV, Fixed, 95% CI) | 0.0 [0.0, 0.0] | |
| 7 Sputum weight (dry) [g] Show forest plot | 6 | Mean Difference (IV, Fixed, 95% CI) | Subtotals only | |
| 7.1 Up to one week | 5 | 228 | Mean Difference (IV, Fixed, 95% CI) | ‐0.03 [‐0.13, 0.06] |
| 7.2 Over one week and up to two weeks | 1 | 24 | Mean Difference (IV, Fixed, 95% CI) | 0.13 [‐0.16, 0.42] |
| 7.3 Over two weeks and up to one month | 1 | 28 | Mean Difference (IV, Fixed, 95% CI) | 0.10 [‐0.35, 0.55] |
| 8 Sputum weight (wet) [g] Show forest plot | 6 | Mean Difference (IV, Fixed, 95% CI) | Subtotals only | |
| 8.1 Up to one week | 5 | 228 | Mean Difference (IV, Fixed, 95% CI) | 1.11 [‐0.60, 2.83] |
| 8.2 Over one week and up to two weeks | 1 | 24 | Mean Difference (IV, Fixed, 95% CI) | 4.04 [‐2.69, 10.77] |
| 8.3 Over two weeks and up to one month | 1 | 28 | Mean Difference (IV, Fixed, 95% CI) | 1.0 [‐2.56, 4.56] |
| 9 Six minute walking distance [metres] Show forest plot | 1 | Mean Difference (IV, Fixed, 95% CI) | Totals not selected | |
| 9.1 Over one week and up to two weeks | 1 | Mean Difference (IV, Fixed, 95% CI) | 0.0 [0.0, 0.0] | |
| 10 Oxygen saturation (SaO2 ) [% change from baseline] Show forest plot | 1 | Mean Difference (IV, Fixed, 95% CI) | Subtotals only | |
| 10.1 Up to one week | 1 | 50 | Mean Difference (IV, Fixed, 95% CI) | ‐0.20 [‐1.51, 1.11] |
| 10.2 Over one week and up to two weeks | 1 | 50 | Mean Difference (IV, Fixed, 95% CI) | ‐0.10 [‐1.51, 1.31] |
| 11 Days of hospitalization Show forest plot | 3 | Mean Difference (IV, Fixed, 95% CI) | Subtotals only | |
| 11.1 Over one week and up to two weeks | 2 | 70 | Mean Difference (IV, Fixed, 95% CI) | ‐0.01 [‐1.99, 1.97] |
| 11.2 Over one month and up to six months | 1 | 16 | Mean Difference (IV, Fixed, 95% CI) | ‐1.70 [‐6.95, 3.55] |
| 12 Patient satisfaction / overall preference (short term) Show forest plot | 2 | Mean Difference (IV, Fixed, 95% CI) | Totals not selected | |
| 12.1 up to one week | 2 | Mean Difference (IV, Fixed, 95% CI) | 0.0 [0.0, 0.0] | |
| 13 Patient satisfaction / overall preference (long term) Show forest plot | 2 | Mean Difference (IV, Fixed, 95% CI) | Totals not selected | |
| 13.1 Effectiveness | 2 | Mean Difference (IV, Fixed, 95% CI) | 0.0 [0.0, 0.0] | |
| 13.2 Convenience | 2 | Mean Difference (IV, Fixed, 95% CI) | 0.0 [0.0, 0.0] | |
| 13.3 Discomfort | 2 | Mean Difference (IV, Fixed, 95% CI) | 0.0 [0.0, 0.0] | |
| 13.4 Overall satisfaction | 2 | Mean Difference (IV, Fixed, 95% CI) | 0.0 [0.0, 0.0] | |
| 13.5 Mean score | 2 | Mean Difference (IV, Fixed, 95% CI) | 0.0 [0.0, 0.0] | |
| Outcome or subgroup title | No. of studies | No. of participants | Statistical method | Effect size |
| 1 FEV1 [% predicted] Show forest plot | 1 | Mean Difference (IV, Fixed, 95% CI) | Totals not selected | |
| 1.1 Over two weeks and up to one month | 1 | Mean Difference (IV, Fixed, 95% CI) | 0.0 [0.0, 0.0] | |
| 2 FEF25‐75 [% predicted] Show forest plot | 1 | Mean Difference (IV, Fixed, 95% CI) | Totals not selected | |
| 2.1 Over two weeks and up to one month | 1 | Mean Difference (IV, Fixed, 95% CI) | 0.0 [0.0, 0.0] | |
| 3 FVC [% predicted] Show forest plot | 1 | Mean Difference (IV, Fixed, 95% CI) | Totals not selected | |
| 3.1 Over two weeks and up to one month | 1 | Mean Difference (IV, Fixed, 95% CI) | 0.0 [0.0, 0.0] | |
| 4 Treatment satisfaction (long term) Show forest plot | 1 | Mean Difference (IV, Fixed, 95% CI) | Totals not selected | |
| 4.1 Effectiveness | 1 | Mean Difference (IV, Fixed, 95% CI) | 0.0 [0.0, 0.0] | |
| 4.2 Convenience | 1 | Mean Difference (IV, Fixed, 95% CI) | 0.0 [0.0, 0.0] | |
| 4.3 Discomfort | 1 | Mean Difference (IV, Fixed, 95% CI) | 0.0 [0.0, 0.0] | |
| 4.4 Overall satisfaction | 1 | Mean Difference (IV, Fixed, 95% CI) | 0.0 [0.0, 0.0] | |
| 4.5 Mean score | 1 | Mean Difference (IV, Fixed, 95% CI) | 0.0 [0.0, 0.0] | |