| 1 Number of participants with one or more exacerbation Show forest plot | 4 | 1803 | Odds Ratio (M‐H, Fixed, 95% CI) | 0.85 [0.69, 1.05] |
|
| 1.1 Reversible population | 1 | 121 | Odds Ratio (M‐H, Fixed, 95% CI) | 1.93 [0.17, 21.90] |
| 1.2 Partially reversible population (mixed population) | 2 | 688 | Odds Ratio (M‐H, Fixed, 95% CI) | 1.22 [0.83, 1.78] |
| 1.3 Poorly reversible population | 1 | 994 | Odds Ratio (M‐H, Fixed, 95% CI) | 0.72 [0.56, 0.93] |
| 1.4 Unclear reversibility | 0 | 0 | Odds Ratio (M‐H, Fixed, 95% CI) | 0.0 [0.0, 0.0] |
| 2 End of treatment mean number of exacerbations per participant Show forest plot | 1 | | Mean Difference (IV, Fixed, 95% CI) | Totals not selected |
|
| 2.1 Partially reversible population (mixed population) | 0 | | Mean Difference (IV, Fixed, 95% CI) | 0.0 [0.0, 0.0] |
| 2.2 Poorly reversible population | 1 | | Mean Difference (IV, Fixed, 95% CI) | 0.0 [0.0, 0.0] |
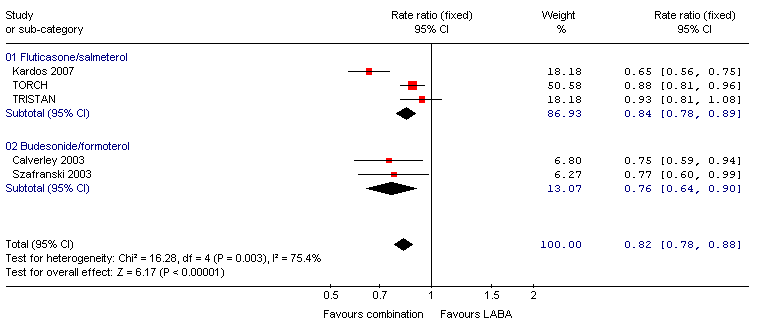
| 3 Exacerbations (rate ratio) Show forest plot | 3 | | Rate ratio (Fixed, 95% CI) | 0.84 [0.78, 0.89] |
|
| 3.1 Partially reversible population | 0 | | Rate ratio (Fixed, 95% CI) | 0.0 [0.0, 0.0] |
| 3.2 Poorly reversible population | 3 | | Rate ratio (Fixed, 95% CI) | 0.84 [0.78, 0.89] |
| 3.3 Unclear reversibility | 0 | | Rate ratio (Fixed, 95% CI) | 0.0 [0.0, 0.0] |
| 4 Exacerbations by type Show forest plot | 3 | | Rate ratio (Random, 95% CI) | Subtotals only |
|
| 4.1 Requirement for oral steroids | 2 | | Rate ratio (Random, 95% CI) | 0.77 [0.64, 0.93] |
| 4.2 Requirement for antibiotic treatment | 0 | | Rate ratio (Random, 95% CI) | 0.0 [0.0, 0.0] |
| 4.3 Requirement for oral steroid or antibiotic treatment | 0 | | Rate ratio (Random, 95% CI) | 0.0 [0.0, 0.0] |
| 4.4 Hospitalisation | 2 | | Rate ratio (Random, 95% CI) | 0.86 [0.56, 1.31] |
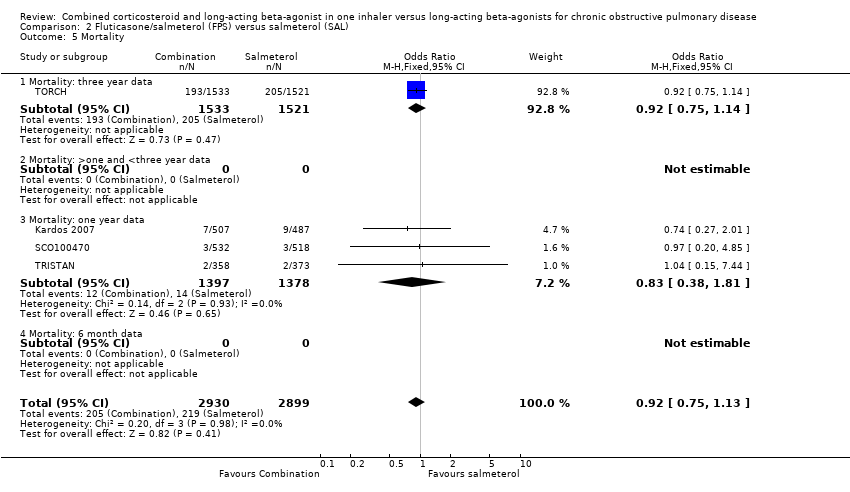
| 5 Mortality Show forest plot | 4 | 5829 | Odds Ratio (M‐H, Fixed, 95% CI) | 0.92 [0.75, 1.13] |
|
| 5.1 Mortality: three year data | 1 | 3054 | Odds Ratio (M‐H, Fixed, 95% CI) | 0.92 [0.75, 1.14] |
| 5.2 Mortality: >one and <three year data | 0 | 0 | Odds Ratio (M‐H, Fixed, 95% CI) | 0.0 [0.0, 0.0] |
| 5.3 Mortality: one year data | 3 | 2775 | Odds Ratio (M‐H, Fixed, 95% CI) | 0.83 [0.38, 1.81] |
| 5.4 Mortality: 6 month data | 0 | 0 | Odds Ratio (M‐H, Fixed, 95% CI) | 0.0 [0.0, 0.0] |
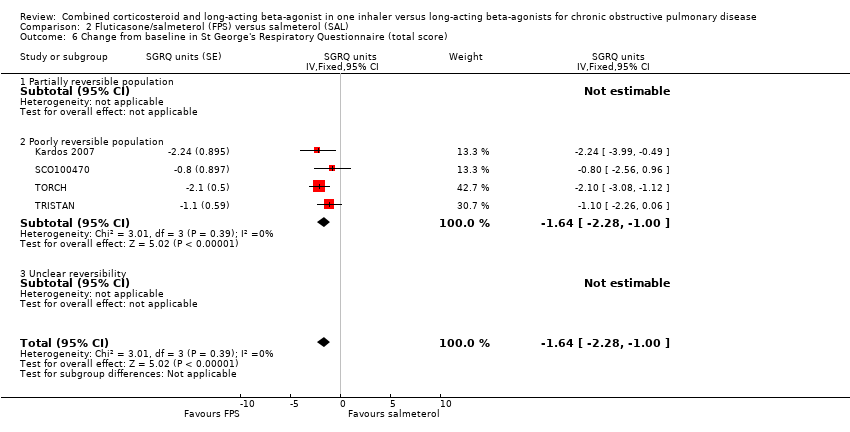
| 6 Change from baseline in St George's Respiratory Questionnaire (total score) Show forest plot | 4 | | SGRQ units (Fixed, 95% CI) | ‐1.64 [‐2.28, 1.00] |
|
| 6.1 Partially reversible population | 0 | | SGRQ units (Fixed, 95% CI) | 0.0 [0.0, 0.0] |
| 6.2 Poorly reversible population | 4 | | SGRQ units (Fixed, 95% CI) | ‐1.64 [‐2.28, 1.00] |
| 6.3 Unclear reversibility | 0 | | SGRQ units (Fixed, 95% CI) | 0.0 [0.0, 0.0] |
| 7 Change from baseline in St George's Respiratory Questionnaire (domain ‐ symptoms) Show forest plot | 2 | | SGRQ units (Fixed, 95% CI) | ‐2.65 [‐3.98, ‐1.31] |
|
| 7.1 Partially reversible population | 0 | | SGRQ units (Fixed, 95% CI) | 0.0 [0.0, 0.0] |
| 7.2 Poorly reversible population | 2 | | SGRQ units (Fixed, 95% CI) | ‐2.65 [‐3.98, ‐1.31] |
| 7.3 Unclear reversibility | 0 | | SGRQ units (Fixed, 95% CI) | 0.0 [0.0, 0.0] |
| 8 Change from baseline in St George's Respiratory Questionnaire (domain ‐ activity) Show forest plot | 2 | | SGRQ units (Fixed, 95% CI) | ‐1.87 [‐3.17, ‐0.58] |
|
| 8.1 Partially reversible population | 0 | | SGRQ units (Fixed, 95% CI) | 0.0 [0.0, 0.0] |
| 8.2 Poorly reversible population | 2 | | SGRQ units (Fixed, 95% CI) | ‐1.87 [‐3.17, ‐0.58] |
| 8.3 Unclear reversibility | 0 | | SGRQ units (Fixed, 95% CI) | 0.0 [0.0, 0.0] |
| 9 Change from baseline in St George's Respiratory Questionnaire (domain ‐ impact) Show forest plot | 2 | | SGRQ units (Fixed, 95% CI) | ‐1.05 [‐2.25, 0.14] |
|
| 9.1 Partially reversible population | 0 | | SGRQ units (Fixed, 95% CI) | 0.0 [0.0, 0.0] |
| 9.2 Poorly reversible population | 2 | | SGRQ units (Fixed, 95% CI) | ‐1.05 [‐2.25, 0.14] |
| 9.3 Unclear reversibility | 0 | | SGRQ units (Fixed, 95% CI) | 0.0 [0.0, 0.0] |
| 10 End of treatment St George's Respiratory Questionnaire scores (total score) Show forest plot | 1 | | Mean Difference (IV, Fixed, 95% CI) | Totals not selected |
|
| 10.1 Partially reversible population (mixed population) | 0 | | Mean Difference (IV, Fixed, 95% CI) | 0.0 [0.0, 0.0] |
| 10.2 Poorly reversible population | 1 | | Mean Difference (IV, Fixed, 95% CI) | 0.0 [0.0, 0.0] |
| 11 End of treatment St George's Respiratory Questionnaire scores (domain ‐ symptoms) Show forest plot | 1 | | Mean Difference (IV, Fixed, 95% CI) | Totals not selected |
|
| 11.1 Partially reversible population (mixed population) | 0 | | Mean Difference (IV, Fixed, 95% CI) | 0.0 [0.0, 0.0] |
| 11.2 Poorly reversible population | 1 | | Mean Difference (IV, Fixed, 95% CI) | 0.0 [0.0, 0.0] |
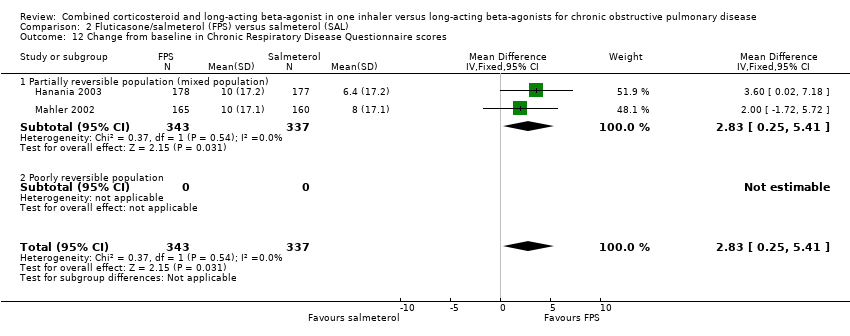
| 12 Change from baseline in Chronic Respiratory Disease Questionnaire scores Show forest plot | 2 | 680 | Mean Difference (IV, Fixed, 95% CI) | 2.83 [0.25, 5.41] |
|
| 12.1 Partially reversible population (mixed population) | 2 | 680 | Mean Difference (IV, Fixed, 95% CI) | 2.83 [0.25, 5.41] |
| 12.2 Poorly reversible population | 0 | 0 | Mean Difference (IV, Fixed, 95% CI) | 0.0 [0.0, 0.0] |
| 13 End of treatment Transitional dyspnea index (TDI) Show forest plot | 1 | | Mean Difference (IV, Fixed, 95% CI) | Totals not selected |
|
| 13.1 Partially reversible population (mixed population) | 0 | | Mean Difference (IV, Fixed, 95% CI) | 0.0 [0.0, 0.0] |
| 13.2 Poorly reversible population | 1 | | Mean Difference (IV, Fixed, 95% CI) | 0.0 [0.0, 0.0] |
| 14 End of treatment symptom scores Show forest plot | 1 | | Mean Difference (IV, Fixed, 95% CI) | Totals not selected |
|
| 14.1 Partially reversible population (mixed population) | 0 | | Mean Difference (IV, Fixed, 95% CI) | 0.0 [0.0, 0.0] |
| 14.2 Poorly reversible population | 1 | | Mean Difference (IV, Fixed, 95% CI) | 0.0 [0.0, 0.0] |
| 15 Change from baseline in Transitional Dyspnoea Index (TDI) Show forest plot | 2 | 677 | Mean Difference (IV, Random, 95% CI) | 0.61 [‐0.47, 1.68] |
|
| 15.1 Partially reversible population (mixed population) | 2 | 677 | Mean Difference (IV, Random, 95% CI) | 0.61 [‐0.47, 1.68] |
| 15.2 Poorly reversible population | 0 | 0 | Mean Difference (IV, Random, 95% CI) | 0.0 [0.0, 0.0] |
| 16 Change in MRC rated dyspnoea Show forest plot | 1 | | symptoms (Fixed, 95% CI) | Totals not selected |
|
| 16.1 Partially reversible population | 0 | | symptoms (Fixed, 95% CI) | 0.0 [0.0, 0.0] |
| 16.2 Poorly reversible population | 0 | | symptoms (Fixed, 95% CI) | 0.0 [0.0, 0.0] |
| 16.3 Unclear reversibility | 1 | | symptoms (Fixed, 95% CI) | 0.0 [0.0, 0.0] |
| 17 Change from baseline in predose FEV1 Show forest plot | 3 | | Litres (Fixed, 95% CI) | 0.06 [0.03, 0.10] |
|
| 17.1 Reversible population | 3 | | Litres (Fixed, 95% CI) | 0.07 [0.02, 0.12] |
| 17.2 Partially reversible population (mixed population) | 0 | | Litres (Fixed, 95% CI) | 0.0 [0.0, 0.0] |
| 17.3 Poorly reversible population | 2 | | Litres (Fixed, 95% CI) | 0.06 [0.01, 0.10] |
| 17.4 Unclear reversibility | 0 | | Litres (Fixed, 95% CI) | 0.0 [0.0, 0.0] |
| 18 Change from baseline in postdose FEV1 Show forest plot | 3 | | Litres (Fixed, 95% CI) | 0.05 [0.03, 0.06] |
|
| 18.1 Reversible population | 0 | | Litres (Fixed, 95% CI) | 0.0 [0.0, 0.0] |
| 18.2 Partially reversible population (mixed population) | 0 | | Litres (Fixed, 95% CI) | 0.0 [0.0, 0.0] |
| 18.3 Poorly reversible population | 3 | | Litres (Fixed, 95% CI) | 0.05 [0.03, 0.06] |
| 18.4 Unclear reversibility | 0 | | Litres (Fixed, 95% CI) | 0.0 [0.0, 0.0] |
| 19 End of treatment FEV1 (Litres) Show forest plot | 2 | 1780 | Mean Difference (IV, Fixed, 95% CI) | 0.01 [‐0.02, 0.03] |
|
| 19.1 Partially reversible population (mixed population) | 0 | 0 | Mean Difference (IV, Fixed, 95% CI) | 0.0 [0.0, 0.0] |
| 19.2 Poorly reversible population | 2 | 1780 | Mean Difference (IV, Fixed, 95% CI) | 0.01 [‐0.02, 0.03] |
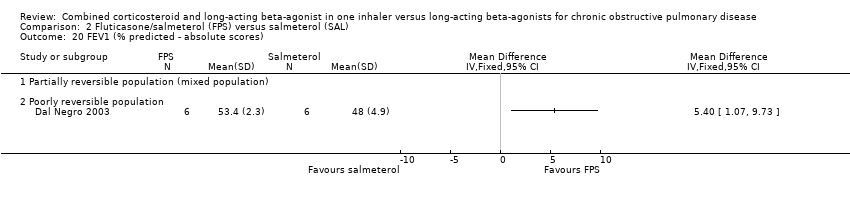
| 20 FEV1 (% predicted ‐ absolute scores) Show forest plot | 1 | | Mean Difference (IV, Fixed, 95% CI) | Totals not selected |
|
| 20.1 Partially reversible population (mixed population) | 0 | | Mean Difference (IV, Fixed, 95% CI) | 0.0 [0.0, 0.0] |
| 20.2 Poorly reversible population | 1 | | Mean Difference (IV, Fixed, 95% CI) | 0.0 [0.0, 0.0] |
| 21 Change from baseline in am PEF (L/min) Show forest plot | 2 | | L/min (Fixed, 95% CI) | 11.61 [7.91, 15.30] |
|
| 21.1 Partially reversible population | 0 | | L/min (Fixed, 95% CI) | 0.0 [0.0, 0.0] |
| 21.2 Poorly reversible population | 2 | | L/min (Fixed, 95% CI) | 11.61 [7.91, 15.30] |
| 21.3 Unclear reversibility | 0 | | L/min (Fixed, 95% CI) | 0.0 [0.0, 0.0] |
| 22 Change from baseline in rescue medication usage (puffs/day) Show forest plot | 2 | 673 | Mean Difference (IV, Fixed, 95% CI) | ‐0.30 [‐0.94, 0.34] |
|
| 22.1 Partially reversible population (mixed population) | 2 | 673 | Mean Difference (IV, Fixed, 95% CI) | ‐0.30 [‐0.94, 0.34] |
| 22.2 Poorly reversible population | 0 | 0 | Mean Difference (IV, Fixed, 95% CI) | 0.0 [0.0, 0.0] |
| 23 End of treatment rescue medication usage (puffs/day) Show forest plot | 1 | | Mean Difference (IV, Fixed, 95% CI) | Totals not selected |
|
| 23.1 Partially reversible population (mixed population) | 0 | | Mean Difference (IV, Fixed, 95% CI) | 0.0 [0.0, 0.0] |
| 23.2 Poorly reversible population | 1 | | Mean Difference (IV, Fixed, 95% CI) | 0.0 [0.0, 0.0] |
| 24 Withdrawals Show forest plot | 7 | 6647 | Odds Ratio (M‐H, Fixed, 95% CI) | 0.89 [0.80, 1.00] |
|
| 24.1 Reversible population | 1 | 121 | Odds Ratio (M‐H, Fixed, 95% CI) | 2.95 [0.30, 29.18] |
| 24.2 Partially reversible population (mixed population) | 2 | 680 | Odds Ratio (M‐H, Fixed, 95% CI) | 1.03 [0.74, 1.43] |
| 24.3 Poorly reversible population | 4 | 5846 | Odds Ratio (M‐H, Fixed, 95% CI) | 0.87 [0.78, 0.98] |
| 24.4 Unclear reversibility | 0 | 0 | Odds Ratio (M‐H, Fixed, 95% CI) | 0.0 [0.0, 0.0] |
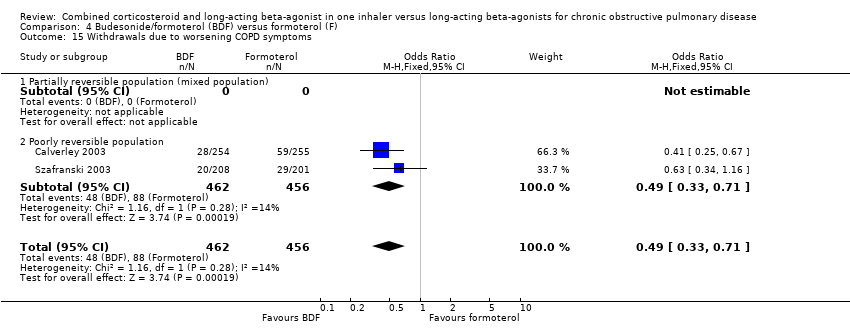
| 25 Withdrawals due to lack of efficacy Show forest plot | 4 | 5160 | Odds Ratio (M‐H, Fixed, 95% CI) | 0.49 [0.33, 0.72] |
|
| 25.1 Reversible population | 0 | 0 | Odds Ratio (M‐H, Fixed, 95% CI) | 0.0 [0.0, 0.0] |
| 25.2 Partially reversible population (mixed population) | 1 | 325 | Odds Ratio (M‐H, Fixed, 95% CI) | 0.40 [0.10, 1.59] |
| 25.3 Poorly reversible population | 3 | 4835 | Odds Ratio (M‐H, Fixed, 95% CI) | 0.50 [0.33, 0.74] |
| 25.4 Unclear reversibility | 0 | 0 | Odds Ratio (M‐H, Fixed, 95% CI) | 0.0 [0.0, 0.0] |
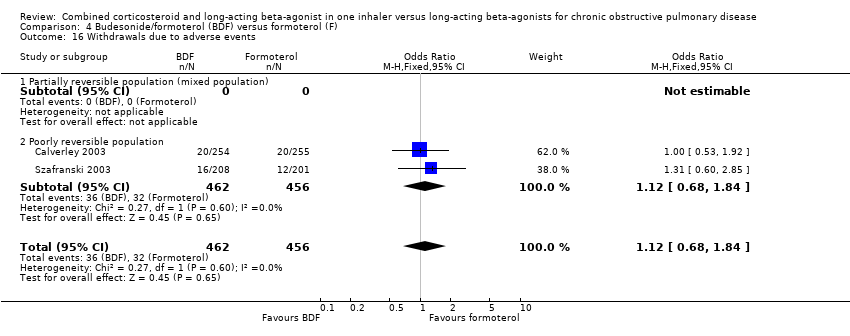
| 26 Withdrawals due to adverse events Show forest plot | 6 | 6316 | Odds Ratio (M‐H, Fixed, 95% CI) | 0.90 [0.78, 1.04] |
|
| 26.1 Reversible population | 1 | 121 | Odds Ratio (M‐H, Fixed, 95% CI) | 0.0 [0.0, 0.0] |
| 26.2 Partially reversible population (mixed population) | 1 | 333 | Odds Ratio (M‐H, Fixed, 95% CI) | 0.97 [0.41, 2.30] |
| 26.3 Poorly reversible population | 4 | 5862 | Odds Ratio (M‐H, Fixed, 95% CI) | 0.90 [0.78, 1.04] |
| 26.4 Unclear reversibility | 0 | 0 | Odds Ratio (M‐H, Fixed, 95% CI) | 0.0 [0.0, 0.0] |
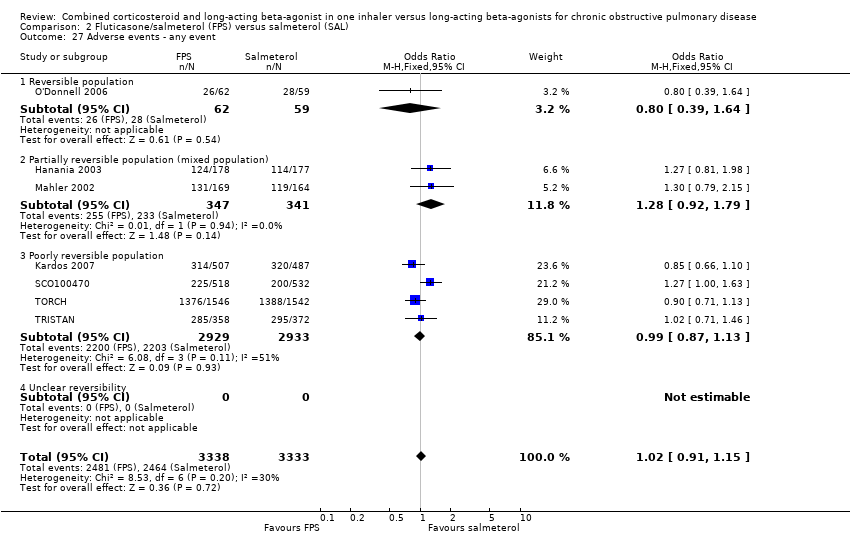
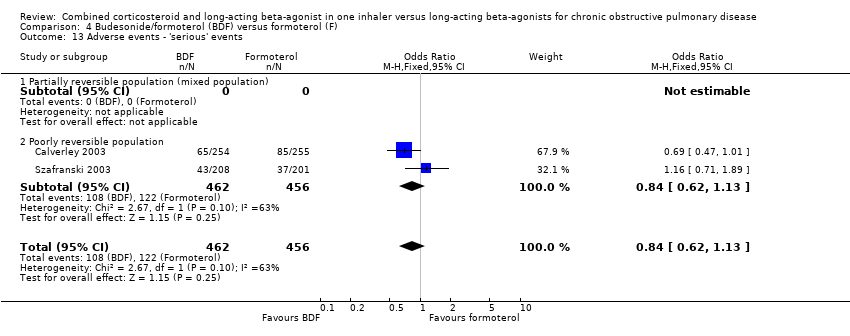
| 27 Adverse events ‐ any event Show forest plot | 7 | 6671 | Odds Ratio (M‐H, Fixed, 95% CI) | 1.02 [0.91, 1.15] |
|
| 27.1 Reversible population | 1 | 121 | Odds Ratio (M‐H, Fixed, 95% CI) | 0.80 [0.39, 1.64] |
| 27.2 Partially reversible population (mixed population) | 2 | 688 | Odds Ratio (M‐H, Fixed, 95% CI) | 1.28 [0.92, 1.79] |
| 27.3 Poorly reversible population | 4 | 5862 | Odds Ratio (M‐H, Fixed, 95% CI) | 0.99 [0.87, 1.13] |
| 27.4 Unclear reversibility | 0 | 0 | Odds Ratio (M‐H, Fixed, 95% CI) | 0.0 [0.0, 0.0] |
| 28 Adverse events ‐ candidiasis Show forest plot | 4 | 1539 | Odds Ratio (M‐H, Fixed, 95% CI) | 4.28 [2.38, 7.69] |
|
| 28.1 Reversible population | 1 | 121 | Odds Ratio (M‐H, Fixed, 95% CI) | 2.90 [0.12, 72.67] |
| 28.2 Partially reversible population (mixed population) | 2 | 688 | Odds Ratio (M‐H, Fixed, 95% CI) | 5.15 [2.10, 12.62] |
| 28.3 Poorly reversible population | 1 | 730 | Odds Ratio (M‐H, Fixed, 95% CI) | 3.71 [1.66, 8.28] |
| 28.4 Unclear reversibility | 0 | 0 | Odds Ratio (M‐H, Fixed, 95% CI) | 0.0 [0.0, 0.0] |
| 29 Adverse events ‐ pneumonia Show forest plot | 7 | 6663 | Odds Ratio (M‐H, Fixed, 95% CI) | 1.59 [1.33, 1.91] |
|
| 29.1 Reversible population | 1 | 121 | Odds Ratio (M‐H, Fixed, 95% CI) | 0.0 [0.0, 0.0] |
| 29.2 Partially reversible population (mixed population) | 2 | 680 | Odds Ratio (M‐H, Fixed, 95% CI) | 1.47 [0.24, 8.89] |
| 29.3 Poorly reversible population | 4 | 5862 | Odds Ratio (M‐H, Fixed, 95% CI) | 1.59 [1.33, 1.91] |
| 29.4 Unclear reversibility | 0 | 0 | Odds Ratio (M‐H, Fixed, 95% CI) | 0.0 [0.0, 0.0] |
| 30 Adverse events ‐ headache Show forest plot | 6 | 5658 | Odds Ratio (M‐H, Fixed, 95% CI) | 1.10 [0.90, 1.36] |
|
| 30.1 Reversible population | 1 | 121 | Odds Ratio (M‐H, Fixed, 95% CI) | 0.46 [0.08, 2.60] |
| 30.2 Partially reversible population (mixed population) | 2 | 680 | Odds Ratio (M‐H, Fixed, 95% CI) | 1.25 [0.82, 1.91] |
| 30.3 Poorly reversible population | 3 | 4857 | Odds Ratio (M‐H, Fixed, 95% CI) | 1.08 [0.85, 1.37] |
| 30.4 Unclear reversibility | 0 | 0 | Odds Ratio (M‐H, Fixed, 95% CI) | 0.0 [0.0, 0.0] |
| 31 Adverse events ‐ upper respiratory tract infection Show forest plot | 5 | 4619 | Odds Ratio (M‐H, Fixed, 95% CI) | 1.35 [1.13, 1.62] |
|
| 31.1 Reversible population | 1 | 121 | Odds Ratio (M‐H, Fixed, 95% CI) | 0.31 [0.01, 7.81] |
| 31.2 Partially reversible population (mixed population) | 2 | 680 | Odds Ratio (M‐H, Fixed, 95% CI) | 1.43 [0.90, 2.25] |
| 31.3 Poorly reversible population | 2 | 3818 | Odds Ratio (M‐H, Fixed, 95% CI) | 1.34 [1.10, 1.64] |
| 31.4 Unclear reversibility | 0 | 0 | Odds Ratio (M‐H, Fixed, 95% CI) | 0.0 [0.0, 0.0] |