| 1 Number of participants with one or more exacerbation Show forest plot | 3 | 965 | Odds Ratio (M‐H, Fixed, 95% CI) | 0.99 [0.74, 1.33] |
|
| 1.1 Partially reversible population (mixed population) | 2 | 703 | Odds Ratio (M‐H, Fixed, 95% CI) | 0.85 [0.59, 1.22] |
| 1.2 Poorly reversible population | 1 | 262 | Odds Ratio (M‐H, Fixed, 95% CI) | 1.32 [0.81, 2.15] |
| 2 End of treatment mean number of exacerbations per participant Show forest plot | 1 | | Mean Difference (IV, Fixed, 95% CI) | Totals not selected |
|
| 2.1 Partially reversible population (mixed population) | 0 | | Mean Difference (IV, Fixed, 95% CI) | 0.0 [0.0, 0.0] |
| 2.2 Poorly reversible population | 1 | | Mean Difference (IV, Fixed, 95% CI) | 0.0 [0.0, 0.0] |
| 3 Exacerbations Show forest plot | 2 | | Rate ratio (Fixed, 95% CI) | 0.91 [0.85, 0.98] |
|
| 3.1 Partially reversible population (mixed population) | 0 | | Rate ratio (Fixed, 95% CI) | 0.0 [0.0, 0.0] |
| 3.2 Poorly reversible population | 2 | | Rate ratio (Fixed, 95% CI) | 0.91 [0.85, 0.98] |
| 4 Exacerbations by type Show forest plot | 2 | | Rate ratio (Random, 95% CI) | Subtotals only |
|
| 4.1 Requirement for oral steroids | 2 | | Rate ratio (Random, 95% CI) | 0.89 [0.81, 0.98] |
| 4.2 Requirement for antibiotic treatment | 0 | | Rate ratio (Random, 95% CI) | 0.0 [0.0, 0.0] |
| 4.3 Requirement for oral steroid or antibiotic treatment | 0 | | Rate ratio (Random, 95% CI) | 0.0 [0.0, 0.0] |
| 4.4 Hospitalisation | 1 | | Rate ratio (Random, 95% CI) | 0.95 [0.82, 1.11] |
| 5 Mortality Show forest plot | 4 | 4394 | Odds Ratio (M‐H, Fixed, 95% CI) | 0.76 [0.62, 0.93] |
|
| 5.1 Mortality: three year data | 1 | 3067 | Odds Ratio (M‐H, Fixed, 95% CI) | 0.75 [0.62, 0.92] |
| 5.2 Mortality: >one and <three year data | 0 | 0 | Odds Ratio (M‐H, Fixed, 95% CI) | 0.0 [0.0, 0.0] |
| 5.3 Mortality: one year data | 2 | 994 | Odds Ratio (M‐H, Fixed, 95% CI) | 1.03 [0.23, 4.57] |
| 5.4 Mortality: 6 month data | 1 | 333 | Odds Ratio (M‐H, Fixed, 95% CI) | 0.0 [0.0, 0.0] |
| 6 Change from baseline in St George's Respiratory Questionnaire (total score) Show forest plot | 3 | | SGRQ units (Fixed, 95% CI) | ‐1.30 [‐2.04, ‐0.57] |
|
| 6.1 Partially reversible population (mixed population) | 0 | | SGRQ units (Fixed, 95% CI) | 0.0 [0.0, 0.0] |
| 6.2 Poorly reversible population | 3 | | SGRQ units (Fixed, 95% CI) | ‐1.30 [‐2.04, ‐0.57] |
| 7 Change from baseline in St George's Respiratory Questionnaire (domain ‐ symptoms) Show forest plot | 1 | | SGRQ units (Fixed, 95% CI) | Totals not selected |
|
| 7.1 Partially reversible population (mixed population) | 0 | | SGRQ units (Fixed, 95% CI) | 0.0 [0.0, 0.0] |
| 7.2 Poorly reversible population | 1 | | SGRQ units (Fixed, 95% CI) | 0.0 [0.0, 0.0] |
| 8 Change from baseline in St George's Respiratory Questionnaire (domain ‐ activity) Show forest plot | 1 | | SGRQ units (Fixed, 95% CI) | Totals not selected |
|
| 8.1 Partially reversible population (mixed population) | 0 | | SGRQ units (Fixed, 95% CI) | 0.0 [0.0, 0.0] |
| 8.2 Poorly reversible population | 1 | | SGRQ units (Fixed, 95% CI) | 0.0 [0.0, 0.0] |
| 9 Change from baseline in St George's Respiratory Questionnaire (domain ‐ impact) Show forest plot | 1 | | SGRQ units (Fixed, 95% CI) | Totals not selected |
|
| 9.1 Partially reversible population (mixed population) | 0 | | SGRQ units (Fixed, 95% CI) | 0.0 [0.0, 0.0] |
| 9.2 Poorly reversible population | 1 | | SGRQ units (Fixed, 95% CI) | 0.0 [0.0, 0.0] |
| 10 End of treatment St George's Respiratory Questionnaire scores (total score) Show forest plot | 1 | | Mean Difference (IV, Fixed, 95% CI) | Totals not selected |
|
| 10.1 Partially reversible population (mixed population) | 0 | | Mean Difference (IV, Fixed, 95% CI) | 0.0 [0.0, 0.0] |
| 10.2 Poorly reversible population | 1 | | Mean Difference (IV, Fixed, 95% CI) | 0.0 [0.0, 0.0] |
| 11 End of treatment St George's Respiratory Questionnaire scores (domain ‐ symptoms) Show forest plot | 1 | | Mean Difference (IV, Fixed, 95% CI) | Totals not selected |
|
| 11.1 Partially reversible population (mixed population) | 0 | | Mean Difference (IV, Fixed, 95% CI) | 0.0 [0.0, 0.0] |
| 11.2 Poorly reversible population | 1 | | Mean Difference (IV, Fixed, 95% CI) | 0.0 [0.0, 0.0] |
| 12 Change from baseline in Canadian Respiratory Disease Questionnaire scores Show forest plot | 2 | 696 | Mean Difference (IV, Random, 95% CI) | 2.34 [‐3.15, 7.82] |
|
| 12.1 Partially reversible population (mixed population) | 2 | 696 | Mean Difference (IV, Random, 95% CI) | 2.34 [‐3.15, 7.82] |
| 12.2 Poorly reversible population | 0 | 0 | Mean Difference (IV, Random, 95% CI) | 0.0 [0.0, 0.0] |
| 13 Change from baseline in Transitional Dyspnoea Index (TDI) Show forest plot | 2 | 690 | Mean Difference (IV, Random, 95% CI) | 0.31 [‐0.45, 1.08] |
|
| 13.1 Partially reversible population (mixed population) | 2 | 690 | Mean Difference (IV, Random, 95% CI) | 0.31 [‐0.45, 1.08] |
| 13.2 Poorly reversible population | 0 | 0 | Mean Difference (IV, Random, 95% CI) | 0.0 [0.0, 0.0] |
| 14 Change from baseline in FEV1 (Litres) Show forest plot | 2 | | L/min (Fixed, 95% CI) | 0.09 [0.06, 0.12] |
|
| 14.1 Partially reversible population (mixed population) | 0 | | L/min (Fixed, 95% CI) | 0.0 [0.0, 0.0] |
| 14.2 Poorly reversible population | 2 | | L/min (Fixed, 95% CI) | 0.09 [0.06, 0.12] |
| 15 Change from baseline in predose FEV1 (Litres) Show forest plot | 2 | 690 | Mean Difference (IV, Fixed, 95% CI) | 0.05 [0.02, 0.09] |
|
| 15.1 Reversible population | 2 | 380 | Mean Difference (IV, Fixed, 95% CI) | 0.07 [0.01, 0.12] |
| 15.2 Partially reversible population (mixed population) | 0 | 0 | Mean Difference (IV, Fixed, 95% CI) | 0.0 [0.0, 0.0] |
| 15.3 Poorly reversible population | 2 | 310 | Mean Difference (IV, Fixed, 95% CI) | 0.04 [‐0.01, 0.09] |
| 16 End of treatment FEV1 (Litres) Show forest plot | 1 | | Mean Difference (IV, Fixed, 95% CI) | Totals not selected |
|
| 16.1 Partially reversible population (mixed population) | 0 | | Mean Difference (IV, Fixed, 95% CI) | 0.0 [0.0, 0.0] |
| 16.2 Poorly reversible population | 1 | | Mean Difference (IV, Fixed, 95% CI) | 0.0 [0.0, 0.0] |
| 17 End of treatment postdose FEV1 Show forest plot | 2 | | Litres (Fixed, 95% CI) | 0.03 [0.01, 0.06] |
|
| 17.1 Partially reversible population (mixed population) | 0 | | Litres (Fixed, 95% CI) | 0.0 [0.0, 0.0] |
| 17.2 Poorly reversible population | 2 | | Litres (Fixed, 95% CI) | 0.03 [0.01, 0.06] |
| 18 Change from baseline in postdose FEV1 Show forest plot | 1 | | Litres (Fixed, 95% CI) | Totals not selected |
|
| 18.1 Reversible population | 0 | | Litres (Fixed, 95% CI) | 0.0 [0.0, 0.0] |
| 18.2 Partially reversible population (mixed population) | 0 | | Litres (Fixed, 95% CI) | 0.0 [0.0, 0.0] |
| 18.3 Poorly reversible population | 1 | | Litres (Fixed, 95% CI) | 0.0 [0.0, 0.0] |
| 18.4 Unclear reversibility | 0 | | Litres (Fixed, 95% CI) | 0.0 [0.0, 0.0] |
| 19 End of treatment am PEF (L/min) Show forest plot | 1 | | L/min (Fixed, 95% CI) | Totals not selected |
|
| 19.1 Partially reversible population (mixed population) | 0 | | L/min (Fixed, 95% CI) | 0.0 [0.0, 0.0] |
| 19.2 Poorly reversible population | 1 | | L/min (Fixed, 95% CI) | 0.0 [0.0, 0.0] |
| 20 Absolute shuttle walk test Show forest plot | 1 | | Metres (Fixed, 95% CI) | Totals not selected |
|
| 20.1 Partially reversible population (mixed population) | 0 | | Metres (Fixed, 95% CI) | 0.0 [0.0, 0.0] |
| 20.2 Poorly reversible population | 1 | | Metres (Fixed, 95% CI) | 0.0 [0.0, 0.0] |
| 21 Change from baseline in rescue medication usage (puffs/day) Show forest plot | 2 | 686 | Mean Difference (IV, Fixed, 95% CI) | ‐0.80 [‐1.31, ‐0.29] |
|
| 21.1 Partially reversible population (mixed population) | 2 | 686 | Mean Difference (IV, Fixed, 95% CI) | ‐0.80 [‐1.31, ‐0.29] |
| 21.2 Poorly reversible population | 0 | 0 | Mean Difference (IV, Fixed, 95% CI) | 0.0 [0.0, 0.0] |
| 22 Withdrawals Show forest plot | 5 | 4756 | Odds Ratio (M‐H, Fixed, 95% CI) | 0.86 [0.76, 0.97] |
|
| 22.1 Partially reversible population (mixed population) | 2 | 694 | Odds Ratio (M‐H, Fixed, 95% CI) | 0.87 [0.63, 1.20] |
| 22.2 Poorly reversible population | 3 | 4062 | Odds Ratio (M‐H, Fixed, 95% CI) | 0.86 [0.76, 0.98] |
| 23 Withdrawal due to lack of efficacy/exacerbation Show forest plot | 4 | 4395 | Odds Ratio (M‐H, Fixed, 95% CI) | 0.73 [0.49, 1.08] |
|
| 23.1 Partially reversible population (mixed population) | 1 | 333 | Odds Ratio (M‐H, Fixed, 95% CI) | 1.02 [0.20, 5.12] |
| 23.2 Poorly reversible population | 3 | 4062 | Odds Ratio (M‐H, Fixed, 95% CI) | 0.72 [0.48, 1.08] |
| 24 Withdrawals due to adverse events Show forest plot | 4 | 4424 | Odds Ratio (M‐H, Fixed, 95% CI) | 0.75 [0.64, 0.88] |
|
| 24.1 Partially reversible population (mixed population) | 1 | 342 | Odds Ratio (M‐H, Fixed, 95% CI) | 0.48 [0.22, 1.02] |
| 24.2 Poorly reversible population | 3 | 4082 | Odds Ratio (M‐H, Fixed, 95% CI) | 0.77 [0.65, 0.90] |
| 25 Adverse events ‐ any event Show forest plot | 5 | 4795 | Odds Ratio (M‐H, Fixed, 95% CI) | 0.94 [0.80, 1.10] |
|
| 25.1 Partially reversible population (mixed population) | 2 | 703 | Odds Ratio (M‐H, Fixed, 95% CI) | 0.92 [0.66, 1.30] |
| 25.2 Poorly reversible population | 3 | 4092 | Odds Ratio (M‐H, Fixed, 95% CI) | 0.94 [0.78, 1.13] |
| 26 Adverse events ‐ candidiasis Show forest plot | 4 | 1697 | Odds Ratio (M‐H, Fixed, 95% CI) | 1.08 [0.74, 1.58] |
|
| 26.1 Partially reversible population (mixed population) | 2 | 703 | Odds Ratio (M‐H, Fixed, 95% CI) | 1.07 [0.62, 1.83] |
| 26.2 Poorly reversible population | 2 | 994 | Odds Ratio (M‐H, Fixed, 95% CI) | 1.09 [0.63, 1.86] |
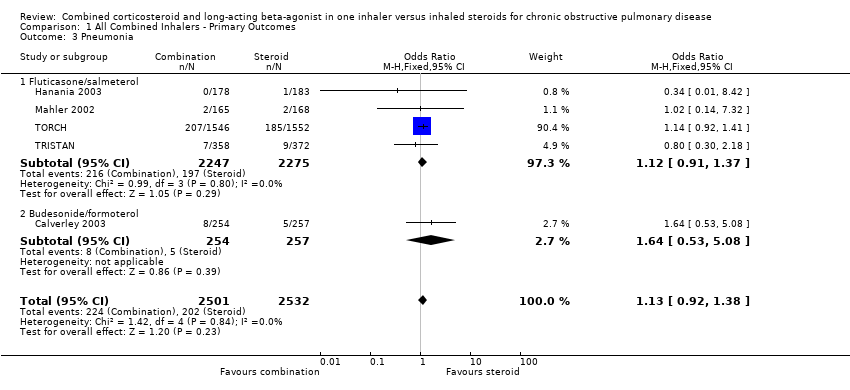
| 27 Adverse events ‐ pneumonia Show forest plot | 4 | 4522 | Odds Ratio (M‐H, Fixed, 95% CI) | 1.12 [0.91, 1.37] |
|
| 27.1 Partially reversible population (mixed population) | 2 | 694 | Odds Ratio (M‐H, Fixed, 95% CI) | 0.73 [0.14, 3.72] |
| 27.2 Poorly reversible population | 2 | 3828 | Odds Ratio (M‐H, Fixed, 95% CI) | 1.12 [0.91, 1.38] |
| 27.3 Unclear reversibility | 0 | 0 | Odds Ratio (M‐H, Fixed, 95% CI) | 0.0 [0.0, 0.0] |
| 28 Adverse events ‐ headache Show forest plot | 4 | 4538 | Odds Ratio (M‐H, Fixed, 95% CI) | 0.97 [0.79, 1.20] |
|
| 28.1 Partially reversible population (mixed population) | 2 | 694 | Odds Ratio (M‐H, Fixed, 95% CI) | 1.07 [0.72, 1.60] |
| 28.2 Poorly reversible population | 2 | 3844 | Odds Ratio (M‐H, Fixed, 95% CI) | 0.94 [0.73, 1.20] |
| 28.3 Unclear reversibility | 0 | 0 | Odds Ratio (M‐H, Fixed, 95% CI) | 0.0 [0.0, 0.0] |
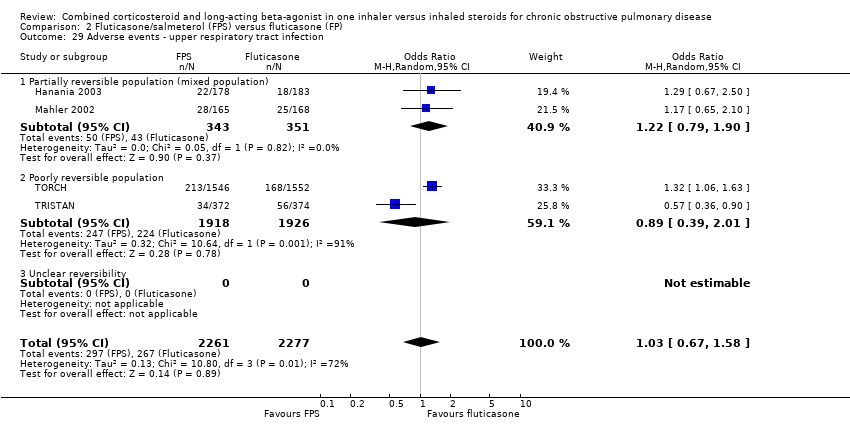
| 29 Adverse events ‐ upper respiratory tract infection Show forest plot | 4 | 4538 | Odds Ratio (M‐H, Random, 95% CI) | 1.03 [0.67, 1.58] |
|
| 29.1 Partially reversible population (mixed population) | 2 | 694 | Odds Ratio (M‐H, Random, 95% CI) | 1.22 [0.79, 1.90] |
| 29.2 Poorly reversible population | 2 | 3844 | Odds Ratio (M‐H, Random, 95% CI) | 0.89 [0.39, 2.01] |
| 29.3 Unclear reversibility | 0 | 0 | Odds Ratio (M‐H, Random, 95% CI) | 0.0 [0.0, 0.0] |
| 30 Mortality ‐ cause specific Show forest plot | 1 | | Odds Ratio (M‐H, Fixed, 95% CI) | Totals not selected |
|
| 30.1 COPD‐related death | 1 | | Odds Ratio (M‐H, Fixed, 95% CI) | 0.0 [0.0, 0.0] |
| 30.2 Cancer | 1 | | Odds Ratio (M‐H, Fixed, 95% CI) | 0.0 [0.0, 0.0] |
| 30.3 Cardiovascular | 1 | | Odds Ratio (M‐H, Fixed, 95% CI) | 0.0 [0.0, 0.0] |