Oclusión puntual para el síndrome de ojo seco
Información
- DOI:
- https://doi.org/10.1002/14651858.CD006775.pub3Copiar DOI

- Base de datos:
-
- Cochrane Database of Systematic Reviews
- Versión publicada:
-
- 26 junio 2017see what's new
- Tipo:
-
- Intervention
- Etapa:
-
- Review
- Grupo Editorial Cochrane:
-
Grupo Cochrane de Salud ocular y de la visión
- Copyright:
-
- Copyright © 2017 The Cochrane Collaboration. Published by John Wiley & Sons, Ltd.
Cifras del artículo
Altmetric:
Citado por:
Autores
Contributions of authors
Review co‐ordination: AE, AL
Data collection for the review update
-
Designing search strategies: AE, RW, OS, CEV Trials Search Co‐ordinator
-
Undertaking searches: CEV Trials Search Co‐ordinator
-
Screening search results: AE, AL
-
Organizing retrieval of papers: AL
-
Screening retrieved papers against inclusion criteria: AE, AL
-
Appraising quality of papers: AE, AL
-
Extracting data from papers: AE, AL
-
Writing to authors of papers for additional information: AE
-
Providing additional data about papers: AE
-
Obtaining and screening data on unpublished studies: AE, AL
Data management for the review
-
Entering data into RevMan: AE, AL
-
Analyzing data: AE, AL
Interpretation of data
-
Providing a methodological perspective: AE, AL
-
Providing a clinical perspective: AP
-
Providing a policy perspective: AE, AP
-
Providing a consumer perspective: AE
Writing the review: AE, AL, AP
Providing general advice on the review: AE, AL, AP
Securing funding for the review: NA
Performing previous work that was the foundation of the current study: NA
Guarantor for review: AE
Sources of support
Internal sources
-
National Human Genome Research Institute Intramural funds, National Institutes of Health, USA.
This research was supported in part by the Intramural Research Program of the National Human Genome Research Institute, National Institutes of Health
External sources
-
Grant 1 U01 EY020522, National Eye Institute, National Institutes of Health, USA.
-
National Institute for Health Research (NIHR), UK.
-
Richard Wormald, Co‐ordinating Editor for Cochrane Eyes and Vision (CEV) acknowledges financial support for his CEV research sessions from the Department of Health through the award made by the NIHR to Moorfields Eye Hospital NHS Foundation Trust and UCL Institute of Ophthalmology for a Specialist Biomedical Research Centre for Ophthalmology.
-
This review was supported by the NIHR, via Cochrane Infrastructure funding to the CEV UK editorial base.
The views and opinions expressed therein are those of the authors and do not necessarily reflect those of the Systematic Reviews Programme, NIHR, NHS or the Department of Health.
-
Declarations of interest
AE: none known.
AL: none known.
AP: none known.
Acknowledgements
The authors would like to thank Iris Gordon and Lori Rosman, Informationists for Cochrane Eyes and Vision (CEV), for designing the search strategy and conducting the electronic searches. We also acknowledge the CEV editorial team's support during the preparation of this review and thank Oliver Schein and Robert Wojciechowski for their contributions to the prior review published in 2010. We would like to also acknowledge Ke Chen, Xinyi Chen, and Shi‐ming Li for their help in screening full‐text reports, abstracting data, and translating Mandarin publications. Finally, we would like to thank our peer reviewers Jod Mehta and Barbara Hawkins.
Version history
| Published | Title | Stage | Authors | Version |
| 2017 Jun 26 | Punctal occlusion for dry eye syndrome | Review | Ann‐Margret Ervin, Andrew Law, Andrew D Pucker | |
| 2010 Sep 08 | Punctal occlusion for dry eye syndrome | Review | Ann‐Margret Ervin, Robert Wojciechowski, Oliver Schein | |
| 2007 Oct 17 | Punctal occlusion for dry eye syndrome | Protocol | Ann‐Margret Ervin, Robert Wojciechowski, Oliver Schein | |
Differences between protocol and review
Cochrane methodology regarding assessments of the risk of bias in included studies has changed, and the review authors updated the 'Assessment of risk of bias in included studies' section of the Methods to reflect these updated methodological. We also added methods for assessing the certainty of evidence using the GRADE approach and preparing 'Summary of findings' tables.
Data synthesis: We did not solely base our decision to perform meta‐analysis on the I2 statistic; we took statistical, methodological, and clinical heterogeneity into consideration.
We modified the follow‐up time points for our primary and secondary outcomes to two and four weeks. Two and four weeks were considered the clinically relevant time points for this review because this is when clinicians tend to schedule follow‐up visits for dry eye patients. We also chose these time points because two other systematic reviews (treatment of dry eye with over the counter artifical tears and treatment of dry eye with autologous serum) on dry eye used these time points when comparing similar dry eye outcomes (Pan 2013; Pucker 2016).
Keywords
MeSH
Medical Subject Headings (MeSH) Keywords
Medical Subject Headings Check Words
Female; Humans; Male;
PICO

Risk of bias summary: review authors' judgements about each risk of bias item for each included study.

Comparison 1 Punctal plug versus observation, Outcome 1 Symptomatic improvement at 1 month.

Comparison 1 Punctal plug versus observation, Outcome 2 Symptomatic improvement (long‐term).

Comparison 1 Punctal plug versus observation, Outcome 3 Ocular surface staining at 2 weeks.

Comparison 1 Punctal plug versus observation, Outcome 4 Ocular surface staining at 1 month.
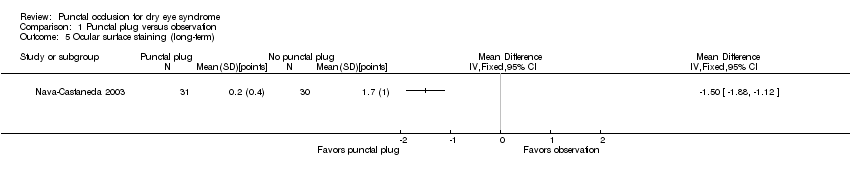
Comparison 1 Punctal plug versus observation, Outcome 5 Ocular surface staining (long‐term).

Comparison 1 Punctal plug versus observation, Outcome 6 Tear film stability at 1 month.

Comparison 1 Punctal plug versus observation, Outcome 7 Tear film stability (long‐term).
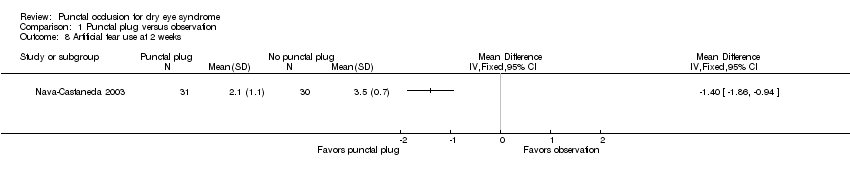
Comparison 1 Punctal plug versus observation, Outcome 8 Artificial tear use at 2 weeks.

Comparison 1 Punctal plug versus observation, Outcome 9 Artificial tear use at 1 month.

Comparison 1 Punctal plug versus observation, Outcome 10 Artificial tear use (long‐term).

Comparison 2 Punctal plugs versus cyclosporine, Outcome 1 Ocular surface staining at 1 month.

Comparison 2 Punctal plugs versus cyclosporine, Outcome 2 Ocular surface staining at 6 months.

Comparison 2 Punctal plugs versus cyclosporine, Outcome 3 Aqueous tear production at 1 month.

Comparison 2 Punctal plugs versus cyclosporine, Outcome 4 Aqueous tear production at 6 months.

Comparison 2 Punctal plugs versus cyclosporine, Outcome 5 Artificial tear use at 1 month.

Comparison 2 Punctal plugs versus cyclosporine, Outcome 6 Artificial tear use at 6 months.

Comparison 3 Punctal plugs versus oral pilocarpine, Outcome 1 Symptomatic improvement at 3 months.
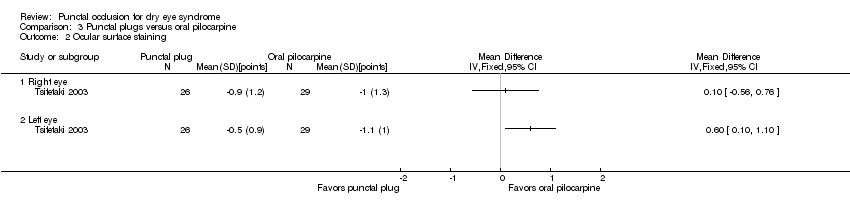
Comparison 3 Punctal plugs versus oral pilocarpine, Outcome 2 Ocular surface staining.

Comparison 3 Punctal plugs versus oral pilocarpine, Outcome 3 Aqueous tear production.
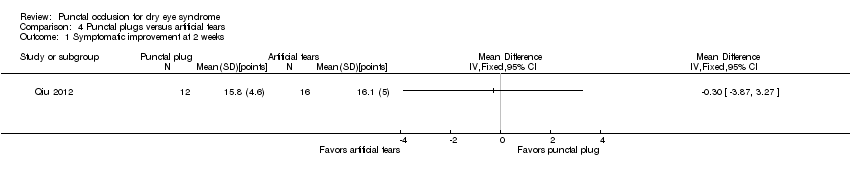
Comparison 4 Punctal plugs versus artificial tears, Outcome 1 Symptomatic improvement at 2 weeks.
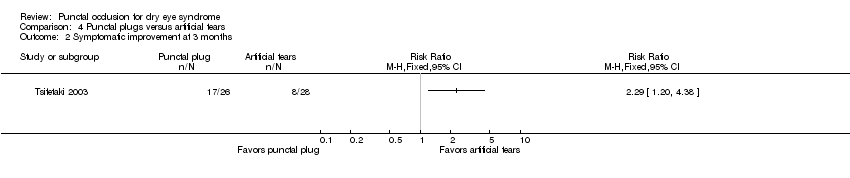
Comparison 4 Punctal plugs versus artificial tears, Outcome 2 Symptomatic improvement at 3 months.
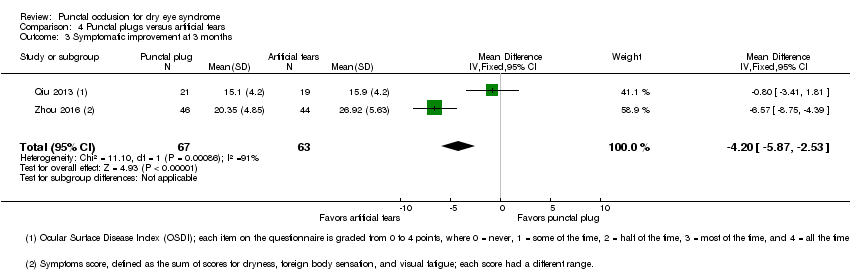
Comparison 4 Punctal plugs versus artificial tears, Outcome 3 Symptomatic improvement at 3 months.

Comparison 4 Punctal plugs versus artificial tears, Outcome 4 Ocular surface staining at 2 weeks.

Comparison 4 Punctal plugs versus artificial tears, Outcome 5 Ocular surface staining at 3 months (Rose Bengal).

Comparison 4 Punctal plugs versus artificial tears, Outcome 6 Ocular surface staining at 3 months (fluorescein).
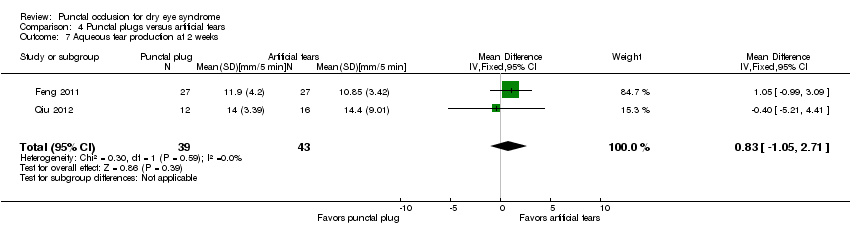
Comparison 4 Punctal plugs versus artificial tears, Outcome 7 Aqueous tear production at 2 weeks.
Comparison 4 Punctal plugs versus artificial tears, Outcome 8 Aqueous tear production at 3 months.

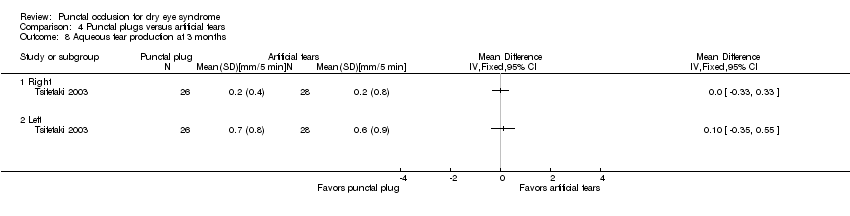
Comparison 4 Punctal plugs versus artificial tears, Outcome 9 Aqueous tear production at 3 months.

Comparison 4 Punctal plugs versus artificial tears, Outcome 10 Tear film stability at 2 weeks.

Comparison 4 Punctal plugs versus artificial tears, Outcome 11 Tear film stability at 3 months.

Comparison 4 Punctal plugs versus artificial tears, Outcome 12 Punctate epithelial keratopathy.

Comparison 5 Punctal plugs in the upper versus lower puncta, Outcome 1 Symptomatic improvement at 1 month.

Comparison 5 Punctal plugs in the upper versus lower puncta, Outcome 2 Aqueous tear production at 1 month.

Comparison 5 Punctal plugs in the upper versus lower puncta, Outcome 3 Tear film stability at 1 month.
Comparison 6 Acrylic punctal plugs versus silicone punctal plugs, Outcome 1 Symptomatic improvement at 11 weeks.

Comparison 6 Acrylic punctal plugs versus silicone punctal plugs, Outcome 2 Ocular surface staining at 11 weeks.
Comparison 6 Acrylic punctal plugs versus silicone punctal plugs, Outcome 3 Aqueous tear production at 11 weeks.

Comparison 6 Acrylic punctal plugs versus silicone punctal plugs, Outcome 4 Tear film stability at 11 weeks.
Comparison 6 Acrylic punctal plugs versus silicone punctal plugs, Outcome 5 Artificial tear use at 11 weeks.
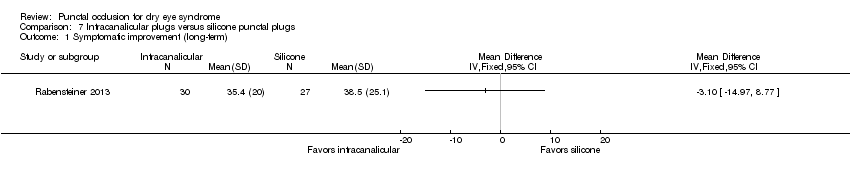
Comparison 7 Intracanalicular plugs versus silicone punctal plugs, Outcome 1 Symptomatic improvement (long‐term).
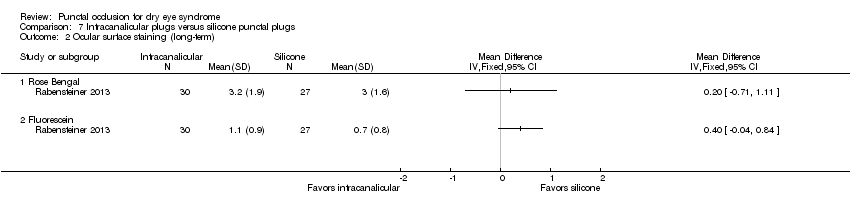
Comparison 7 Intracanalicular plugs versus silicone punctal plugs, Outcome 2 Ocular surface staining (long‐term).
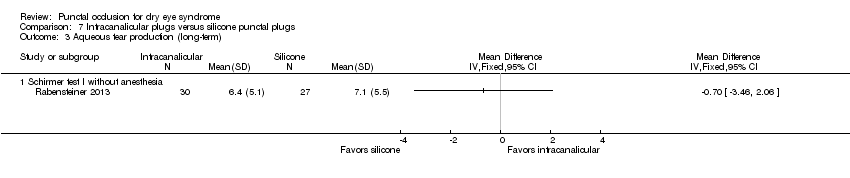
Comparison 7 Intracanalicular plugs versus silicone punctal plugs, Outcome 3 Aqueous tear production (long‐term).

Comparison 7 Intracanalicular plugs versus silicone punctal plugs, Outcome 4 Tear film stability (long‐term).

Comparison 7 Intracanalicular plugs versus silicone punctal plugs, Outcome 5 Artificial tear use (long‐term).
| Punctal plugs compared with no punctal plugs for dry eye syndrome | ||||||
| Patient or population: adults with dry eye syndrome Settings: eye clinics Intervention: silicone or collagen punctal plugs Comparison: no punctal plugs (observation or sham treatment) | ||||||
| Outcomes | Illustrative comparative risks* (95% CI) | Relative effect | No of participants | Certainty of the evidence | Comments | |
| Assumed risk | Corresponding risk | |||||
| No punctal plugs | Punctal plugs | |||||
| Symptomatic improvement Follow‐up: long‐term* A lower score favors punctal plugs | See comments | See comments | — | 89 (2 RCT) | ⊕⊝⊝⊝ | Mansour 2007 reported little or no difference in Ocular and Oral Symptoms score, which ranged from 0 to 10 points (MD ‐0.46 points, 95% CI ‐1.24 to 0.32; eyes = 26). Nava‐Castaneda 2003 reported a slight decrease in symptom score, assumed to range from 0 to 105 points, but it does not seem to be clinically important (MD ‐2.62 points, 95% CI ‐3.32 to ‐1.93; eyes = 61). Yung 2012 reported little or no difference in dry eye symptom score, ranging from 0 to 3 points (MD ‐0.75 points, 95% CI ‐1.53 to 0.02; eyes = 28) |
| Ocular surface staining Follow‐up: long‐term* A higher value is less advantageous Both Rose Bengal and fluorescein staining scores ranged from 0 to 4, where 0 represented no staining and 4 represented heavy staining | The mean fluorescein staining score was 1.70 | MD 1.50 lower than observation group (1.88 to 1.12 lower (better) than observation group) | — | 61 (1 RCT) | ⊕⊕⊝⊝ | — |
| Aqueous tear production Follow‐up: long‐term* A higher value is more advantageous | See comments | See comments | — | 28 (1 RCT) | ⊕⊕⊝⊝ | Yung 2012 did not provide quantitative data, but reported that "Schirmer values tended to increase in the plug group after plug insertion; however, the changes did not reach significance" |
| Tear film stability Follow‐up: 6 months A higher value is more advantageous | The mean tear film stability was 2.34 seconds | MD 1.93 seconds longer than observation group (0.67 to 3.20 seconds longer (better) than observation group) | — | 28 (1 RCT) | ⊕⊕⊝⊝ | — |
| Artificial tear use Follow‐up: long‐term* Fewer applications favors punctal plugs | The mean number of applications was 3.6 applications | MD 2.70 fewer applications than observation group (3.11 to 2.29 fewer applications than observation group) | — | 61 (1 RCT) | ⊕⊕⊝⊝ | — |
| Adverse events Follow‐up: end of study | See comments | See comments | — | 146 | ⊕⊝⊝⊝ | Slusser 1998: all adverse events occurred in the punctal plug group, reported 23/28 participants had epiphora, 3/28 participants reported itching in area of plug placement, 1/28 participants had tenderness and swelling of lids with mucous discharge. Spontaneous plug loss occurred in 6/20 eyes with silicone punctal plugs in the Mansour 2007. One or 31 participants receiving collagen and silicone punctal plugs experienced epiphora in the Nava‐Castaneda 2003 study. |
| *The basis for the assumed risk is the control group risk across studies. The corresponding risk (and its 95% confidence interval) is based on the assumed risk in the comparison group and the relative effect of the intervention (and its 95% CI). | ||||||
| GRADE Working Group grades of evidence | ||||||
| aDowngraded two levels for methodological heterogeneity. cDowngraded one level for imprecision as indirectness of evidence because the confidence interval was either wide or clinically not important. dDowngraded one level for high risk of attrition bias. eDowngraded two levels for high risk of performance, detection, and attrition bias. fDowngraded two levels for attrition bias. gDowngraded one level for sparse and inconsistent data, particularly with respect to epiphora. *We defined long‐term follow‐up as between two months and one year. | ||||||
| Punctal plugs compared with cyclosporine for dry eye syndrome | |||||
| Patient or population: adults with dry eye syndrome Settings: eye clinics Intervention: punctal plugs Comparison: cyclosporine | |||||
| Outcomes | Illustrative comparative risks* (95% CI) | No of participants | Certainty of the evidence | Comments | |
| Assumed risk | Corresponding risk | ||||
| Cyclosporine | Punctal plugs | ||||
| Symptomatic improvement | Study investigators did not report this outcome at 2 weeks, 1 month, or long‐term. | ||||
| Ocular surface staining Follow‐up: 6 months Any value greater than zero is abnormal Range: 0 to 4 points; 0 = no staining, 1 = staining of the nasal conjunctiva only, 2 = staining of both the nasal and temporal conjunctiva, 3 = peripheral corneal staining, 4 = central corneal staining | See comments | See comments | 20 (1 RCT) | ⊕⊝⊝⊝ | The study investigators of Roberts 2007 stated: "there was greater improvement in conjunctival staining with cyclosporine or the combination than with plugs alone." It was unclear whether Rose Bengal or fluorescein staining was used. Also, the study investigators did not specify the time point and so we assumed that their statement applies for 1, 3, and 6 months follow‐up. |
| Aqueous tear production Follow‐up: 6 months A higher value is more advantageous | The mean change in aqueous tear production was 1.5 mm/3 min lower than baseline | MD 0.80 mm/3 min higher than cyclosporine group (0.74 lower (better) to 2.34 higher (worse) than cyclosporine group) | 20 | ⊕⊝⊝⊝ | The study investigators of Roberts 2007 stated: "There was a greater increase in Schirmer score with plugs, either alone or in combination with cyclosporine." The study investigators did not specify the for which time point and so we assumed that their statement applies for 1, 3, and 6 months follow‐up. |
| Tear film stability Follow‐up: 6 months | Study investigators did not report this outcome at 2 weeks, 1 month, or long‐term. | ||||
| Artificial tear use Follow‐up: 6 months range: 1‐5 applications Fewer applications favors punctal plugs | The mean change in number of applications from baseline was 3.2 more applications than baseline | MD 1.10 applications more than baseline (0.04 fewer to 2.24 more applications than cyclosporine group) | 20 | ⊕⊝⊝⊝ | The study investigators of Roberts 2007 stated: "decreased frequency of artificial tears was greatest for combination therapy and least for punctal plugs." The study investigators did not specify the for which time point and so we assumed that their statement applies for 1, 3, and 6 months follow‐up. |
| Adverse events Follow‐up: end of study | See comments | See comments | 22 | ⊕⊝⊝⊝ | Roberts 2007 reported 1/11 participants experienced plug displacement in the plug group, while 1/11 participants experienced a burning sensation in the cyclosporine group. |
| *The basis for the assumed risk is the control group risk across studies. The corresponding risk (and its 95% confidence interval) is based on the assumed risk in the comparison group and the relative effect of the intervention (and its 95% CI). | |||||
| GRADE Working Group grades of evidence | |||||
| aDowngraded one level for imprecision of results (wide confidence intervals). bDowngraded two levels for high risk of detection, performance, attrition, and other bias. *We defined long‐term follow‐up as between two months and one year. | |||||
| Punctal plugs compared with oral pilocarpine for dry eye syndrome | ||||||
| Patient or population: adults with dry eye syndrome Settings: eye clinics Intervention: punctal plugs Comparison: oral pilocarpine | ||||||
| Outcomes | Illustrative comparative risks* (95% CI) | Relative effect | No of eyes | Certainty of the evidence | Comments | |
| Assumed risk | Corresponding risk | |||||
| Oral pilocarpine | Punctal plugs | |||||
| Symptomatic improvement Follow‐up: 3 months The study investigators defined improvements in subjective ocular symptoms as an improvement of >55 mm for responses to the eye questionnaire on a 100 mm visual analog scale. A RR less than one favors punctal plugs. | 897 per 1000 | 619 per 1000 (439 to 852) | RR 0.69 (0.49 to 0.95) | 55 | ⊕⊝⊝⊝ | ‐ |
| Ocular surface staining Follow‐up: 3 months A higher value is less advantageous Range: van Bijsterveld schema, which is on a scale of 0 to 9 points | The mean change in Rose Bengal staining score was 1.00 lower (better) than baseline in the right eye | MD 0.10 higher (worse) than oral pilocarpine group (0.56 lower (better) to 0.76 higher (worse) than oral pilocarpine group) | — | 55 | ⊕⊝⊝⊝ | — |
| The mean change in Rose Bengal staining score was 1.10 lower (better) than baseline in the left eye | MD 0.60 higher (worse) than oral pilocarpine group (0.10 to 1.10 higher (worse) than oral pilocarpine group) | — | 55 | ⊕⊝⊝⊝ | — | |
| Aqueous tear production Follow‐up: 3 months A higher value more advantageous | The mean change in aqueous tear production was 0.30 mm/5 min higher (better) than baseline in the right eye | MD 0.10 mm/5 min lower (worse) than oral pilocarpine group (0.53 mm/5 min lower (worse) to 0.33 mm/5 min higher (better) than oral pilocarpine group) | — | 55 | ⊕⊝⊝⊝ | — |
| The mean change in aqueous tear production was 1.2 mm/5 min higher (better) than baseline in the left eye | MD 0.50 mm/5 min lower (worse) than oral pilocarpine group (1.06 mm/5 min lower (worse) to 0.06 mm/5 min higher (better) than oral pilocarpine group) | — | 55 | — | ||
| Tear film stability | Study investigators did not report this outcome. | |||||
| Artificial tear use | Study investigators did not report this outcome. | |||||
| Adverse events Follow‐up: 3 months | See comments | See comments | — | 55 | ⊕⊝⊝⊝ | Tsifetaki 2003 reported: "commonly reported adverse events were headache, increased sweating,nausea, and vomiting in the pilocarpine group, while 1 patient in the inferior puncta occlusion group had blepharitis and was withdrawn from the study." pg 1204 |
| *The basis for the assumed risk is the control group risk across studies. The corresponding risk (and its 95% confidence interval) is based on the assumed risk in the comparison group and the relative effect of the intervention (and its 95% CI). | ||||||
| GRADE Working Group grades of evidence | ||||||
| aDowngraded two levels for high risk of performance and detection bias as the participant and outcome assessors were not masked to the treatment groups and the self‐reported symptomatic improvement might be biased. *We defined long‐term follow‐up as between two months and one year. | ||||||
| Punctal plugs compared with artificial tears for dry eye syndrome | ||||||
| Patient or population: adults with dry eye syndrome Settings: eye clinics Intervention: punctal plugs Comparison: artificial tears | ||||||
| Outcomes | Illustrative comparative risks* (95% CI) | Relative effect | No of eyes | Certainty of the evidence | Comments | |
| Assumed risk | Corresponding risk | |||||
| Artificial tears | Punctal plugs | |||||
| Symptomatic improvement Follow‐up: 3 months The study investigators defined improvements in subjective ocular symptoms as an improvement of >55 mm for responses to the eye questionnaire on a 100 mm visual analog scale. A RR greater than one favors punctal plugs. Both studies used different symptomatic improvement score; one study used the Ocular Surface Disease Index that ranged from 0 points = never to 4 points = all the time. The second study use the sum of scores for dryness, foreign body sensation, and visual fatigue; each score had a different range, but a higher score corresponded to more symptoms. | 286 per 1000 | 654 per 1000 (343 to 1000) | RR 2.29 (1.2 to 4.38) | 54 (1 RCT) | ⊕⊝⊝⊝ | — |
| The mean symptomatic improvement score ranged from 15.9 to 26.92 | SMD 0.88 lower (better) than artificial tears group (1.24 to 0.51 lower (better) than artificial tears group) | — | 130 (2 RCTs) | — | ||
| Ocular surface staining Follow‐up: 3 months Range: 0 = absent; 1 = trace; 2 = mild; 3 = moderate; 4 = severe A higher value is worse | The mean change in Rose Bengal staining score was 1.0 point lower (better) than baseline in the right eye | MD 0.10 points higher (worse) than artificial tears group (0.56 lower (better) to 0.76 higher (worse) than artificial tears group) | — | 55 | ⊕⊕⊝⊝ | — |
| The mean change in Rose Bengal staining score was 1.1 lower (better) than baseline in the left eye | MD 0.60 points higher (worse) than artificial tears group (0.10 to 1.10 higher (worse) than artificial tears group) | — | 55 | — | ||
| Aqueous tear production Follow‐up: long‐term* A higher value is more advantageous | The mean change in aqueous tear production was 0.2 mm/5 min higher (better) than baseline in the right eye | MD 0.00 mm/5 min higher (better) than artificial tears group (0.33 mm/5 min lower (worst) to 0.33 mm/5 min higher (better) than artificial tears group) | — | 54 | ⊕⊕⊝⊝ | — |
| The mean change in aqueous tear production was 0.6 mm/5 min higher (better) than baseline in the left eye | MD 0.10 mm/5 min higher (better) than artificial tears group (0.35 mm/5 min lower (worst) to 0.55 mm/5 min higher (better) than artificial tears group) | — | 54 | — | ||
| The mean aqueous tear production ranged from 4.89 to 8.95 mm/ 5 min | MD 2.16 mm/ 5 min higher (better) (1.41 to 2.90 mm/ 5 min higher (better) than artificial tears group) | — | 130 (2 RCTs) | — | ||
| Tear film stability Follow‐up: long‐term* A higher value is more advantageous | The mean tear film stability ranged from 3.24 to 6 seconds | MD 1.02 seconds longer (better) than artificial tears group (0.60 to 1.44 seconds longer (better) than artificial tears group) | — | 130 | ⊕⊕⊕⊝ | — |
| Artificial tear use | Outcome not relevant to this comparison | |||||
| Adverse events (punctate epithelial keratopathy) Follow‐up: end of study | 375 per 1000 | 499 per 1000 (214 to 1000) | RR 1.33 (0.57 to 3.12) | 54 | ⊕⊕⊝⊝ | Tsifetaki 2003 reported: "four patients had mild headache, of whom three also presented with nausea, vomiting, and sweating" (p 1205) and "one patient in the inferior puncta occlusion group had blepharitis and was withdrawn from the study" (p 1204) |
| *The basis for the assumed risk is the control group risk across studies. The corresponding risk (and its 95% confidence interval) is based on the assumed risk in the comparison group and the relative effect of the intervention (and its 95% CI). | ||||||
| GRADE Working Group grades of evidence | ||||||
| aDowngraded two levels for high risk of performance and detection bias as participants and outcome assessors were unmasked to the assigned treatment group and might influence the self‐reported symptomatic improvement. *We defined long‐term follow‐up as between two months and one year. | ||||||
| Punctal plugs occluded in the upper puncta compared with the lower puncta for dry eye syndrome | ||||||
| Patient or population: adults with dry eye syndrome Settings: eye clinics Intervention: punctal plugs occluded in the upper puncta Comparison: punctal plugs occluded in the lower puncta | ||||||
| Outcomes | Illustrative comparative risks* (95% CI) | Relative effect | No of eyes | Certainty of the evidence | Comments | |
| Assumed risk | Corresponding risk | |||||
| Lower puncta | Upper puncta | |||||
| Symptomatic improvement Follow‐up: long‐term* | Study investigators did not report this outcome. | |||||
| Ocular surface staining Follow‐up: long‐term* | Study investigators did not report this outcome. | |||||
| Aqueous tear production Follow‐up: long‐term* | Study investigators did not report this outcome. | |||||
| Tear film stability Follow‐up: long‐term* | Study investigators did not report this outcome. | |||||
| Artificial tear use | Study investigators did not report this outcome. | |||||
| Adverse events | See comments | See comments | See comments | 40 | ⊕⊝⊝⊝ | Chen 2010 reported "no complication was observed in dry eye patients or control subjects during the period of this study." It is unclear which complications were collected. |
| *The basis for the assumed risk is the control group risk across studies. The corresponding risk (and its 95% confidence interval) is based on the assumed risk in the comparison group and the relative effect of the intervention (and its 95% CI). | ||||||
| GRADE Working Group grades of evidence | ||||||
| aDowngraded one level for potential bias as there was unclear risk of selection, performance, detection, attrition, and reporting bias. *We defined long‐term follow‐up as between two months and one year. | ||||||
| Acrylic punctal plugs compared with silicone punctal plugs for dry eye syndrome | ||||||
| Patient or population: mostly women with dry eye syndrome Settings: eye clinics Intervention: acrylic punctal plugs Comparison: silicone punctal plugs | ||||||
| Outcomes | Illustrative comparative risks* (95% CI) | Relative effect | No of eyes | Certainty of the evidence | Comments | |
| Assumed risk | Corresponding risk | |||||
| Silicone punctal plugs | Acrylic punctal plugs | |||||
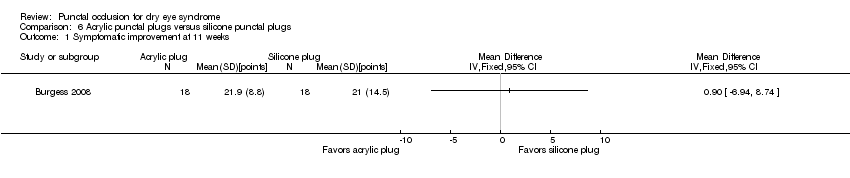
| Symptomatic improvement Follow‐up: 11 weeks Range: 0 to 70 points A visual analog scales 10 cm in length for seven symptoms: dryness, grittiness, foreign body sensation, pain, stinging, burning, and itching was used. A lower score favors acrylic punctal plugs | The mean symptomatic improvement score was 21.9 points | MD 0.90 points higher than silicone punctal plug group (6.94 points lower than silicone punctal plug group to 8.74 points higher than silicone punctal plug group) | — | 36 | ⊕⊝⊝⊝ | — |
| Ocular surface staining Follow‐up: 11 weeks A higher value is less advantageous Range: 0 to 3 points | The mean fluorescein staining score was 1.63 points | MD 0.43 points higher (worst) than silicone punctal plug group (1.61 lower (better) than silicone punctal plug group to 2.47 higher (worse) than silicone punctal plug group) | — | 36 | ⊕⊝⊝⊝ | — |
| The mean Rose Bengal staining score was 0.55 points | MD 0.45 points higher (worst) than silicone punctal plug group (0.09 lower (better) than silicone punctal plug group to 0.99 higher (worst) than silicone punctal plug group) | — | — | |||
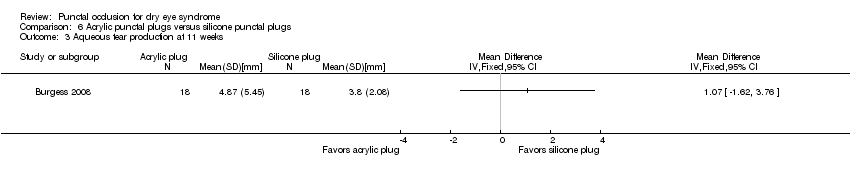
| Aqueous tear production Follow‐up: 11 weeks A higher value is more advantageous | The mean aqueous tear production was 3.8 mm/5 min | MD 1.07 mm/5 min higher than silicone punctal plug group (1.62 lower than silicone punctal plug group to 3.76 higher than silicone punctal plug group) | — | 36 | ⊕⊝⊝⊝ | Authors did not report the time interval in which the Schirmer's test 1 without anesthesia was performed. We assumed it was done over 5 minutes. |
| Tear film stability Follow‐up: 11 weeks A higher value is more advantageous | The mean tear film stability was 3.5 seconds | MD 0.36 seconds longer than silicone punctal plug group (1.22 seconds shorter than silicone punctal plug group to 1.94 longer than silicone punctal plug group) | — | 36 | ⊕⊝⊝⊝ | — |
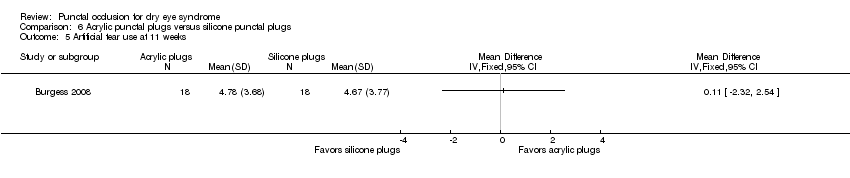
| Artificial tear use Follow‐up: 11 weeks Range: 1‐5 applications Fewer applications favors punctal plugs | The mean number of applications was 4.67 applications | MD 0.11 more applications than silicone punctal plug group (2.32 fewer applications than silicone punctal plug group to 2.54 more applications than silicone punctal plug group) | — | 36 | ⊕⊝⊝⊝ | — |
| Adverse events Follow‐up: 11 weeks | See comments | See comments | — | 36 | ⊕⊝⊝⊝ | 1 acrylic punctal plug participant experienced epiphora, 1 silicone punctal plug participant experienced intermittent ocular irritation, and 2 silicone and 1 acrylic punctal plug participants experienced temporary foreign body sensation. |
| *The basis for the assumed risk is the control group risk across studies. The corresponding risk (and its 95% confidence interval) is based on the assumed risk in the comparison group and the relative effect of the intervention (and its 95% CI). | ||||||
| GRADE Working Group grades of evidence | ||||||
| aDowngraded two levels for imprecision of results (wide confidence intervals). bDowngraded one level for risk of bias as selection, attrition and reporting bias were judged to be unclear. *We defined long‐term follow‐up as between two months and one year. | ||||||
| Intracanalicular punctal plugs compared with silicone punctal plugs for dry eye syndrome | ||||||
| Patient or population: adults with dry eye syndrome Settings: eye clinics Intervention: intracanalicular punctal plugs Comparison: silicone punctal plugs | ||||||
| Outcomes | Illustrative comparative risks* (95% CI) | Relative effect | No of eyes | Certainty of the evidence | Comments | |
| Assumed risk | Corresponding risk | |||||
| Silicone punctal plugs | Intracanalicular punctal plugs | |||||
| Symptomatic improvement Follow‐up: 3 months Subjective dry eye symptoms for each eye was reported; investigators measured soreness, scratching, grittiness, dryness and/or burning using a 100 mm visual analog scale (VAS; 0 mm = no symptoms, 100 mm = maximum intensity) | The mean symptomatic improvement was 38.5 points | The mean difference in symptomatic improvement was 3.10 points lower (14.97 lower to 8.77 higher) | — | 57 | ⊕⊝⊝⊝ | — |
| Ocular surface staining Follow‐up: 3 months A higher value is less advantageous Range: 0 to 3 points; 0 = no staining and 3 = most intense staining | The mean Rose Bengal staining score was 3.0 | MD 0.20 higher than observation group (0.71 lower to 1.11 higher than silicone punctal plugs group) | — | 57 | ⊕⊝⊝⊝ | — |
| The mean fluorescein staining score was 0.7 points | MD 0.40 points higher than observation group (0.04 lower to 0.84 higher than silicone punctal plugs group) | — | 57 | — | ||
| Aqueous tear production Follow‐up: 3 months | Study investigators did not report this outcome. | |||||
| Tear film stability Follow‐up: 3 months | Study investigators did not report this outcome. | |||||
| Artificial tear use Follow‐up: 3 months Fewer applications favors intracanalicular plugs | The mean artificial tear use was 6.4 | MD 1.30 fewer applications (4.04 fewer to 1.44 more applications) | — | 57 | ⊕⊝⊝⊝ | — |
| Adverse events | Study investigators did not report on adverse events. | |||||
| *The basis for the assumed risk is the control group risk across studies. The corresponding risk (and its 95% confidence interval) is based on the assumed risk in the comparison group and the relative effect of the intervention (and its 95% CI). | ||||||
| GRADE Working Group grades of evidence | ||||||
| aDowngraded two levels for imprecision of results (wide confidence intervals). *We defined long‐term follow‐up as between two months and one year. | ||||||
| Collagen punctal plugs compared with silicone punctal plugs for dry eye syndrome | ||||||
| Patient or population: adults with dry eye syndrome Settings: eye clinics Intervention: collagen punctal plugs Comparison: silicone punctal plugs | ||||||
| Outcomes | Illustrative comparative risks* (95% CI) | Relative effect | No of eyes | Certainty of the evidence | Comments | |
| Assumed risk | Corresponding risk | |||||
| Silicone punctal plugs | Collagen punctal plugs | |||||
| Symptomatic improvement Follow‐up: 3 months The Canadian Dry Eye Assessment range from 0 to 48 points; where less than 5 points was normal, 5 to 15 points was mild, 20 to 25 points was moderate, 30 to 48 points was severe. | The mean symptomatic improvement score was 0.25 points | MD 0.81 higher than silicone punctal group (2.94 lower to 4.56 higher than silicone punctal group) | — | 50 (1 RCT) | ⊕⊝⊝⊝ | — |
| Ocular surface staining Follow‐up: 3 months Range: 0 to 15 points A higher value is less advantageous | The mean fluorescein stain score was 2.00 | MD 0.76 lower than silicone punctal group (18.5 lower to 17.0 higher than silicone punctal group) | — | 50 (1 RCT) | ⊕⊝⊝⊝ | — |
| Aqueous tear production Follow‐up: 3 months A higher value is more advantageous | The mean aqueous tear production was 16.89 mm/5 min | MD 0.67 mm/5 min higher than silicone punctal group (17.28 lower to 18.62 higher than silicone punctal group) | — | 50 (1 RCT) | ⊕⊝⊝⊝ | Authors did not report the time interval in which the Schirmer's test 1 without anesthesia was performed. We assumed it was done over 5 minutes. |
| Tear film stability Follow‐up: 3 months A higher value is more advantageous | The mean tear film stability was 4.67 seconds | MD 0.21 seconds higher than silicone punctal group | — | 50 (1 RCT) | ⊕⊝⊝⊝ | — |
| Artificial tear use Follow‐up: 3 months Fewer applications favors collagen punctal plugs | The mean number of artificial tear applications was 1.34 applications | MD 0.06 fewer applications (0.23 fewer to 0.12 more applications than silicone punctal group) | — | 50 (1 RCT) | ⊕⊕⊝⊝ | — |
| Adverse events Follow‐up: end of study | See comments | See comments | See comments | 98 (2 RCT) | ⊕⊝⊝⊝ | Both studies reported that none of the participants developed adverse events or complications related to punctal plugs. |
| *The basis for the assumed risk is the control group risk across studies. The corresponding risk (and its 95% confidence interval) is based on the assumed risk in the comparison group and the relative effect of the intervention (and its 95% CI). | ||||||
| GRADE Working Group grades of evidence | ||||||
| aDowngraded two levels for imprecision of results as the confidence interval was wide and clinically not important. bDowngraded one level for risk of bias as risk of bias as we judged selection, performance, detection, attrition, and reporting bias to be unclear. *We defined long‐term follow‐up as between two months and one year. | ||||||
| 1. Punctal plugs versus observation. | ||
| Collagen intracanalicular plugs were inserted in the upper and lower puncta | Sham treatment | |
| Silicone punctal plugs | No occlusion | |
| Collagen plus silicone punctal plugs | Sham treatment | |
| Bilateral collagen punctal plugs in the lower lids + cyclosporine eye drops to both eyes twice daily | Cyclosporine ophthalmic emulsion 0.05% | |
| Silicone punctal plugs in the upper and lower puncta | Sham treatment | |
| Silicone punctal plugs | Observation | |
| 2. Punctal plugs versus cyclosporine. | ||
| Bilateral collagen punctal plugs in the lower lids only | Cyclosporine ophthalmic emulsion 0.05% | |
| 3. Punctal plugs versus oral pilocarpine. | ||
| Collagen punctal plugs | Oral pilocarpine | |
| 4. Punctal plugs versus artificial tears. | ||
| Collagen punctal plugs | Artificial tears | |
| Acrylic punctal plugs | Artificial tears | |
| Acrylic punctal plugs | Artificial tears | |
| Collagen punctal plugs | Artificial tears | |
| Thermal Memory hydrophobic acrylic polymer rigid rod punctal plug | Artificial tears | |
| 5. Punctal plugs in the lower puncta versus the upper puncta. | ||
| Collagen punctal plugs in the lower puncta | Collagen punctal plugs in the upper puncta | |
| Collagen punctal plugs in the lower puncta | Collagen punctal plugs in the lower and upper puncta | |
| Silcone punctal plugs in the lower puncta | Silcone punctal plugs in the upper puncta | |
| 6. Acrylic punctal plugs versus silicone punctal plugs. | ||
| Acrylic punctal plugs | Silicone punctal plugs | |
| 7. Intracanalicular plugs versus Silicone punctal plugs. | ||
| Intracanicular | Silicone punctal plugs | |
| 8. Collagen punctal plugs versus silicone punctal plugs. | ||
| Collagen punctal plugs | Silicone punctal plugs | |
| Collagen punctal plugs were inserted in the lower punctum | Silicone punctal plugs were inserted in the lower punctum | |
| Excluded comparisons | ||
| Artificial tears | Oral pilocarpine | |
| Outcome or subgroup title | No. of studies | No. of participants | Statistical method | Effect size |
| 1 Symptomatic improvement at 1 month Show forest plot | 3 | Mean Difference (IV, Fixed, 95% CI) | Totals not selected | |
| 2 Symptomatic improvement (long‐term) Show forest plot | 2 | Mean Difference (IV, Fixed, 95% CI) | Totals not selected | |
| 3 Ocular surface staining at 2 weeks Show forest plot | 1 | Mean Difference (IV, Fixed, 95% CI) | Totals not selected | |
| 4 Ocular surface staining at 1 month Show forest plot | 1 | Mean Difference (IV, Fixed, 95% CI) | Totals not selected | |
| 5 Ocular surface staining (long‐term) Show forest plot | 1 | Mean Difference (IV, Fixed, 95% CI) | Totals not selected | |
| 6 Tear film stability at 1 month Show forest plot | 1 | Mean Difference (IV, Fixed, 95% CI) | Totals not selected | |
| 7 Tear film stability (long‐term) Show forest plot | 1 | Mean Difference (IV, Fixed, 95% CI) | Totals not selected | |
| 8 Artificial tear use at 2 weeks Show forest plot | 1 | Mean Difference (IV, Fixed, 95% CI) | Totals not selected | |
| 9 Artificial tear use at 1 month Show forest plot | 1 | Mean Difference (IV, Fixed, 95% CI) | Totals not selected | |
| 10 Artificial tear use (long‐term) Show forest plot | 1 | Mean Difference (IV, Fixed, 95% CI) | Totals not selected | |
| Outcome or subgroup title | No. of studies | No. of participants | Statistical method | Effect size |
| 1 Ocular surface staining at 1 month Show forest plot | 1 | Mean Difference (IV, Fixed, 95% CI) | Totals not selected | |
| 2 Ocular surface staining at 6 months Show forest plot | 1 | Mean Difference (IV, Fixed, 95% CI) | Totals not selected | |
| 3 Aqueous tear production at 1 month Show forest plot | 1 | Mean Difference (IV, Fixed, 95% CI) | Totals not selected | |
| 4 Aqueous tear production at 6 months Show forest plot | 1 | Mean Difference (IV, Fixed, 95% CI) | Totals not selected | |
| 5 Artificial tear use at 1 month Show forest plot | 1 | Mean Difference (IV, Fixed, 95% CI) | Totals not selected | |
| 6 Artificial tear use at 6 months Show forest plot | 1 | Mean Difference (IV, Fixed, 95% CI) | Totals not selected | |
| Outcome or subgroup title | No. of studies | No. of participants | Statistical method | Effect size |
| 1 Symptomatic improvement at 3 months Show forest plot | 1 | Risk Ratio (M‐H, Fixed, 95% CI) | Totals not selected | |
| 2 Ocular surface staining Show forest plot | 1 | Mean Difference (IV, Fixed, 95% CI) | Totals not selected | |
| 2.1 Right eye | 1 | Mean Difference (IV, Fixed, 95% CI) | 0.0 [0.0, 0.0] | |
| 2.2 Left eye | 1 | Mean Difference (IV, Fixed, 95% CI) | 0.0 [0.0, 0.0] | |
| 3 Aqueous tear production Show forest plot | 1 | Mean Difference (IV, Fixed, 95% CI) | Totals not selected | |
| 3.1 Right eye | 1 | Mean Difference (IV, Fixed, 95% CI) | 0.0 [0.0, 0.0] | |
| 3.2 Left eye | 1 | Mean Difference (IV, Fixed, 95% CI) | 0.0 [0.0, 0.0] | |
| Outcome or subgroup title | No. of studies | No. of participants | Statistical method | Effect size |
| 1 Symptomatic improvement at 2 weeks Show forest plot | 1 | Mean Difference (IV, Fixed, 95% CI) | Totals not selected | |
| 2 Symptomatic improvement at 3 months Show forest plot | 1 | Risk Ratio (M‐H, Fixed, 95% CI) | Totals not selected | |
| 3 Symptomatic improvement at 3 months Show forest plot | 2 | 130 | Mean Difference (IV, Fixed, 95% CI) | ‐4.20 [‐5.87, ‐2.53] |
| 4 Ocular surface staining at 2 weeks Show forest plot | 1 | Mean Difference (IV, Fixed, 95% CI) | Totals not selected | |
| 5 Ocular surface staining at 3 months (Rose Bengal) Show forest plot | 1 | Mean Difference (IV, Fixed, 95% CI) | Totals not selected | |
| 5.1 Right eye | 1 | Mean Difference (IV, Fixed, 95% CI) | 0.0 [0.0, 0.0] | |
| 5.2 Left eye | 1 | Mean Difference (IV, Fixed, 95% CI) | 0.0 [0.0, 0.0] | |
| 6 Ocular surface staining at 3 months (fluorescein) Show forest plot | 1 | Mean Difference (IV, Fixed, 95% CI) | Totals not selected | |
| 7 Aqueous tear production at 2 weeks Show forest plot | 2 | 82 | Mean Difference (IV, Fixed, 95% CI) | 0.83 [‐1.05, 2.71] |
| 8 Aqueous tear production at 3 months Show forest plot | 1 | Mean Difference (IV, Fixed, 95% CI) | Totals not selected | |
| 8.1 Right | 1 | Mean Difference (IV, Fixed, 95% CI) | 0.0 [0.0, 0.0] | |
| 8.2 Left | 1 | Mean Difference (IV, Fixed, 95% CI) | 0.0 [0.0, 0.0] | |
| 9 Aqueous tear production at 3 months Show forest plot | 2 | 130 | Mean Difference (IV, Fixed, 95% CI) | 2.16 [1.41, 2.90] |
| 10 Tear film stability at 2 weeks Show forest plot | 2 | 82 | Mean Difference (IV, Fixed, 95% CI) | 0.26 [‐0.57, 1.09] |
| 11 Tear film stability at 3 months Show forest plot | 2 | 130 | Mean Difference (IV, Fixed, 95% CI) | 1.02 [0.60, 1.44] |
| 12 Punctate epithelial keratopathy Show forest plot | 1 | Risk Ratio (M‐H, Fixed, 95% CI) | Totals not selected | |
| Outcome or subgroup title | No. of studies | No. of participants | Statistical method | Effect size |
| 1 Symptomatic improvement at 1 month Show forest plot | 1 | Risk Ratio (M‐H, Fixed, 95% CI) | Totals not selected | |
| 2 Aqueous tear production at 1 month Show forest plot | 1 | Mean Difference (IV, Fixed, 95% CI) | Totals not selected | |
| 3 Tear film stability at 1 month Show forest plot | 1 | Mean Difference (IV, Fixed, 95% CI) | Totals not selected | |
| Outcome or subgroup title | No. of studies | No. of participants | Statistical method | Effect size |
| 1 Symptomatic improvement at 11 weeks Show forest plot | 1 | Mean Difference (IV, Fixed, 95% CI) | Totals not selected | |
| 2 Ocular surface staining at 11 weeks Show forest plot | 1 | Mean Difference (IV, Fixed, 95% CI) | Totals not selected | |
| 2.1 Rose Bengal | 1 | Mean Difference (IV, Fixed, 95% CI) | 0.0 [0.0, 0.0] | |
| 2.2 Fluorescein | 1 | Mean Difference (IV, Fixed, 95% CI) | 0.0 [0.0, 0.0] | |
| 3 Aqueous tear production at 11 weeks Show forest plot | 1 | Mean Difference (IV, Fixed, 95% CI) | Totals not selected | |
| 4 Tear film stability at 11 weeks Show forest plot | 1 | Mean Difference (IV, Fixed, 95% CI) | Totals not selected | |
| 5 Artificial tear use at 11 weeks Show forest plot | 1 | Mean Difference (IV, Fixed, 95% CI) | Totals not selected | |
| Outcome or subgroup title | No. of studies | No. of participants | Statistical method | Effect size |
| 1 Symptomatic improvement (long‐term) Show forest plot | 1 | Mean Difference (IV, Fixed, 95% CI) | Totals not selected | |
| 2 Ocular surface staining (long‐term) Show forest plot | 1 | Mean Difference (IV, Fixed, 95% CI) | Totals not selected | |
| 2.1 Rose Bengal | 1 | Mean Difference (IV, Fixed, 95% CI) | 0.0 [0.0, 0.0] | |
| 2.2 Fluorescein | 1 | Mean Difference (IV, Fixed, 95% CI) | 0.0 [0.0, 0.0] | |
| 3 Aqueous tear production (long‐term) Show forest plot | 1 | Mean Difference (IV, Fixed, 95% CI) | Totals not selected | |
| 3.1 Schirmer test I without anesthesia | 1 | Mean Difference (IV, Fixed, 95% CI) | 0.0 [0.0, 0.0] | |
| 4 Tear film stability (long‐term) Show forest plot | 1 | Mean Difference (IV, Fixed, 95% CI) | Totals not selected | |
| 5 Artificial tear use (long‐term) Show forest plot | 1 | Mean Difference (IV, Fixed, 95% CI) | Totals not selected | |