Punctal occlusion for dry eye syndrome
Abstract
Background
Dry eye syndrome is a disorder of the tear film that is associated with symptoms of ocular discomfort. Punctal occlusion is a mechanical treatment that blocks the tear drainage system in order to aid in the preservation of natural tears on the ocular surface.
Objectives
To assess the effects of punctal plugs versus no punctal plugs, different types of punctal plugs, and other interventions for managing dry eye.
Search methods
We searched the Cochrane Central Register of Controlled Trials (CENTRAL) (which contains the Cochrane Eyes and Vision Trials Register) (2016, Issue 11), MEDLINE Ovid (1946 to 8 December 2016), Embase.com (1947 to 8 December 2016), PubMed (1948 to 8 December 2016), LILACS (Latin American and Caribbean Health Sciences Literature Database) (1982 to 8 December 2016), the metaRegister of Controlled Trials (mRCT) (www.controlled‐trials.com; last searched 18 November 2012 ‐ this resource is now archived), ClinicalTrials.gov (www.clinicaltrials.gov; searched 8 December 2016), and the WHO International Clinical Trials Registry Platform (ICTRP) (www.who.int/ictrp/search/en; searched 8 December 2016). We did not use any date or language restrictions in the electronic searches for trials. We also searched the Science Citation Index‐Expanded database and reference lists of included studies. The evidence was last updated on 8 December 2016
Selection criteria
We included randomized and quasi‐randomized controlled trials of collagen or silicone punctal plugs in symptomatic participants diagnosed with aqueous tear deficiency or dry eye syndrome.
Data collection and analysis
Two review authors independently assessed trial quality and extracted data. We contacted study investigators for additional information when needed.
Main results
We included 18 trials (711 participants, 1249 eyes) from Austria, Canada, China, Greece, Japan, Mexico, Netherlands, Turkey, the UK, and the USA in this review. We also identified one ongoing trial. Overall we judged these trials to be at unclear risk of bias because they were poorly reported. We assessed the evidence for eight comparisons.
Five trials compared punctal plugs with no punctal plugs (control). Three of these trials employed a sham treatment and two trials observed the control group. Two trials did not report outcome data relevant to this review. There was very low‐certainty evidence on symptomatic improvement. The three trials that reported this outcome used different scales to measure symptoms. In all three trials, there was little or no improvement in symptom scores with punctal plugs compared with no punctal plugs. Low‐certainty evidence from one trial suggested less ocular surface staining in the punctal plug group compared with the no punctal plug group however this difference was small and possibly clinically unimportant (mean difference (MD) in fluorescein staining score ‐1.50 points, 95% CI ‐1.88 to ‐1.12; eyes = 61). Similarly there was a small difference in tear film stability with people in the punctal plug group having more stability (MD 1.93 seconds more, 95% CI 0.67 to 3.20; eyes = 28, low‐certainty evidence). The number of artificial tear applications was lower in the punctal plug group compared with the no punctal plugs group in one trial (MD ‐2.70 applications, 95% CI ‐3.11 to ‐2.29; eyes = 61, low‐certainty evidence). One trial with low‐certainty evidence reported little or no difference between the groups in Schirmer scores, but did not report any quantitative data on aqueous tear production. Very low‐certainty evidence on adverse events suggested that events occurred reasonably frequently in the punctal plug group and included epiphora, itching, tenderness and swelling of lids with mucous discharge, and plug displacement.
One trial compared punctal plugs with cyclosporine (20 eyes) and one trial compared punctal plugs with oral pilocarpine (55 eyes). The evidence was judged to be very low‐certainty due to a combination of risk of bias and imprecision.
Five trials compared punctal plugs with artificial tears. In one of the trials punctal plugs was combined with artificial tears and compared with artificial tears alone. There was very low‐certainty evidence on symptomatic improvement. Low‐certainty evidence of little or no improvement in ocular surface staining comparing punctal plugs with artificial tears (MD right eye 0.10 points higher, 0.56 lower to 0.76 higher, MD left eye 0.60 points higher, 0.10 to 1.10 higher) and low‐certainty evidence of little or no difference in aqueous tear production (MD 0.00 mm/5 min, 0.33 lower to 0.33 higher)
Three trials compared punctal plugs in the upper versus the lower puncta, and none of them reported the review outcomes at long‐term follow‐up. One trial with very low‐certainty evidence reported no observed complications, but it was unclear which complications were collected.
One trial compared acrylic punctal plugs with silicone punctal plugs and the trial reported outcomes at approximately 11 weeks of follow‐up (36 eyes). The evidence was judged to be very low‐certainty due to a combination of risk of bias and imprecision.
One trial compared intracanalicular punctal plugs with silicone punctal plugs at three months follow‐up (57 eyes). The evidence was judged to be very low‐certainty due to a combination of risk of bias and imprecision.
Finally, two trials with very low‐certainty evidence compared collagen punctal plugs versus silicone punctal plugs (98 eyes). The evidence was judged to be very low‐certainty due to a combination of risk of bias and imprecision.
Authors' conclusions
Although the investigators of the individual trials concluded that punctal plugs are an effective means for treating dry eye signs and symptoms, the evidence in this systematic review suggests that improvements in symptoms and commonly tested dry eye signs are inconclusive. Despite the inclusion of 11 additional trials, the findings of this updated review are consistent with the previous review published in 2010. The type of punctal plug investigated, the type and severity of dry eye being treated, and heterogeneity in trial methodology confounds our ability to make decisive statements regarding the effectiveness of punctal plug use. Although punctal plugs are believed to be relatively safe, their use is commonly associated with epiphora and, less commonly, with inflammatory conditions such as dacryocystitis.
PICO
Plain language summary
Punctal plugs for dry eye syndrome
What is the aim of this review?
The aim of this Cochrane Review was to determine whether punctal plugs, which are inserted into the tear ducts to block tear drainage, can treat dry eye syndrome. Cochrane review authors searched for all relevant studies and identified 18 clinical trials.
Key messages
It is unclear whether punctal plugs are effective for treating dry eye syndrome. Punctal plugs may be associated with watery eyes, though the evidence for this finding is weak.
What did we study in this review?
Dry eye is a common, chronic condition that affects millions of people around the world. Dry eye sufferers frequently experience burning, foreign body sensation (something in the eye), and blurry vision, which lead them to seek medical care. The typical first‐line treatment for dry eye is over‐the‐counter artificial tears (eye drops). If these fail to relieve symptoms, persons with dry eyes may receive other treatment. Punctal plugs are one type of advanced dry eye treatment; they work by blocking the tear ducts (puncta) of the upper and lower eyelids. Punctal plugs come in several materials, shapes, and sizes.
What are the main results of the review?
This review included 18 trials with 711 participants (1249 eyes), most of whom were women. The trials took place from March 1998 to May 2014 and included participants from Austria, Canada, China, Greece, Japan, Mexico, Netherlands, Turkey, the UK, and the USA. The 18 trials differed greatly in design; they compared different types of punctal plugs and reported results in different ways.
The evidence from this review suggests that punctal plugs do not conclusively improve dry eye symptoms. No type of punctal plug used in the trials we examined was significantly better than another for relieving symptoms of dry eye. It is still unclear if punctal plugs are better than oral treatment (oral pilocarpine) or eye drops such as cyclosporine or artificial tears.
The evidence from this review suggests that punctal plugs may be associated with watery eyes and sometimes with more serious conditions such as infection or swelling in the tear sac (part of the eye where tears drain).
The conclusions of this updated review are similar to the original review published in 2010, though 11 new trials were included.
How up‐to‐date is this review?
Cochrane review authors searched for trials that were published up to 8 December 2016.
Authors' conclusions
Summary of findings
| Punctal plugs compared with no punctal plugs for dry eye syndrome | ||||||
| Patient or population: adults with dry eye syndrome Settings: eye clinics Intervention: silicone or collagen punctal plugs Comparison: no punctal plugs (observation or sham treatment) | ||||||
| Outcomes | Illustrative comparative risks* (95% CI) | Relative effect | No of participants | Certainty of the evidence | Comments | |
| Assumed risk | Corresponding risk | |||||
| No punctal plugs | Punctal plugs | |||||
| Symptomatic improvement Follow‐up: long‐term* A lower score favors punctal plugs | See comments | See comments | — | 89 (2 RCT) | ⊕⊝⊝⊝ | Mansour 2007 reported little or no difference in Ocular and Oral Symptoms score, which ranged from 0 to 10 points (MD ‐0.46 points, 95% CI ‐1.24 to 0.32; eyes = 26). Nava‐Castaneda 2003 reported a slight decrease in symptom score, assumed to range from 0 to 105 points, but it does not seem to be clinically important (MD ‐2.62 points, 95% CI ‐3.32 to ‐1.93; eyes = 61). Yung 2012 reported little or no difference in dry eye symptom score, ranging from 0 to 3 points (MD ‐0.75 points, 95% CI ‐1.53 to 0.02; eyes = 28) |
| Ocular surface staining Follow‐up: long‐term* A higher value is less advantageous Both Rose Bengal and fluorescein staining scores ranged from 0 to 4, where 0 represented no staining and 4 represented heavy staining | The mean fluorescein staining score was 1.70 | MD 1.50 lower than observation group (1.88 to 1.12 lower (better) than observation group) | — | 61 (1 RCT) | ⊕⊕⊝⊝ | — |
| Aqueous tear production Follow‐up: long‐term* A higher value is more advantageous | See comments | See comments | — | 28 (1 RCT) | ⊕⊕⊝⊝ | Yung 2012 did not provide quantitative data, but reported that "Schirmer values tended to increase in the plug group after plug insertion; however, the changes did not reach significance" |
| Tear film stability Follow‐up: 6 months A higher value is more advantageous | The mean tear film stability was 2.34 seconds | MD 1.93 seconds longer than observation group (0.67 to 3.20 seconds longer (better) than observation group) | — | 28 (1 RCT) | ⊕⊕⊝⊝ | — |
| Artificial tear use Follow‐up: long‐term* Fewer applications favors punctal plugs | The mean number of applications was 3.6 applications | MD 2.70 fewer applications than observation group (3.11 to 2.29 fewer applications than observation group) | — | 61 (1 RCT) | ⊕⊕⊝⊝ | — |
| Adverse events Follow‐up: end of study | See comments | See comments | — | 146 | ⊕⊝⊝⊝ | Slusser 1998: all adverse events occurred in the punctal plug group, reported 23/28 participants had epiphora, 3/28 participants reported itching in area of plug placement, 1/28 participants had tenderness and swelling of lids with mucous discharge. Spontaneous plug loss occurred in 6/20 eyes with silicone punctal plugs in the Mansour 2007. One or 31 participants receiving collagen and silicone punctal plugs experienced epiphora in the Nava‐Castaneda 2003 study. |
| *The basis for the assumed risk is the control group risk across studies. The corresponding risk (and its 95% confidence interval) is based on the assumed risk in the comparison group and the relative effect of the intervention (and its 95% CI). | ||||||
| GRADE Working Group grades of evidence | ||||||
| aDowngraded two levels for methodological heterogeneity. cDowngraded one level for imprecision as indirectness of evidence because the confidence interval was either wide or clinically not important. dDowngraded one level for high risk of attrition bias. eDowngraded two levels for high risk of performance, detection, and attrition bias. fDowngraded two levels for attrition bias. gDowngraded one level for sparse and inconsistent data, particularly with respect to epiphora. *We defined long‐term follow‐up as between two months and one year. | ||||||
| Punctal plugs compared with cyclosporine for dry eye syndrome | |||||
| Patient or population: adults with dry eye syndrome Settings: eye clinics Intervention: punctal plugs Comparison: cyclosporine | |||||
| Outcomes | Illustrative comparative risks* (95% CI) | No of participants | Certainty of the evidence | Comments | |
| Assumed risk | Corresponding risk | ||||
| Cyclosporine | Punctal plugs | ||||
| Symptomatic improvement | Study investigators did not report this outcome at 2 weeks, 1 month, or long‐term. | ||||
| Ocular surface staining Follow‐up: 6 months Any value greater than zero is abnormal Range: 0 to 4 points; 0 = no staining, 1 = staining of the nasal conjunctiva only, 2 = staining of both the nasal and temporal conjunctiva, 3 = peripheral corneal staining, 4 = central corneal staining | See comments | See comments | 20 (1 RCT) | ⊕⊝⊝⊝ | The study investigators of Roberts 2007 stated: "there was greater improvement in conjunctival staining with cyclosporine or the combination than with plugs alone." It was unclear whether Rose Bengal or fluorescein staining was used. Also, the study investigators did not specify the time point and so we assumed that their statement applies for 1, 3, and 6 months follow‐up. |
| Aqueous tear production Follow‐up: 6 months A higher value is more advantageous | The mean change in aqueous tear production was 1.5 mm/3 min lower than baseline | MD 0.80 mm/3 min higher than cyclosporine group (0.74 lower (better) to 2.34 higher (worse) than cyclosporine group) | 20 | ⊕⊝⊝⊝ | The study investigators of Roberts 2007 stated: "There was a greater increase in Schirmer score with plugs, either alone or in combination with cyclosporine." The study investigators did not specify the for which time point and so we assumed that their statement applies for 1, 3, and 6 months follow‐up. |
| Tear film stability Follow‐up: 6 months | Study investigators did not report this outcome at 2 weeks, 1 month, or long‐term. | ||||
| Artificial tear use Follow‐up: 6 months range: 1‐5 applications Fewer applications favors punctal plugs | The mean change in number of applications from baseline was 3.2 more applications than baseline | MD 1.10 applications more than baseline (0.04 fewer to 2.24 more applications than cyclosporine group) | 20 | ⊕⊝⊝⊝ | The study investigators of Roberts 2007 stated: "decreased frequency of artificial tears was greatest for combination therapy and least for punctal plugs." The study investigators did not specify the for which time point and so we assumed that their statement applies for 1, 3, and 6 months follow‐up. |
| Adverse events Follow‐up: end of study | See comments | See comments | 22 | ⊕⊝⊝⊝ | Roberts 2007 reported 1/11 participants experienced plug displacement in the plug group, while 1/11 participants experienced a burning sensation in the cyclosporine group. |
| *The basis for the assumed risk is the control group risk across studies. The corresponding risk (and its 95% confidence interval) is based on the assumed risk in the comparison group and the relative effect of the intervention (and its 95% CI). | |||||
| GRADE Working Group grades of evidence | |||||
| aDowngraded one level for imprecision of results (wide confidence intervals). bDowngraded two levels for high risk of detection, performance, attrition, and other bias. *We defined long‐term follow‐up as between two months and one year. | |||||
| Punctal plugs compared with oral pilocarpine for dry eye syndrome | ||||||
| Patient or population: adults with dry eye syndrome Settings: eye clinics Intervention: punctal plugs Comparison: oral pilocarpine | ||||||
| Outcomes | Illustrative comparative risks* (95% CI) | Relative effect | No of eyes | Certainty of the evidence | Comments | |
| Assumed risk | Corresponding risk | |||||
| Oral pilocarpine | Punctal plugs | |||||
| Symptomatic improvement Follow‐up: 3 months The study investigators defined improvements in subjective ocular symptoms as an improvement of >55 mm for responses to the eye questionnaire on a 100 mm visual analog scale. A RR less than one favors punctal plugs. | 897 per 1000 | 619 per 1000 (439 to 852) | RR 0.69 (0.49 to 0.95) | 55 | ⊕⊝⊝⊝ | ‐ |
| Ocular surface staining Follow‐up: 3 months A higher value is less advantageous Range: van Bijsterveld schema, which is on a scale of 0 to 9 points | The mean change in Rose Bengal staining score was 1.00 lower (better) than baseline in the right eye | MD 0.10 higher (worse) than oral pilocarpine group (0.56 lower (better) to 0.76 higher (worse) than oral pilocarpine group) | — | 55 | ⊕⊝⊝⊝ | — |
| The mean change in Rose Bengal staining score was 1.10 lower (better) than baseline in the left eye | MD 0.60 higher (worse) than oral pilocarpine group (0.10 to 1.10 higher (worse) than oral pilocarpine group) | — | 55 | ⊕⊝⊝⊝ | — | |
| Aqueous tear production Follow‐up: 3 months A higher value more advantageous | The mean change in aqueous tear production was 0.30 mm/5 min higher (better) than baseline in the right eye | MD 0.10 mm/5 min lower (worse) than oral pilocarpine group (0.53 mm/5 min lower (worse) to 0.33 mm/5 min higher (better) than oral pilocarpine group) | — | 55 | ⊕⊝⊝⊝ | — |
| The mean change in aqueous tear production was 1.2 mm/5 min higher (better) than baseline in the left eye | MD 0.50 mm/5 min lower (worse) than oral pilocarpine group (1.06 mm/5 min lower (worse) to 0.06 mm/5 min higher (better) than oral pilocarpine group) | — | 55 | — | ||
| Tear film stability | Study investigators did not report this outcome. | |||||
| Artificial tear use | Study investigators did not report this outcome. | |||||
| Adverse events Follow‐up: 3 months | See comments | See comments | — | 55 | ⊕⊝⊝⊝ | Tsifetaki 2003 reported: "commonly reported adverse events were headache, increased sweating,nausea, and vomiting in the pilocarpine group, while 1 patient in the inferior puncta occlusion group had blepharitis and was withdrawn from the study." pg 1204 |
| *The basis for the assumed risk is the control group risk across studies. The corresponding risk (and its 95% confidence interval) is based on the assumed risk in the comparison group and the relative effect of the intervention (and its 95% CI). | ||||||
| GRADE Working Group grades of evidence | ||||||
| aDowngraded two levels for high risk of performance and detection bias as the participant and outcome assessors were not masked to the treatment groups and the self‐reported symptomatic improvement might be biased. *We defined long‐term follow‐up as between two months and one year. | ||||||
| Punctal plugs compared with artificial tears for dry eye syndrome | ||||||
| Patient or population: adults with dry eye syndrome Settings: eye clinics Intervention: punctal plugs Comparison: artificial tears | ||||||
| Outcomes | Illustrative comparative risks* (95% CI) | Relative effect | No of eyes | Certainty of the evidence | Comments | |
| Assumed risk | Corresponding risk | |||||
| Artificial tears | Punctal plugs | |||||
| Symptomatic improvement Follow‐up: 3 months The study investigators defined improvements in subjective ocular symptoms as an improvement of >55 mm for responses to the eye questionnaire on a 100 mm visual analog scale. A RR greater than one favors punctal plugs. Both studies used different symptomatic improvement score; one study used the Ocular Surface Disease Index that ranged from 0 points = never to 4 points = all the time. The second study use the sum of scores for dryness, foreign body sensation, and visual fatigue; each score had a different range, but a higher score corresponded to more symptoms. | 286 per 1000 | 654 per 1000 (343 to 1000) | RR 2.29 (1.2 to 4.38) | 54 (1 RCT) | ⊕⊝⊝⊝ | — |
| The mean symptomatic improvement score ranged from 15.9 to 26.92 | SMD 0.88 lower (better) than artificial tears group (1.24 to 0.51 lower (better) than artificial tears group) | — | 130 (2 RCTs) | — | ||
| Ocular surface staining Follow‐up: 3 months Range: 0 = absent; 1 = trace; 2 = mild; 3 = moderate; 4 = severe A higher value is worse | The mean change in Rose Bengal staining score was 1.0 point lower (better) than baseline in the right eye | MD 0.10 points higher (worse) than artificial tears group (0.56 lower (better) to 0.76 higher (worse) than artificial tears group) | — | 55 | ⊕⊕⊝⊝ | — |
| The mean change in Rose Bengal staining score was 1.1 lower (better) than baseline in the left eye | MD 0.60 points higher (worse) than artificial tears group (0.10 to 1.10 higher (worse) than artificial tears group) | — | 55 | — | ||
| Aqueous tear production Follow‐up: long‐term* A higher value is more advantageous | The mean change in aqueous tear production was 0.2 mm/5 min higher (better) than baseline in the right eye | MD 0.00 mm/5 min higher (better) than artificial tears group (0.33 mm/5 min lower (worst) to 0.33 mm/5 min higher (better) than artificial tears group) | — | 54 | ⊕⊕⊝⊝ | — |
| The mean change in aqueous tear production was 0.6 mm/5 min higher (better) than baseline in the left eye | MD 0.10 mm/5 min higher (better) than artificial tears group (0.35 mm/5 min lower (worst) to 0.55 mm/5 min higher (better) than artificial tears group) | — | 54 | — | ||
| The mean aqueous tear production ranged from 4.89 to 8.95 mm/ 5 min | MD 2.16 mm/ 5 min higher (better) (1.41 to 2.90 mm/ 5 min higher (better) than artificial tears group) | — | 130 (2 RCTs) | — | ||
| Tear film stability Follow‐up: long‐term* A higher value is more advantageous | The mean tear film stability ranged from 3.24 to 6 seconds | MD 1.02 seconds longer (better) than artificial tears group (0.60 to 1.44 seconds longer (better) than artificial tears group) | — | 130 | ⊕⊕⊕⊝ | — |
| Artificial tear use | Outcome not relevant to this comparison | |||||
| Adverse events (punctate epithelial keratopathy) Follow‐up: end of study | 375 per 1000 | 499 per 1000 (214 to 1000) | RR 1.33 (0.57 to 3.12) | 54 | ⊕⊕⊝⊝ | Tsifetaki 2003 reported: "four patients had mild headache, of whom three also presented with nausea, vomiting, and sweating" (p 1205) and "one patient in the inferior puncta occlusion group had blepharitis and was withdrawn from the study" (p 1204) |
| *The basis for the assumed risk is the control group risk across studies. The corresponding risk (and its 95% confidence interval) is based on the assumed risk in the comparison group and the relative effect of the intervention (and its 95% CI). | ||||||
| GRADE Working Group grades of evidence | ||||||
| aDowngraded two levels for high risk of performance and detection bias as participants and outcome assessors were unmasked to the assigned treatment group and might influence the self‐reported symptomatic improvement. *We defined long‐term follow‐up as between two months and one year. | ||||||
| Punctal plugs occluded in the upper puncta compared with the lower puncta for dry eye syndrome | ||||||
| Patient or population: adults with dry eye syndrome Settings: eye clinics Intervention: punctal plugs occluded in the upper puncta Comparison: punctal plugs occluded in the lower puncta | ||||||
| Outcomes | Illustrative comparative risks* (95% CI) | Relative effect | No of eyes | Certainty of the evidence | Comments | |
| Assumed risk | Corresponding risk | |||||
| Lower puncta | Upper puncta | |||||
| Symptomatic improvement Follow‐up: long‐term* | Study investigators did not report this outcome. | |||||
| Ocular surface staining Follow‐up: long‐term* | Study investigators did not report this outcome. | |||||
| Aqueous tear production Follow‐up: long‐term* | Study investigators did not report this outcome. | |||||
| Tear film stability Follow‐up: long‐term* | Study investigators did not report this outcome. | |||||
| Artificial tear use | Study investigators did not report this outcome. | |||||
| Adverse events | See comments | See comments | See comments | 40 | ⊕⊝⊝⊝ | Chen 2010 reported "no complication was observed in dry eye patients or control subjects during the period of this study." It is unclear which complications were collected. |
| *The basis for the assumed risk is the control group risk across studies. The corresponding risk (and its 95% confidence interval) is based on the assumed risk in the comparison group and the relative effect of the intervention (and its 95% CI). | ||||||
| GRADE Working Group grades of evidence | ||||||
| aDowngraded one level for potential bias as there was unclear risk of selection, performance, detection, attrition, and reporting bias. *We defined long‐term follow‐up as between two months and one year. | ||||||
| Acrylic punctal plugs compared with silicone punctal plugs for dry eye syndrome | ||||||
| Patient or population: mostly women with dry eye syndrome Settings: eye clinics Intervention: acrylic punctal plugs Comparison: silicone punctal plugs | ||||||
| Outcomes | Illustrative comparative risks* (95% CI) | Relative effect | No of eyes | Certainty of the evidence | Comments | |
| Assumed risk | Corresponding risk | |||||
| Silicone punctal plugs | Acrylic punctal plugs | |||||
| Symptomatic improvement Follow‐up: 11 weeks Range: 0 to 70 points A visual analog scales 10 cm in length for seven symptoms: dryness, grittiness, foreign body sensation, pain, stinging, burning, and itching was used. A lower score favors acrylic punctal plugs | The mean symptomatic improvement score was 21.9 points | MD 0.90 points higher than silicone punctal plug group (6.94 points lower than silicone punctal plug group to 8.74 points higher than silicone punctal plug group) | — | 36 | ⊕⊝⊝⊝ | — |
| Ocular surface staining Follow‐up: 11 weeks A higher value is less advantageous Range: 0 to 3 points | The mean fluorescein staining score was 1.63 points | MD 0.43 points higher (worst) than silicone punctal plug group (1.61 lower (better) than silicone punctal plug group to 2.47 higher (worse) than silicone punctal plug group) | — | 36 | ⊕⊝⊝⊝ | — |
| The mean Rose Bengal staining score was 0.55 points | MD 0.45 points higher (worst) than silicone punctal plug group (0.09 lower (better) than silicone punctal plug group to 0.99 higher (worst) than silicone punctal plug group) | — | — | |||
| Aqueous tear production Follow‐up: 11 weeks A higher value is more advantageous | The mean aqueous tear production was 3.8 mm/5 min | MD 1.07 mm/5 min higher than silicone punctal plug group (1.62 lower than silicone punctal plug group to 3.76 higher than silicone punctal plug group) | — | 36 | ⊕⊝⊝⊝ | Authors did not report the time interval in which the Schirmer's test 1 without anesthesia was performed. We assumed it was done over 5 minutes. |
| Tear film stability Follow‐up: 11 weeks A higher value is more advantageous | The mean tear film stability was 3.5 seconds | MD 0.36 seconds longer than silicone punctal plug group (1.22 seconds shorter than silicone punctal plug group to 1.94 longer than silicone punctal plug group) | — | 36 | ⊕⊝⊝⊝ | — |
| Artificial tear use Follow‐up: 11 weeks Range: 1‐5 applications Fewer applications favors punctal plugs | The mean number of applications was 4.67 applications | MD 0.11 more applications than silicone punctal plug group (2.32 fewer applications than silicone punctal plug group to 2.54 more applications than silicone punctal plug group) | — | 36 | ⊕⊝⊝⊝ | — |
| Adverse events Follow‐up: 11 weeks | See comments | See comments | — | 36 | ⊕⊝⊝⊝ | 1 acrylic punctal plug participant experienced epiphora, 1 silicone punctal plug participant experienced intermittent ocular irritation, and 2 silicone and 1 acrylic punctal plug participants experienced temporary foreign body sensation. |
| *The basis for the assumed risk is the control group risk across studies. The corresponding risk (and its 95% confidence interval) is based on the assumed risk in the comparison group and the relative effect of the intervention (and its 95% CI). | ||||||
| GRADE Working Group grades of evidence | ||||||
| aDowngraded two levels for imprecision of results (wide confidence intervals). bDowngraded one level for risk of bias as selection, attrition and reporting bias were judged to be unclear. *We defined long‐term follow‐up as between two months and one year. | ||||||
| Intracanalicular punctal plugs compared with silicone punctal plugs for dry eye syndrome | ||||||
| Patient or population: adults with dry eye syndrome Settings: eye clinics Intervention: intracanalicular punctal plugs Comparison: silicone punctal plugs | ||||||
| Outcomes | Illustrative comparative risks* (95% CI) | Relative effect | No of eyes | Certainty of the evidence | Comments | |
| Assumed risk | Corresponding risk | |||||
| Silicone punctal plugs | Intracanalicular punctal plugs | |||||
| Symptomatic improvement Follow‐up: 3 months Subjective dry eye symptoms for each eye was reported; investigators measured soreness, scratching, grittiness, dryness and/or burning using a 100 mm visual analog scale (VAS; 0 mm = no symptoms, 100 mm = maximum intensity) | The mean symptomatic improvement was 38.5 points | The mean difference in symptomatic improvement was 3.10 points lower (14.97 lower to 8.77 higher) | — | 57 | ⊕⊝⊝⊝ | — |
| Ocular surface staining Follow‐up: 3 months A higher value is less advantageous Range: 0 to 3 points; 0 = no staining and 3 = most intense staining | The mean Rose Bengal staining score was 3.0 | MD 0.20 higher than observation group (0.71 lower to 1.11 higher than silicone punctal plugs group) | — | 57 | ⊕⊝⊝⊝ | — |
| The mean fluorescein staining score was 0.7 points | MD 0.40 points higher than observation group (0.04 lower to 0.84 higher than silicone punctal plugs group) | — | 57 | — | ||
| Aqueous tear production Follow‐up: 3 months | Study investigators did not report this outcome. | |||||
| Tear film stability Follow‐up: 3 months | Study investigators did not report this outcome. | |||||
| Artificial tear use Follow‐up: 3 months Fewer applications favors intracanalicular plugs | The mean artificial tear use was 6.4 | MD 1.30 fewer applications (4.04 fewer to 1.44 more applications) | — | 57 | ⊕⊝⊝⊝ | — |
| Adverse events | Study investigators did not report on adverse events. | |||||
| *The basis for the assumed risk is the control group risk across studies. The corresponding risk (and its 95% confidence interval) is based on the assumed risk in the comparison group and the relative effect of the intervention (and its 95% CI). | ||||||
| GRADE Working Group grades of evidence | ||||||
| aDowngraded two levels for imprecision of results (wide confidence intervals). *We defined long‐term follow‐up as between two months and one year. | ||||||
| Collagen punctal plugs compared with silicone punctal plugs for dry eye syndrome | ||||||
| Patient or population: adults with dry eye syndrome Settings: eye clinics Intervention: collagen punctal plugs Comparison: silicone punctal plugs | ||||||
| Outcomes | Illustrative comparative risks* (95% CI) | Relative effect | No of eyes | Certainty of the evidence | Comments | |
| Assumed risk | Corresponding risk | |||||
| Silicone punctal plugs | Collagen punctal plugs | |||||
| Symptomatic improvement Follow‐up: 3 months The Canadian Dry Eye Assessment range from 0 to 48 points; where less than 5 points was normal, 5 to 15 points was mild, 20 to 25 points was moderate, 30 to 48 points was severe. | The mean symptomatic improvement score was 0.25 points | MD 0.81 higher than silicone punctal group (2.94 lower to 4.56 higher than silicone punctal group) | — | 50 (1 RCT) | ⊕⊝⊝⊝ | — |
| Ocular surface staining Follow‐up: 3 months Range: 0 to 15 points A higher value is less advantageous | The mean fluorescein stain score was 2.00 | MD 0.76 lower than silicone punctal group (18.5 lower to 17.0 higher than silicone punctal group) | — | 50 (1 RCT) | ⊕⊝⊝⊝ | — |
| Aqueous tear production Follow‐up: 3 months A higher value is more advantageous | The mean aqueous tear production was 16.89 mm/5 min | MD 0.67 mm/5 min higher than silicone punctal group (17.28 lower to 18.62 higher than silicone punctal group) | — | 50 (1 RCT) | ⊕⊝⊝⊝ | Authors did not report the time interval in which the Schirmer's test 1 without anesthesia was performed. We assumed it was done over 5 minutes. |
| Tear film stability Follow‐up: 3 months A higher value is more advantageous | The mean tear film stability was 4.67 seconds | MD 0.21 seconds higher than silicone punctal group | — | 50 (1 RCT) | ⊕⊝⊝⊝ | — |
| Artificial tear use Follow‐up: 3 months Fewer applications favors collagen punctal plugs | The mean number of artificial tear applications was 1.34 applications | MD 0.06 fewer applications (0.23 fewer to 0.12 more applications than silicone punctal group) | — | 50 (1 RCT) | ⊕⊕⊝⊝ | — |
| Adverse events Follow‐up: end of study | See comments | See comments | See comments | 98 (2 RCT) | ⊕⊝⊝⊝ | Both studies reported that none of the participants developed adverse events or complications related to punctal plugs. |
| *The basis for the assumed risk is the control group risk across studies. The corresponding risk (and its 95% confidence interval) is based on the assumed risk in the comparison group and the relative effect of the intervention (and its 95% CI). | ||||||
| GRADE Working Group grades of evidence | ||||||
| aDowngraded two levels for imprecision of results as the confidence interval was wide and clinically not important. bDowngraded one level for risk of bias as risk of bias as we judged selection, performance, detection, attrition, and reporting bias to be unclear. *We defined long‐term follow‐up as between two months and one year. | ||||||
Background
Description of the condition
Dry eye syndrome, or keratoconjunctivitis sicca, is defined as "a disorder of the tear film due to tear deficiency or excessive tear evaporation which causes damage to the interpalpebral ocular surface and is associated with symptoms of ocular discomfort" (Lemp 1995; Lemp 1998; Pflugfelder 2000). Dry eye affects 10% to 20% of adults, with 1 million to 4 million affected adults aged 65 to 84 in the USA (AAO 2003; Schein 1997b). Investigators have also estimated dry eye prevalence in Sweden (15%), India (18.4%), Australia (8.6% to 16.3%), and Indonesia (27.5%) (Lee 2002; Lemp 1998; McCarty 1998; Sahai 2005). The condition has been associated with age, sex, Sjögren's syndrome, arthritis, diabetes, corneal transplants, multivitamin use, laser in situ keratomileusis (LASIK), and photorefractive keratectomy (PRK) (Dalzell 2003; De Paiva 2006; Dew 2007; Moss 2000). Symptoms may include redness, burning, itchiness, foreign body sensation, and in severe cases corneal ulceration and bacterial infection (Lemp 1998; Sheppard 2003; Wilson 2003). Assessments of ocular surface damage and measures of tear stability and hyperosmolarity also aid the diagnosis of dry eye syndrome (Lemp 1995). Due to a lack of correlation among self‐reported symptoms and clinical measures, it is difficult to diagnose dry eye precisely (Lemp 1995; Nichols 2004; Schein 1997a).
Artificial tears, the typical initial treatment for patients with dry eye, hydrate the eye and provide short‐term symptomatic relief for affected individuals (Pucker 2016). Preservative‐free artificial tears are preferable for long‐term use because preserved formulations may be toxic to the cornea and conjunctival epithelium (Lemp 1994; Pflugfelder 2000; Pucker 2016). Interventions such as bandage contact lenses (physical coverage of the ocular surface), estrogens (hormone replacement), topical corticosteroids (general immunosuppressant), cyclosporine (immunosuppressant agent that decreases T‐cell production), pilocarpine (cholinergic parasympatheticomimetic agonist), and punctal plugs (lacrimal drainage occlusion device) also have been shown to be effective treatments in selected settings (DEWS 2007a; Freeman 1975; Jehangir 2016Lemp 1994; Pflugfelder 2000; Sall 2000; Sheppard 2003; Wilson 2003).
Description of the intervention
Punctal occlusion is a non‐pharmacological intervention for dry eye when artificial tears do not ameliorate symptoms (Balaram 2001; Freeman 1975; Willis 1987). Semi‐permanent silicone or temporary collagen punctal plugs are inserted into the upper, lower, or both puncta of the affected eye(s) (Lemp 1994). Collagen plugs dissolve within four to seven days, while silicone plugs either dislodge spontaneously or are removed by a physician. Clinicians typically prescribe the silicone punctal plugs after an affected patient has found symptomatic relief with the collagen punctal plugs (Altan‐Yaycioglu 2005). Thermal cautery or argon laser achieves permanent occlusion of the puncta (AAO 2003; Dohlman 1978; Lemp 1994). Similar to punctal occlusion, intracanalicular plugs also block tear drainage, though they act by blocking the canaliculus instead of the punctum (Jehangir 2016).
How the intervention might work
Punctal plugs are believed to block tear drainage by occluding the puncta. Blockage is subsequently thought to aid in the preservation of natural tears and to improve the quality and quantity of the tear film. (Barnard 1996; Dohlman 1978; Tai 2002). The most common side effects of occlusion are epiphora (overflow of tears), inhibited tear clearance, and desensitization of the corneal surface (Lemp 1994; Sheppard 2003; Tai 2002).
Why it is important to do this review
An updated systematic review examining the efficacy of punctal occlusion, specifically punctal plugs, for managing dry eye is necessary. There was appreciable variability in the interventions and study designs of the trials included in the previous systematic review thus precluding quantitative syntheses. The effectiveness of punctal plugs for treating dry eye has not yet been established. This review summarizes the best available evidence for the use of punctal occlusion in the treatment of dry eye.
Objectives
To assess the effects of punctal plugs versus no punctal plugs, different types of punctal plugs, and other interventions for managing dry eye. This is an update to a Cochrane Review initially published in 2010 (Ervin 2010).
Methods
Criteria for considering studies for this review
Types of studies
We selected only randomized and quasi‐randomized controlled clinical trials for inclusion in this review. We considered studies to be quasi‐randomized if the investigators did not use randomization to allocate participants to treatment groups but used techniques intended to allocate patients in an unbiased fashion. Some examples include allocation based on the day of the week, year of birth, or hospital admission number.
Types of participants
We included symptomatic participants who were diagnosed with aqueous tear deficiency or keratoconjunctivitis sicca (dry eye syndrome). There were no restrictions with respect to age, sex, comorbidities, or use of adjunctive therapy.
Types of interventions
We considered clinical trials comparing occlusion of the lower or upper punctum or upper and lower puncta with collagen versus silicone punctal plugs and studies comparing these plugs to other treatments such as artificial tears, pilocarpine, cyclosporine, or diathermy (use of electrodes to heat and contract punctal tissues). We also considered clinical trials using collagen or silicone plugs in conjunction with adjunctive therapies such as artificial tears, as well as trials comparing occlusion versus no treatment, placebo, or sham treatments.
Types of outcome measures
Primary outcomes
The primary outcome was subjective report of symptomatic improvement in dry eye symptoms such as burning and grittiness and other symptoms as defined by included studies at the long‐term follow‐up visit (2‐12 months).
Secondary outcomes
We included secondary outcomes assessed post‐treatment or at other reported time points in this review.
-
Ocular surface staining, as defined by the mean change in total Rose Bengal score from baseline to follow‐up. We reported change in fluorescein and lissamine green scores where appropriate.
-
Aqueous tear production, as measured by the mean change in Schirmer I test scores (mm). We included Schirmer I tests performed with anesthesia and Schirmer II tests without anesthesia.
-
Tear film stability, as measured by the mean change in tear film break‐up time (seconds).
-
Change in the frequency of artificial tear use, as defined by included studies.
Follow‐up
We assessed the secondary outcomes at two weeks, four weeks, and at long‐term follow‐up. We considered follow‐up at 12 to 16 days to be two weeks follow‐up. We also considered follow‐up between 26 to 30 days to be four weeks follow‐up. We defined long‐term follow‐up as between two months and one year.
Adverse outcomes
We reported adverse outcomes such as epiphora, corneal ulcers, and plug extrusion (total or partial displacement of the punctal plug) where appropriate. We summarized other adverse outcomes reported in included studies.
Search methods for identification of studies
Electronic searches
The Cochrane Eyes and Vision Information Specialist conducted systematic searches in the following databases for randomized controlled trials and controlled clinical trials. There were no language or publication year restrictions. The date of the search was 8 December 2016.
-
Cochrane Central Register of Controlled Trials (CENTRAL; 2016, Issue 11) (which contains the Cochrane Eyes and Vision Trials Register) in the Cochrane Library (searched 8 December 2016) (Appendix 1);
-
MEDLINE Ovid (1946 to 8 December 2016) (Appendix 2);
-
Embase.com (1947 to 8 December 2016) (Appendix 3);
-
PubMed (1948 to 8 December 2016) (Appendix 4);
-
LILACS (Latin American and Caribbean Health Science Information database (1982 to 8 December 2016) (Appendix 5);
-
metaRegister of Controlled Trials (mRCT) (www.controlled‐trials.com; last searched 18 November 2012‐ this resource is now archived) (Appendix 6);
-
US National Institutes of Health Ongoing Trials Register ClinicalTrials.gov (www.clinicaltrials.gov; searched 8 December 2016) (Appendix 7);
-
World Health Organization International Clinical Trials Registry Platform (www.who.int/ictrp; searched 8 December 2016) (Appendix 8).
In 2016, we revised the searches of electronic databases from the 2010 publication of the original version of this review.
Searching other resources
We searched reference lists of included studies to identify any additional inclusions. We also used the Science Citation Index‐Expanded database to identify studies that may have cited trials included in this review on 8 December 2016. We did not handsearch conference proceedings or journals.
Data collection and analysis
Selection of studies
Two review authors independently reviewed titles and abstracts resulting from the literature searches according to the inclusion criteria stated above. We classified the abstracts as 'definitely exclude', 'unsure,' or 'definitely include'. We retrieved the full‐text reports corresponding to abstracts classified as 'definitely include' or 'unsure' by either review author and re‐assessed the study for inclusion. We contacted the authors of studies classified as 'unsure' for further information, as required, after examining the full report. We resolved disagreements through discussion. We excluded studies labeled as 'exclude' by both review authors from the review and documented the reasons for exclusion. We assessed studies labeled 'definitely include' for methodological quality.
Data extraction and management
Two review authors independently extracted data using a form developed by Cochrane Eyes and Vision, resolving discrepancies by discussion. One review author entered data into Review Manager 5 (RevMan 5) and a second author verified all values entered (Review Manager 5 2014). When quantitative data were not available, we abstracted data from graphs using GetData Graph Digitalizer.
Assessment of risk of bias in included studies
Two authors independently assessed the included studies for sources of systematic bias according to the guidelines in Chapter 8 of the Cochrane Handbook for Systematic Reviews of Interventions (Higgins 2011a). We evaluated the studies for the following criteria: sequence generation and allocation concealment before assignment (selection bias), masking of outcome assessors (detection bias), incomplete outcome data (attrition bias), selective outcome reporting (reporting bias), and other sources of bias. We reported the judgment for each criterion as 'yes (low risk of bias)', 'no (high risk of bias)' or 'unclear (information is insufficient to assess)'.
We reported the adequacy of sequence generation and allocation concealment before assignment. Methods of sequence generation considered to be at low risk of bias include references to random number tables or computer generated random numbers and coin tosses. We considered any method of allocation concealment that provided reasonable confidence that the allocation sequence was concealed from participating physicians and patients to confer low risk of bias, for example centralized randomization or use of sequentially numbered opaque envelopes.
We noted masking of outcome assessors by individual study outcomes. Masking of investigators and participants would not have been possible with the interventions being compared in some studies, but we noted it where mentioned.
For incomplete outcome data, we examined rates of follow‐up, reasons for loss to follow‐up and analysis by the principle of intention‐to‐treat (ITT). We assessed whether follow‐up rates for treatment and control arms were similar and whether data were missing for outcomes of interest. We considered studies to be at low risk of bias when there were no missing data and no participants for whom outcome data were not reported, and where all participants, including those who received some or none of the allocated treatment, were included in the analyses of outcomes. We noted the method of data imputation, when appropriate, for included studies.
We considered studies to be at low risk of bias for selective outcome reporting whenever all pre‐specified outcomes of interest in the protocol or register record were consistent with the outcomes specified in the published report.
We examined included studies for other sources of bias and considered studies at low risk of bias when there was no evidence of research misconduct or potential for bias based on study methodology, or when the study was not stopped early due to evidence of harm or benefit. When available, we used trial registration records, source(s) of funding, or conflicts of interest to identify other potential sources of bias.
We resolved disagreements through discussion. We contacted the authors of the studies for additional information on issues that were unclear from the study report. In case of failure to communicate with the primary investigators, or if no response was received within six weeks, we assessed the methodological quality on the basis of the available information.
Measures of treatment effect
We calculated a summary risk ratio for dichotomous outcomes including the primary outcome of symptomatic improvement and reports of adverse events. We verified normality of distributions of continuous outcome data and calculated mean differences for secondary outcomes as follows: mean change in Rose Bengal, fluorescein, and lissamine green staining scores, mean change in tear production as measured by the Schirmer I/Schirmer II test, and mean change in tear film break‐up time.
Unit of analysis issues
We reported the unit of analysis for the included studies in the Results section (Included studies). We did not include cross‐over trials, but if we identify eligible cross‐over trials for inclusion in a subsequent update, we will attempt to extract data from the study reports or request data from the investigators to account appropriately for the study design. If we are unable to retrieve these data, we will incorporate statistical techniques to approximate a paired analysis as outlined in Chapter 16.4 of the Cochrane Handbook for Systematic Reviews of Interventions (Higgins 2011b).
Dealing with missing data
We contacted primary authors of included studies to obtain missing or unclearly reported information such as details regarding study methods, standard deviations not reported with mean values, and data required for an ITT analysis. Whenever there was no response from the primary authors within six weeks, we imputed data where possible using available information such as P values or confidence intervals. We describe the assumptions we made during imputation where appropriate.
Assessment of heterogeneity
We assessed statistical, methodological, and clinical heterogeneity. When including additional studies to this update, we computed the I2 statistic (%) to determine statistical heterogeneity, that is, the proportion of variation due to heterogeneity among effect estimates from individual studies in a meta‐analysis. We considered an I2 value larger than 75% to suggest considerable statistical heterogeneity. We also examined the result of the Chi2 test and the degree of overlap in confidence intervals of included studies because poor overlap of estimates and confidence intervals suggests the presence of heterogeneity. We assessed clinical and methodological heterogeneity by examining variations among included studies with respect to participant characteristics, inclusion/exclusion criteria, and assessments of primary and secondary outcomes.
Assessment of reporting biases
Because fewer than 10 studies were included in any meta‐analysis, we did not assess reporting biases with funnel plots. If we identify more studies in future updates and a meta‐analysis includes data from 10 or more studies, we will assess reporting bias using funnel plots.
Data synthesis
When considering meta‐analysis, we took statistical, methodological, and clinical heterogeneity into consideration. We considered an I2 statistic greater than 75% to suggest considerable statistical heterogeneity, as defined above in 'Assessment of heterogeneity'. When the number of trials was fewer than three, we used a fixed‐effect model, which in these cases provides a more robust estimate of the treatment effect. When meta‐analysis had three or more included trials, we used a random‐effects model to estimate the overall intervention effects when appropriate. When analyzing binary (dichotomous) outcomes, we estimated the risk ratio (RR). For continuous outcomes, we estimated the mean difference (MD).
Subgroup analysis and investigation of heterogeneity
Sufficient data were not available to conduct subgroup analyses. We will use the following guidelines for future updates of this review: if there is considerable statistical heterogeneity and evidence of potential clinical or methodological heterogeneity, and if data are available, we will conduct a subgroup analysis of tear deficient classifications of dry eye as defined by the National Eye Institute/Industry Workshop on Clinical Trials in Dry Eyes (Lemp 1995).
Sensitivity analysis
We did not perform sensitivity analyses due to insufficient data. We will consider sensitivity analyses during future updates of this review to determine the impact of excluding studies with lower methodological quality or industry funding as well as studies that were unpublished at the time of our review. We also will conduct sensitivity analyses to determine the impact of including quasi‐randomized trials.
Summary of findings table
We used the GRADE approach to evaluate the certainty of evidence for each outcome (GRADEpro 2014). Two review authors independently assessed each outcome as being of very low‐, low‐, moderate‐, or high‐certainty according to five criteria: risk of bias in individual trials, indirectness, heterogeneity, imprecision of estimate (wide confidence intervals), and publication bias. We resolved discrepancies by discussion. We present the main outcomes for each comparison in a 'Summary of findings' table. Since dry eye syndrome is a chronic condition, long‐term follow‐up is the most clinically relevant and patient important time point. Therefore, we included the following seven outcomes at long‐term follow‐up: symptomatic improvement, ocular surface staining with fluorescein, ocular surface staining with Rose Bengal, aqueous tear production, tear film stability, artificial tear use, and adverse events.
Results
Description of studies
We describe the full‐text studies we assessed for inclusion in the 'Characteristics of included studies' and 'Characteristics of excluded studies' tables.
Results of the search
In the original 2010 manuscript, the electronic search identified a total of 115 titles and abstracts (Ervin 2010). We retrieved 19 articles for full‐text assessment, and we finally included 6 and excluded 13 for the review. We identified and included one additional study from the list of references in the protocol for this systematic review and from a search of the Science Citation Index‐Expanded database.
On 8 December 2016, the electronic searches yielded an additional 211 records (Figure 1). We assessed 20 full‐text reports from 20 studies. Eleven met our eligibility criteria for inclusion, while one was ongoing. We excluded the remaining eight studies for the reasons noted in 'Characteristics of excluded studies'. Therefore, the updated version of this systematic review includes a total of 18 included studies and 1 ongoing study.

Flow diagram.
Included studies
The 18 studies included in this review enrolled 711 participants (1249 eyes); we describe the studies in the 'Characteristics of included studies' table. The intervention comparisons are summarized in Table 1. Roberts 2007 did not report the number of participants but did report the number of eyes studied.
| 1. Punctal plugs versus observation. | ||
| Collagen intracanalicular plugs were inserted in the upper and lower puncta | Sham treatment | |
| Silicone punctal plugs | No occlusion | |
| Collagen plus silicone punctal plugs | Sham treatment | |
| Bilateral collagen punctal plugs in the lower lids + cyclosporine eye drops to both eyes twice daily | Cyclosporine ophthalmic emulsion 0.05% | |
| Silicone punctal plugs in the upper and lower puncta | Sham treatment | |
| Silicone punctal plugs | Observation | |
| 2. Punctal plugs versus cyclosporine. | ||
| Bilateral collagen punctal plugs in the lower lids only | Cyclosporine ophthalmic emulsion 0.05% | |
| 3. Punctal plugs versus oral pilocarpine. | ||
| Collagen punctal plugs | Oral pilocarpine | |
| 4. Punctal plugs versus artificial tears. | ||
| Collagen punctal plugs | Artificial tears | |
| Acrylic punctal plugs | Artificial tears | |
| Acrylic punctal plugs | Artificial tears | |
| Collagen punctal plugs | Artificial tears | |
| Thermal Memory hydrophobic acrylic polymer rigid rod punctal plug | Artificial tears | |
| 5. Punctal plugs in the lower puncta versus the upper puncta. | ||
| Collagen punctal plugs in the lower puncta | Collagen punctal plugs in the upper puncta | |
| Collagen punctal plugs in the lower puncta | Collagen punctal plugs in the lower and upper puncta | |
| Silcone punctal plugs in the lower puncta | Silcone punctal plugs in the upper puncta | |
| 6. Acrylic punctal plugs versus silicone punctal plugs. | ||
| Acrylic punctal plugs | Silicone punctal plugs | |
| 7. Intracanalicular plugs versus Silicone punctal plugs. | ||
| Intracanicular | Silicone punctal plugs | |
| 8. Collagen punctal plugs versus silicone punctal plugs. | ||
| Collagen punctal plugs | Silicone punctal plugs | |
| Collagen punctal plugs were inserted in the lower punctum | Silicone punctal plugs were inserted in the lower punctum | |
| Excluded comparisons | ||
| Artificial tears | Oral pilocarpine | |
The unit of randomization for the included studies was the participant for 11 studies (Altan‐Yaycioglu 2005;Chen 2010;Farrell 2003; Kaido 2012;Nava‐Castaneda 2003; Qiu 2012; Qiu 2013;Rabensteiner 2013; Roberts 2007;Tsifetaki 2003; Yung 2012), the eye for 5 studies (Brissette 2015; Burgess 2008; Lowther 1995;Mansour 2007;Slusser 1998), and was unclear for 2 studies (Feng 2011; Zhou 2016;).
The unit of analysis was the participant for 3 studies as the average of the participant's right and left eyes was ana lysed (Rabensteiner 2013; Roberts 2007;Tsifetaki 2003). The unit of analysis was the eye for 7 studies (Brissette 2015;Feng 2011; Kaido 2012; Lowther 1995; Mansour 2007; Qiu 2013; Slusser 1998) although the study investigators did not discuss whether the analyses accounted for the correlation between eyes of a participant. The unit of analysis was unclear for the remaining 8 studies (Altan‐Yaycioglu 2005;Burgess 2008; Chen 2010; Farrell 2003;Nava‐Castaneda 2003; Qiu 2012; Yung 2012; Zhou 2016).
In this review we included the following comparisons (Table 1).
-
Punctal plugs versus observation.
-
Punctal plugs versus cyclosporine.
-
Punctal plugs versus oral pilocarpine.
-
Punctal plugs versus artificial tears.
-
Punctal plugs in the lower puncta versus the upper puncta.
-
Acrylic punctal plugs versus silicone punctal plugs.
-
Intracanalicular plugs versus Silicone punctal plugs.
-
Collagen punctal plugs versus silicone punctal plugs.
Concomitant use of artificial tears was permitted irrespective of the treatment assignment in the Brissette 2015; Burgess 2008;Rabensteiner 2013; Roberts 2007;Tsifetaki 2003; Yung 2012 studies. There was no mention of concomitant artificial tear use in the Altan‐Yaycioglu 2005; Chen 2010; Farrell 2003; Kaido 2012; Lowther 1995; Mansour 2007; Nava‐Castaneda 2003; Slusser 1998 studies. The objective in the Feng 2011, Qiu 2012, Qiu 2013, and Zhou 2016 studies was to compare artificial tears to punctal plugs so only participants assigned to the artificial tear group received this treatment.
For eight of 18 included trials, the unit of analysis was unclear, as trial investigators did not report if they had only included one eye in the analysis or took the averaged of both eyes (Altan‐Yaycioglu 2005; Burgess 2008; Chen 2010; Farrell 2003; Nava‐Castaneda 2003; Qiu 2012; Yung 2012; Zhou 2016). Only one paired‐eye RCT used paired t‐test (Slusser 1998), while the other four paired‐eye RCTs, but did not mention an analysis accounting for correlation between the left and right eye (Brissette 2015; Feng 2011; Lowther 1995; Mansour 2007). The remaining four of 18 trials reported averaging both eyes (Rabensteiner 2013; Roberts 2007), analyzed the right eye (Kaido 2012; Qiu 2013), or reporting the mean outcome of left and right eyes (Tsifetaki 2003).
Excluded studies
We excluded 21 studies, listing them in the 'Characteristics of excluded studies' table along with the reasons for exclusion.
Risk of bias in included studies
Figure 2 presents a summary of the risk of bias judgements for the individual included studies.

Risk of bias summary: review authors' judgements about each risk of bias item for each included study.
Allocation
We judged the methods of sequence generation to confer low risk of bias for nine studies (Brissette 2015; Burgess 2008; Mansour 2007; Nava‐Castaneda 2003; Qiu 2013; Rabensteiner 2013; Roberts 2007; Tsifetaki 2003; Zhou 2016). All these studies used some form of a computer‐generated randomization scheme. We assessed Yung 2012 as being at high risk of bias because participants were assigned based on their patient ID number; participants with an odd patient ID number were assigned to the punctal plug group, while those with even patient ID numbers were assigned to the non‐punctal plug group. The eight remaining studies did not discuss sequence generation (Altan‐Yaycioglu 2005; Chen 2010; Farrell 2003; Feng 2011; Kaido 2012; Lowther 1995; Qiu 2012; Slusser 1998).
We considered three studies at low risk of bias for allocation concealment: the investigators used opaque envelopes in Brissette 2015 and Qiu 2013, while in Nava‐Castaneda 2003 an external statistical committee prepared random assignments and placed them in sealed envelopes. We rated Yung 2012 at high risk of bias because participants were assigned to treatment groups based upon their patient ID numbers, as described above. The remaining 14 trials did not describe allocation concealment.
Masking (performance bias and detection bias)
Roberts 2007 did not mask participants and personnel, so we considered this study to be at high risk of performance bias. We judged 7 of the 18 included studies to be at low risk of both performance bias and detection bias, as they reported masking both the participants and study personnel (Brissette 2015; Burgess 2008; Farrell 2003; Lowther 1995; Nava‐Castaneda 2003; Rabensteiner 2013; Slusser 1998) although it is not possible to mask the personnel administering punctal plugs. For the remaining studies, the study investigators did not report masking of participants and personnel although given the nature of the interventions compared it was not possible to mask participants and personnel administering the punctal plugs. We judged the remaining studies as having an unclear risk of bias.
Mansour 2007 , Roberts 2007, and Yung 2012 reported that the outcome assessors were not masked, so we rated these studies as being at high risk of detection bias. Mansour 2007 reported that the same investigator performed all measurements and presumably was unmasked to treatment assignment. Roberts 2007 reported that the "medication was dispensed open‐label." In Yung 2012, the study authors informed us through email that the outcome assessors were not masked. We judged 8 of the 18 included studies to be at low risk of detection bias because they reported masking of the outcome assessors (Brissette 2015; Burgess 2008; Farrell 2003; Lowther 1995; Nava‐Castaneda 2003; Qiu 2013; Slusser 1998; Tsifetaki 2003). We judged the remaining studies to be at unclear risk of detection bias; this group included Altan‐Yaycioglu 2005, where the nuclear medicine specialist who evaluated the lacrimal scintigraphy images was masked to treatment assignment; however, lacrimal scintigraphy was not a measurement included in this review. It is unclear whether other outcome assessors were masked in Altan‐Yaycioglu 2005.
Incomplete outcome data
We judged Mansour 2007, Rabensteiner 2013, Roberts 2007, and Slusser 1998 to be at high risk of bias for failure to report complete outcome data. Mansour 2007, Roberts 2007 and Slusser 1998 excluded 20% or more participants from their analyses of outcomes. Roberts 2007 reported potential attrition bias by replacing participants who withdrew from their study (participants were not included in their analyses). In Rabensteiner 2013, the proportion of participants lost to follow‐up differed across groups.
We judged eight studies to be at low risk of bias for incomplete outcome data (Brissette 2015; Chen 2010; Farrell 2003; Kaido 2012; Lowther 1995; Nava‐Castaneda 2003; Qiu 2013; Yung 2012). These studies reported no loss to follow‐up or missing data, which we confirmed by comparing the number randomized versus the number ana lysed in the results reported.
We assessed all the remaining studies to be at unclear risk of attrition bias (Altan‐Yaycioglu 2005; Burgess 2008; Feng 2011; Qiu 2012; Tsifetaki 2003; Zhou 2016). Altan‐Yaycioglu 2005 did not report sample sizes in the Results, so it was unclear whether all participants completed follow‐up examinations. We noted that investigators assessed most outcomes immediately after insertion of the punctal plugs with the exception of ocular surface staining, which was typically assessed three days after occlusion. Burgess 2008 and Feng 2011 did not include sample sizes for all outcomes, so it was unclear whether all randomized participants completed their follow‐up examinations. In Tsifetaki 2003, one participant was lost to follow‐up and one participant discontinued due to local ocular infection, but we could not determine whether these participants were excluded from the analyses. Qiu 2012 reported that less than 10% of participants were lost to follow‐up, and Zhou 2016 did not report losses to follow‐up.
Selective reporting
We accessed study protocols and registry records and compared outcomes reported with the outcomes described in the protocol or trial registry record. We judged one study to be at low risk of bias, as we were able to confirm that all of the outcomes defined in the trial registry were reported in the full text (Brissette 2015). The reports from the remaining included studies did not include a trial registration number, and we did not have access to a study protocol, so we were unable to compare the reported outcomes in the full‐text studies with the outcomes before the study began.
Other potential sources of bias
We assessed the risk of bias for other potential sources of bias based on declared industry funding and conflict of interest. We rated two studies as being at high risk of bias because the investigators received industry funding or declared a conflict of interest (Roberts 2007; Slusser 1998). Brissette 2015, Qiu 2012, and Qiu 2013 declared no conflicts of interest and received no funding support or funding from their university, so we assigned them a low risk rating. The remaining studies did not include a source of funding or conflict of interest, and we judged them to be at unclear risk of bias.
Effects of interventions
See: Summary of findings for the main comparison Summary of findings: punctal plugs versus no punctal plugs; Summary of findings 2 Summary of findings: punctal plugs versus cyclosporine; Summary of findings 3 Summary of findings: punctal plugs versus oral pilocarpine; Summary of findings 4 Summary of findings: punctal plugs versus artificial tears; Summary of findings 5 Summary of findings: punctal plugs in the upper versus lower puncta; Summary of findings 6 Summary of findings: acrylic versus silicone punctal plugs; Summary of findings 7 Summary of findings: intracanalicular versus silicone punctal plugs; Summary of findings 8 Summary of findings: collagen versus silicone punctal plugs
1. Punctal plugs versus no punctal plugs
Five trials compared punctal plugs with no punctal plugs (Lowther 1995; Mansour 2007; Nava‐Castaneda 2003; Slusser 1998; Yung 2012).
When we refer to the punctal plug group, the group could include participants assigned to intracanalicular punctal plugs alone (Lowther 1995), silicone punctal plugs alone (Mansour 2007; Slusser 1998; Yung 2012), and collagen plus silicone punctal plugs (Nava‐Castaneda 2003). Similarly, the no punctal plugs group participants received sham treatment (Lowther 1995; Nava‐Castaneda 2003; Slusser 1998) or observation (Mansour 2007; Yung 2012).
Two of the five trials did not report the review outcomes at two weeks, one month, or long‐term (Lowther 1995; Mansour 2007). Mansour 2007 ascertained outcomes between 6 and 20 weeks after occlusion but did not report a more precise time point than that. Lowther 1995 reported only five days of follow‐up, so we did not report any study outcomes in this review.
Symptomatic improvement
Of the five trials, three included reports of symptomatic improvement at two weeks, one month, or long‐term (Mansour 2007; Nava‐Castaneda 2003; Yung 2012). We judged the certainty of the evidence to be very low for all follow‐up time points after downgrading for high risk of detection and attrition bias (1 level) and methodological heterogeneity (2 levels).
The three trials reported symptomatic improvement slightly differently. Nava‐Castaneda 2003 and Yung 2012 reported dry eye symptom scores that ranged from 0 to 3 points (0 = absence of the symptom, 1 = mild, 2 = moderate, and 3 = severe). However, Nava‐Castaneda 2003 also reported "a total symptoms score, which is a measure of the overall severity of the patient's conjunctival and dry eye condition, and the score was calculated by multiplying (for each individual symptom/condition) the numerical values corresponding to frequency and severity, and then adding the products for all symptoms" (p 11). For Nava‐Castaneda 2003, we assume that the score could range from 0 to 105 points based on the description in the text (minimum: 0 points for severity x 0 points for frequency x 7 symptoms; maximum: 5 points for severity x 3 points for frequency x 7 symptoms). Finally, Mansour 2007 use Ocular and Oral Symptoms score (According to the European Criteria for the Classification of Sjögren's Syndrome, and noted discomfort scores that were a summary score from 0 to 10, with higher values denoting more discomfort.
Since the three trials had high methodological heterogeneity, we report the results as a narrative synthesis. Each of the three trials used different scoring methods; Mansour 2007 used the Ocular and Oral Symptoms score, Nava‐Castaneda 2003 reported a total symptoms score, and Yung 2012 reported dry eye symptom scores. Mansour 2007 reported little or no difference in the Ocular and Oral Symptoms score, which ranged from 0 to 10 points (MD ‐0.46 points, 95% CI ‐1.24 to 0.32; eyes = 26). Nava‐Castaneda 2003 reported a slight decrease in symptom score, assumed to range from 0 to 105 points, but this finding is not clinically important (MD ‐2.07 points, 95% CI ‐2.70 to ‐1.44; eyes = 61). However, Nava‐Castaneda 2003 also noted a significant improvement in individual symptom scores at four weeks in the punctal plug group compared with the no punctal plugs group (dryness, itching, burning, foreign body sensation, fluctuating vision, light sensitivity). Yung 2012 reported little or no difference in dry eye symptom score, ranging from 0 to 3 points (MD 0.06 points, 95% CI ‐0.69 to 0.80; eyes = 28)
Two trials included long‐term results indicated slightly favorable symptomatic improvement in the punctal plug group versus the no punctal plugs group, but the confidence interval includes values that are not clinically important (Nava‐Castaneda 2003; Yung 2012). As mentioned above, different scales were used by Nava‐Castaneda 2003 and Yung 2012. Nava‐Castaneda 2003 reported a slight decrease in symptom score, although not clinically meaningful. However, Nava‐Castaneda 2003 noted there were also significant differences in the frequency of individual symptom scores (dryness, watery eyes, itching, burning, foreign body sensation, fluctuating vision, light sensitivity) with participants in the collagen/silicone group reporting lower frequency of these symptoms. Yung 2012 reported little or no difference in dry eye symptom score, ranging from 0 to 3 points (MD ‐0.75 points, 95% CI ‐1.53 to 0.02; eyes = 28)
Ocular surface staining
Three trials reported ocular surface staining as an outcome at two weeks, one month, or long‐term follow‐up (Nava‐Castaneda 2003; Slusser 1998; Yung 2012). Slusser 1998 reported Rose Bengal scores that ranged from 0 to 4, where 0 represented no staining and 4 represented heavy staining. Nava‐Castaneda 2003 and Yung 2012 reported the sodium fluorescein staining scores that ranged from 0 to 4, where 0 represented no staining and 4 represented heavy staining. We judged the certainty of the evidence to be low after downgrading for imprecision as the confidence interval was either wide or clinically not important (1 level) and there was a high risk of attrition bias (1 level).
One of the three trials included two‐week results that reported no difference between the groups (Nava‐Castaneda 2003). Nava‐Castaneda 2003 reported a slightly lower difference in sodium fluorescein staining scores in the punctal plugs group compared with the no punctal plugs group on the scale of 0 to 4, where a lower score is more advantageous (MD −0.80 points, 95% CI −1.10 to −0.50; eyes = 122; Analysis 1.3). However, we judged that the difference was not clinically significant.
One of the three trials included one‐month results, which showed little or no difference between punctal plugs and no punctal plugs ( Yung 2012). Yung 2012 found little or no difference between the groups in fluorescein staining scores of 0 to 4 points (MD 0.59 points, 95% CI −0.19 to 1.37; eyes = 28; Analysis 1.4).
One of the three trials included long‐term results comparing punctal plugs over no punctal plugs, and punctal plugs were not consistently favored (Nava‐Castaneda 2003). Nava‐Castaneda 2003 reported that punctal plugs were somewhat better than no punctal plugs for sodium fluorescein staining score (MD ‐1.50 points, 95% CI ‐1.88 to ‐1.12; eyes = 61 Analysis 1.5).
Aqueous tear production
One study reported aqueous tear production (Yung 2012) assessed using the Schirmer test with anesthesia. We judged the certainty of the evidence to be low after downgrading for imprecision as the confidence interval was either wide or clinically not important (1 level), and there was a high risk of attrition bias (1 level).
Yung 2012 reported Schirmer score results without specifying the follow‐up time point and did not provide data that could be included in a meta‐analysis. Yung 2012 reported that "Schirmer values tended to increase in the plug group after plug insertion; however, the changes did not reach significance" (p 211).
Tear film stability
Two studies reported the tear film stability outcome (Slusser 1998; Yung 2012). We judged the certainty of the evidence to be low after downgrading for inconsistency in results as TBUT did not consistently favor punctal plugs over no punctal plugs at one and three months follow‐up (1 level) and there was a high risk of attrition bias (1 level).
Slusser 1998 reported mean tear film break‐up times but did not report the respective standard deviations or the exact P value. The investigators stated: "the average prelens tear film break‐up time for all patients at the 2 baseline visits was 16.1s[econds] for the eye assigned to receive the plugs, and 16. 7s[econds] for the control eye. The difference between these values is not statistically significant (paired t‐test, p > 0.05)" (p 333).
Yung 2012 reported tear film stability at one and three months. At the one and three month follow‐up visits, Yung 2012 found little or no difference in tear film break‐up time between the groups (MD −0.41 seconds, 95% CI −1.25 to 0.43; eyes = 28 and MD 1.93 seconds, 95% CI 0.67 to 3.20; eyes = 28, Analysis 1.6 and Analysis 1.7 respectively).
Artificial tear use
One trial compared the frequency of artificial tear use (Nava‐Castaneda 2003). We judged the certainty of the evidence to be very low after downgrading for high risk of performance, detection, and attrition bias (2 levels).
At two weeks follow‐up, Nava‐Castaneda 2003 reported slightly less artificial tear use in the punctal plug group compared with the no punctal plugs group (MD ‐1.40, 95% CI ‐1.86 to ‐0.94; eyes = 61; Analysis 1.8). At the one‐month follow‐up visit, there was slightly less artificial tear use in the punctal plug group compared with the no punctal plugs group (MD ‐1.80, 95% CI ‐2.09 to ‐1.51; Analysis 1.9). At the long‐term follow‐up visit Nava‐Castaneda 2003 reported slightly less artificial tear use in the punctal plug group compared with the no punctal plugs group (MD ‐2.70, 95% CI ‐3.11 to ‐2.29; eyes = 61); Analysis 1.10).
Adverse outcomes
Three of the five studies reported on adverse outcomes (Slusser 1998; Mansour 2007; Nava‐Castaneda 2003). We judged the evidence to be very low‐certainty after downgrading for limitations in the design and implementation of available studies suggesting high likelihood of attrition bias (2 levels) and sparse and inconsistent data, particularly with respect to epiphora (1 level).
Slusser 1998 reported several adverse events, all in the punctal plug group (28 participants); 23 participants (82%) had epiphora, 3 (11%) reported itching in the area of plug placement, and 1 (3.5%) had tenderness and swelling of the eyelids with mucous discharge. Mansour 2007 reported spontaneous plug loss in 6 of 20 eyes (30%) with silicone punctal plugs. Nava‐Castaneda 2003 reported epiphora in one participant who had received collagen and silicone punctal plugs. The remaining studies did not report adverse events (Lowther 1995; Yung 2012).
2. Punctal plugs versus cyclosporine
One study compared punctal plugs to cyclosporine (Roberts 2007). We judged the certainty of the evidence to be very low after downgrading for imprecision of results (1 level) and high risk of detection, performance, attrition, and other bias (two levels).
Symptomatic improvement
The study investigators did not report this outcome.
Ocular surface staining
At one month, Roberts 2007 reported little or no between‐group difference in Rose Bengal staining scores on a scale of 0 to 4 points (MD 0.10 points, 95% CI −0.32 to 0.52; eyes = 20). The Rose Bengal staining score "was graded on the following scale: 0 = no staining, 1 = staining of the nasal conjunctiva only, 2 = staining of both the nasal and temporal conjunctiva, 3 = peripheral corneal staining, 4 = central corneal staining." p 806 The study investigators of Roberts 2007 stated: "there was greater improvement in conjunctival staining with cyclosporine or the combination than with plugs alone." It was unclear whether Rose Bengal or fluorescein staining was used.
Aqueous tear production
At one month, Roberts 2007 also reported little or no difference between the punctal plug and cyclosporine groups for aqueous tear production (Schirmer test without topical anesthesia: MD 6.00 mm/3 min, 95% CI 4.96 to 7.04; eyes = 20; Analysis 2.1). Likewise at long‐term follow‐up, there was little or no difference between the punctal plug and cyclosporine groups for aqueous tear production (MD 0.80 mm/3 min, 95% CI ‐0.74 to 2.34; eyes = 20; Analysis 2.2)
Tear film stability
Roberts 2007 did not report this outcome.
Artificial tear use
At one month, Roberts 2007 reported less daily artificial tear use in the punctal plug group compared with the cyclosporine group (MD −1.70 applications/day, 95% CI −3.04 to −0.36; eyes = 20; Analysis 2.5). But at long‐term follow‐up, there was little or no difference between the punctal plug and cyclosporine groups for daily artificial tear use (MD 1.10 applications/day, 95% CI ‐0.04 to 2.24; eyes = 20)
Adverse outcomes
Roberts 2007 reported that 1 of 11 participants (9%) experienced plug displacement in the punctal plug group, while 1 of 11 participants (9%) in the cyclosporine group experienced a burning sensation.
3. Punctal plugs versus oral pilocarpine
One trial compared punctal plugs to oral pilocarpine (Tsifetaki 2003).
Symptomatic improvement
Tsifetaki 2003 reported significantly greater improvements in subjective ocular symptoms in participants who received oral pilocarpine (90% improvement) versus collagen punctal plugs (60% improvement) at three months (RR 0.69, 95% CI 0.49 to 0.95; eyes = 55; Analysis 3.1). The study investigators defined improvement in subjective ocular symptoms as an improvement of >55 mm for responses to the eye questionnaire on a 100 mm VAS. We judged the certainty of the evidence to be very low after downgrading for high risk of performance and detection bias, as the participant and outcome assessors were not masked to the treatment groups, and the self‐reported symptomatic improvement could have been biased (2 levels) and imprecision as the confidence interval is either wide or clinically not important (1 level).
Ocular surface staining
Tsifetaki 2003 noted small differences in Rose Bengal ocular surface staining scores, with participants who received oral pilocarpine showing more improvement at three months than participants randomized to collagen punctal plugs. The Rose Bengal ocular surface staining scores was graded using the van Bijsterveld schema, which is on a scale of 0 to 9 points (right eyes: MD 0.10 points, 95% CI −0.56 to 0.76; eyes = 55; Analysis 3.2.1; left eyes: MD 0.60 points, 95% CI 0.10 to 1.10; eyes = 55; Analysis 3.2.1). Mean differences ± standard deviations at follow‐up were: −1.0 point ± 1.3 (right eye) and −1.1 points ± 1.0 (left eye) for oral pilocarpine; and −0.9 points ± 1.2 (right eye) and −0.5 points ± 0.9 (left eye) for collagen punctal plugs.
Aqueous tear production
Tsifetaki 2003 noted no difference in the Schirmer test (without topical anesthesia) scores when comparing oral pilocarpine versus collagen punctal plugs (right eyes: MD −0.10 mm/5 min, 95% CI −0.53 to 0.33; eyes = 55; Analysis 3.3.1; left eyes: MD −0.50 mm/5 min, 95% CI −1.06 to 0.06; eyes = 55; Analysis 3.3.2). Mean differences ± standard deviations at follow‐up were: 0.3 ± 1.1 mm (right eyes) and 1.2 ± 1.3 mm (left eyes) for oral pilocarpine; and 0.2 ± 0.4 mm (right eyes) and 0.7 ± 0.8 mm (left eyes) for collagen punctal plugs.
Tear film stability
The study investigators did not report this outcome.
Artificial tear use
The study investigators did not report this outcome.
Adverse outcomes
Tsifetaki 2003 reported that "four patients had mild headache, of whom three also presented with nausea, vomiting, and sweating" (p 1205), and "one patient in the inferior puncta occlusion group had blepharitis and was withdrawn from the study" (p 1204).
4. Punctal plugs versus artificial tears
Five trials compared punctal plugs with artifical tears (Feng 2011; Qiu 2012; Qiu 2013; Tsifetaki 2003; Zhou 2016). Tsifetaki 2003 compared punctal plugs plus artificial tears versus artificial tears alone, while the rest of the trials compared punctal plugs versus artificial tears. Also Tsifetaki 2003 randomized both eyes of each participants to the same treatment group, hence they reported the mean and SD for the left and right eyes individually. All participants included in Feng 2011 had undergone LASIK surgery.
Symptomatic improvement
Four of the five trials reported symptomatic improvement (Qiu 2012; Qiu 2013; Tsifetaki 2003; Zhou 2016). We judged the certainty of the evidence to be very low after downgrading for there was a high risk of performance and detection bias, as the lack of masking in participants and outcome assessors could have influenced self‐reported symptomatic improvement (2 levels), and there was unexplained statistical heterogeneity or inconsistent results (1 level), and imprecision of results as the confidence interval was either wide or clinically not important (1 level).
At two weeks, Qiu 2012 reported eight symptom outcomes: dryness, foreign body sensation, visual fatigue, burning, red eye, stinging, secretion on eyelash, and difficulty opening eyes in the morning due to dryness. Each symptom was scored from "1 to 10; 1 being the absence of the type of discomfort and 10 being the most severe level that one could bear." There was little or no difference in symptomatic improvement score (MD −0.30 points, 95% CI −3.87 to 3.27; eyes = 28; Analysis 4.1).
At three months, Tsifetaki 2003 reported more improvements in ocular symptoms in the group receiving punctal plugs plus artificial tears than in the group receiving artifical tears alone (RR 2.29, 95% CI 1.20 to 4.38; eyes = 54; Analysis 4.2). As mentioned above, improvements in subjective ocular symptoms was defined as an improvement of >55 mm for responses to the eye questionnaire on a 100 mm VAS.
At three months, Zhou 2016 and Qiu 2013 reported mean symptomatic improvement scores. Qiu 2013 reported scores on the 12‐item Ocular Surface Disease Index (OSDI). Each item on the questionnaire is graded from 0 to 4 points, where 0 = never, 1 = some of the time, 2 = half of the time, 3 = most of the time, and 4 = all the time. Zhou 2016 reported a symptoms score, defined as the sum of scores for dryness, foreign body sensation, and visual fatigue. The dryness score was graded from 0 to 6 points, where 0 = none, 2 = occasional, 4 = my eyes are often dry and uncomfortable, 6 = my eyes are always unbearably dry. Foreign body sensation was scored from 0 to 3 points, where 0 = none; 1 = occasional; 2 = often, I often want to blink; and 3 = often, I have to blink frequently, and want to rub my eyes with my hands. The visual fatigue score ranged from 0 to 6 points, where 0 = none, 2 = quick to fatigue, 4 = the duration that I can read or see has shortened, 6 = my eyelids feel like falling off, so I cannot read or see. Punctal plugs showed slightly better symptomatic improvement than artificial tears group at three months (SMD −0.88, 95% CI −1.24 to −0.51; eyes = 130; I2 = 86%; Analysis 4.3)
Ocular surface staining
We judged the certainty of the evidence to be low after downgrading for imprecision in results as the confidence interval is wide and clinically not important (2 levels). At two‐week follow‐up, Feng 2011 reported little or no difference in Rose Bengal scores between groups (MD 0.81 points, 95% CI −0.09 to 1.71; eyes = 54; Analysis 4.4)
Both Tsifetaki 2003 and Qiu 2013 reported ocular surface staining at three months follow‐up but assessed it differently. Because Tsifetaki 2003 randomized both eyes of each participant to the same treatment group, they reported the mean and SD for the left and right eye respectively. Further more, both treatment groups received artificial tears, and noted small differences in Rose Bengal ocular surface staining scores on a scale of 0 to 3 (right eyes: MD 0.10 points, 95% CI −0.56 to 0.76; Analysis 4.5.1; left eyes: MD 0.60 points, 95% CI 0.10 to 1.10; Analysis 4.5.2). Qiu 2013 reported little or no difference in fluorescein staining scores on a scale of 0 to 3 (MD −0.21 points, 95% CI −0.49 to 0.07; eyes = 40; Analysis 4.6)
Aqueous tear production
We judged the certainty of the evidence to be low after downgrading for imprecision as the confidence interval are wide or clinically not important (1 level) and results were inconsistent (1 level). At two weeks, Feng 2011 noted little or no difference in Schirmer scores (without topical anesthesia) when comparing collagen punctal plugs versus artificial tears (MD 0.83 mm/5 min, 95% CI ‐1.05 to 2.71; eyes = 82; Analysis 4.7).
At three months, Tsifetaki 2003 noted small differences in Schirmer scores (without topical anesthesia) when both treatment groups received artificial tears and both eyes of each participant was in the same treatment group (right eye: MD 0.00 mm/5 min, 95% CI ‐0.33 to 0.33; Analysis 4.8.1; left eye: MD 0.10 mm/5 min, 95% CI ‐0.35 to 0.55; Analysis 4.8.2). The meta‐analysis of Qiu 2013 and Zhou 2016 favored punctal plugs over artificial tears (MD 2.16 mm/5 min, 95% CI 1.41 to 2.90; eyes = 130; I2 = 0%; Analysis 4.9)
Tear film stability
We judged the certainty of the evidence to be moderate after downgrading for imprecision of results (1 level).
At two weeks, the pooled analysis of Feng 2011 and Qiu 2012 showed little or no difference in tear film stability when comparing collagen punctal plugs versus artificial tears (MD 0.26 seconds, 95% CI −0.57 to 1.09; eyes = 82; I2 = 0%; Analysis 4.10).
At three months, the pooled analysis of Qiu 2013 and Zhou 2016 showed little or no difference in tear film stability when comparing collagen punctal plugs versus artificial tears (MD 1.02 seconds, 95% CI 0.60 to 1.44; eyes = 130; I2 = 55%; Analysis 4.11).
Artificial tear use
The investigators of these studies did not report this outcome, as one of the interventions consisted of artificial tears.
Adverse outcomes
We judged the certainty of the evidence to be low after downgrading for imprecision because of wide confidence intervals (2 levels). Tsifetaki 2003 reported that "four patients had mild headache, of whom three also presented with nausea, vomiting, and sweating" (p 1205) and that "one patient in the inferior puncta occlusion group had blepharitis and was withdrawn from the study" (p 1204).
Qiu 2012 reported little or no difference in punctate epithelial keratopathy between the intervention groups (RR 1.33, 95% CI 0.57 to 3.12; eyes = 28; Analysis 4.12).
Feng 2011, Qiu 2013, and Zhou 2016 did not report adverse outcomes.
5. Punctal plugs in the upper versus lower puncta
Three trials compared upper versus lower punctal plug placement (Chen 2010; Farrell 2003; Kaido 2012). Farrell 2003 compared participants with lower puncta occlusion only, with participants receiving a combination of upper and lower puncta occlusion. Chen 2010 and Farrell 2003 investigated collagen punctal plugs while Kaido 2012 included silicone punctal plugs. Chen 2010 reported only 10 days of follow‐up, so we present no quantitative data for this comparison.
Symptomatic improvement
We judged the certainty of the evidence to be low after downgrading for imprecision of results as the confidence interval was wide (1 level) and potential bias as there was unclear risk of selection, performance, detection, attrition, and reporting bias (1 level). None of the studies reported this outcome beyond one month of follow‐up. Chen 2010 did not report this outcome.
Farrell 2003 reported median McMonnies symptom scores for participants receiving collagen punctal plugs in the lower puncta versus the upper and lower puncta for the right and left eyes separately. While study investigators of Farrell 2003 noted using a modified McMonnies questionnaire, they did not publish the modified questionnaire, but did note that higher scores denote increased symptom reports. The median (range) values for the right eye at baseline, 5 days, and 12 days post‐occlusion were 7 points (3 to 12), 3 points (0 to 8), and 3 points (0 to 10), respectively, for participants with collagen plugs in their lower puncta and 7 points (6 to 13), 3 points (0 to 11) and 3 points (0 to 7), respectively, for participants with collagen plugs in their lower and upper puncta. The authors stated that "the median symptom score reduced significantly from 7 to 3 between baseline and day 5," but "there was no significant shift in symptom score between days 5 and 12 (Wilcoxon signed‐rank test)" (p 3).
At one month, Kaido 2012 noted little or no difference in symptomatic improvement when comparing punctal plugs in the upper versus lower puncta (RR 1.07, 95% CI 0.85 to 1.36; eyes = 43; Analysis 5.1). Kaido 2012 reported the number of participants who expressed satisfaction with resolution of symptoms or satisfaction with resolution of symptoms despite epiphora.
Ocular surface staining
We judged the certainty of the evidence to be low after downgrading for imprecision of results as the confidence interval was wide (1 level) and potential bias as there was unclear risk of selection, performance, detection, attrition, and reporting bias (1 level). Chen 2010 and Kaido 2012 measured ocular surface staining using a sodium fluorescein strip graded from 0 to 3 points, with 0 indicating no staining and 3 indicating the most intense staining.
At one month, Kaido 2012 reported the means ± standard deviation of the upper and lower puncta group to be 0.4 ± 0.9 points and 0.0 ± 0.0 points; therefore, we were not able to estimate the mean difference. None of the trials reported this outcome at two weeks or for long‐term follow‐up. Farrell 2003 did not report this outcome at any follow‐up time.
Aqueous tear production
We judged the certainty of the evidence to be low after downgrading for imprecision of results as the confidence interval was wide (1 level) and potential bias as there was unclear risk of selection, performance, detection, attrition, and reporting bias (1 level). Chen 2010 measured aqueous tear production using a Schirmer test with anesthesia, but Kaido 2012 used a Schirmer test without anesthesia (mm/5 min).
At one month, Kaido 2012 reported slightly less aqueous tear production in the peripheral cornea when comparing punctal plugs in the upper puncta to punctal plugs in the lower puncta (MD −4.50 mm/5 min, 95% CI −8.63 to −0.37; eyes = 43; Analysis 5.2). None of the trials reported this outcome at two weeks or for long‐term follow‐up. Farrell 2003 did not report this outcome.
Tear film stability
We judged the certainty of the evidence to be low after downgrading for imprecision of results as the confidence interval was wide (1 level) and potential bias as there was unclear risk of selection, performance, detection, attrition, and reporting bias (1 level). Both Chen 2010 and Kaido 2012 reported tear film stability via assessment with sodium fluorescein.
At one month, Kaido 2012 noted little or no difference in tear film break‐up time between punctal plugs in the upper versus lower puncta (MD −0.10 seconds, 95% CI −1.73 to 1.53; eyes = 43; Analysis 5.3). None of the trials reported this outcome at two weeks or at long‐term follow‐up. Farrell 2003 did not report this outcome.
Artificial tear use
None of the studies reported this outcome.
Adverse outcomes
We judged the certainty of the evidence to be low after downgrading for imprecision of results as the confidence interval was wide (1 level) and potential bias as there was unclear risk of selection, performance, detection, attrition, and reporting bias (1 level). Chen 2010 reported that "no complication was observed in dry eye patients or control subjects during the period of this study." It is unclear which complications were ana lysed. Kaido 2012 and Farrell 2003 did not report this outcome.
6. Acrylic punctal plugs versus silicone punctal plugs
Burgess 2008 was the only trial that compared acrylic punctal plugs with silicone punctal plugs; the investigators reported outcomes at approximately 11 weeks of follow‐up. We judged the certainty of the evidence for all outcomes to be low after downgrading for imprecision as the confidence interval was wide (2 levels) and risk of bias as selection, attrition and reporting bias were judged to be unclear (1 level). The study investigators did not report this outcome at two weeks or four weeks.
Symptomatic improvement
Burgess 2008 reported no difference in mean subjective symptom score when comparing silicone and acrylic punctal plugs. The study investigators used a "subjective symptom scoring was assessed for each eye by using standard, vertical, nonanchored visual analog scales 10 cm in length for symptoms of dryness, grittiness, foreign body sensation, pain, stinging, burning, and itching. After rating symptoms individually, we summed scores to give the total symptom score." We assumed the score ranged from 0 to 70 points, where a lower score was more advantageous. At baseline and approximately 11 weeks follow‐up, mean scores ± standard deviations were 29.6 points ± 16.9 and 21.0 points ± 14.5, respectively, among participants with silicone plugs, and 38.9 points ± 16.7 and 21.9 points ± 18.8 among participants with acrylic plugs group (MD 0.90 points, 95% CI −6.94 to 8.74; eyes = 36; Analysis 6.1).
Ocular surface staining
Burgess 2008 found no differences in Rose Bengal and sodium fluorescein ocular surface staining when comparing silicone versus acrylic punctal plugs (Rose Bengal baseline versus approximately 11 weeks follow‐up on a scale of 0 to 3 points: MD 0.45 points, 95% CI −0.09 to 0.99; eyes = 36; Analysis 6.2.1; sodium fluorescein baseline versus approximately 11 weeks follow‐up on a scale of 0 to 3 points: MD 0.43 points, 95% CI −1.61 to 2.47; eyes = 36; Analysis 6.2.2).
Aqueous tear production
Similarly, Burgess 2008 found no difference in mean Schirmer test results (without topical anesthesia) when comparing silicone versus acrylic punctal plugs (MD 1.07 mm, 95% CI −1.62 to 3.76; eyes = 36; Analysis 6.3). However, Burgess 2008 did not report the duration of the Schirmer test.
Tear film stability
Burgess 2008 reported no difference in tear film break‐up time when comparing silicone versus acrylic punctal plugs (MD 0.36 seconds, 95% CI −1.22 to 1.94; eyes = 36; Analysis 6.4).
Artificial tear use
In the Burgess 2008 study, silicone and acrylic punctal plugs reduced the use of artificial tears in 10 (55.6%) and 11 (61.1%) participants, respectively, but the difference in mean reduction in artificial tear use (as measured by the symptom score) was not statistically significant (mean 1.55 applications, 95% CI −1.50 to 4.60; P = 0.27, t test).
Adverse outcomes
Burgess 2008 reported that 1 of 18 eyes receiving an acrylic punctal plug experienced epiphora, 1 of 18 eyes receiving a silicone punctal plug eye experienced intermittent ocular irritation, and 2 eyes in the silicone punctal plug group and 1 in the acrylic punctal plug experienced temporary foreign body sensation.
7. Intracanalicular punctal plugs versus silicone punctal plugs
Rabensteiner 2013 was the only trial to compare intracanalicular punctal plugs with silicone punctal plugs. For all outcomes, we downgraded the evidence two levels to very low‐certainty because of wide confidence intervals indicating imprecision of effect estimates (2 levels) and high risk of attrition bias (1 level).
Symptomatic improvement
Rabensteiner 2013 reported subjective dry eye symptoms for each eye. Investigators measured soreness, scratching, grittiness, dryness and/or burning using a 100 mm visual analog scale (VAS; 0 mm = no symptoms, 100 mm = maximum intensity). At three months follow‐up, moderate‐certainty evidence showed little or no difference in symptomatic improvement score (MD −3.10 mm, 95% CI −14.97 to 8.77; eyes = 57; Analysis 7.1).
Ocular surface staining
At three months follow‐up, moderate‐certainty evidence showed little or no difference in ocular surface staining for Rose Bengal on the van Bijsterveld scale of 0 to 9 points (MD 0.20 points, 95% CI −0.71 to 1.11; Analysis 7.2.1) and fluorescein of a scale from 0 to 4 points (MD 0.40 points, 95% CI −0.04 to 0.84; Analysis 7.2.2). Fluorescein was graded using zero points indicates no staining, one point less than one‐third, two points less than two thirds, and three points more than two‐thirds staining of the cornea.
Aqueous tear production
At three months follow‐up, moderate‐certainty evidence showed little or no difference in aqueous tear production (MD −0.70 mm/5 min, 95% CI −3.46 to 2.06; Analysis 7.3).
Tear film stability
At three months follow‐up, moderate‐certainty evidence showed little or no difference in tear film stability (MD 0.80 seconds, 95% CI −0.00 to 1.60; Analysis 7.4).
Artificial tear use
At three months follow‐up, moderate‐certainty evidence showed little or no difference in daily artificial tear use (MD −1.30 applications, 95% CI −4.04 to 1.44; Analysis 7.5).
Adverse outcomes
No studies reported adverse events.
8. Collagen punctal plugs versus silicone punctal plugs
Altan‐Yaycioglu 2005 and Brissette 2015 compared collagen punctal plugs with silicone punctal plugs. Altan‐Yaycioglu 2005 did not report any review outcomes at two weeks, one month, or at long‐term follow‐up. Brissette 2015 reported symptomatic improvement (measured using the Canadian Dry Eye Assessment), aqueous tear production (Schirmer I without anesthesia), and tear film stability at one month and at long‐term follow‐up (six months). The Canadian Dry Eye Assessment range from 0 to 48 points; where less than 5 points was normal, 5 to 15 points was mild, 20 to 25 points was moderate, 30 to 48 points was severe. However, the study investigators did not report standard deviations or the exact P value at the one month follow‐up. At the long‐term follow‐up, we used the reported group means and exact P values to compute the MD and respective 95% CI.
We judged the certainty of the evidence for all outcomes to be very low after downgrading for imprecision of estimates as the confidence interval were wide or clinically not important (2 levels) and risk of bias as we judged selection, performance, detection, attrition, and reporting bias to be unclear (1 level).
Symptomatic improvement
At long‐term follow‐up, Brissette 2015 reported little or no difference between the groups for Canadian Dry Eye Assessment scores on a scale of 0 to 48 points (MD 0.81 points, 95% CI −2.94 to 4.56; eyes = 50).
Ocular surface staining
At long‐term follow‐up, Brissette 2015 reported both sodium fluorescein staining scores and lissamine green staining scores. There were few or no between‐group differences for fluorescein staining score on a scale of 0 to 4 points (MD −0.76 points, 95% CI −18.5 to 17.0) and for lissamine green score on a scale of 0 to 3 points (MD 0.03 points, 95% CI −0.15 to 0.21; eyes = 50).
Aqueous tear production
At long‐term follow‐up, Brissette 2015 reported little or no difference between groups for the Schirmer test I without anesthesia (MD 0.67 mm, 95% CI −17.28 to 18.62; eyes = 50).
Tear film stability
At long‐term follow‐up, Brissette 2015 reported little or no between‐group differences for tear break‐up time (MD 0.21 seconds, 95% CI −1.81 to 2.23; eyes = 50).
Artificial tear use
At long‐term follow‐up, Brissette 2015 reported little or no difference between groups in daily frequency of artificial tear applications (MD −0.06 applications/day, 95% CI −0.23 to 0.12; eyes = 50).
Adverse outcomes
Altan‐Yaycioglu 2005 stated that "none of the patients developed adverse events related to the procedure" (p 88.e3). Likewise, Brissette 2015 reported that "there were no additional significant differences between groups and no plug complications reported" (p 238).
Discussion
Summary of main results
Despite the inclusion of 18 trials, only a maximum of two studies contributed outcome data at any given follow‐up time point across eight comparisons due to significant study heterogeneity. Punctal plugs did not show consistent symptomatic improvement over the observation group at 2 weeks, 1 month, or at 2 to 12 months follow‐up. When comparing symptomatic improvement in different types of punctal plugs at long‐term follow‐up, there was little or no difference between silicone and collagen or acrylic punctal plugs. Punctal plugs may be more effective than oral pilocarpine, but artificial tears may be more effective than punctal plugs for treating dry eye signs and symptoms. The location of the occlusion (lower versus upper puncta) resulted in little or no difference in symptomatic improvement. Overall, this review update includes new evidence, though we cannot draw strong conclusions from the current body of evidence.
Adverse outcomes
Tsifetaki 2003 was the only study to report on adverse outcomes with collagen plugs only; 1 participant of 28 discontinued the study due to a local infection. The most common adverse outcomes in silicone plug studies were: spontaneous plug loss (6 of 28 in Mansour 2007, 6 of 20 in Burgess 2008); epiphora (1 case each in Burgess 2008 and Nava‐Castaneda 2003, 4 in Farrell 2003); ocular irritation or foreign body sensation (3 cases in Burgess 2008); and local inflammatory reaction to silicone (1 case in Mansour 2007). In addition, Mansour 2007 reported one case of corneal melting and perforation, and Nava‐Castaneda 2003 reported one instance of corneal ulceration. The trial investigators believed that neither of these serious conditions was related to the punctal plugs.
Overall completeness and applicability of evidence
We included 18 trials, but no more than two studies reported the same review outcome at any review follow‐up time points across eight comparisons of interventions. Meta‐analysis was not possible for the primary review outcome thus the evidence regarding punctal occlusion for dry eye‐related symptoms is incomplete.
The certainty of the evidence ranged from moderate to very low, as we frequently downgraded the evidence for the high risk of bias or imprecision in effect estimates.
Potential biases in the review process
We used standard Cochrane methods to conduct this review and are unaware of any potential bias.
Agreements and disagreements with other studies or reviews
Many investigators have published reviews of punctal plug use for dry eye syndrome (Hamano 2005; Marcet 2015; Yellepeddi 2015; Jehangir 2016). Nevertheless, these reviews do not include meta‐analyses of randomized controlled trials or other comparative studies. Hamano 2005 and Yellepeddi 2015 was a general review of punctal plug types and the ways in which punctal plugs are used for treating dry eye. Marcet 2015 was a narrative review of 27 studies, which included both case series and randomized trials. Jehangir 2016 provided an extensive review of the available punctal plug materials, designs, and uses, as well as the complications associated with punctal plugs treatment. Overall, the authors concluded that punctal plugs were an effective and relatively safe means for treating dry eye.
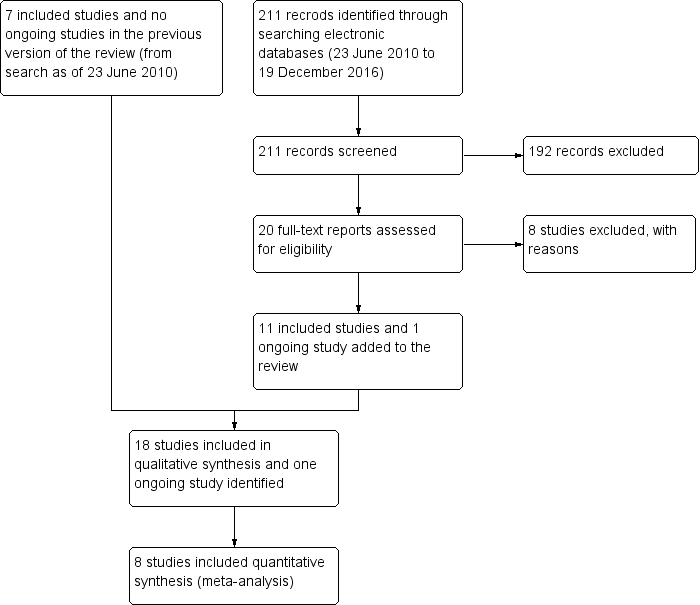

Risk of bias summary: review authors' judgements about each risk of bias item for each included study.

Comparison 1 Punctal plug versus observation, Outcome 1 Symptomatic improvement at 1 month.

Comparison 1 Punctal plug versus observation, Outcome 2 Symptomatic improvement (long‐term).

Comparison 1 Punctal plug versus observation, Outcome 3 Ocular surface staining at 2 weeks.

Comparison 1 Punctal plug versus observation, Outcome 4 Ocular surface staining at 1 month.
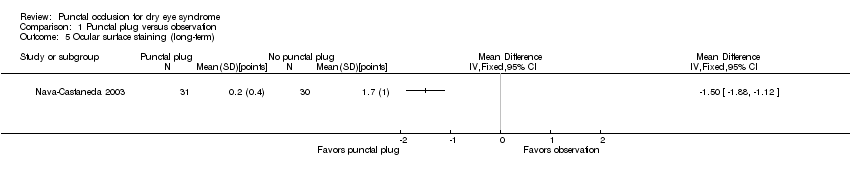
Comparison 1 Punctal plug versus observation, Outcome 5 Ocular surface staining (long‐term).

Comparison 1 Punctal plug versus observation, Outcome 6 Tear film stability at 1 month.

Comparison 1 Punctal plug versus observation, Outcome 7 Tear film stability (long‐term).
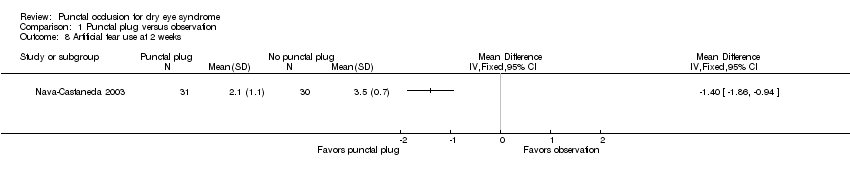
Comparison 1 Punctal plug versus observation, Outcome 8 Artificial tear use at 2 weeks.

Comparison 1 Punctal plug versus observation, Outcome 9 Artificial tear use at 1 month.

Comparison 1 Punctal plug versus observation, Outcome 10 Artificial tear use (long‐term).

Comparison 2 Punctal plugs versus cyclosporine, Outcome 1 Ocular surface staining at 1 month.

Comparison 2 Punctal plugs versus cyclosporine, Outcome 2 Ocular surface staining at 6 months.

Comparison 2 Punctal plugs versus cyclosporine, Outcome 3 Aqueous tear production at 1 month.

Comparison 2 Punctal plugs versus cyclosporine, Outcome 4 Aqueous tear production at 6 months.

Comparison 2 Punctal plugs versus cyclosporine, Outcome 5 Artificial tear use at 1 month.

Comparison 2 Punctal plugs versus cyclosporine, Outcome 6 Artificial tear use at 6 months.

Comparison 3 Punctal plugs versus oral pilocarpine, Outcome 1 Symptomatic improvement at 3 months.
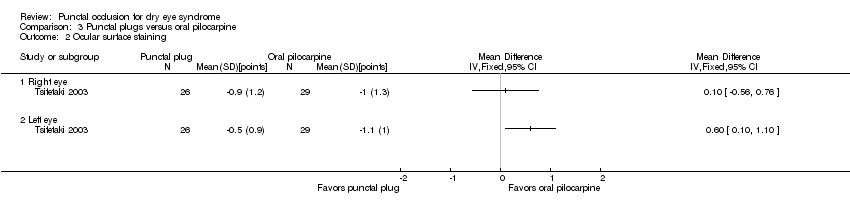
Comparison 3 Punctal plugs versus oral pilocarpine, Outcome 2 Ocular surface staining.

Comparison 3 Punctal plugs versus oral pilocarpine, Outcome 3 Aqueous tear production.
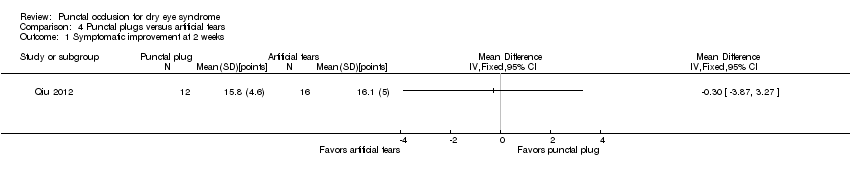
Comparison 4 Punctal plugs versus artificial tears, Outcome 1 Symptomatic improvement at 2 weeks.
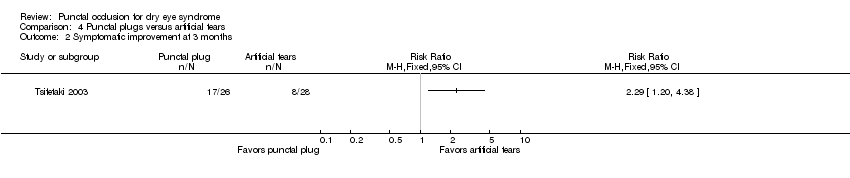
Comparison 4 Punctal plugs versus artificial tears, Outcome 2 Symptomatic improvement at 3 months.
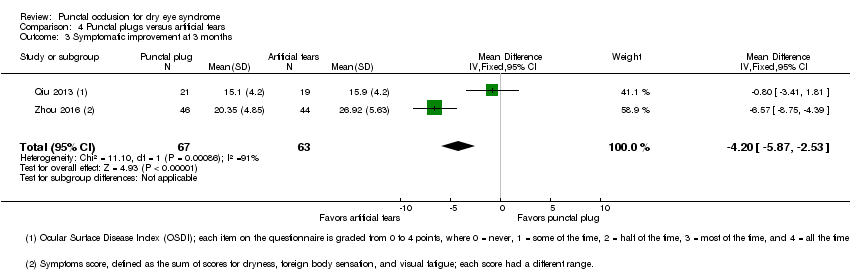
Comparison 4 Punctal plugs versus artificial tears, Outcome 3 Symptomatic improvement at 3 months.

Comparison 4 Punctal plugs versus artificial tears, Outcome 4 Ocular surface staining at 2 weeks.

Comparison 4 Punctal plugs versus artificial tears, Outcome 5 Ocular surface staining at 3 months (Rose Bengal).

Comparison 4 Punctal plugs versus artificial tears, Outcome 6 Ocular surface staining at 3 months (fluorescein).
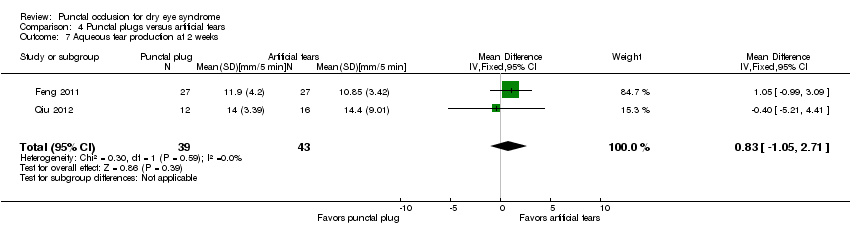
Comparison 4 Punctal plugs versus artificial tears, Outcome 7 Aqueous tear production at 2 weeks.
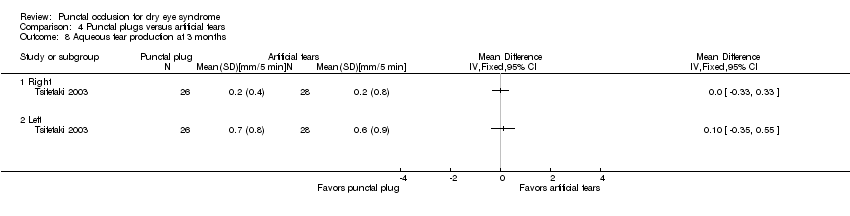
Comparison 4 Punctal plugs versus artificial tears, Outcome 8 Aqueous tear production at 3 months.

Comparison 4 Punctal plugs versus artificial tears, Outcome 9 Aqueous tear production at 3 months.

Comparison 4 Punctal plugs versus artificial tears, Outcome 10 Tear film stability at 2 weeks.

Comparison 4 Punctal plugs versus artificial tears, Outcome 11 Tear film stability at 3 months.

Comparison 4 Punctal plugs versus artificial tears, Outcome 12 Punctate epithelial keratopathy.

Comparison 5 Punctal plugs in the upper versus lower puncta, Outcome 1 Symptomatic improvement at 1 month.

Comparison 5 Punctal plugs in the upper versus lower puncta, Outcome 2 Aqueous tear production at 1 month.

Comparison 5 Punctal plugs in the upper versus lower puncta, Outcome 3 Tear film stability at 1 month.
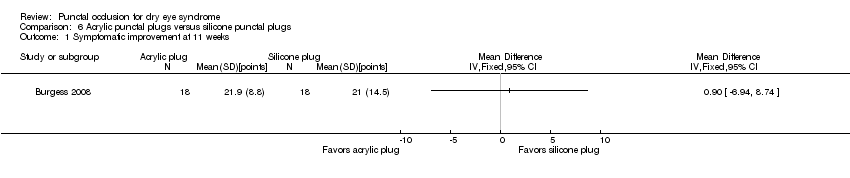
Comparison 6 Acrylic punctal plugs versus silicone punctal plugs, Outcome 1 Symptomatic improvement at 11 weeks.

Comparison 6 Acrylic punctal plugs versus silicone punctal plugs, Outcome 2 Ocular surface staining at 11 weeks.
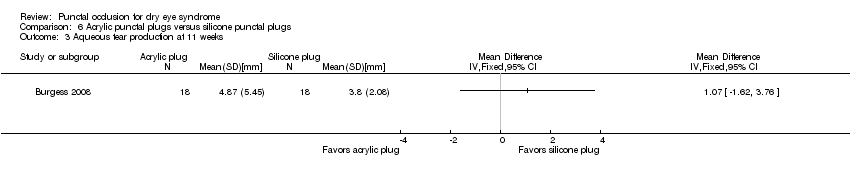
Comparison 6 Acrylic punctal plugs versus silicone punctal plugs, Outcome 3 Aqueous tear production at 11 weeks.

Comparison 6 Acrylic punctal plugs versus silicone punctal plugs, Outcome 4 Tear film stability at 11 weeks.
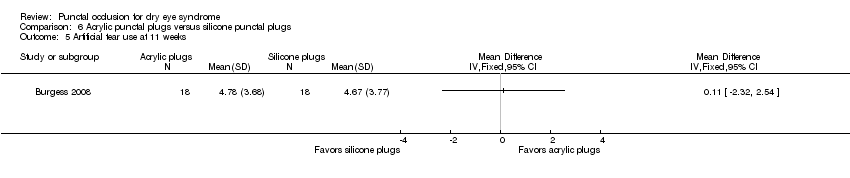
Comparison 6 Acrylic punctal plugs versus silicone punctal plugs, Outcome 5 Artificial tear use at 11 weeks.
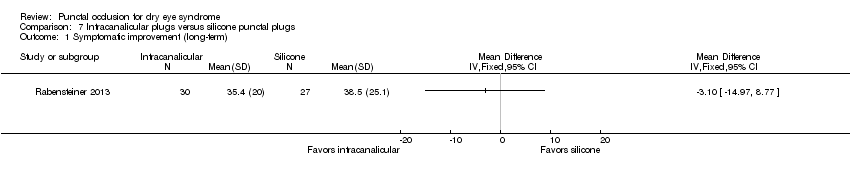
Comparison 7 Intracanalicular plugs versus silicone punctal plugs, Outcome 1 Symptomatic improvement (long‐term).
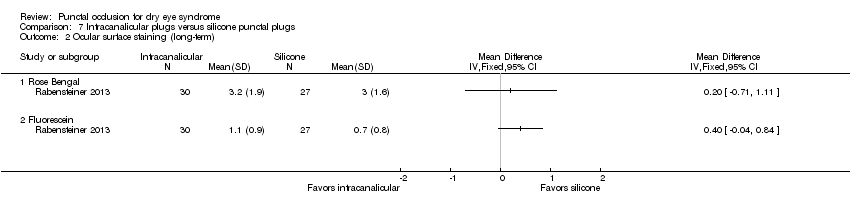
Comparison 7 Intracanalicular plugs versus silicone punctal plugs, Outcome 2 Ocular surface staining (long‐term).
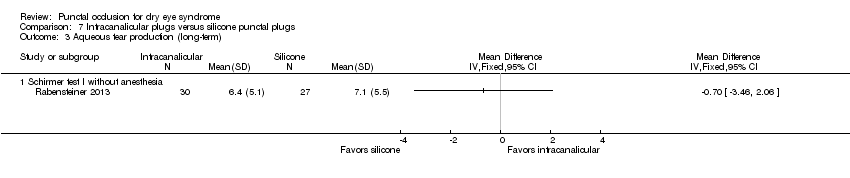
Comparison 7 Intracanalicular plugs versus silicone punctal plugs, Outcome 3 Aqueous tear production (long‐term).

Comparison 7 Intracanalicular plugs versus silicone punctal plugs, Outcome 4 Tear film stability (long‐term).

Comparison 7 Intracanalicular plugs versus silicone punctal plugs, Outcome 5 Artificial tear use (long‐term).
| Punctal plugs compared with no punctal plugs for dry eye syndrome | ||||||
| Patient or population: adults with dry eye syndrome Settings: eye clinics Intervention: silicone or collagen punctal plugs Comparison: no punctal plugs (observation or sham treatment) | ||||||
| Outcomes | Illustrative comparative risks* (95% CI) | Relative effect | No of participants | Certainty of the evidence | Comments | |
| Assumed risk | Corresponding risk | |||||
| No punctal plugs | Punctal plugs | |||||
| Symptomatic improvement Follow‐up: long‐term* A lower score favors punctal plugs | See comments | See comments | — | 89 (2 RCT) | ⊕⊝⊝⊝ | Mansour 2007 reported little or no difference in Ocular and Oral Symptoms score, which ranged from 0 to 10 points (MD ‐0.46 points, 95% CI ‐1.24 to 0.32; eyes = 26). Nava‐Castaneda 2003 reported a slight decrease in symptom score, assumed to range from 0 to 105 points, but it does not seem to be clinically important (MD ‐2.62 points, 95% CI ‐3.32 to ‐1.93; eyes = 61). Yung 2012 reported little or no difference in dry eye symptom score, ranging from 0 to 3 points (MD ‐0.75 points, 95% CI ‐1.53 to 0.02; eyes = 28) |
| Ocular surface staining Follow‐up: long‐term* A higher value is less advantageous Both Rose Bengal and fluorescein staining scores ranged from 0 to 4, where 0 represented no staining and 4 represented heavy staining | The mean fluorescein staining score was 1.70 | MD 1.50 lower than observation group (1.88 to 1.12 lower (better) than observation group) | — | 61 (1 RCT) | ⊕⊕⊝⊝ | — |
| Aqueous tear production Follow‐up: long‐term* A higher value is more advantageous | See comments | See comments | — | 28 (1 RCT) | ⊕⊕⊝⊝ | Yung 2012 did not provide quantitative data, but reported that "Schirmer values tended to increase in the plug group after plug insertion; however, the changes did not reach significance" |
| Tear film stability Follow‐up: 6 months A higher value is more advantageous | The mean tear film stability was 2.34 seconds | MD 1.93 seconds longer than observation group (0.67 to 3.20 seconds longer (better) than observation group) | — | 28 (1 RCT) | ⊕⊕⊝⊝ | — |
| Artificial tear use Follow‐up: long‐term* Fewer applications favors punctal plugs | The mean number of applications was 3.6 applications | MD 2.70 fewer applications than observation group (3.11 to 2.29 fewer applications than observation group) | — | 61 (1 RCT) | ⊕⊕⊝⊝ | — |
| Adverse events Follow‐up: end of study | See comments | See comments | — | 146 | ⊕⊝⊝⊝ | Slusser 1998: all adverse events occurred in the punctal plug group, reported 23/28 participants had epiphora, 3/28 participants reported itching in area of plug placement, 1/28 participants had tenderness and swelling of lids with mucous discharge. Spontaneous plug loss occurred in 6/20 eyes with silicone punctal plugs in the Mansour 2007. One or 31 participants receiving collagen and silicone punctal plugs experienced epiphora in the Nava‐Castaneda 2003 study. |
| *The basis for the assumed risk is the control group risk across studies. The corresponding risk (and its 95% confidence interval) is based on the assumed risk in the comparison group and the relative effect of the intervention (and its 95% CI). | ||||||
| GRADE Working Group grades of evidence | ||||||
| aDowngraded two levels for methodological heterogeneity. cDowngraded one level for imprecision as indirectness of evidence because the confidence interval was either wide or clinically not important. dDowngraded one level for high risk of attrition bias. eDowngraded two levels for high risk of performance, detection, and attrition bias. fDowngraded two levels for attrition bias. gDowngraded one level for sparse and inconsistent data, particularly with respect to epiphora. *We defined long‐term follow‐up as between two months and one year. | ||||||
| Punctal plugs compared with cyclosporine for dry eye syndrome | |||||
| Patient or population: adults with dry eye syndrome Settings: eye clinics Intervention: punctal plugs Comparison: cyclosporine | |||||
| Outcomes | Illustrative comparative risks* (95% CI) | No of participants | Certainty of the evidence | Comments | |
| Assumed risk | Corresponding risk | ||||
| Cyclosporine | Punctal plugs | ||||
| Symptomatic improvement | Study investigators did not report this outcome at 2 weeks, 1 month, or long‐term. | ||||
| Ocular surface staining Follow‐up: 6 months Any value greater than zero is abnormal Range: 0 to 4 points; 0 = no staining, 1 = staining of the nasal conjunctiva only, 2 = staining of both the nasal and temporal conjunctiva, 3 = peripheral corneal staining, 4 = central corneal staining | See comments | See comments | 20 (1 RCT) | ⊕⊝⊝⊝ | The study investigators of Roberts 2007 stated: "there was greater improvement in conjunctival staining with cyclosporine or the combination than with plugs alone." It was unclear whether Rose Bengal or fluorescein staining was used. Also, the study investigators did not specify the time point and so we assumed that their statement applies for 1, 3, and 6 months follow‐up. |
| Aqueous tear production Follow‐up: 6 months A higher value is more advantageous | The mean change in aqueous tear production was 1.5 mm/3 min lower than baseline | MD 0.80 mm/3 min higher than cyclosporine group (0.74 lower (better) to 2.34 higher (worse) than cyclosporine group) | 20 | ⊕⊝⊝⊝ | The study investigators of Roberts 2007 stated: "There was a greater increase in Schirmer score with plugs, either alone or in combination with cyclosporine." The study investigators did not specify the for which time point and so we assumed that their statement applies for 1, 3, and 6 months follow‐up. |
| Tear film stability Follow‐up: 6 months | Study investigators did not report this outcome at 2 weeks, 1 month, or long‐term. | ||||
| Artificial tear use Follow‐up: 6 months range: 1‐5 applications Fewer applications favors punctal plugs | The mean change in number of applications from baseline was 3.2 more applications than baseline | MD 1.10 applications more than baseline (0.04 fewer to 2.24 more applications than cyclosporine group) | 20 | ⊕⊝⊝⊝ | The study investigators of Roberts 2007 stated: "decreased frequency of artificial tears was greatest for combination therapy and least for punctal plugs." The study investigators did not specify the for which time point and so we assumed that their statement applies for 1, 3, and 6 months follow‐up. |
| Adverse events Follow‐up: end of study | See comments | See comments | 22 | ⊕⊝⊝⊝ | Roberts 2007 reported 1/11 participants experienced plug displacement in the plug group, while 1/11 participants experienced a burning sensation in the cyclosporine group. |
| *The basis for the assumed risk is the control group risk across studies. The corresponding risk (and its 95% confidence interval) is based on the assumed risk in the comparison group and the relative effect of the intervention (and its 95% CI). | |||||
| GRADE Working Group grades of evidence | |||||
| aDowngraded one level for imprecision of results (wide confidence intervals). bDowngraded two levels for high risk of detection, performance, attrition, and other bias. *We defined long‐term follow‐up as between two months and one year. | |||||
| Punctal plugs compared with oral pilocarpine for dry eye syndrome | ||||||
| Patient or population: adults with dry eye syndrome Settings: eye clinics Intervention: punctal plugs Comparison: oral pilocarpine | ||||||
| Outcomes | Illustrative comparative risks* (95% CI) | Relative effect | No of eyes | Certainty of the evidence | Comments | |
| Assumed risk | Corresponding risk | |||||
| Oral pilocarpine | Punctal plugs | |||||
| Symptomatic improvement Follow‐up: 3 months The study investigators defined improvements in subjective ocular symptoms as an improvement of >55 mm for responses to the eye questionnaire on a 100 mm visual analog scale. A RR less than one favors punctal plugs. | 897 per 1000 | 619 per 1000 (439 to 852) | RR 0.69 (0.49 to 0.95) | 55 | ⊕⊝⊝⊝ | ‐ |
| Ocular surface staining Follow‐up: 3 months A higher value is less advantageous Range: van Bijsterveld schema, which is on a scale of 0 to 9 points | The mean change in Rose Bengal staining score was 1.00 lower (better) than baseline in the right eye | MD 0.10 higher (worse) than oral pilocarpine group (0.56 lower (better) to 0.76 higher (worse) than oral pilocarpine group) | — | 55 | ⊕⊝⊝⊝ | — |
| The mean change in Rose Bengal staining score was 1.10 lower (better) than baseline in the left eye | MD 0.60 higher (worse) than oral pilocarpine group (0.10 to 1.10 higher (worse) than oral pilocarpine group) | — | 55 | ⊕⊝⊝⊝ | — | |
| Aqueous tear production Follow‐up: 3 months A higher value more advantageous | The mean change in aqueous tear production was 0.30 mm/5 min higher (better) than baseline in the right eye | MD 0.10 mm/5 min lower (worse) than oral pilocarpine group (0.53 mm/5 min lower (worse) to 0.33 mm/5 min higher (better) than oral pilocarpine group) | — | 55 | ⊕⊝⊝⊝ | — |
| The mean change in aqueous tear production was 1.2 mm/5 min higher (better) than baseline in the left eye | MD 0.50 mm/5 min lower (worse) than oral pilocarpine group (1.06 mm/5 min lower (worse) to 0.06 mm/5 min higher (better) than oral pilocarpine group) | — | 55 | — | ||
| Tear film stability | Study investigators did not report this outcome. | |||||
| Artificial tear use | Study investigators did not report this outcome. | |||||
| Adverse events Follow‐up: 3 months | See comments | See comments | — | 55 | ⊕⊝⊝⊝ | Tsifetaki 2003 reported: "commonly reported adverse events were headache, increased sweating,nausea, and vomiting in the pilocarpine group, while 1 patient in the inferior puncta occlusion group had blepharitis and was withdrawn from the study." pg 1204 |
| *The basis for the assumed risk is the control group risk across studies. The corresponding risk (and its 95% confidence interval) is based on the assumed risk in the comparison group and the relative effect of the intervention (and its 95% CI). | ||||||
| GRADE Working Group grades of evidence | ||||||
| aDowngraded two levels for high risk of performance and detection bias as the participant and outcome assessors were not masked to the treatment groups and the self‐reported symptomatic improvement might be biased. *We defined long‐term follow‐up as between two months and one year. | ||||||
| Punctal plugs compared with artificial tears for dry eye syndrome | ||||||
| Patient or population: adults with dry eye syndrome Settings: eye clinics Intervention: punctal plugs Comparison: artificial tears | ||||||
| Outcomes | Illustrative comparative risks* (95% CI) | Relative effect | No of eyes | Certainty of the evidence | Comments | |
| Assumed risk | Corresponding risk | |||||
| Artificial tears | Punctal plugs | |||||
| Symptomatic improvement Follow‐up: 3 months The study investigators defined improvements in subjective ocular symptoms as an improvement of >55 mm for responses to the eye questionnaire on a 100 mm visual analog scale. A RR greater than one favors punctal plugs. Both studies used different symptomatic improvement score; one study used the Ocular Surface Disease Index that ranged from 0 points = never to 4 points = all the time. The second study use the sum of scores for dryness, foreign body sensation, and visual fatigue; each score had a different range, but a higher score corresponded to more symptoms. | 286 per 1000 | 654 per 1000 (343 to 1000) | RR 2.29 (1.2 to 4.38) | 54 (1 RCT) | ⊕⊝⊝⊝ | — |
| The mean symptomatic improvement score ranged from 15.9 to 26.92 | SMD 0.88 lower (better) than artificial tears group (1.24 to 0.51 lower (better) than artificial tears group) | — | 130 (2 RCTs) | — | ||
| Ocular surface staining Follow‐up: 3 months Range: 0 = absent; 1 = trace; 2 = mild; 3 = moderate; 4 = severe A higher value is worse | The mean change in Rose Bengal staining score was 1.0 point lower (better) than baseline in the right eye | MD 0.10 points higher (worse) than artificial tears group (0.56 lower (better) to 0.76 higher (worse) than artificial tears group) | — | 55 | ⊕⊕⊝⊝ | — |
| The mean change in Rose Bengal staining score was 1.1 lower (better) than baseline in the left eye | MD 0.60 points higher (worse) than artificial tears group (0.10 to 1.10 higher (worse) than artificial tears group) | — | 55 | — | ||
| Aqueous tear production Follow‐up: long‐term* A higher value is more advantageous | The mean change in aqueous tear production was 0.2 mm/5 min higher (better) than baseline in the right eye | MD 0.00 mm/5 min higher (better) than artificial tears group (0.33 mm/5 min lower (worst) to 0.33 mm/5 min higher (better) than artificial tears group) | — | 54 | ⊕⊕⊝⊝ | — |
| The mean change in aqueous tear production was 0.6 mm/5 min higher (better) than baseline in the left eye | MD 0.10 mm/5 min higher (better) than artificial tears group (0.35 mm/5 min lower (worst) to 0.55 mm/5 min higher (better) than artificial tears group) | — | 54 | — | ||
| The mean aqueous tear production ranged from 4.89 to 8.95 mm/ 5 min | MD 2.16 mm/ 5 min higher (better) (1.41 to 2.90 mm/ 5 min higher (better) than artificial tears group) | — | 130 (2 RCTs) | — | ||
| Tear film stability Follow‐up: long‐term* A higher value is more advantageous | The mean tear film stability ranged from 3.24 to 6 seconds | MD 1.02 seconds longer (better) than artificial tears group (0.60 to 1.44 seconds longer (better) than artificial tears group) | — | 130 | ⊕⊕⊕⊝ | — |
| Artificial tear use | Outcome not relevant to this comparison | |||||
| Adverse events (punctate epithelial keratopathy) Follow‐up: end of study | 375 per 1000 | 499 per 1000 (214 to 1000) | RR 1.33 (0.57 to 3.12) | 54 | ⊕⊕⊝⊝ | Tsifetaki 2003 reported: "four patients had mild headache, of whom three also presented with nausea, vomiting, and sweating" (p 1205) and "one patient in the inferior puncta occlusion group had blepharitis and was withdrawn from the study" (p 1204) |
| *The basis for the assumed risk is the control group risk across studies. The corresponding risk (and its 95% confidence interval) is based on the assumed risk in the comparison group and the relative effect of the intervention (and its 95% CI). | ||||||
| GRADE Working Group grades of evidence | ||||||
| aDowngraded two levels for high risk of performance and detection bias as participants and outcome assessors were unmasked to the assigned treatment group and might influence the self‐reported symptomatic improvement. *We defined long‐term follow‐up as between two months and one year. | ||||||
| Punctal plugs occluded in the upper puncta compared with the lower puncta for dry eye syndrome | ||||||
| Patient or population: adults with dry eye syndrome Settings: eye clinics Intervention: punctal plugs occluded in the upper puncta Comparison: punctal plugs occluded in the lower puncta | ||||||
| Outcomes | Illustrative comparative risks* (95% CI) | Relative effect | No of eyes | Certainty of the evidence | Comments | |
| Assumed risk | Corresponding risk | |||||
| Lower puncta | Upper puncta | |||||
| Symptomatic improvement Follow‐up: long‐term* | Study investigators did not report this outcome. | |||||
| Ocular surface staining Follow‐up: long‐term* | Study investigators did not report this outcome. | |||||
| Aqueous tear production Follow‐up: long‐term* | Study investigators did not report this outcome. | |||||
| Tear film stability Follow‐up: long‐term* | Study investigators did not report this outcome. | |||||
| Artificial tear use | Study investigators did not report this outcome. | |||||
| Adverse events | See comments | See comments | See comments | 40 | ⊕⊝⊝⊝ | Chen 2010 reported "no complication was observed in dry eye patients or control subjects during the period of this study." It is unclear which complications were collected. |
| *The basis for the assumed risk is the control group risk across studies. The corresponding risk (and its 95% confidence interval) is based on the assumed risk in the comparison group and the relative effect of the intervention (and its 95% CI). | ||||||
| GRADE Working Group grades of evidence | ||||||
| aDowngraded one level for potential bias as there was unclear risk of selection, performance, detection, attrition, and reporting bias. *We defined long‐term follow‐up as between two months and one year. | ||||||
| Acrylic punctal plugs compared with silicone punctal plugs for dry eye syndrome | ||||||
| Patient or population: mostly women with dry eye syndrome Settings: eye clinics Intervention: acrylic punctal plugs Comparison: silicone punctal plugs | ||||||
| Outcomes | Illustrative comparative risks* (95% CI) | Relative effect | No of eyes | Certainty of the evidence | Comments | |
| Assumed risk | Corresponding risk | |||||
| Silicone punctal plugs | Acrylic punctal plugs | |||||
| Symptomatic improvement Follow‐up: 11 weeks Range: 0 to 70 points A visual analog scales 10 cm in length for seven symptoms: dryness, grittiness, foreign body sensation, pain, stinging, burning, and itching was used. A lower score favors acrylic punctal plugs | The mean symptomatic improvement score was 21.9 points | MD 0.90 points higher than silicone punctal plug group (6.94 points lower than silicone punctal plug group to 8.74 points higher than silicone punctal plug group) | — | 36 | ⊕⊝⊝⊝ | — |
| Ocular surface staining Follow‐up: 11 weeks A higher value is less advantageous Range: 0 to 3 points | The mean fluorescein staining score was 1.63 points | MD 0.43 points higher (worst) than silicone punctal plug group (1.61 lower (better) than silicone punctal plug group to 2.47 higher (worse) than silicone punctal plug group) | — | 36 | ⊕⊝⊝⊝ | — |
| The mean Rose Bengal staining score was 0.55 points | MD 0.45 points higher (worst) than silicone punctal plug group (0.09 lower (better) than silicone punctal plug group to 0.99 higher (worst) than silicone punctal plug group) | — | — | |||
| Aqueous tear production Follow‐up: 11 weeks A higher value is more advantageous | The mean aqueous tear production was 3.8 mm/5 min | MD 1.07 mm/5 min higher than silicone punctal plug group (1.62 lower than silicone punctal plug group to 3.76 higher than silicone punctal plug group) | — | 36 | ⊕⊝⊝⊝ | Authors did not report the time interval in which the Schirmer's test 1 without anesthesia was performed. We assumed it was done over 5 minutes. |
| Tear film stability Follow‐up: 11 weeks A higher value is more advantageous | The mean tear film stability was 3.5 seconds | MD 0.36 seconds longer than silicone punctal plug group (1.22 seconds shorter than silicone punctal plug group to 1.94 longer than silicone punctal plug group) | — | 36 | ⊕⊝⊝⊝ | — |
| Artificial tear use Follow‐up: 11 weeks Range: 1‐5 applications Fewer applications favors punctal plugs | The mean number of applications was 4.67 applications | MD 0.11 more applications than silicone punctal plug group (2.32 fewer applications than silicone punctal plug group to 2.54 more applications than silicone punctal plug group) | — | 36 | ⊕⊝⊝⊝ | — |
| Adverse events Follow‐up: 11 weeks | See comments | See comments | — | 36 | ⊕⊝⊝⊝ | 1 acrylic punctal plug participant experienced epiphora, 1 silicone punctal plug participant experienced intermittent ocular irritation, and 2 silicone and 1 acrylic punctal plug participants experienced temporary foreign body sensation. |
| *The basis for the assumed risk is the control group risk across studies. The corresponding risk (and its 95% confidence interval) is based on the assumed risk in the comparison group and the relative effect of the intervention (and its 95% CI). | ||||||
| GRADE Working Group grades of evidence | ||||||
| aDowngraded two levels for imprecision of results (wide confidence intervals). bDowngraded one level for risk of bias as selection, attrition and reporting bias were judged to be unclear. *We defined long‐term follow‐up as between two months and one year. | ||||||
| Intracanalicular punctal plugs compared with silicone punctal plugs for dry eye syndrome | ||||||
| Patient or population: adults with dry eye syndrome Settings: eye clinics Intervention: intracanalicular punctal plugs Comparison: silicone punctal plugs | ||||||
| Outcomes | Illustrative comparative risks* (95% CI) | Relative effect | No of eyes | Certainty of the evidence | Comments | |
| Assumed risk | Corresponding risk | |||||
| Silicone punctal plugs | Intracanalicular punctal plugs | |||||
| Symptomatic improvement Follow‐up: 3 months Subjective dry eye symptoms for each eye was reported; investigators measured soreness, scratching, grittiness, dryness and/or burning using a 100 mm visual analog scale (VAS; 0 mm = no symptoms, 100 mm = maximum intensity) | The mean symptomatic improvement was 38.5 points | The mean difference in symptomatic improvement was 3.10 points lower (14.97 lower to 8.77 higher) | — | 57 | ⊕⊝⊝⊝ | — |
| Ocular surface staining Follow‐up: 3 months A higher value is less advantageous Range: 0 to 3 points; 0 = no staining and 3 = most intense staining | The mean Rose Bengal staining score was 3.0 | MD 0.20 higher than observation group (0.71 lower to 1.11 higher than silicone punctal plugs group) | — | 57 | ⊕⊝⊝⊝ | — |
| The mean fluorescein staining score was 0.7 points | MD 0.40 points higher than observation group (0.04 lower to 0.84 higher than silicone punctal plugs group) | — | 57 | — | ||
| Aqueous tear production Follow‐up: 3 months | Study investigators did not report this outcome. | |||||
| Tear film stability Follow‐up: 3 months | Study investigators did not report this outcome. | |||||
| Artificial tear use Follow‐up: 3 months Fewer applications favors intracanalicular plugs | The mean artificial tear use was 6.4 | MD 1.30 fewer applications (4.04 fewer to 1.44 more applications) | — | 57 | ⊕⊝⊝⊝ | — |
| Adverse events | Study investigators did not report on adverse events. | |||||
| *The basis for the assumed risk is the control group risk across studies. The corresponding risk (and its 95% confidence interval) is based on the assumed risk in the comparison group and the relative effect of the intervention (and its 95% CI). | ||||||
| GRADE Working Group grades of evidence | ||||||
| aDowngraded two levels for imprecision of results (wide confidence intervals). *We defined long‐term follow‐up as between two months and one year. | ||||||
| Collagen punctal plugs compared with silicone punctal plugs for dry eye syndrome | ||||||
| Patient or population: adults with dry eye syndrome Settings: eye clinics Intervention: collagen punctal plugs Comparison: silicone punctal plugs | ||||||
| Outcomes | Illustrative comparative risks* (95% CI) | Relative effect | No of eyes | Certainty of the evidence | Comments | |
| Assumed risk | Corresponding risk | |||||
| Silicone punctal plugs | Collagen punctal plugs | |||||
| Symptomatic improvement Follow‐up: 3 months The Canadian Dry Eye Assessment range from 0 to 48 points; where less than 5 points was normal, 5 to 15 points was mild, 20 to 25 points was moderate, 30 to 48 points was severe. | The mean symptomatic improvement score was 0.25 points | MD 0.81 higher than silicone punctal group (2.94 lower to 4.56 higher than silicone punctal group) | — | 50 (1 RCT) | ⊕⊝⊝⊝ | — |
| Ocular surface staining Follow‐up: 3 months Range: 0 to 15 points A higher value is less advantageous | The mean fluorescein stain score was 2.00 | MD 0.76 lower than silicone punctal group (18.5 lower to 17.0 higher than silicone punctal group) | — | 50 (1 RCT) | ⊕⊝⊝⊝ | — |
| Aqueous tear production Follow‐up: 3 months A higher value is more advantageous | The mean aqueous tear production was 16.89 mm/5 min | MD 0.67 mm/5 min higher than silicone punctal group (17.28 lower to 18.62 higher than silicone punctal group) | — | 50 (1 RCT) | ⊕⊝⊝⊝ | Authors did not report the time interval in which the Schirmer's test 1 without anesthesia was performed. We assumed it was done over 5 minutes. |
| Tear film stability Follow‐up: 3 months A higher value is more advantageous | The mean tear film stability was 4.67 seconds | MD 0.21 seconds higher than silicone punctal group | — | 50 (1 RCT) | ⊕⊝⊝⊝ | — |
| Artificial tear use Follow‐up: 3 months Fewer applications favors collagen punctal plugs | The mean number of artificial tear applications was 1.34 applications | MD 0.06 fewer applications (0.23 fewer to 0.12 more applications than silicone punctal group) | — | 50 (1 RCT) | ⊕⊕⊝⊝ | — |
| Adverse events Follow‐up: end of study | See comments | See comments | See comments | 98 (2 RCT) | ⊕⊝⊝⊝ | Both studies reported that none of the participants developed adverse events or complications related to punctal plugs. |
| *The basis for the assumed risk is the control group risk across studies. The corresponding risk (and its 95% confidence interval) is based on the assumed risk in the comparison group and the relative effect of the intervention (and its 95% CI). | ||||||
| GRADE Working Group grades of evidence | ||||||
| aDowngraded two levels for imprecision of results as the confidence interval was wide and clinically not important. bDowngraded one level for risk of bias as risk of bias as we judged selection, performance, detection, attrition, and reporting bias to be unclear. *We defined long‐term follow‐up as between two months and one year. | ||||||
| 1. Punctal plugs versus observation. | ||
| Collagen intracanalicular plugs were inserted in the upper and lower puncta | Sham treatment | |
| Silicone punctal plugs | No occlusion | |
| Collagen plus silicone punctal plugs | Sham treatment | |
| Bilateral collagen punctal plugs in the lower lids + cyclosporine eye drops to both eyes twice daily | Cyclosporine ophthalmic emulsion 0.05% | |
| Silicone punctal plugs in the upper and lower puncta | Sham treatment | |
| Silicone punctal plugs | Observation | |
| 2. Punctal plugs versus cyclosporine. | ||
| Bilateral collagen punctal plugs in the lower lids only | Cyclosporine ophthalmic emulsion 0.05% | |
| 3. Punctal plugs versus oral pilocarpine. | ||
| Collagen punctal plugs | Oral pilocarpine | |
| 4. Punctal plugs versus artificial tears. | ||
| Collagen punctal plugs | Artificial tears | |
| Acrylic punctal plugs | Artificial tears | |
| Acrylic punctal plugs | Artificial tears | |
| Collagen punctal plugs | Artificial tears | |
| Thermal Memory hydrophobic acrylic polymer rigid rod punctal plug | Artificial tears | |
| 5. Punctal plugs in the lower puncta versus the upper puncta. | ||
| Collagen punctal plugs in the lower puncta | Collagen punctal plugs in the upper puncta | |
| Collagen punctal plugs in the lower puncta | Collagen punctal plugs in the lower and upper puncta | |
| Silcone punctal plugs in the lower puncta | Silcone punctal plugs in the upper puncta | |
| 6. Acrylic punctal plugs versus silicone punctal plugs. | ||
| Acrylic punctal plugs | Silicone punctal plugs | |
| 7. Intracanalicular plugs versus Silicone punctal plugs. | ||
| Intracanicular | Silicone punctal plugs | |
| 8. Collagen punctal plugs versus silicone punctal plugs. | ||
| Collagen punctal plugs | Silicone punctal plugs | |
| Collagen punctal plugs were inserted in the lower punctum | Silicone punctal plugs were inserted in the lower punctum | |
| Excluded comparisons | ||
| Artificial tears | Oral pilocarpine | |
| Outcome or subgroup title | No. of studies | No. of participants | Statistical method | Effect size |
| 1 Symptomatic improvement at 1 month Show forest plot | 3 | Mean Difference (IV, Fixed, 95% CI) | Totals not selected | |
| 2 Symptomatic improvement (long‐term) Show forest plot | 2 | Mean Difference (IV, Fixed, 95% CI) | Totals not selected | |
| 3 Ocular surface staining at 2 weeks Show forest plot | 1 | Mean Difference (IV, Fixed, 95% CI) | Totals not selected | |
| 4 Ocular surface staining at 1 month Show forest plot | 1 | Mean Difference (IV, Fixed, 95% CI) | Totals not selected | |
| 5 Ocular surface staining (long‐term) Show forest plot | 1 | Mean Difference (IV, Fixed, 95% CI) | Totals not selected | |
| 6 Tear film stability at 1 month Show forest plot | 1 | Mean Difference (IV, Fixed, 95% CI) | Totals not selected | |
| 7 Tear film stability (long‐term) Show forest plot | 1 | Mean Difference (IV, Fixed, 95% CI) | Totals not selected | |
| 8 Artificial tear use at 2 weeks Show forest plot | 1 | Mean Difference (IV, Fixed, 95% CI) | Totals not selected | |
| 9 Artificial tear use at 1 month Show forest plot | 1 | Mean Difference (IV, Fixed, 95% CI) | Totals not selected | |
| 10 Artificial tear use (long‐term) Show forest plot | 1 | Mean Difference (IV, Fixed, 95% CI) | Totals not selected | |
| Outcome or subgroup title | No. of studies | No. of participants | Statistical method | Effect size |
| 1 Ocular surface staining at 1 month Show forest plot | 1 | Mean Difference (IV, Fixed, 95% CI) | Totals not selected | |
| 2 Ocular surface staining at 6 months Show forest plot | 1 | Mean Difference (IV, Fixed, 95% CI) | Totals not selected | |
| 3 Aqueous tear production at 1 month Show forest plot | 1 | Mean Difference (IV, Fixed, 95% CI) | Totals not selected | |
| 4 Aqueous tear production at 6 months Show forest plot | 1 | Mean Difference (IV, Fixed, 95% CI) | Totals not selected | |
| 5 Artificial tear use at 1 month Show forest plot | 1 | Mean Difference (IV, Fixed, 95% CI) | Totals not selected | |
| 6 Artificial tear use at 6 months Show forest plot | 1 | Mean Difference (IV, Fixed, 95% CI) | Totals not selected | |
| Outcome or subgroup title | No. of studies | No. of participants | Statistical method | Effect size |
| 1 Symptomatic improvement at 3 months Show forest plot | 1 | Risk Ratio (M‐H, Fixed, 95% CI) | Totals not selected | |
| 2 Ocular surface staining Show forest plot | 1 | Mean Difference (IV, Fixed, 95% CI) | Totals not selected | |
| 2.1 Right eye | 1 | Mean Difference (IV, Fixed, 95% CI) | 0.0 [0.0, 0.0] | |
| 2.2 Left eye | 1 | Mean Difference (IV, Fixed, 95% CI) | 0.0 [0.0, 0.0] | |
| 3 Aqueous tear production Show forest plot | 1 | Mean Difference (IV, Fixed, 95% CI) | Totals not selected | |
| 3.1 Right eye | 1 | Mean Difference (IV, Fixed, 95% CI) | 0.0 [0.0, 0.0] | |
| 3.2 Left eye | 1 | Mean Difference (IV, Fixed, 95% CI) | 0.0 [0.0, 0.0] | |
| Outcome or subgroup title | No. of studies | No. of participants | Statistical method | Effect size |
| 1 Symptomatic improvement at 2 weeks Show forest plot | 1 | Mean Difference (IV, Fixed, 95% CI) | Totals not selected | |
| 2 Symptomatic improvement at 3 months Show forest plot | 1 | Risk Ratio (M‐H, Fixed, 95% CI) | Totals not selected | |
| 3 Symptomatic improvement at 3 months Show forest plot | 2 | 130 | Mean Difference (IV, Fixed, 95% CI) | ‐4.20 [‐5.87, ‐2.53] |
| 4 Ocular surface staining at 2 weeks Show forest plot | 1 | Mean Difference (IV, Fixed, 95% CI) | Totals not selected | |
| 5 Ocular surface staining at 3 months (Rose Bengal) Show forest plot | 1 | Mean Difference (IV, Fixed, 95% CI) | Totals not selected | |
| 5.1 Right eye | 1 | Mean Difference (IV, Fixed, 95% CI) | 0.0 [0.0, 0.0] | |
| 5.2 Left eye | 1 | Mean Difference (IV, Fixed, 95% CI) | 0.0 [0.0, 0.0] | |
| 6 Ocular surface staining at 3 months (fluorescein) Show forest plot | 1 | Mean Difference (IV, Fixed, 95% CI) | Totals not selected | |
| 7 Aqueous tear production at 2 weeks Show forest plot | 2 | 82 | Mean Difference (IV, Fixed, 95% CI) | 0.83 [‐1.05, 2.71] |
| 8 Aqueous tear production at 3 months Show forest plot | 1 | Mean Difference (IV, Fixed, 95% CI) | Totals not selected | |
| 8.1 Right | 1 | Mean Difference (IV, Fixed, 95% CI) | 0.0 [0.0, 0.0] | |
| 8.2 Left | 1 | Mean Difference (IV, Fixed, 95% CI) | 0.0 [0.0, 0.0] | |
| 9 Aqueous tear production at 3 months Show forest plot | 2 | 130 | Mean Difference (IV, Fixed, 95% CI) | 2.16 [1.41, 2.90] |
| 10 Tear film stability at 2 weeks Show forest plot | 2 | 82 | Mean Difference (IV, Fixed, 95% CI) | 0.26 [‐0.57, 1.09] |
| 11 Tear film stability at 3 months Show forest plot | 2 | 130 | Mean Difference (IV, Fixed, 95% CI) | 1.02 [0.60, 1.44] |
| 12 Punctate epithelial keratopathy Show forest plot | 1 | Risk Ratio (M‐H, Fixed, 95% CI) | Totals not selected | |
| Outcome or subgroup title | No. of studies | No. of participants | Statistical method | Effect size |
| 1 Symptomatic improvement at 1 month Show forest plot | 1 | Risk Ratio (M‐H, Fixed, 95% CI) | Totals not selected | |
| 2 Aqueous tear production at 1 month Show forest plot | 1 | Mean Difference (IV, Fixed, 95% CI) | Totals not selected | |
| 3 Tear film stability at 1 month Show forest plot | 1 | Mean Difference (IV, Fixed, 95% CI) | Totals not selected | |
| Outcome or subgroup title | No. of studies | No. of participants | Statistical method | Effect size |
| 1 Symptomatic improvement at 11 weeks Show forest plot | 1 | Mean Difference (IV, Fixed, 95% CI) | Totals not selected | |
| 2 Ocular surface staining at 11 weeks Show forest plot | 1 | Mean Difference (IV, Fixed, 95% CI) | Totals not selected | |
| 2.1 Rose Bengal | 1 | Mean Difference (IV, Fixed, 95% CI) | 0.0 [0.0, 0.0] | |
| 2.2 Fluorescein | 1 | Mean Difference (IV, Fixed, 95% CI) | 0.0 [0.0, 0.0] | |
| 3 Aqueous tear production at 11 weeks Show forest plot | 1 | Mean Difference (IV, Fixed, 95% CI) | Totals not selected | |
| 4 Tear film stability at 11 weeks Show forest plot | 1 | Mean Difference (IV, Fixed, 95% CI) | Totals not selected | |
| 5 Artificial tear use at 11 weeks Show forest plot | 1 | Mean Difference (IV, Fixed, 95% CI) | Totals not selected | |
| Outcome or subgroup title | No. of studies | No. of participants | Statistical method | Effect size |
| 1 Symptomatic improvement (long‐term) Show forest plot | 1 | Mean Difference (IV, Fixed, 95% CI) | Totals not selected | |
| 2 Ocular surface staining (long‐term) Show forest plot | 1 | Mean Difference (IV, Fixed, 95% CI) | Totals not selected | |
| 2.1 Rose Bengal | 1 | Mean Difference (IV, Fixed, 95% CI) | 0.0 [0.0, 0.0] | |
| 2.2 Fluorescein | 1 | Mean Difference (IV, Fixed, 95% CI) | 0.0 [0.0, 0.0] | |
| 3 Aqueous tear production (long‐term) Show forest plot | 1 | Mean Difference (IV, Fixed, 95% CI) | Totals not selected | |
| 3.1 Schirmer test I without anesthesia | 1 | Mean Difference (IV, Fixed, 95% CI) | 0.0 [0.0, 0.0] | |
| 4 Tear film stability (long‐term) Show forest plot | 1 | Mean Difference (IV, Fixed, 95% CI) | Totals not selected | |
| 5 Artificial tear use (long‐term) Show forest plot | 1 | Mean Difference (IV, Fixed, 95% CI) | Totals not selected | |