| Immediate cataract surgery compared with delayed cataract surgery in eyes with age‐related macular degeneration |
| Population: people with cataract and age‐related macular degeneration Settings: ophthalmology clinics Intervention: immediate cataract surgery (within 2 weeks) Comparison: delayed cataract surgery (after 6 months) |
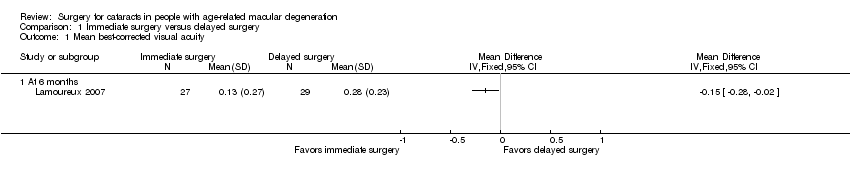
| Mean best‐corrected visual acuity (BCVA) (measured on the LogMAR scale; 0 = good vision, higher scores = worse vision) | At 6 months' follow‐up | — | 56
(1 study) | ⊕⊕⊕⊝
moderate1 | Neither trial reported visual acuity outcomes as dichotomous or categorical outcomes. At 12 months, 1 trial reported mean distance visual acuity, but the unit of measure was not reported. |
| Mean BCVA in the delayed‐cataract surgery group was 0.28 LogMAR units. | Mean BCVA in the immediate‐cataract surgery group was 0.15 LogMAR units lower (better) (0.28 lower to 0.02 lower). |
| At 12 months' follow‐up |
| See comment |
| Mean change in cumulated drusen or geographic atrophy area size (CDGAS) | At 6 months' follow‐up | 1 trial did not report any outcome related to drusen or geographic atrophy. |
| Not reported |
| At 12 months' follow‐up | — | 49
(1 study) | ⊕⊕⊝⊝
low1,2 |
| The mean change in CDGAS in the delayed‐cataract surgery group was ‐1.125 CDGAS units. | The mean change in CDGAS in the immediate‐cataract surgery group was 0.76 CDGAS units higher (8.49 lower to 10.00 higher). |
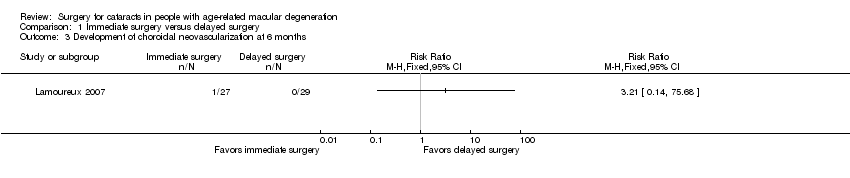
| Development of choroidal neovascularization | At 6 months' follow‐up | RR 3.21 (0.14 to 75.68) | 56
(1 study) | ⊕⊝⊝⊝
very low1,3 | At 6 months, none of 29 participants in the delayed‐cataract surgery group compared with 1 of 27 participants in the immediate‐cataract surgery group developed choroidal neovascularization. The other trial reported that no participant in either group developed exudative AMD up to 12 months' follow‐up. |
| Not estimated (see comment) |
| At 12 months' follow‐up |
| See comment |
| Quality of life (measured by the Impact of Vision Impairment questionnaire; higher mean scores represent better quality of life in the analyses, scale of 0 to 5) | At 6 months' follow‐up | — | 56
(1 study) | ⊕⊕⊝⊝
low1,2 | The other trial measured quality of life using the Visual Function‐14 questionnaire to assess patient satisfaction at baseline and 12 months' follow‐up; however, no between‐group analysis of results could be performed. |
| Mean overall score in the delayed‐cataract surgery group was 1.8. | Mean overall score in the immediate‐cataract surgery group was 1.60 higher (0.61 to 2.59 higher). |
| At 12 months' follow‐up |
| See comment |
| Complications | Not reported | |
| *The basis for the assumed risk is the risk in the control group. The corresponding risk (and its 95% confidence interval) is based on the assumed risk in the control group and the relative effect of the intervention (and its 95% CI). CI: confidence interval; RR: risk ratio |
| GRADE Working Group grades of evidence
High‐certainty: Further research is very unlikely to change our confidence in the estimate of effect.
Moderate‐certainty: Further research is likely to have an important impact on our confidence in the estimate of effect and may change the estimate.
Low‐certainty: Further research is very likely to have an important impact on our confidence in the estimate of effect and is likely to change the estimate.
Very low‐certainty: We are very uncertain about the estimate. |