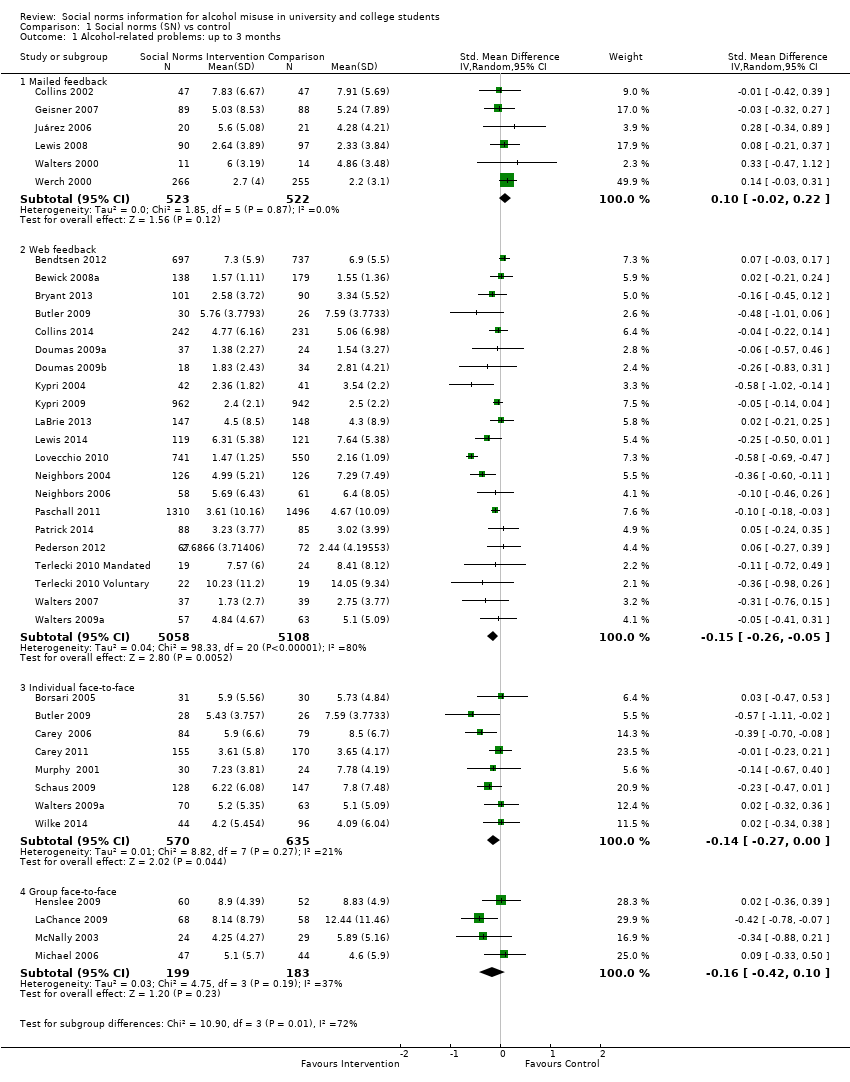
| 1 Alcohol‐related problems: up to 3 months Show forest plot | 37 | | Std. Mean Difference (IV, Random, 95% CI) | Subtotals only |
|
| 1.1 Mailed feedback | 6 | 1045 | Std. Mean Difference (IV, Random, 95% CI) | 0.10 [‐0.02, 0.22] |
| 1.2 Web feedback | 21 | 10166 | Std. Mean Difference (IV, Random, 95% CI) | ‐0.15 [‐0.26, ‐0.05] |
| 1.3 Individual face‐to‐face | 8 | 1205 | Std. Mean Difference (IV, Random, 95% CI) | ‐0.14 [‐0.27, ‐0.00] |
| 1.4 Group face‐to‐face | 4 | 382 | Std. Mean Difference (IV, Random, 95% CI) | ‐0.16 [‐0.42, 0.10] |
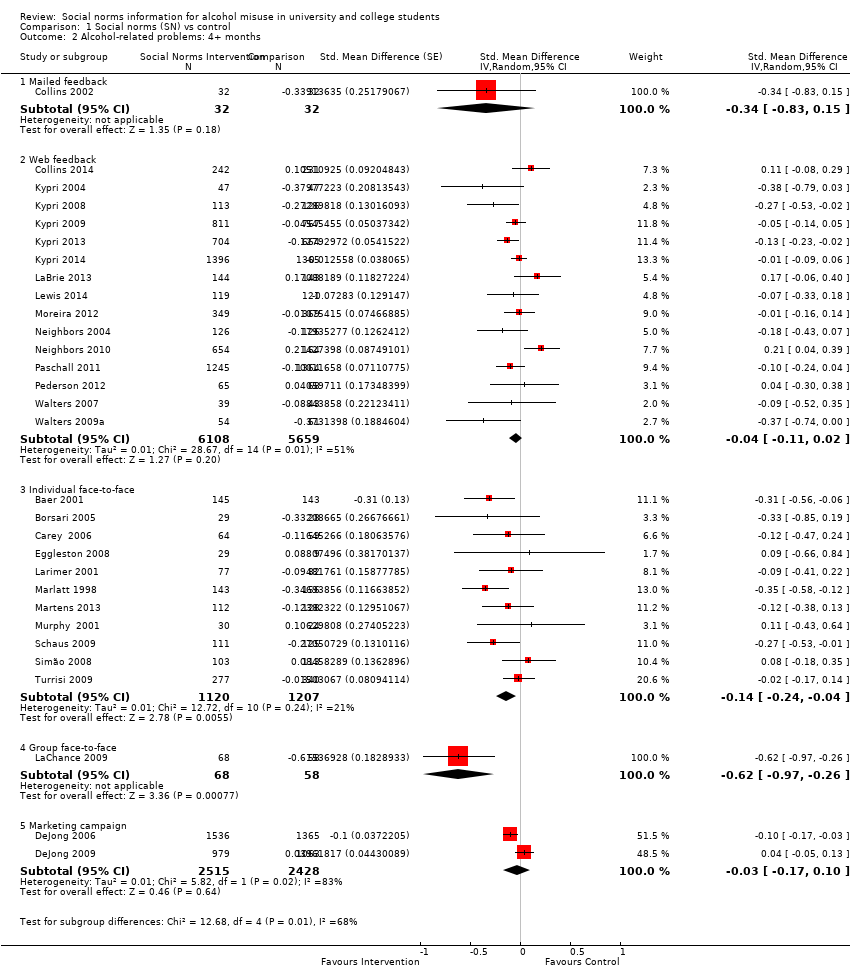
| 2 Alcohol‐related problems: 4+ months Show forest plot | 30 | | Std. Mean Difference (Random, 95% CI) | Subtotals only |
|
| 2.1 Mailed feedback | 1 | 64 | Std. Mean Difference (Random, 95% CI) | ‐0.34 [‐0.83, 0.15] |
| 2.2 Web feedback | 15 | 11767 | Std. Mean Difference (Random, 95% CI) | ‐0.04 [‐0.11, 0.02] |
| 2.3 Individual face‐to‐face | 11 | 2327 | Std. Mean Difference (Random, 95% CI) | ‐0.14 [‐0.24, ‐0.04] |
| 2.4 Group face‐to‐face | 1 | 126 | Std. Mean Difference (Random, 95% CI) | ‐0.62 [‐0.97, ‐0.26] |
| 2.5 Marketing campaign | 2 | 4943 | Std. Mean Difference (Random, 95% CI) | ‐0.03 [‐0.17, 0.10] |
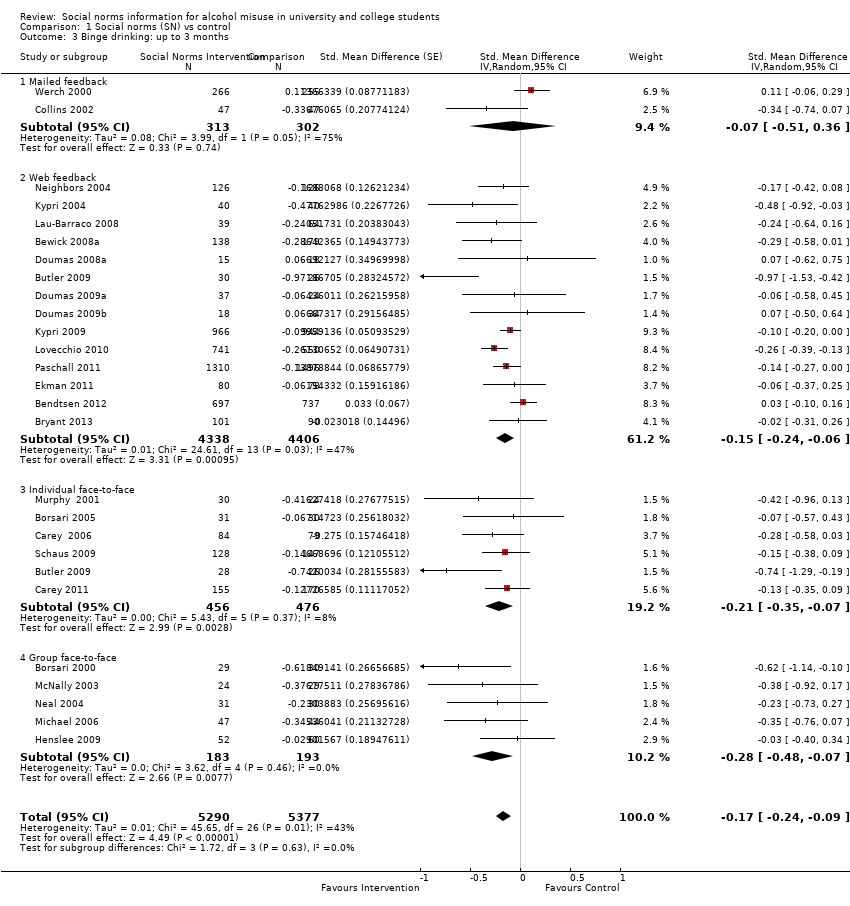
| 3 Binge drinking: up to 3 months Show forest plot | 26 | 10667 | Std. Mean Difference (Random, 95% CI) | ‐0.17 [‐0.24, ‐0.09] |
|
| 3.1 Mailed feedback | 2 | 615 | Std. Mean Difference (Random, 95% CI) | ‐0.07 [‐0.51, 0.36] |
| 3.2 Web feedback | 14 | 8744 | Std. Mean Difference (Random, 95% CI) | ‐0.15 [‐0.24, ‐0.06] |
| 3.3 Individual face‐to‐face | 6 | 932 | Std. Mean Difference (Random, 95% CI) | ‐0.21 [‐0.35, ‐0.07] |
| 3.4 Group face‐to‐face | 5 | 376 | Std. Mean Difference (Random, 95% CI) | ‐0.28 [‐0.48, ‐0.07] |
| 4 Binge drinking: 4+ months Show forest plot | 16 | 11292 | Std. Mean Difference (Random, 95% CI) | ‐0.06 [‐0.11, ‐0.02] |
|
| 4.1 Mailed feedback | 1 | 65 | Std. Mean Difference (Random, 95% CI) | ‐0.17 [‐0.66, 0.32] |
| 4.2 Web feedback | 10 | 10719 | Std. Mean Difference (Random, 95% CI) | ‐0.07 [‐0.12, ‐0.02] |
| 4.3 Individual face‐to‐face | 5 | 508 | Std. Mean Difference (Random, 95% CI) | 0.01 [‐0.17, 0.18] |
| 5 Quantity of drinking: up to 3 months Show forest plot | 45 | 14184 | Std. Mean Difference (IV, Random, 95% CI) | ‐0.14 [‐0.19, ‐0.09] |
|
| 5.1 Mailed feedback | 5 | 1020 | Std. Mean Difference (IV, Random, 95% CI) | ‐0.04 [‐0.21, 0.13] |
| 5.2 Web feedback | 28 | 10889 | Std. Mean Difference (IV, Random, 95% CI) | ‐0.12 [‐0.18, ‐0.07] |
| 5.3 Individual face‐to‐face | 8 | 1309 | Std. Mean Difference (IV, Random, 95% CI) | ‐0.24 [‐0.38, ‐0.11] |
| 5.4 Group face‐to‐face | 5 | 411 | Std. Mean Difference (IV, Random, 95% CI) | ‐0.30 [‐0.49, ‐0.10] |
| 5.5 Marketing campaign | 1 | 555 | Std. Mean Difference (IV, Random, 95% CI) | ‐0.05 [‐0.22, 0.11] |
| 6 Quantity of drinking: 4+ months Show forest plot | 32 | 21169 | Std. Mean Difference (Random, 95% CI) | ‐0.08 [‐0.12, ‐0.04] |
|
| 6.1 Mailed feedback | 2 | 533 | Std. Mean Difference (Random, 95% CI) | ‐0.13 [‐0.32, 0.06] |
| 6.2 Web feedback | 18 | 13319 | Std. Mean Difference (Random, 95% CI) | ‐0.07 [‐0.12, ‐0.02] |
| 6.3 Individual face‐to‐face | 12 | 2374 | Std. Mean Difference (Random, 95% CI) | ‐0.15 [‐0.23, ‐0.08] |
| 6.4 Marketing campaign | 2 | 4943 | Std. Mean Difference (Random, 95% CI) | ‐0.02 [‐0.13, 0.09] |
| 7 Frequency: up to 3 months Show forest plot | 19 | | Std. Mean Difference (IV, Random, 95% CI) | Subtotals only |
|
| 7.1 Mailed feedback | 1 | 521 | Std. Mean Difference (IV, Random, 95% CI) | 0.12 [‐0.05, 0.29] |
| 7.2 Web feedback | 12 | 6385 | Std. Mean Difference (IV, Random, 95% CI) | ‐0.17 [‐0.25, ‐0.09] |
| 7.3 Individual face‐to‐face | 4 | 515 | Std. Mean Difference (IV, Random, 95% CI) | ‐0.45 [‐0.63, ‐0.28] |
| 7.4 Group face‐to‐face | 3 | 264 | Std. Mean Difference (IV, Random, 95% CI) | ‐0.03 [‐0.27, 0.21] |
| 8 Frequency: 4+ months Show forest plot | 25 | | Std. Mean Difference (Random, 95% CI) | Subtotals only |
|
| 8.1 Web feedback | 10 | 9929 | Std. Mean Difference (Random, 95% CI) | ‐0.11 [‐0.17, ‐0.04] |
| 8.2 Individual face‐to‐face | 8 | 1464 | Std. Mean Difference (Random, 95% CI) | ‐0.21 [‐0.31, ‐0.10] |
| 8.3 Group face‐to‐face | 5 | 449 | Std. Mean Difference (Random, 95% CI) | ‐0.26 [‐0.54, 0.02] |
| 8.4 Marketing campaign | 2 | 4943 | Std. Mean Difference (Random, 95% CI) | ‐0.01 [‐0.09, 0.06] |
| 9 Peak BAC: up to 3 months Show forest plot | 11 | 1902 | Std. Mean Difference (IV, Random, 95% CI) | ‐0.22 [‐0.33, ‐0.11] |
|
| 9.1 Mailed feedback | 1 | 94 | Std. Mean Difference (IV, Random, 95% CI) | ‐0.20 [‐0.60, 0.21] |
| 9.2 Web feedback | 4 | 477 | Std. Mean Difference (IV, Random, 95% CI) | ‐0.13 [‐0.35, 0.09] |
| 9.3 Individual face‐to‐face | 7 | 1331 | Std. Mean Difference (IV, Random, 95% CI) | ‐0.26 [‐0.39, ‐0.13] |
| 10 Peak BAC: 4+ months Show forest plot | 11 | 7198 | Std. Mean Difference (IV, Random, 95% CI) | ‐0.08 [‐0.17, 0.00] |
|
| 10.1 Mailed feedback | 1 | 468 | Std. Mean Difference (IV, Random, 95% CI) | ‐0.13 [‐0.33, 0.08] |
| 10.2 Web feedback | 3 | 355 | Std. Mean Difference (IV, Random, 95% CI) | ‐0.08 [‐0.29, 0.13] |
| 10.3 Individual face‐to‐face | 7 | 1432 | Std. Mean Difference (IV, Random, 95% CI) | ‐0.16 [‐0.26, ‐0.05] |
| 10.4 Marketing campaign | 2 | 4943 | Std. Mean Difference (IV, Random, 95% CI) | 0.02 [‐0.18, 0.21] |
| 11 Typical BAC: up to 3 months Show forest plot | 8 | 1336 | Std. Mean Difference (IV, Random, 95% CI) | ‐0.17 [‐0.31, ‐0.03] |
|
| 11.1 Mailed feedback | 3 | 253 | Std. Mean Difference (IV, Random, 95% CI) | ‐0.10 [‐0.35, 0.15] |
| 11.2 Web feedback | 1 | 282 | Std. Mean Difference (IV, Random, 95% CI) | ‐0.25 [‐0.48, ‐0.01] |
| 11.3 Individual face‐to‐face | 4 | 801 | Std. Mean Difference (IV, Random, 95% CI) | ‐0.14 [‐0.40, 0.12] |
| 12 Typical BAC: 4+ months Show forest plot | 4 | | Std. Mean Difference (IV, Random, 95% CI) | Subtotals only |
|
| 12.1 Individual face‐to‐face | 4 | 490 | Std. Mean Difference (IV, Random, 95% CI) | ‐0.08 [‐0.26, 0.10] |
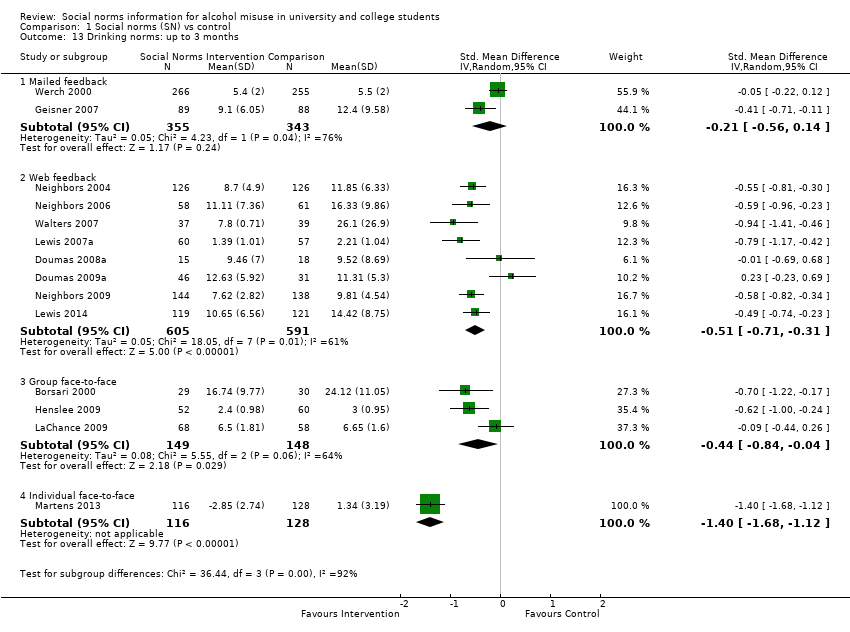
| 13 Drinking norms: up to 3 months Show forest plot | 14 | | Std. Mean Difference (IV, Random, 95% CI) | Subtotals only |
|
| 13.1 Mailed feedback | 2 | 698 | Std. Mean Difference (IV, Random, 95% CI) | ‐0.21 [‐0.56, 0.14] |
| 13.2 Web feedback | 8 | 1196 | Std. Mean Difference (IV, Random, 95% CI) | ‐0.51 [‐0.71, ‐0.31] |
| 13.3 Group face‐to‐face | 3 | 297 | Std. Mean Difference (IV, Random, 95% CI) | ‐0.44 [‐0.84, ‐0.04] |
| 13.4 Individual face‐to‐face | 1 | 244 | Std. Mean Difference (IV, Random, 95% CI) | ‐1.40 [‐1.68, ‐1.12] |
| 14 Drinking norms: 4+ months Show forest plot | 9 | | Std. Mean Difference (Random, 95% CI) | Subtotals only |
|
| 14.1 Web feedback | 6 | 2227 | Std. Mean Difference (Random, 95% CI) | ‐0.34 [‐0.57, ‐0.11] |
| 14.2 Individual face‐to‐face | 1 | 240 | Std. Mean Difference (Random, 95% CI) | ‐1.19 [‐1.47, ‐0.92] |
| 14.3 Marketing campaign | 2 | 4943 | Std. Mean Difference (Random, 95% CI) | ‐0.06 [‐0.23, 0.11] |