تاثیر ارائه اطلاعات در زمینه هنجارهای اجتماعی بر سوء مصرف الکل در دانشجویان کالج و دانشگاه
Referencias
منابع مطالعات واردشده در این مرور
منابع مطالعات خارجشده از این مرور
منابع مطالعات در انتظار ارزیابی
منابع اضافی
منابع دیگر نسخههای منتشرشده این مرور
Characteristics of studies
Characteristics of included studies [ordered by study ID]
| Methods | Design: RCT Follow‐up: 3 months and 6 months Attrition: 22% at 6 months | |
| Participants | Age: mean = 20.4 (SD = 1.08) years, 80% in the intervention arm < 21 years and 20% > 21 years. 85% and 15%, respectively, for the control arm Sex: 71% male in the intervention arm; 76% male in the control arm Size: N = 265 mandated students Allocation: 133 intervention and 132 control Country: USA | |
| Interventions | Intervention: University Assistance Programme (UAP) Key components: MI style interview, BASICS. Normative feedback: 2 to 3 sessions with UAP counsellor consisting of psychosocial assessment in MI style—structured to obtain info to develop brief intervention based on alcohol use and concerns presented Delivery: individual face‐to‐face feedback Duration: not discussed Control: services as usual (SAU); students mandated to complete a computer‐based or group‐based alcohol education programme | |
| Outcomes | Weekly drinking, weekend drinking, weekday drinking, BAC, heavy episodic drinking, alcohol consequences | |
| Funding and Declared Conflicts of Interest | Funded by NIAAA; no information about potential conflicts of interest | |
| Notes | Results on outcome measures presented in graphical format, but not enough data for meta‐analysis. Study authors have been contacted for clarification re: normative feedback and provision of results in the form of means and standard deviations | |
| Risk of bias | ||
| Bias | Authors' judgement | Support for judgement |
| Random sequence generation (selection bias) | Unclear risk | No information |
| Allocation concealment (selection bias) | Unclear risk | No information |
| Incomplete outcome data (attrition bias) | High risk | High attrition at 6‐month follow‐up (22%) |
| Selective reporting (reporting bias) | Unclear risk | Not clear from paper |
| Blinding of participants and personnel (performance bias) | High risk | Blinding of participants and personnel not possible for the intervention |
| Blinding of outcome assessment (detection bias) | Unclear risk | Not stated |
| Methods | Design: RCT | |
| Participants | Age: < 19 years at baseline Allocation: no information | |
| Interventions | Intervention: motivational interview (MI) with normative feedback Delivery: feedback sheet, interview; mailed feedback | |
| Outcomes | Quantity, frequency, peak drinking; daily drinking questionnaire (DDQ); Rutgers Alcohol Problem Index (RAPI); alcohol dependency scale (ADS); brief drinker profile (BDP) | |
| Funding and Declared Conflicts of Interest | Funded by NIAAA; no information about potential conflicts of interest | |
| Notes | ||
| Risk of bias | ||
| Bias | Authors' judgement | Support for judgement |
| Random sequence generation (selection bias) | Unclear risk | "..were randomised..." |
| Allocation concealment (selection bias) | Unclear risk | Not discussed in this study |
| Incomplete outcome data (attrition bias) | Low risk | Low attrition (16.5%) |
| Selective reporting (reporting bias) | Low risk | All data reported |
| Blinding of participants and personnel (performance bias) | High risk | Blinding of participants and personnel not possible for the type of intervention |
| Blinding of outcome assessment (detection bias) | Unclear risk | Not reported |
| Methods | Design: RCT individual | |
| Participants | Age: 86% aged 18 years to 25 years Allocation: 1742 intervention and 1742 control | |
| Interventions | Intervention: an email‐based internet alcohol intervention (e‐SBI) that has been developed by the Lifestyle Intervention Research Group at Linköping University Delivery: web‐based | |
| Outcomes | AUDIT score; frequency of monthly binge drinking; weekly alcohol consumption | |
| Funding and Declared Conflicts of Interest | Conflicts of interest: PB and MB own a company that has developed the e‐SBI used in this study | |
| Notes | ||
| Risk of bias | ||
| Bias | Authors' judgement | Support for judgement |
| Random sequence generation (selection bias) | Low risk | Computer‐based randomisation |
| Allocation concealment (selection bias) | Low risk | Computer‐based allocation |
| Incomplete outcome data (attrition bias) | High risk | Attrition 46% |
| Selective reporting (reporting bias) | Low risk | All outcomes reported |
| Blinding of participants and personnel (performance bias) | Low risk | All participants unaware that they were involved in a research study. Intervention delivered electronically without human involvement |
| Blinding of outcome assessment (detection bias) | Low risk | Computer‐based questionnaire administration |
| Methods | Design: RCT Follow‐up: 12 weeks Attrition: 37% | |
| Participants | Age: mean = 21.29 years (SD = 3.68) Sex: 69% female Size: N = 506 provided informed consent Allocation: 234 intervention and 272 control Country: UK | |
| Interventions | Intervention: personalised normative feedback Key components: feedback on level of alcohol consumption, social norms Information and generic Information. Normative feedback: information on own consumption, associated risk, information on binge drinking behaviour, rates of drinking compared with norms for peers, negative effects reported by peers within same risk category Delivery: web‐based Duration: not discussed Control: assessment only | |
| Outcomes | CAGE; drinks per occasion; drinks in last week | |
| Funding and Declared Conflicts of Interest | Funded by European Research Advisory Board (European Brewers). No information about potential conflicts of interest | |
| Notes | ||
| Risk of bias | ||
| Bias | Authors' judgement | Support for judgement |
| Random sequence generation (selection bias) | Low risk | SPSS random sampling function |
| Allocation concealment (selection bias) | Unclear risk | Of all students answering the student experience survey, half of those who registered their interest in this study were randomly selected to be invited. Method of random selection/allocation to study unclear |
| Incomplete outcome data (attrition bias) | High risk | Attrition = 37% at 12 weeks, no ITT or missing data analysis |
| Selective reporting (reporting bias) | Low risk | All outcomes reported on |
| Blinding of participants and personnel (performance bias) | High risk | Blinding of participants not possible for the type of intervention |
| Blinding of outcome assessment (detection bias) | Low risk | Web‐based administration |
| Methods | Design: RCT Follow‐up: week 1, week 8, week 16, week 24 Attrition: 38% at week 8, 58% at week 16, 66% at week 24 | |
| Participants | Age: mean = 21.45 years (SD = 5.19), range between 18 and 67 Sex: 73% female Size: N = 1112 Allocation: 758 intervention and 354 control Country: UK | |
| Interventions | Intervention: 'Unitcheck' Key components: feedback on level of alcohol consumption, social norms information and generic information. Normative feedback: summarised the proportion of university students who report drinking less alcohol than they consume, frequency of students within various calculated risk levels, negative effects of alcohol intake reported by students within the same risk category as the participant Delivery: web‐based Duration: not discussed Control: assessment only | |
| Outcomes | Units per week; units per occasion | |
| Funding and Declared Conflicts of Interest | Funded by Alcohol Education and Research Council (AERC); CoI statement: "In the past, authors Bewick, Barkham, Hill, Gill, and O'May have received funding from the European Research Advisory Board. Author Bewick, as a keynote speaker, has received reimbursement of travel expenses from Anheuser‐Busch. Authors Gill and O'May have previously received funding from the Portman Group" | |
| Notes | Results for immediate and delayed feedback were combined for MA | |
| Risk of bias | ||
| Bias | Authors' judgement | Support for judgement |
| Random sequence generation (selection bias) | Unclear risk | No information on sequence generation |
| Allocation concealment (selection bias) | Unclear risk | No information |
| Incomplete outcome data (attrition bias) | High risk | High attrition (66%) |
| Selective reporting (reporting bias) | High risk | Only alcohol quantity results reported. No other outcomes reported |
| Blinding of participants and personnel (performance bias) | High risk | Blinding of participants not possible for the intervention |
| Blinding of outcome assessment (detection bias) | Low risk | Web‐based administration |
| Methods | Design: RCT Follow‐up: 1 week and 20 weeks Attrition: 54% and 60% | |
| Participants | Age: mean = 20.8 years, range between 17 and 50 Sex: 70% female Size: N = 1478 Allocation: 723 intervention and 755 control Country: UK | |
| Interventions | Intervention: 'Unitcheck' Key components: feedback on level of alcohol consumption, social norms information and generic information. Normative feedback: summarised the proportion of university students who report drinking less alcohol than they consume, frequency of students within various calculated risk levels, negative effects of alcohol intake reported by students within the same risk category as the participant Delivery: web‐based Duration: not discussed Control: assessment only | |
| Outcomes | 7‐day drinking diary; alcohol‐related risky behaviour; CAGE | |
| Funding and Declared Conflicts of Interest | Funded by European Research Advisory Board (ERAB); CoI statement: "In the past, Bewick, as keynote speaker, has received reimbursement of travel expenses from Anheuser‐Busch and Noctis" | |
| Notes | Insufficient information for inclusion of results in MA; study author contacted for additional details | |
| Risk of bias | ||
| Bias | Authors' judgement | Support for judgement |
| Random sequence generation (selection bias) | Unclear risk | Insufficient information |
| Allocation concealment (selection bias) | Unclear risk | Insufficient information |
| Incomplete outcome data (attrition bias) | High risk | 60% loss to follow‐up |
| Selective reporting (reporting bias) | High risk | Not all outcomes included in regression models |
| Blinding of participants and personnel (performance bias) | High risk | Blinding of participants not possible for the intervention |
| Blinding of outcome assessment (detection bias) | Unclear risk | Insufficient information |
| Methods | Design: RCT | |
| Participants | Age: mean = 18.58 years Allocation: 29 intervention and 31 control | |
| Interventions | Intervention: modelled on Brief Alcohol Screening and Intervention of College Students (BASICS) Delivery: group face‐to‐face session | |
| Outcomes | Number of drinks, frequency of binge drinking | |
| Funding and Declared Conflicts of Interest | No information | |
| Notes | ||
| Risk of bias | ||
| Bias | Authors' judgement | Support for judgement |
| Random sequence generation (selection bias) | Low risk | "...by flip of a coin..." |
| Allocation concealment (selection bias) | Unclear risk | Not discussed in this study |
| Incomplete outcome data (attrition bias) | Low risk | Low attrition (1%) |
| Selective reporting (reporting bias) | Low risk | All data reported |
| Blinding of participants and personnel (performance bias) | High risk | Blinding of participants and personnel not possible for the intervention |
| Blinding of outcome assessment (detection bias) | Unclear risk | Not discussed in this study |
| Methods | Design: RCT Attrition: none | |
| Participants | Age: mean = 19.1 years Country: USA | |
| Interventions | Intervention: BMI Delivery: individual face‐to‐face BMI | |
| Outcomes | AUDIT, RAPI, BAC, Alcohol and Drug Use (ADU) measure, Inventory of Drinking Situations (IDS) | |
| Funding and Declared Conflicts of Interest | Funded by NIAAA; no information about potential conflicts of interest | |
| Notes | ||
| Risk of bias | ||
| Bias | Authors' judgement | Support for judgement |
| Random sequence generation (selection bias) | Low risk | "Coin toss..." |
| Allocation concealment (selection bias) | Unclear risk | Not discussed in this study |
| Incomplete outcome data (attrition bias) | Low risk | No attrition |
| Selective reporting (reporting bias) | Low risk | All data reported |
| Blinding of participants and personnel (performance bias) | High risk | Blinding of participants and personnel not possible for the intervention |
| Blinding of outcome assessment (detection bias) | Unclear risk | Not discussed |
| Methods | Design: RCT Follow‐up: 6 weeks Attrition: 40.7% (from baseline) | |
| Participants | Age: mean = 18.70 years Sex: 76% female Size: N = 322 Allocation: no information Country: USA | |
| Interventions | Intervention: BASICS feedback Key components: personalised feedback Delivery: web‐based (emailed) Duration: not discussed Control: generic feedback on college student alcohol use and associated consequences | |
| Outcomes | AUDIT, RAPI, DDQ, retrospective drinking diary (RDD) | |
| Funding and Declared Conflicts of Interest | No information | |
| Notes | Study author contacted for details of N in each group ‐ needed for MA | |
| Risk of bias | ||
| Bias | Authors' judgement | Support for judgement |
| Random sequence generation (selection bias) | Unclear risk | Not stated |
| Allocation concealment (selection bias) | Unclear risk | Not stated |
| Incomplete outcome data (attrition bias) | Unclear risk | High attrition (41%) |
| Selective reporting (reporting bias) | Low risk | All outcomes reported |
| Blinding of participants and personnel (performance bias) | High risk | Blinding of participants not possible for this type of intervention |
| Blinding of outcome assessment (detection bias) | Unclear risk | Not stated |
| Methods | Design: RCT Follow‐up: 6 weeks Attrition: 38% | |
| Participants | Age: mean = 18.7 years Sex: 76% male Size: N = 191 Allocation: no information Country: USA | |
| Interventions | Intervention: personalised normative feedback Key components: Feedback forms included information about estimated blood alcohol level (BAL) on typical and peak drinking occasions, self‐reported negative consequences, weekly average number of standard drinks, gender‐specific normative data and the amount of time and money allocated to alcohol Delivery: web‐based Control: generic feedback (information only) | |
| Outcomes | Quantity of drinking, AUDIT score, alcohol‐related consequences, frequency of drinking, binge drinking, perceived norms | |
| Funding and Declared Conflicts of Interest | No information about potential conflicts of interest or funding | |
| Notes | ||
| Risk of bias | ||
| Bias | Authors' judgement | Support for judgement |
| Random sequence generation (selection bias) | Unclear risk | No information |
| Allocation concealment (selection bias) | Unclear risk | No information |
| Incomplete outcome data (attrition bias) | High risk | High attrition (38%) |
| Selective reporting (reporting bias) | Low risk | All outcomes reported |
| Blinding of participants and personnel (performance bias) | High risk | Participants and researcher/preventionist not blinded |
| Blinding of outcome assessment (detection bias) | Unclear risk | No information |
| Methods | Design: RCT Follow‐up: 4 weeks Attrition: 26% | |
| Participants | Age: intervention arm: mean = 20.60 years (SD = 1.48); control arm: mean = 20.38 years (SD = 1.49) Sex: 63% females in intervention arm, 65% females in control arm Size: N = 104 at‐risk students Allocation: no information Country: USA | |
| Interventions | Intervention: personalised feedback Key components: personalised normative feedback and alcohol information. Normative feedback: corrective feedback on normative drinking on campus, gender‐specific percentile rank comparing participant's alcohol consumption vs campus norms, review of participant's binge drinking frequency and related consequences, personalised BAC curve for typical and heavy drinking occasions, review of alcohol‐related reported problems and gender‐specific percentile ranking related to problems, calorie consumption, expenditure. Review of harm reduction strategies and resources off and on campus Delivery: computer‐based Duration: average 11.11 minutes (SD = 3.56) Control group: assessment only | |
| Outcomes | Alcohol use days, binge drinking days per month, drinks per week, alcohol‐related consequences | |
| Funding and Declared Conflicts of Interest | No information | |
| Notes | Randomised block design was used to separately randomly assign male and female participants. Study had two intervention arms vs control: both equally relevant for this review. Hence the control was used twice in this case—once vs face to face arm and once vs computerised arm | |
| Risk of bias | ||
| Bias | Authors' judgement | Support for judgement |
| Random sequence generation (selection bias) | Unclear risk | No information |
| Allocation concealment (selection bias) | Unclear risk | Not discussed |
| Incomplete outcome data (attrition bias) | High risk | Attrition 26% at follow‐up |
| Selective reporting (reporting bias) | Low risk | All outcomes reported on |
| Blinding of participants and personnel (performance bias) | High risk | Blinding of participants not possible for the intervention |
| Blinding of outcome assessment (detection bias) | Unclear risk | Not reported |
| Methods | Design: RCT | |
| Participants | Age: mean = 19.2 years Allocation: 85 intervention and 81 control | |
| Interventions | Intervention: BMI Delivery: individual face‐to‐face BMI | |
| Outcomes | Drinks per week, drinks per heaviest week, drinks per day, heavy drinking episodes, typical BAC, peak BAC, RAPI | |
| Funding and Declared Conflicts of Interest | Funded by NIAAA; no information about potential conflicts of interest | |
| Notes | ||
| Risk of bias | ||
| Bias | Authors' judgement | Support for judgement |
| Random sequence generation (selection bias) | Unclear risk | "...assigned randomly within gender..." |
| Allocation concealment (selection bias) | Unclear risk | Not discussed in this study |
| Incomplete outcome data (attrition bias) | Low risk | Low attrition (13% at final follow‐up) |
| Selective reporting (reporting bias) | Low risk | All outcomes reported |
| Blinding of participants and personnel (performance bias) | High risk | Blinding of participants and personnel not possible for the intervention |
| Blinding of outcome assessment (detection bias) | Unclear risk | Not reported |
| Methods | Design: RCT Follow‐up: 1 month, 6 months and 12 months Attrition: 4% at 1 month, 42% at 6 months, 32% at 12 months | |
| Participants | Age: mean = 19 years (SD = 0.71) Sex: 64% males Size: N = 338 mandated students in the arms included in this review Allocation: 164 intervention and 174 control Country: USA | |
| Interventions | Intervention: BMI Key components: personalised feedback, alcohol‐related education, discussion of harm reduction strategies. Normative feedback: personalised feedback sheet summarised, drinking patterns contrasted with gender‐specific national and local norms, typical and peak BAC information, alcohol‐related negative consequences and risky behaviours, personalised goal setting for risk reduction, tips for safer drinking Delivery: individual face‐to‐face Duration: 62 (SD = 16.58) minutes on average Control: assessment only | |
| Outcomes | Drinks per week, drinks per heaviest week, heavy drinking frequency, typical and peak BAC, RAPI | |
| Funding and Declared Conflicts of Interest | Funded by NIAAA. Study authors declare no CoI | |
| Notes | Only 1‐month follow‐up data used in MA as control participants given alcohol intervention after 1 month | |
| Risk of bias | ||
| Bias | Authors' judgement | Support for judgement |
| Random sequence generation (selection bias) | Unclear risk | Not stated |
| Allocation concealment (selection bias) | Unclear risk | Not stated |
| Incomplete outcome data (attrition bias) | Low risk | Low attrition at 1 month (4%) |
| Selective reporting (reporting bias) | Low risk | All outcomes reported |
| Blinding of participants and personnel (performance bias) | High risk | Blinding of participants and personnel not possible for the intervention |
| Blinding of outcome assessment (detection bias) | High risk | Assessors not blind to condition |
| Methods | Design: RCT | |
| Participants | Age: mean = 18.67 years Allocation: 49 intervention and 51 control Country: USA | |
| Interventions | Intervention: BMI Duration: no details | |
| Outcomes | Measures included number of drinks consumed per heaviest drinking week, frequency of heavy drinking episodes, peak blood alcohol concentration and number of alcohol‐related problems, all for the last month | |
| Funding and Declared Conflicts of Interest | Funded by NIAAA; no information about potential conflicts of interest | |
| Notes | ||
| Risk of bias | ||
| Bias | Authors' judgement | Support for judgement |
| Random sequence generation (selection bias) | Unclear risk | "Participants were randomly assigned by gender..." |
| Allocation concealment (selection bias) | Unclear risk | Not discussed in this study |
| Incomplete outcome data (attrition bias) | High risk | High attrition at 6 months (35%) |
| Selective reporting (reporting bias) | Low risk | All data reported |
| Blinding of participants and personnel (performance bias) | High risk | Blinding of participants not possible for the intervention |
| Blinding of outcome assessment (detection bias) | Unclear risk | Not discussed in this study |
| Methods | Design: RCT Follow‐up: 1 month, 6 months and 12 months Attrition: 20% at 12 months | |
| Participants | Age: mean = 20.8 years (SD = 1.42) Sex: 54% female Size: N = 473 previous month heavy drinkers Allocation: 242 intervention and 231 control Country: USA | |
| Interventions | Intervention: Social Normative Feedback Key components: PNF presented participants with personalized information designed to reduce overestimated normative perceptions about drinking in one’s peer group. Delivery: web feedback Duration: brief (duration not provided) Control: assessment only | |
| Outcomes | Daily drinking questionnaire (DDQ), RAPI | |
| Funding and Declared Conflicts of Interest | Funded by NIAAA. No CoI declaration | |
| Notes | ||
| Risk of bias | ||
| Bias | Authors' judgement | Support for judgement |
| Random sequence generation (selection bias) | Low risk | Automatic randomization |
| Allocation concealment (selection bias) | Low risk | Automatic randomisation and allocation |
| Incomplete outcome data (attrition bias) | Low risk | Attrition 20% |
| Selective reporting (reporting bias) | Low risk | All outcomes reported |
| Blinding of participants and personnel (performance bias) | High risk | Blinding of participants not possible for the intervention |
| Blinding of outcome assessment (detection bias) | Low risk | Web‐based survey |
| Methods | Design: cluster RCT by 18 matched universities Attrition: N/A | |
| Participants | Age: 46.3% < 21 years Allocation: 9 (1515) intervention and 9 (1406) control | |
| Interventions | Intervention: social marketing campaign Normative feedback: core message reported a normative behaviour for all students and corrected an identified misperception. Core message based on two student survey questions: "What is the number of drinks you consume in a week?" and "When you party, how many drinks do you usually have?" Example: "67% of XYZ University students have 4 or fewer drinks when they party" Delivery: core messages posted on university campus | |
| Outcomes | 30‐day frequency, drinks per week, drinks when partying, recent maximum consumption, alcohol‐related consequences | |
| Funding and Declared Conflicts of Interest | Funded by NIAAA; no information about potential conflicts of interest | |
| Notes | No adjustment for clustering effects | |
| Risk of bias | ||
| Bias | Authors' judgement | Support for judgement |
| Random sequence generation (selection bias) | Unclear risk | No information |
| Allocation concealment (selection bias) | Unclear risk | Not discussed in this study |
| Incomplete outcome data (attrition bias) | Unclear risk | Sample surveys undertaken at each time point; no follow‐up of individuals |
| Selective reporting (reporting bias) | Low risk | All data reported |
| Blinding of participants and personnel (performance bias) | High risk | Blinding of participants not possible for the intervention. |
| Blinding of outcome assessment (detection bias) | Unclear risk | Not reported |
| Methods | Design: cluster RCT by 14 matched universities Attrition: N/A | |
| Participants | Age: 88.5% < 24 years Allocation: 7 (1117) intervention and 7 (1119) control | |
| Interventions | Intervention: social norms marketing campaign Duration: 3‐year campaign | |
| Outcomes | 30‐day frequency, drinks per week, drinks when partying, recent maximum consumption, BAC, alcohol‐related consequences | |
| Funding and Declared Conflicts of Interest | Funded by NIAAA and US Department of Education; no information about potential conflicts of interest | |
| Notes | No adjustment for clustering effects | |
| Risk of bias | ||
| Bias | Authors' judgement | Support for judgement |
| Random sequence generation (selection bias) | Unclear risk | No information |
| Allocation concealment (selection bias) | Unclear risk | Not discussed in this study |
| Incomplete outcome data (attrition bias) | Unclear risk | Sample surveys undertaken at each time point; no follow‐up of individuals |
| Selective reporting (reporting bias) | Low risk | All outcomes reported |
| Blinding of participants and personnel (performance bias) | High risk | Blinding of participants and personnel not possible for the intervention |
| Blinding of outcome assessment (detection bias) | Unclear risk | Not reported |
| Methods | Design: cluster RCT Follow‐up: 6 weeks and 3 months Attrition: 44% at 3 months | |
| Participants | Age: 18 years to 20 years, mean = 18.10 (SD = 0.61) Sex: 58% male Size: N = 3 classes and 52 students Allocation: 2 (28) intervention and 1 (24) control Country: USA | |
| Interventions | Intervention: personalised normative feedback Key components: personalised feedback, normative data regarding drinking and related risks. Normative feedback: personalised graphical feedback on individual drinking levels in relation to national peer norms (pie chart), summary of alcohol consumption in past year, approximate financial cost, calories associated with drinking, how quickly the body processes alcohol, associated risk status for negative consequences and risk status for problematic drinking based on (AUDIT) score Delivery: web‐based Duration: 15 minutes Control: web‐based alcohol education | |
| Outcomes | Drinking quantity and peak consumption (DDQ), frequency of drinking to intoxication | |
| Funding and Declared Conflicts of Interest | No information | |
| Notes | No adjustment for clustering effects | |
| Risk of bias | ||
| Bias | Authors' judgement | Support for judgement |
| Random sequence generation (selection bias) | Unclear risk | No information |
| Allocation concealment (selection bias) | Unclear risk | Not discussed |
| Incomplete outcome data (attrition bias) | High risk | Attrition = 44% at 3 months |
| Selective reporting (reporting bias) | Low risk | All outcomes reported on |
| Blinding of participants and personnel (performance bias) | High risk | Blinding of participants not possible for this intervention |
| Blinding of outcome assessment (detection bias) | Unclear risk | Not reported |
| Methods | Design: RCT Follow‐up: 1 month Attrition: 11.8% | |
| Participants | Age: 18 years to 24 years, mean = 19.24 (SD = 1.33) Sex: 72.4% male Size: N = 76 mandated students Allocation: 46 intervention and 31 control (as reported, although N = 77) Country: USA | |
| Interventions | Intervention: personalised normative feedback Key components: personalised normative feedback and normative data. Normative feedback: personalised and normative graphical feedback on level of drinking relative to US peers norms Delivery: web‐based Duration: 15 minutes Control: web‐based alcohol education | |
| Outcomes | Drinking quantity and peak consumption (DDQ), frequency of drinking to intoxication, RAPI, AUDIT | |
| Funding and Declared Conflicts of Interest | No information | |
| Notes | ||
| Risk of bias | ||
| Bias | Authors' judgement | Support for judgement |
| Random sequence generation (selection bias) | Low risk | Computer‐generated random numbers table |
| Allocation concealment (selection bias) | Unclear risk | No information |
| Incomplete outcome data (attrition bias) | Low risk | Attrition = 11.8% |
| Selective reporting (reporting bias) | Low risk | All outcomes reported on |
| Blinding of participants and personnel (performance bias) | High risk | Blinding of participants not possible for the intervention |
| Blinding of outcome assessment (detection bias) | Unclear risk | Not reported |
| Methods | Design: cluster RCT Follow‐up: 3 months Attrition: 38% | |
| Participants | Age: 18 years to 54 years, mean = 21.99 (SD = 7.69) Sex: 59% male Size: N = 6 classes and 70 students Allocation: 3 (28) intervention and 3 (42) control Country: USA | |
| Interventions | Intervention: Electronic‐Check Up To Go (e‐CHUG) Key components: personalised normative feedback. Normative feedback: personalised feedback regarding drinking and its associated risks, normative data for the university population Delivery: web‐based Duration: 15 minutes Control: assessment only | |
| Outcomes | Drinking quantity and peak consumption (DDQ), frequency of drinking to intoxication, RAPI, AUDIT | |
| Funding and Declared Conflicts of Interest | No information | |
| Notes | No adjustment for clustering effects | |
| Risk of bias | ||
| Bias | Authors' judgement | Support for judgement |
| Random sequence generation (selection bias) | Unclear risk | No information |
| Allocation concealment (selection bias) | Unclear risk | Not discussed |
| Incomplete outcome data (attrition bias) | High risk | Attrition = 38% from randomisation, 35% from baseline |
| Selective reporting (reporting bias) | Low risk | All outcomes reported on |
| Blinding of participants and personnel (performance bias) | High risk | Blinding of participants not possible for this intervention |
| Blinding of outcome assessment (detection bias) | Unclear risk | Not reported |
| Methods | Design: RCT Follow‐up: 6 months Attrition: 87.29% from randomisation, 66.95% from baseline | |
| Participants | Age: mean = 19.0 years (SD = 1.7) Sex: 58% female Size: N = 115 heavier drinkers Allocation: 76 intervention and 39 control Country: USA | |
| Interventions | Intervention: normative feedback alone. Key components: BASICS; personalised feedback, normative information. Normative feedback: individuals' personalised feedback with information on normative perceptions and their influence Delivery: individual face‐to‐face Duration: not discussed for intervention arms, control arms one to two hours Control: assessment only | |
| Outcomes | Drinks per day in average week, AUDIT, RAPI | |
| Funding and Declared Conflicts of Interest | Funded by Ohio State University Wellness Award; no information about potential CoI | |
| Notes | ||
| Risk of bias | ||
| Bias | Authors' judgement | Support for judgement |
| Random sequence generation (selection bias) | Unclear risk | No information |
| Allocation concealment (selection bias) | Unclear risk | Not discussed |
| Incomplete outcome data (attrition bias) | High risk | Attrition = 87% at follow‐up |
| Selective reporting (reporting bias) | High risk | Not all prespecified outcomes reported on |
| Blinding of participants and personnel (performance bias) | High risk | Blinding of participants or personnel not possible for the intervention |
| Blinding of outcome assessment (detection bias) | Unclear risk | Not reported |
| Methods | Design: RCT Follow‐up: 3 months and 6 months Attrition: intervention: 3 months = 62%, 6 months = 76%; control: 3 months = 65%, 6 months = 76% | |
| Participants | Age: 18 years to 25 years, 13 participants over 26 years of age Sex: intervention group: 46% male; control group: 37% male Size: N = 295 risky drinkers Allocation: 150 intervention and 145 control Country: Sweden | |
| Interventions | Intervention: E‐Screening and Brief Intervention Key components: statements summarising weekly consumption, frequency of heavy episodic drinking and highest BAC in past three months, compared with Swedish safe drinking limits, and normative feedback along with advice on reducing unhealthy levels. Normative feedback: comprehensive feedback on individual alcohol used compared with peers at the university Delivery: web‐based Duration: not discussed Control: very brief summary only feedback | |
| Outcomes | Weekly consumption, heavy episodic drinking, peak BAC, risky drinker status | |
| Funding and Declared Conflicts of Interest | No funding; one study author declared, "Partner of a company that develops similar applications as the one used in this study" | |
| Notes | ||
| Risk of bias | ||
| Bias | Authors' judgement | Support for judgement |
| Random sequence generation (selection bias) | Low risk | "Computerized assignment to groups" |
| Allocation concealment (selection bias) | Unclear risk | Not reported |
| Incomplete outcome data (attrition bias) | High risk | High attrition (76%) |
| Selective reporting (reporting bias) | Low risk | All outcomes reported |
| Blinding of participants and personnel (performance bias) | High risk | Blinding of personnel not possible for this intervention |
| Blinding of outcome assessment (detection bias) | Low risk | Web‐based remote administration |
| Methods | Design: RCT Follow‐up: 1 month Attrition: 5% | |
| Participants | Age: 19.28 years (SD = 1.97) Sex: 70% female Size: N = 177 students with increased depression scores Allocation: 89 intervention and 88 control Country: USA | |
| Interventions | Intervention: personalised alcohol feedback Key components: the student's drinking percentile was calculated on the basis of comparison of the student's reported drinks per week to drinking rates from a survey of approximately 6000 students. Normative feedback: information about the role of alcohol in the cause and/or maintenance of depression was first presented, followed by the student's drinking rates and experienced alcohol‐related problems or consequences, including how these rates compared with other college students on campus. Perceptions of the normative drinking rates on campus were juxtaposed with actual drinking rates on campus. Finally, a general list of moderation tips was provided (e.g. spacing drinks, limit setting). Personalised feedback about depression symptoms and a depression tips brochure were also provided Delivery: mailed feedback Duration: N/A Control group: students received thank you letter and a list of community resources | |
| Outcomes | Perceived norms (Drinking Norms Rating Form; DNRF), DDQ, RAPI | |
| Funding and Declared Conflicts of Interest | Funded by NIAAA and the Stanley Foundation. No information about potential CoI | |
| Notes | Intervention delivered as an adjunct to a brief treatment for college students with depression symptoms | |
| Risk of bias | ||
| Bias | Authors' judgement | Support for judgement |
| Random sequence generation (selection bias) | Low risk | "Determined by a computerized random number generator" |
| Allocation concealment (selection bias) | Unclear risk | Not reported |
| Incomplete outcome data (attrition bias) | Low risk | Low attrition (5%) |
| Selective reporting (reporting bias) | Low risk | All outcomes reported |
| Blinding of participants and personnel (performance bias) | High risk | Blinding of participants not possible for the intervention |
| Blinding of outcome assessment (detection bias) | Unclear risk | Not reported |
| Methods | Design: cluster RCT Follow‐up: 5 weeks Attrition: 52.3% | |
| Participants | Age: mean = 18.11 years (SD = 0.40) Sex: 36.6% males Size: N = 14 classes and 216 students Allocation: no information Country: USA | |
| Interventions | Intervention: personalised feedback lecture Key components: information on estimated BAC on typical and peak drinking occasions, self‐reported negative consequences, weekly average number of standard drinks, amount of time and money allocated to alcohol. Strategies to reduce risky drinking behaviours. Normative feedback: personalised feedback about participant's alcohol use based on baseline, gender‐specific normative data Delivery: group face‐to‐face Duration: 50 minutes (standard lecture duration) Control: alcohol information only | |
| Outcomes | Binge drinking, AUDIT, RAPI | |
| Funding and Declared Conflicts of Interest | No information | |
| Notes | Significant differences between students who completed and those who did not complete follow‐up assessments. No adjustment for clustering effects | |
| Risk of bias | ||
| Bias | Authors' judgement | Support for judgement |
| Random sequence generation (selection bias) | Unclear risk | No information |
| Allocation concealment (selection bias) | Unclear risk | Not discussed |
| Incomplete outcome data (attrition bias) | High risk | Attrition = 52.3% at follow‐up |
| Selective reporting (reporting bias) | Low risk | All outcomes reported on |
| Blinding of participants and personnel (performance bias) | High risk | Blinding of participants and personnel not possible for the intervention |
| Blinding of outcome assessment (detection bias) | Unclear risk | Not reported |
| Methods | Design: RCT | |
| Participants | Age: 19.43 years Allocation: no information | |
| Interventions | I. Mailed feedback control Duration: N/A II. Individual face‐to‐face feedback and MI or MI only Duration: from 30 minutes to 80 minutes | |
| Outcomes | Drinks per day, peak BAC, alcohol‐related problems | |
| Funding and Declared Conflicts of Interest | Funded by NIAAA; no information about potential CoI | |
| Notes | *Estimated from analysed sample and attrition rate | |
| Risk of bias | ||
| Bias | Authors' judgement | Support for judgement |
| Incomplete outcome data (attrition bias) | High risk | |
| Selective reporting (reporting bias) | Low risk | |
| Blinding of participants and personnel (performance bias) | High risk | |
| Methods | Design: RCT | |
| Participants | Age: mean = 20.15 years Allocation: 51 intervention and 53 control | |
| Interventions | Intervention: brief interventions Delivery: web feedback | |
| Outcomes | Drinking frequency, typical occasion quantity, total volume, heavy episode frequency, alcohol problems scale (APS), academic role expectations and alcohol scale (AREAS) | |
| Funding and Declared Conflicts of Interest | Funded by the Alcohol Advisory Council of New Zealand and the Health Research Council of New Zealand; no information on potential CoI | |
| Notes | ||
| Risk of bias | ||
| Bias | Authors' judgement | Support for judgement |
| Random sequence generation (selection bias) | Low risk | "Randomization was effected by computer in blocks of 10" |
| Allocation concealment (selection bias) | Low risk | "Assigned randomly by computer" |
| Incomplete outcome data (attrition bias) | Low risk | Attrition low (< 10%) |
| Selective reporting (reporting bias) | Low risk | All data reported |
| Blinding of participants and personnel (performance bias) | High risk | Participants not blind to intervention. Personnel blind to intervention group |
| Blinding of outcome assessment (detection bias) | Unclear risk | Blinding of outcome assessor not specified |
| Methods | Design: RCT | |
| Participants | Age: 17 to 24 years Allocation: 72 intervention and 74 control | |
| Interventions | Intervention: brief interventions Duration: no details | |
| Outcomes | 4‐week report of maximum number of drinks consumed in a single episode and the episode’s duration, peak BAC and binge‐drinker status | |
| Funding and Declared Conflicts of Interest | Funded by the National Heart Foundation of New Zealand; no information about potential CoI | |
| Notes | ||
| Risk of bias | ||
| Bias | Authors' judgement | Support for judgement |
| Random sequence generation (selection bias) | Low risk | "Computerized random number generator..." |
| Allocation concealment (selection bias) | Low risk | "Assigned randomly by computer" |
| Incomplete outcome data (attrition bias) | Low risk | Low attrition at 6 weeks (14%) |
| Selective reporting (reporting bias) | Low risk | All data reported |
| Blinding of participants and personnel (performance bias) | High risk | Participants not blind to intervention. Personnel blind to intervention group |
| Blinding of outcome assessment (detection bias) | Low risk | Assessors blinded to intervention group |
| Methods | Design: RCT | |
| Participants | Age: 20.1 Allocation: 138 intervention and 146 control | |
| Interventions | Intervention: brief interventions Duration:10 minutes to 15 minutes of intervention | |
| Outcomes | (1) Frequency of drinking (number of drinking days in the preceding two weeks); (2) typical occasion quantity (standard drinks [10 g of alcohol] consumed per typical drinking occasion in the preceding four weeks); (3) total volume (standard drinks consumed in the preceding two weeks); (4) frequency of very heavy episodes (number of occasions in the preceding two weeks on which a threshold of 80 grams of alcohol for women or 120 grams of alcohol for men was breached); (5) personal, social, sexual and legal consequences of episodic heavy drinking (items endorsed on the Alcohol Problems Scale [score range, 0 to 14]); (6) consequences related to academic performance (score on the Academic Role Expectations and Alcohol Scale [score range, 0 to 35]); and (7) the AUDIT score at 12 months | |
| Funding and Declared Conflicts of Interest | Funded by the Alcohol Advisory Council of New Zealand and the Health Research Council of New Zealand; study authors declare no conflicts | |
| Notes | ||
| Risk of bias | ||
| Bias | Authors' judgement | Support for judgement |
| Random sequence generation (selection bias) | Low risk | "Assigned randomly by computer" |
| Allocation concealment (selection bias) | Low risk | "Assigned randomly by computer" |
| Incomplete outcome data (attrition bias) | Low risk | Low attrition (16%) at 12 months |
| Selective reporting (reporting bias) | Low risk | All data reported |
| Blinding of participants and personnel (performance bias) | High risk | Participants not blind to intervention. Personnel blind to intervention group |
| Blinding of outcome assessment (detection bias) | Low risk | Outcome assessors blind to intervention group |
| Methods | Design: RCT Follow‐up: 1 month and 6 months Attrition: intervention: 23% at 1 month, 35% at 6 months; control: 20% at 1 month, 35% at 6 months | |
| Participants | Age: 17 to 24 years, mean = 19.7 (SD = 1.8) Sex: 45.1% women in intervention arm, 45.5% in control arm Size: N = 2435 at baseline and N = 1578 at 6‐month follow‐up (hazardous or harmful drinkers) Allocation: 1251 intervention and 1184 control Country: Australia | |
| Interventions | Intervention: motivational assessment and personalised feedback Key components: reflection on AUDIT score, alcohol eduction, information on related risks and personalised feedback. Normative feedback: bar graphs comparing episodic and weekly consumption with that of other students of the same age and sex Delivery: web‐based Duration: not discussed Control: assessment/screening only | |
| Outcomes | Primary outcomes: frequency of drinking, number of standard drinks per typical occasion and average weekly volume. Secondary outcomes: APS score, AREAS score, prevalence of binge drinking and prevalence of heavy drinking | |
| Funding and Declared Conflicts of Interest | Funded by Western Australian Health Promotion Foundation (Healthway); study authors declare no conflicts | |
| Notes | ||
| Risk of bias | ||
| Bias | Authors' judgement | Support for judgement |
| Random sequence generation (selection bias) | Low risk | Randomly assigned by web server software |
| Allocation concealment (selection bias) | Low risk | Randomly assigned by web server software |
| Incomplete outcome data (attrition bias) | High risk | Attrition rates 35% at 6 months |
| Selective reporting (reporting bias) | Low risk | All outcomes reported |
| Blinding of participants and personnel (performance bias) | High risk | Participants not blind to intervention. Personnel blind to intervention group |
| Blinding of outcome assessment (detection bias) | Low risk | Outcome assessors blind to intervention group |
| Methods | Design: RCT Follow‐up: 5 months Attrition: intervention: 22%; control: 20% | |
| Participants | Age: 17 years to 24 years old Sex: 65% female Size: N = 1789 Allocation: 850 control and 939 intervention Country: New Zealand, Maori students | |
| Interventions | Intervention: personalised feedback Key components: reflection on AUDIT score, alcohol eduction, information on related risks and personalised feedback. Intervention group received personalised feedback consisting of AUDIT and LDQ scores with explanation of associated health risk and information about how to reduce that risk; an estimated BAC for the heaviest episode in the previous four weeks, with information on behavioural and physiological sequelae of various BACs, and the risk of having a single vehicle traffic crash; estimates of monthly expenditure. Further web pages were presented as options, offering facts about alcohol, tips for reducing the risk of harm and details of where medical help and counselling could be found. Normative feedback: bar graphs comparing episodic and weekly consumption with those of other students of the same age and sex Delivery: web‐based Duration: not discussed Control: assessment/screening only | |
| Outcomes | Frequency of drinking, typical occasion quantity, volume consumed, consequences related to academic expectations, exceeded guidelines for binge drinking, exceeded guidelines for heavy drinking | |
| Funding and Declared Conflicts of Interest | Research was funded by the Alcohol Advisory Council (now the Health Promotion Agency), a statutory body of the New Zealand Government. Study authors declare no conflicts of interest | |
| Notes | ||
| Risk of bias | ||
| Bias | Authors' judgement | Support for judgement |
| Random sequence generation (selection bias) | Low risk | Respondents who scored ≥ 4 were randomly assigned by the web server to the control group (screening only) or the intervention group |
| Allocation concealment (selection bias) | Low risk | Randomisation and all other study procedures were fully automated and could not be subverted |
| Incomplete outcome data (attrition bias) | High risk | Overall attrition rate at 5 months: 21% |
| Selective reporting (reporting bias) | Low risk | All outcomes reported |
| Blinding of participants and personnel (performance bias) | High risk | Blinding of participants not possible for this intervention |
| Blinding of outcome assessment (detection bias) | Low risk | Computer‐based questionnaire |
| Methods | Design: RCT Follow‐up: 5 months Attrition: intervention: 16%; control: 17% | |
| Participants | Age: 17 years to 24 years old Sex: 57.4% female Size: N = 2850 Allocation: 1437 intervention and 1413 control Country: New Zealand | |
| Interventions | Intervention: personalised feedback Key components: reflection on AUDIT score, alcohol education, information on related risks and personalised feedback. Intervention group received personalised feedback consisting of AUDIT and LDQ scores with explanation of associated health risks and information on how to reduce that risk; estimated BAC for the heaviest episode in the previous four weeks, with information on behavioural and physiological sequelae of various BACs, and risk of having a single vehicle traffic crash; estimates of monthly expenditure. Further web pages were presented as options, offering facts about alcohol, tips for reducing the risk of harm and details on where medical help and counselling could be found. Normative feedback: bar graphs comparing episodic and weekly consumption with those of other students of the same age and sex Delivery: web‐based Duration: not discussed Control: assessment/screening only | |
| Outcomes | Frequency of drinking, typical occasion quantity, volume consumed, consequences related to academic expectations, exceeded guidelines for binge drinking, exceeded guidelines for heavy drinking | |
| Funding and Declared Conflicts of Interest | Research was funded by the Alcohol Advisory Council (now the Health Promotion Agency), a statutory body of the New Zealand Government. Study authors declare no conflicts of interest | |
| Notes | ||
| Risk of bias | ||
| Bias | Authors' judgement | Support for judgement |
| Random sequence generation (selection bias) | Low risk | Respondents who scored ≥ 4 were randomly assigned by the web server to the control group (screening only) or the intervention group |
| Allocation concealment (selection bias) | Low risk | Randomisation and all other study procedures were fully automated and could not be subverted |
| Incomplete outcome data (attrition bias) | Low risk | Attrition rates at 5 months: 17% |
| Selective reporting (reporting bias) | Low risk | All outcomes reported |
| Blinding of participants and personnel (performance bias) | High risk | Blinding of participants not possible for this intervention |
| Blinding of outcome assessment (detection bias) | Low risk | Computer‐based questionnaire |
| Methods | Design: individual and RCT | |
| Participants | Age: 18 years to 24 years of age Sex: 56.7% female Size: N = 2831 Allocation: 168 control and 1663 intervention Country: USA | |
| Interventions | Intervention: personalised feedback Key components: PNF contained four pages of information in text and bar graph format. Separate graphs, each including three bars, were used to present information regarding the number of drinking days per week, average drinks per occasion and total average drinks per week for (1) one’s own drinking behaviour, (2) their reported perceptions of the reference group’s drinking behaviour on their respective campus, at the level of specificity defined by the assigned intervention condition and (3) actual college student drinking norms for the specified reference group. Actual norms were derived from large representative surveys conducted on each campus in the prior year as a formative step in the trial. Participants were also provided their percentile ranks and compared them with other students on their respective campus for the specified reference group (e.g. “Your percentile rank is 99%; this means that you drink as much or more than 99% of other college students on your campus”) Delivery: web‐based Duration: not discussed Control: assessment only Means of delivery: web | |
| Outcomes | Alcohol consumption (DDQ); descriptive norms; alcohol‐related negative consequences | |
| Funding and Declared Conflicts of Interest | No conflicts of interest. Data collection and manuscript preparation supported by National Institute on Alcohol Abuse and Alcoholism Grant R01AA012547‐06A2 | |
| Notes | ||
| Risk of bias | ||
| Bias | Authors' judgement | Support for judgement |
| Random sequence generation (selection bias) | Low risk | Web‐based algorithm |
| Allocation concealment (selection bias) | Unclear risk | No information |
| Incomplete outcome data (attrition bias) | Low risk | 14.5% at 6‐month follow‐up |
| Selective reporting (reporting bias) | Low risk | All outcomes reported |
| Blinding of participants and personnel (performance bias) | High risk | Blinding of participants not possible for this intervention |
| Blinding of outcome assessment (detection bias) | Unclear risk | No information |
| Methods | Design: cluster RCT (each cluster with 4 to 10 participants) Follow‐up: immediate post‐test, 3 months and 6 months Attrition: 20% attrition at 3‐month follow‐up, 24% attrition at 6 months (from baseline) | |
| Participants | Age: mean = 18.6 years Sex: 63% male Size: N = 18 groups with 126 mandated participants Allocation: 10 (68) intervention and 8 (58) control Country: USA | |
| Interventions | Intervention: Group Motivational Enhancement Therapy session (GMET) Key components: during the feedback component of the GMET, students were provided personalised feedback handouts including their own self‐reported drinking patterns. Normative feedback: During feedback, students were provided personalised feedback handouts including their own self‐reported drinking patterns, quantity/frequency rates, BAC levels and other drug use, compared with national averages Delivery: group face‐to‐face Duration: 1 to 2 3‐hour sessions Control: Alcohol Information Group | |
| Outcomes | Average drinks per drinking day, AUDIT, RAPI | |
| Funding and Declared Conflicts of Interest | Funded by NIH; no information about potential CoI | |
| Notes | The third arm in this study was not considered for the purpose of this review. Only the GMET (intervention) and AI groups were considered, with AI most similar to control arms from other included studies 'Unit of analysis' issues due to CRCT accounted for via multi‐level analysis | |
| Risk of bias | ||
| Bias | Authors' judgement | Support for judgement |
| Random sequence generation (selection bias) | Low risk | Randomisation by the roll of a dice occurred after groups were scheduled, 24 hours before the group |
| Allocation concealment (selection bias) | Unclear risk | Not discussed |
| Incomplete outcome data (attrition bias) | High risk | Attrition = 20% at 3 months, 24% at 6 months of follow‐up |
| Selective reporting (reporting bias) | Unclear risk | Nearly all outcomes were reported on (results for 1 measure of quantity were not provided in the publication) |
| Blinding of participants and personnel (performance bias) | High risk | Blinding of participants and personnel not possible for the intervention |
| Blinding of outcome assessment (detection bias) | Unclear risk | Not reported |
| Methods | Design: cluster RCT of 12 fraternities | |
| Participants | Age: 18.8 Allocation: 6 (77) intervention and 6 (82) control | |
| Interventions | Intervention: BASICS and MI Delivery: face‐to‐face | |
| Outcomes | Quantity, frequency, peak and typical BAC, RAPI, ADS | |
| Funding and Declared Conflicts of Interest | Funded by NIAAA; no information about potential CoI | |
| Notes | Controlled for cluster effects by co‐variate adjustment; unclear how appropriate this is | |
| Risk of bias | ||
| Bias | Authors' judgement | Support for judgement |
| Random sequence generation (selection bias) | Unclear risk | No information |
| Allocation concealment (selection bias) | Unclear risk | No information |
| Incomplete outcome data (attrition bias) | High risk | High attrition (25%) |
| Selective reporting (reporting bias) | Low risk | All outcomes reported |
| Blinding of participants and personnel (performance bias) | High risk | Blinding of participants and personnel not possible for the intervention |
| Blinding of outcome assessment (detection bias) | Unclear risk | Not reported |
| Methods | Design: RCT Follow‐up: 1 month Attrition: 40.7% | |
| Participants | Age: mean = 19.88 years (SD = 2.08) Sex: 56.68% female Size: N = 239 moderate to heavy drinkers Allocation: no information Country: USA | |
| Interventions | Intervention: alcohol 101 Key components: normative feedback: to educate students about the effects of alcohol misused and what constitutes “normal” drinking among their peers Delivery: group computer‐based (CD) Duration: 90 minutes to 120 minutes Control group: assessment only | |
| Outcomes | Drinks per week, heavy episodic drinking | |
| Funding and Declared Conflicts of Interest | Funded by NIAAA | |
| Notes | ||
| Risk of bias | ||
| Bias | Authors' judgement | Support for judgement |
| Random sequence generation (selection bias) | Unclear risk | Randomised using an expected 2:1:1 assignment ratio, but no information about sequence generation method |
| Allocation concealment (selection bias) | Unclear risk | Not discussed |
| Incomplete outcome data (attrition bias) | High risk | Attrition = 40.7% at follow‐up |
| Selective reporting (reporting bias) | Low risk | All outcomes were reported on |
| Blinding of participants and personnel (performance bias) | High risk | Blinding of participants and personnel not possible for the intervention |
| Blinding of outcome assessment (detection bias) | Unclear risk | Not reported |
| Methods | Design: RCT | |
| Participants | Age: mean = 18.53 years Allocation: no information Country: USA | |
| Interventions | Intervention: social norm intervention Duration: 1 hour | |
| Outcomes | Drinks per week and drinking frequency (DDQ), alcohol consumption inventory (ACI), quantity‐frequency scale (QFS), drinking norms rating form (DNRF) | |
| Funding and Declared Conflicts of Interest | No information | |
| Notes | ||
| Risk of bias | ||
| Bias | Authors' judgement | Support for judgement |
| Random sequence generation (selection bias) | Unclear risk | Not discussed in this study |
| Allocation concealment (selection bias) | Unclear risk | Not discussed in this study |
| Incomplete outcome data (attrition bias) | Low risk | Low attrition at 5 months (11%) |
| Selective reporting (reporting bias) | Low risk | All data reported |
| Blinding of participants and personnel (performance bias) | High risk | Blinding of participants not possible for the intervention |
| Blinding of outcome assessment (detection bias) | Unclear risk | Blinding of outcome assessor not specified |
| Methods | Design: RCT | |
| Participants | Age: mean = 18.53 years Allocation: no information | |
| Interventions | Intervention: PNF Key components: normative feedback: personal drinking behaviour, personal perceptions of typical student drinking behaviour, information regarding actual norms for typical student drinking behaviour and their rank in comparison with other students Delivery: computer‐based | |
| Outcomes | Drinks per week and drinking frequency (DDQ), drinking norms rating form (DNRF) | |
| Funding and Declared Conflicts of Interest | Funded by NIAAA; no information about potential CoI | |
| Notes | ||
| Risk of bias | ||
| Bias | Authors' judgement | Support for judgement |
| Random sequence generation (selection bias) | Unclear risk | No information |
| Allocation concealment (selection bias) | Unclear risk | No information |
| Incomplete outcome data (attrition bias) | Low risk | Low attrition at 5 months (15%) |
| Selective reporting (reporting bias) | Low risk | All data reported |
| Blinding of participants and personnel (performance bias) | High risk | Blinding of participants not possible for the intervention |
| Blinding of outcome assessment (detection bias) | Unclear risk | Blinding of outcome assessor not specified |
| Methods | Design: RCT Follow‐up: 1 week after 21st birthday Attrition: intervention: 79.1%; control: 76.3% | |
| Participants | Age: 20 years to 21 years Sex: 35.3% male Size: N = 281 Allocation: no information Country: USA | |
| Interventions | Intervention: 21st birthday‐specific PNF card Key components: personalised normative feedback: feedback in the form of questions and answers that corrected students' misperceptions by providing actual normative data Delivery: mailed Duration: not discussed Control: no intervention given | |
| Outcomes | Hours spent drinking during 21st birthday celebrations, BAC, RAPI | |
| Funding and Declared Conflicts of Interest | Funded by NIAAA; no information about potential CoI | |
| Notes | “Because baseline drinking was not assessed, it is unknown whether the two groups differed in terms of typical drinking behaviour” | |
| Risk of bias | ||
| Bias | Authors' judgement | Support for judgement |
| Random sequence generation (selection bias) | Unclear risk | No information |
| Allocation concealment (selection bias) | Unclear risk | Not discussed |
| Incomplete outcome data (attrition bias) | High risk | High attrition (79%) |
| Selective reporting (reporting bias) | Low risk | All outcomes reported on |
| Blinding of participants and personnel (performance bias) | High risk | Blinding of participants not possible for the intervention |
| Blinding of outcome assessment (detection bias) | Unclear risk | Not reported |
| Methods | Design: RCT Follow‐up: 3 months and 6 months Attrition: 10% at 3 months, 14.7% at 6 months | |
| Participants | Age: 18 to 25 years, mean = 19.90 Sex: 57.6% female Size: N = 240 in trial arms included in this review Allocation: intervention 119 and control 121 Country: USA | |
| Interventions | Intervention: PNF Key components: personalised normative feedback: feedback provided a percentile rank for comparison between participants’ reported drinking and that of their same‐sex peers Delivery: web‐based Duration: not discussed Control: assessment only | |
| Outcomes | Drinks per week; drinks per occasion; drinking frequency; alcohol‐related negative consequences; perceived drinks per week; perceived drinks per occasion; perceived drinking frequency | |
| Funding and Declared Conflicts of Interest | Funding and declared conflicts of interest not stated | |
| Notes | ||
| Risk of bias | ||
| Bias | Authors' judgement | Support for judgement |
| Random sequence generation (selection bias) | Low risk | “Random assignment was administered automatically using a computer algorithm and occurred in blocks of four to keep cell sizes equal” |
| Allocation concealment (selection bias) | Low risk | Web‐based |
| Incomplete outcome data (attrition bias) | Low risk | Attrition 14.7% |
| Selective reporting (reporting bias) | Low risk | All outcomes reported |
| Blinding of participants and personnel (performance bias) | High risk | Blinding of participants not possible for the intervention |
| Blinding of outcome assessment (detection bias) | Unclear risk | Not stated |
| Methods | Design: RCT Follow‐up: 1 month Attrition: intervention: 8.51%; control: 32.1% | |
| Participants | Age: 83.6% were aged 18 years Sex: 54.3% female. Size: N = 1620 (1458 completed baseline) Allocation: 810 intervention and 810 control Country: USA | |
| Interventions | Intervention: AlcoholEdu (2007 version) Key components: 2007 AlcoholEdu course. Normative feedback: baseline survey of attitudes, behaviour and consequences; four content chapters, with customised pathways based on gender and reported drinking patterns; a course evaluation; a post‐intervention knowledge test; and a post‐intervention survey, similar to the baseline survey, which was completed four to six weeks after the course. Areas of focus include factors that cause blood alcohol concentration (BAC) to rise rapidly and associated consequences, benefits of abstaining from or reducing drinking, influences and correct norms information, legal information and strategies to reduce drinking Delivery: web‐based Duration: not discussed Control: assessment only | |
| Outcomes | Typical average number of drinks per occasion, total number of drinks in past two weeks, heavy episodic drinking in past two weeks | |
| Funding and Declared Conflicts of Interest | No information | |
| Notes | ||
| Risk of bias | ||
| Bias | Authors' judgement | Support for judgement |
| Random sequence generation (selection bias) | Unclear risk | No information |
| Allocation concealment (selection bias) | Unclear risk | Not discussed |
| Incomplete outcome data (attrition bias) | High risk | Attrition = 8.51% in intervention arm, 32.1% in control arm |
| Selective reporting (reporting bias) | Low risk | All outcomes were reported on |
| Blinding of participants and personnel (performance bias) | High risk | Blinding of participants and personnel not possible for the intervention |
| Blinding of outcome assessment (detection bias) | Unclear risk | Not reported |
| Methods | Design: RCT | |
| Participants | Age: not given Allocation: no information | |
| Interventions | Intervention: MI Duration: no details | |
| Outcomes | Typical drinking quantity, frequency and single greatest amount of alcohol consumption (peak consumption) over the past month, DDQ, RAPI, ADS | |
| Funding and Declared Conflicts of Interest | Funded by NIAAA; no information about potential CoI | |
| Notes | ||
| Risk of bias | ||
| Bias | Authors' judgement | Support for judgement |
| Random sequence generation (selection bias) | Low risk | "Computer generated...." |
| Allocation concealment (selection bias) | Unclear risk | Not discussed in this study |
| Incomplete outcome data (attrition bias) | Low risk | Low attrition (14%) |
| Selective reporting (reporting bias) | Low risk | All data reported |
| Blinding of participants and personnel (performance bias) | High risk | Blinding of participants and personnel not possible for the intervention |
| Blinding of outcome assessment (detection bias) | Unclear risk | Blinding of outcome assessor not specified |
| Methods | Design: individual and RCT | |
| Participants | Age: mean = 20.10 years Ethnicity: 89% Caucasian Allocation: PNF 121 and control 133 | |
| Interventions | Intervention: PNF Duration: 15 minutes to 20 minutes Control: protective behavioural strategies feedback (PBSF). In the PBSF condition, the facilitator began the session by indicating that the overall goal was to discuss strategies that minimised harmful effects that could occur as the result of alcohol use | |
| Outcomes | Average drinks per week, average number of drinking days per week, peak blood alcohol concentration (BAC), alcohol‐related problems, descriptive drinking norms | |
| Funding and Declared Conflicts of Interest | No conflicts of interest declared. This project was supported by National Institutes of Health Grant R21AA016779 | |
| Notes | ||
| Risk of bias | ||
| Bias | Authors' judgement | Support for judgement |
| Random sequence generation (selection bias) | Low risk | Participants were randomly assigned, stratified by gender, via a random number table |
| Allocation concealment (selection bias) | Unclear risk | Insufficient information to allow a judgement |
| Incomplete outcome data (attrition bias) | Low risk | Low attrition (6%) |
| Selective reporting (reporting bias) | Low risk | All alcohol outcomes reported |
| Blinding of participants and personnel (performance bias) | High risk | Not possible to blind participants to intervention. Information insufficient for a judgement about blinding of interventionist |
| Blinding of outcome assessment (detection bias) | Unclear risk | Information insufficient to allow a judgement |
| Methods | Design: cluster RCT | |
| Participants | Age: mean = 18.99 years Allocation: no information | |
| Interventions | Intervention: MI Duration: 30‐minute assessment followed by 40‐minute group intervention; 20‐ to 30‐minute follow‐up session | |
| Outcomes | Quantity, binge and alcohol problems | |
| Funding and Declared Conflicts of Interest | No information | |
| Notes | No adjustment for clustering | |
| Risk of bias | ||
| Bias | Authors' judgement | Support for judgement |
| Random sequence generation (selection bias) | Low risk | "...Randomization table" |
| Allocation concealment (selection bias) | Unclear risk | Not discussed |
| Incomplete outcome data (attrition bias) | Unclear risk | Attrition rate not stated |
| Selective reporting (reporting bias) | Low risk | All outcomes reported |
| Blinding of participants and personnel (performance bias) | High risk | Blinding of participants and personnel not possible for the intervention |
| Blinding of outcome assessment (detection bias) | Unclear risk | Blinding of outcome assessor not specified |
| Methods | Design: cluster RCT Attrition: none | |
| Participants | Age: mean = 18.35 years Allocation: intervention 7 (47) and control 7 (44) | |
| Interventions | Intervention: MI counselling style Duration: 2 x 50‐minute and 1 x 75 minute MI sessions | |
| Outcomes | 30‐day drinking frequency, 30‐day drunkenness, 14‐day drinking diary, RAPI | |
| Funding and Declared Conflicts of Interest | No information | |
| Notes | Randomly assigned by classes, no adjustment for clustering | |
| Risk of bias | ||
| Bias | Authors' judgement | Support for judgement |
| Random sequence generation (selection bias) | Unclear risk | No information |
| Allocation concealment (selection bias) | Unclear risk | Not discussed in this study |
| Incomplete outcome data (attrition bias) | Low risk | No attrition |
| Selective reporting (reporting bias) | Low risk | All outcomes reported |
| Blinding of participants and personnel (performance bias) | High risk | Blinding of participants and personnel not possible for the intervention |
| Blinding of outcome assessment (detection bias) | Unclear risk | Blinding of outcome assessor not specified |
| Methods | Design: cluster RCT | |
| Participants | Age: median = 19 years Allocation: intervention 261 and control 293 (students responded to the survey) | |
| Interventions | Intervention: social norms marketing campaign Components: social norm message was given by posters, drinks mats, glasses. Normative information: the intervention is a social norm marketing campaign to correct misperceptions regarding behaviours and social expectations of peers among first year students Delivery: marketing materials Duration: materials distributed in September 2011 and January 2012. Follow‐up survey was given in February 2012 Control: assessment only. | |
| Outcomes | Units/wk; AUDIT‐C; risky drinking status; perceived norms | |
| Funding and Declared Conflicts of Interest | This work was supported by an Alcohol Research UK grant funded by the | |
| Notes | Post‐test only design. Moore reported adequate adjustment for clustering. | |
| Risk of bias | ||
| Bias | Authors' judgement | Support for judgement |
| Random sequence generation (selection bias) | Low risk | Random number |
| Allocation concealment (selection bias) | Low risk | Blinded remote allocation |
| Incomplete outcome data (attrition bias) | Low risk | Post‐test survey responses only |
| Selective reporting (reporting bias) | Low risk | All outcomes reported |
| Blinding of participants and personnel (performance bias) | High risk | Blinding not feasible for participants and personnel |
| Blinding of outcome assessment (detection bias) | Low risk | Computer‐based survey |
| Methods | Design: RCT Follow‐up: 6 months and 12 months Attrition: 49% at 6 months, 60% at 12 months | |
| Participants | Age: majority 17 years to 24 years, 6% over 25 years Sex: 61.5% female Size: N = 1751 Allocation: 872 intervention and 879 control Country: UK | |
| Interventions | Intervention: brief personalised normative feedback Key components: social normative feedback and general information on alcohol use and effects. Normative feedback: results of drinking behaviour assessment compared with average levels of drinking amongst student peer group Delivery: web‐based Duration: N/A Control: assessment only | |
| Outcomes | Frequency, quantity, binge drinking, AUDIT, alcohol‐related problems, drinking norms | |
| Funding and Declared Conflicts of Interest | Funded by a fellowship from the Portuguese Foundation for Science and Technology, and by Alcohol Research UK and the European Foundation for Alcohol Research. One study author declared that his Department has received funding from the alcohol industry for prevention projects, and that he is a Trustee of the alcohol‐industry–funded Drinkaware Trust | |
| Notes | Unpublished data | |
| Risk of bias | ||
| Bias | Authors' judgement | Support for judgement |
| Random sequence generation (selection bias) | Low risk | "Computer generated random numbers" |
| Allocation concealment (selection bias) | Low risk | "Concealed centrally‐allocated computer generated random numbers" |
| Incomplete outcome data (attrition bias) | High risk | Attrition = 49% at 6 months and 60% at 12 months |
| Selective reporting (reporting bias) | Low risk | All outcomes were reported on |
| Blinding of participants and personnel (performance bias) | High risk | Blinding of participants not possible for the intervention |
| Blinding of outcome assessment (detection bias) | Low risk | Web‐based anonymous administration |
| Methods | Design: RCT | |
| Participants | Age: mean = 19.60 years Allocation: no information | |
| Interventions | Intervention: based on BASICS Duration: 50 minutes | |
| Outcomes | Drinks per week, frequency of binge drinking | |
| Funding and Declared Conflicts of Interest | No information | |
| Notes | ||
| Risk of bias | ||
| Bias | Authors' judgement | Support for judgement |
| Random sequence generation (selection bias) | Unclear risk | No information |
| Allocation concealment (selection bias) | Unclear risk | Not discussed in this study |
| Incomplete outcome data (attrition bias) | Low risk | Low attrition (15%) |
| Selective reporting (reporting bias) | Low risk | All outcomes reported |
| Blinding of participants and personnel (performance bias) | High risk | Blinding of participants and personnel not possible for the intervention |
| Blinding of outcome assessment (detection bias) | Unclear risk | Blinding of outcome assessor not specified |
| Methods | Design: RCT Attrition: none | |
| Participants | Age: not given Allocation: 31 intervention and 30 control | |
| Interventions | Intervention: social norms intervention Duration: 45 minutes session I; 40 minutes session II | |
| Outcomes | Drinking days, total drinks, binge episodes, peak consumption, drinks/drinking day | |
| Funding and Declared Conflicts of Interest | Funded by NIAAA; no information on potential CoI | |
| Notes | ||
| Risk of bias | ||
| Bias | Authors' judgement | Support for judgement |
| Random sequence generation (selection bias) | Unclear risk | No information |
| Allocation concealment (selection bias) | Unclear risk | Not discussed in this study |
| Incomplete outcome data (attrition bias) | Low risk | No attrition |
| Selective reporting (reporting bias) | Low risk | All outcomes reported |
| Blinding of participants and personnel (performance bias) | High risk | Blinding of participants and personnel not possible for the intervention |
| Blinding of outcome assessment (detection bias) | Unclear risk | Not discussed in this study |
| Methods | Design: RCT | |
| Participants | Age: not given Allocation: 126 intervention and 126 control | |
| Interventions | Intervention: brief intervention Duration: n/a | |
| Outcomes | Alcohol consumption index (ACI), peak quantity, typical drinking (DDQ), RAPI, drinking norms rating form | |
| Funding and Declared Conflicts of Interest | Funded by NIAAA and Alcohol and Drug Abuse Institute at the University of Washington; no information about potential CoI | |
| Notes | ||
| Risk of bias | ||
| Bias | Authors' judgement | Support for judgement |
| Random sequence generation (selection bias) | Unclear risk | Not stated |
| Allocation concealment (selection bias) | Unclear risk | Not stated |
| Incomplete outcome data (attrition bias) | Low risk | Low attrition (18%) and analysis of missing data showed no differential attrition effect |
| Selective reporting (reporting bias) | Low risk | All outcomes reported |
| Blinding of participants and personnel (performance bias) | High risk | Blinding of participants not possible for the intervention |
| Blinding of outcome assessment (detection bias) | Unclear risk | Not reported |
| Methods | Design: RCT | |
| Participants | Age: mean = 19.67 years Allocation: 108 intervention and 106 control | |
| Interventions | Intervention: modelled on BASICS Duration: no details | |
| Outcomes | DDQ, RAPI, DNRF | |
| Funding and Declared Conflicts of Interest | Funded by NIAAA and North Dakota State University; no information about potential CoI | |
| Notes | ||
| Risk of bias | ||
| Bias | Authors' judgement | Support for judgement |
| Random sequence generation (selection bias) | Unclear risk | No information |
| Allocation concealment (selection bias) | Unclear risk | Not discussed in this study |
| Incomplete outcome data (attrition bias) | Low risk | Low attrition at 6 months (14%) |
| Selective reporting (reporting bias) | Low risk | All data reported |
| Blinding of participants and personnel (performance bias) | High risk | Blinding of participants not possible for the intervention |
| Blinding of outcome assessment (detection bias) | Unclear risk | Blinding of outcome assessor not specified |
| Methods | Design: RCT Follow‐up: approximately 1 week after 21st birthday Attrition: 14.9% | |
| Participants | Age: 20 years to 21 years Sex: 41.9% males Size: N = 295 drinkers Allocation: 150 intervention and 145 control Country: USA | |
| Interventions | Intervention: web‐based personalised feedback Key components: normative information, protective behaviours and personalised BAC information. Normative feedback: feedback about intended number of drinks on 21st birthday, resulting intended BAC and effects of alcohol at varying BACs. Participants were provided a printable personalised BAC chart based on gender and weight. In addition, participants received graphic feedback regarding perceived and actual descriptive norms (in this case 6.80 drinks) for drinking on 21st birthdays Delivery: web‐based Duration: feedback document was nine pages long Control: assessment only control group | |
| Outcomes | 21st birthday drinking, BAC, weekly drinking | |
| Funding and Declared Conflicts of Interest | Funded by NIAAA and Alcohol and Drug Abuse Institute at the University of Washington; no information about potential CoI | |
| Notes | Uses intentional estimates as baseline data—validity of this approach unclear The study measured typical weekly drinking, but no data on follow‐up for this outcome were reported | |
| Risk of bias | ||
| Bias | Authors' judgement | Support for judgement |
| Random sequence generation (selection bias) | Unclear risk | Randomisation using URN procedure |
| Allocation concealment (selection bias) | Unclear risk | Not discussed |
| Incomplete outcome data (attrition bias) | Low risk | Attrition = 14.9% |
| Selective reporting (reporting bias) | Unclear risk | Nearly all outcomes were reported on (weekly drinking follow‐up results were not presented) |
| Blinding of participants and personnel (performance bias) | High risk | Blinding of participants was not possible for the intervention |
| Blinding of outcome assessment (detection bias) | Unclear risk | Not reported |
| Methods | Design: RCT Follow‐up: 6 months, 12 months, 18 months, 24 months Attrition: 7.70% at 6 months, 13.44% at 12 months, 16.13% at 18 months, 18.70% at 24 months | |
| Participants | Age: mean = 18.16 years (SD = 0.6) Sex: 57.58% female Size: N = 818 (5 arms) heavy‐drinking students Allocation: 654 intervention* and 164 control Country: USA | |
| Interventions | Intervention: factorial design with four active interventions: gender‐specific vs gender–non‐specific feedback; single vs multiple feedback points Key components: information regarding one’s own drinking behaviour, one’s perception of other average same‐sex students’ drinking behaviour on the participating campus and other actual average same‐sex students' drinking behaviour. Normative feedback: derived from BASICS, the feedback consisted of information regarding (1) one's own drinking behaviour, (2) one's perceptions of other students' drinking behaviour on the participating campus and (3) other students' self‐reported drinking behaviour in text and bar graph formats Delivery: web‐based Duration: 50 minutes Control: no intervention | |
| Outcomes | Typical weekly drinking, heavy episodic drinking, RAPI, drinking norms ratings form | |
| Funding and Declared Conflicts of Interest | Funded by NIAAA; no information about potential CoI | |
| Notes | *A complex factorial design with five arms involving gender‐specific and non–gender‐specific feedback and single vs multiple feedback points. No systematic and clear differences were found across intervention groups, so these results were pooled for comparison with control in the MA | |
| Risk of bias | ||
| Bias | Authors' judgement | Support for judgement |
| Random sequence generation (selection bias) | Low risk | "Random assignment was administered automatically using a computer algorithm and occurred in blocks of five to keep cell sizes equal" |
| Allocation concealment (selection bias) | Unclear risk | Not stated |
| Incomplete outcome data (attrition bias) | Low risk | Low attrition (19%) |
| Selective reporting (reporting bias) | Low risk | All outcomes reported |
| Blinding of participants and personnel (performance bias) | High risk | Blinding of participants not possible for the intervention |
| Blinding of outcome assessment (detection bias) | Low risk | Web‐based anonymous survey administration |
| Methods | Design: individual and RCT Follow‐up period: 3 months and 6 months Attrition: 11.9% | |
| Participants | Age: mean ˜18.7 years Sex: 76% males Size: N = 423 Allocation: PNF (N = 141); SNMA (N = 142); control (N = 140) Country: USA | |
| Interventions | Intervention: emailed personalised feedback; emailed generic feedback Key components: PNF was presented in text and bar graph formats and consisted of three elements: (1) one’s own drinking behaviour, (2) one’s perceptions of other students’ drinking behaviour and (3) other students’ actual drinking behaviour Delivery: web‐based Duration: no details Control: attention control (no alternative intervention, i.e. assessment only) | |
| Outcomes | Self‐reported alcohol use (DDQ); AUDIT score; alcohol‐related consequences | |
| Funding and Declared Conflicts of Interest | No conflict of interest stated. Research was supported by National Institute on Alcohol Abuse and Alcoholism Grant R01AA014576 | |
| Notes | Insufficient information presented in Results for inclusion in MA; study author contacted for additional details | |
| Risk of bias | ||
| Bias | Authors' judgement | Support for judgement |
| Random sequence generation (selection bias) | Low risk | Computer algorithm with block randomisation |
| Allocation concealment (selection bias) | Unclear risk | Insufficient information |
| Incomplete outcome data (attrition bias) | Low risk | Attrition 11.9% |
| Selective reporting (reporting bias) | High risk | Only consumption measures analysed and reported |
| Blinding of participants and personnel (performance bias) | High risk | Paricipants not blinded |
| Blinding of outcome assessment (detection bias) | Unclear risk | Insufficient information |
| Methods | Design: RCT Follow‐up: 1 month Attrition: not discussed | |
| Participants | Age: mean = 18.6 years (SD = 1.45) Sex: 60% female Size: N = 119 Allocation: no information Country: USA | |
| Interventions | Intervention: personalised normative feedback Key components: personalised feedback, normative data, information on costs, calories and peak BAC associated with heavy drinking episodes. Normative feedback: norms of total consumption and heavy drinking episodes that were university‐ and gender‐specific, norms about low‐frequency alcohol‐related consequences (< 40%), which were personalised by highlighting specific consequences identified by each student Delivery: not discussed Duration: not discussed Control: assessment only, provided with information on health guidelines for sleep and consumption of fruits and vegetables | |
| Outcomes | Drinking quantity and heavy drinking episodes (DDQ), Young Adult Alcohol Problems Screening Test‐36 | |
| Funding and Declared Conflicts of Interest | Funded by NIAAA; study authors declared no conflict of interest | |
| Notes | Study authors contacted for more detailed delivery and results information before inclusion in MA | |
| Risk of bias | ||
| Bias | Authors' judgement | Support for judgement |
| Random sequence generation (selection bias) | Unclear risk | Not stated |
| Allocation concealment (selection bias) | Unclear risk | Not stated |
| Incomplete outcome data (attrition bias) | Unclear risk | Attrition not reported |
| Selective reporting (reporting bias) | High risk | Not all outcomes reported |
| Blinding of participants and personnel (performance bias) | High risk | Blinding of participants and personnel not possible for the intervention |
| Blinding of outcome assessment (detection bias) | Unclear risk | Not stated |
| Methods | Design: cluster RCT Follow‐up: 6 months and 12 months Attrition: 6% universities lost to follow‐up, evenly distributed between intervention and control | |
| Participants | Age: mean = 18.7 years Sex: 55% female Size: N = 32 universities Allocation: 16 intervention and 16 control Country: USA | |
| Interventions | Intervention: AlcoholEdu Key components: course content includes defining a standard drink, physiological effects of alcohol, the need to monitor blood alcohol level, social influences on alcohol use, alcohol laws, personalised normative feedback and alcohol harm reduction strategies. Students had to pass an exam after Part I to advance to Part II Delivery: web‐based Duration: 2 hours to 3 hours Control: no intervention | |
| Outcomes | Past‐30‐day alcohol use, average number of drinks per occasion | |
| Funding and Declared Conflicts of Interest | Funded by NIAAA. CoI statement: "No financial disclosures were reported by the authors of this paper" | |
| Notes | Clustering accounted for in multi‐level analysis | |
| Risk of bias | ||
| Bias | Authors' judgement | Support for judgement |
| Random sequence generation (selection bias) | Unclear risk | No information |
| Allocation concealment (selection bias) | Unclear risk | No information |
| Incomplete outcome data (attrition bias) | Low risk | Low attrition |
| Selective reporting (reporting bias) | Low risk | All outcomes reported |
| Blinding of participants and personnel (performance bias) | High risk | Participants and interventionists not blind to study condition |
| Blinding of outcome assessment (detection bias) | Unclear risk | No information |
| Methods | Design: RCT Follow‐up: two weeks (post spring break) Attrition: N/A | |
| Participants | Age: mean = aged 18‐21 years Sex: 55% female Size: N = 271 individuals Allocation: N/A Country: USA | |
| Interventions | Intervention: Spring Break web‐based normative feedback Key components: computerised, internet‐based feedback was generated by a process during which (1) Wave 1 baseline surveys gathered information about respondents; (2) a computer programme linked the data with algorithms used to select appropriate feedback messages based on individual baseline responses; and (3) the programme rendered messages into a specific format and generated individualised web pages based on baseline responses and decision‐making rules for appropriate feedback Delivery: web‐based Duration: N/A Control: no intervention, assessment only | |
| Outcomes | Brief time‐line follow‐back and alcohol‐related consequences | |
| Funding and Declared Conflicts of Interest | Funded by NIAAA. No CoI statement | |
| Notes | ||
| Risk of bias | ||
| Bias | Authors' judgement | Support for judgement |
| Random sequence generation (selection bias) | Unclear risk | No information |
| Allocation concealment (selection bias) | Unclear risk | No information |
| Incomplete outcome data (attrition bias) | Unclear risk | Not reported |
| Selective reporting (reporting bias) | Unclear risk | All outcomes reported |
| Blinding of participants and personnel (performance bias) | High risk | Blinding of participants not possible for this intervention |
| Blinding of outcome assessment (detection bias) | Unclear risk | No information |
| Methods | Design: RCT Follow‐up: not clear Attrition: 17% at final follow‐up | |
| Participants | Age: mean = 21.14 years (SD = 3.11) Sex: 78% female Size: 343 randomly assigned Allocation: not clear Country: USA students studying abroad | |
| Interventions | Intervention: PNF with reference to country‐specific norms for study‐abroad students Key components: PNF contained two sets of three descriptive items accompanied by a figure: (1a) the number of drinks per week the individual intended to drink while abroad, (2a) the number of drinks per week that the individual perceived the typical student studying abroad in their host region drank and (3a) the number of drinks per week a typical student studying abroad in their host region actually drank. The second set of descriptive items focused on average drinks per occasion: (1b) the average number of drinks per occasion the individual intended to drink while abroad, (2b) the average number of drinks per occasion that the individual perceived the typical student studying abroad in their host region drank and (3b) the average number of drinks per occasion a typical student studying abroad in the host region actually drank Delivery: online Duration: not stated Control: assessment only | |
| Outcomes | Past month consumption (DDQ); alcohol‐related unintended consequences (RAPI); perceived peer norms | |
| Funding and Declared Conflicts of Interest | No information | |
| Notes | ||
| Risk of bias | ||
| Bias | Authors' judgement | Support for judgement |
| Random sequence generation (selection bias) | Low risk | Electronic randomisation |
| Allocation concealment (selection bias) | Low risk | Computer‐based allocation |
| Incomplete outcome data (attrition bias) | Low risk | 17% attrition |
| Selective reporting (reporting bias) | Unclear risk | Not clear from paper |
| Blinding of participants and personnel (performance bias) | High risk | Participants not blinded |
| Blinding of outcome assessment (detection bias) | Unclear risk | No information |
| Methods | Design: RCT Follow‐up: 1 month and 3 months Attrition: 3% | |
| Participants | Age: mean = 19.05 years (SD = 1.78) Sex: 78% female Size: N = 95 high‐risk drinkers Allocation: 47 intervention and 48 control Country: Australia | |
| Interventions | Intervention: brief intervention Key components: both injunctive and descriptive norms calculated from classmates' survey questionnaire responses Means of delivery: Facebook private message Duration: brief feedback Control group: no intervention | |
| Outcomes | Q/F measure; AUDIT questionnaire | |
| Funding and Declared Conflicts of Interest | Funded by DBH PhD scholarship; no information about potential CoI | |
| Notes | ||
| Risk of bias | ||
| Bias | Authors' judgement | Support for judgement |
| Random sequence generation (selection bias) | Low risk | Random number sequence in Excel |
| Allocation concealment (selection bias) | Unclear risk | No information |
| Incomplete outcome data (attrition bias) | Low risk | Attrition 3% |
| Selective reporting (reporting bias) | Low risk | All outcomes were reported on |
| Blinding of participants and personnel (performance bias) | High risk | Blinding of participants and personnel not possible for the intervention |
| Blinding of outcome assessment (detection bias) | Unclear risk | Not reported |
| Methods | Design: RCT Follow‐up: 3 months, 6 months, 9 months and 12 months Attrition: 24% at 3 months, 42% at 6 months, 41% at 9 months, 35% at 12 months' follow‐up | |
| Participants | Age: mean = 20.6 years (SD = 2.7) Sex: 52% female Size: N = 363 high‐risk drinkers Allocation: 181 intervention and 182 control Country: USA | |
| Interventions | Intervention: brief intervention Key components: motivational feedback, personalised normative feedback, alcohol education and advice, reflection on own drinking. Normative feedback: summarising, participant’s healthy lifestyle questionnaire responses; alcohol‐related harms, alcohol expectancies; tolerance; use of protective behaviours, readiness‐to‐change, quantity and frequency of alcohol consumption, instructions on estimation of BAC using a BAC card and norms clarification by comparison of personal alcohol consumption with peer alcohol consumption Means of delivery: face‐to‐face Duration: two 20‐minute BMI sessions, two weeks apart Control group: alcohol information leaflet | |
| Outcomes | 30‐day drinking, typical estimated BAC, peak BAC, RAPI, drinker inventory of consequences‐21 (DIC‐21) | |
| Funding and Declared Conflicts of Interest | Funded by NIAAA; no information about potential CoI | |
| Notes | ||
| Risk of bias | ||
| Bias | Authors' judgement | Support for judgement |
| Random sequence generation (selection bias) | Low risk | Block Randomisation in SPSS v15, order of interventions varied randomly with each block. Randomisation stratified by gender |
| Allocation concealment (selection bias) | Low risk | The group assignment was placed into a sealed envelope |
| Incomplete outcome data (attrition bias) | High risk | Attrition 24%, 42%, 41% and 35% at respective FUs |
| Selective reporting (reporting bias) | Low risk | All outcomes were reported on |
| Blinding of participants and personnel (performance bias) | High risk | Blinding of participants and personnel not possible in the intervention |
| Blinding of outcome assessment (detection bias) | Unclear risk | Not reported |
| Methods | Design: RCT Follow‐up: 12 months and 24 months Attrition: 1.1% at 12 months, 18.8% at 24 months (higher attrition in intervention group) | |
| Participants | Age: 18 years or older, mean = 19.6, SD = 1.8 Sex: 56% male Size: N = 266 risky drinkers Allocation: 145 intervention and 121 control Country: Brazil | |
| Interventions | Intervention: BASICS Key components: personalised normative feedback: comparison of consumption to clarify normal, alcohol‐related problems identified and beliefs addressed, fact sheet based on individual gender and weight distributed Delivery: web‐based Duration: 45 minutes to 60 minutes Control: assessment only | |
| Outcomes | Frequency and quantity of drinking, peak drinking, AUDIT, RAPI, brief drinker profile (BDP), alcohol dependency scale (ADS) | |
| Funding and Declared Conflicts of Interest | Funded by Fundaciao de Amparo `a Pesquisa do Estado de S˜ao Paulo (FAPESP); no information about potential CoI | |
| Notes | Multi‐variate analyses of variance for six variables at baseline showed a significant difference between treatment group and control group (P value 0.0014) | |
| Risk of bias | ||
| Bias | Authors' judgement | Support for judgement |
| Random sequence generation (selection bias) | Unclear risk | No information |
| Allocation concealment (selection bias) | Unclear risk | Not discussed |
| Incomplete outcome data (attrition bias) | High risk | Attrition: intervention: 29.7% at 24 months, control: 9.3% at 24 months |
| Selective reporting (reporting bias) | Low risk | All outcomes reported on |
| Blinding of participants and personnel (performance bias) | High risk | Blinding of participants not possible for the intervention |
| Blinding of outcome assessment (detection bias) | Unclear risk | Not reported |
| Methods | Design: RCT Follow‐up: 4 weeks after intervention (6 weeks from baseline for control) Attrition: 17.6% | |
| Participants | Age: 18 years to 24 years Sex: 62% male (across voluntary and mandated students) Size: N = 43 mandated students Allocation: 19 intervention and 24 control Country: USA | |
| Interventions | Intervention: BASICS to mandated students Key components: personalised feedback and normative information and comparison. Normative feedback: personalised graphic feedback created on the basis of information collected during the assessment interview. Normative comparison of typical patterns of alcohol use and perceived norms, personalised review of drinking consequences, own weekly consumption and percentile rank in comparison with campus norms. Along with generic alcohol information and information on its effects Delivery: web‐based Duration: 50 minutes Primary staff: N/A Control group: assessment only (2 groups: 1 for mandated intervention and 1 for voluntary intervention) | |
| Outcomes | Quantity/frequency/peak drinking (DDQ), AUDIT, RAPI | |
| Funding and Declared Conflicts of Interest | Funded by NIAAA. no information about potential conflicts | |
| Notes | Baseline analysis revealed significant demographic differences between study groups on sex (P value < 0.00) where mandated students were significantly more likely to be males relative to their voluntary high‐risk peers Interaction between treatment condition and referral status was significant for measures of typical consumption. Baseline scores on drinking outcomes were used as co‐variates in the primary analysis to account for baseline differences | |
| Risk of bias | ||
| Bias | Authors' judgement | Support for judgement |
| Random sequence generation (selection bias) | Unclear risk | Randomly assigned, but unclear how |
| Allocation concealment (selection bias) | Unclear risk | Not stated |
| Incomplete outcome data (attrition bias) | Low risk | Low attrition (18%) |
| Selective reporting (reporting bias) | Low risk | All outcomes reported |
| Blinding of participants and personnel (performance bias) | High risk | Blinding of participants and personnel not possible for the intervention |
| Blinding of outcome assessment (detection bias) | Unclear risk | Not reported |
| Methods | Design: RCT Follow‐up: 4 weeks after intervention (6 weeks from baseline for control) Attrition: 17.6% | |
| Participants | Age: 18 years to 24 years Sex: 62% male (across voluntary and mandated students) Size: N = 41 voluntary students Allocation: 21 intervention and 20 control Country: USA | |
| Interventions | Intervention: BASICS to voluntary students Key components: personalised feedback and normative information and comparison. Normative feedback: personalised graphic feedback created on the basis of information collected during the assessment interview. Normative comparison of typical patterns of alcohol use and perceived norms, personalised review of drinking consequences, own weekly consumption and percentile rank in comparison with campus norms. Along with generic alcohol information and information on its effects Delivery: web‐based Duration: 50 minutes Primary staff: N/A Control group: assessment only (2 groups: 1 for mandated intervention and 1 for voluntary intervention) | |
| Outcomes | Quantity/frequency/peak drinking (DDQ), AUDIT, RAPI | |
| Funding and Declared Conflicts of Interest | Funded by NIAAAl no information about potential conflicts | |
| Notes | ||
| Risk of bias | ||
| Bias | Authors' judgement | Support for judgement |
| Random sequence generation (selection bias) | Unclear risk | Randomly assigned, but unclear how |
| Allocation concealment (selection bias) | Unclear risk | Not stated |
| Incomplete outcome data (attrition bias) | Low risk | Low attrition (18%) |
| Selective reporting (reporting bias) | Low risk | All outcomes reported |
| Blinding of participants and personnel (performance bias) | High risk | Blinding of participants and personnel not possible for the intervention |
| Blinding of outcome assessment (detection bias) | Unclear risk | Not reported |
| Methods | Design: RCT Follow‐up: 10 months Attrition: 14.5% at follow‐up | |
| Participants | Age: mean = 17.92 years (SD = 0.39) Sex: 44.4% males Size: N = 617 high‐risk students in trial arms included in this review Allocation: 277 intervention and 340 control Country: USA | |
| Interventions | Intervention: BASICS only Key components: personalised feedback. Normative feedback: actual and descriptive norms for drinking, its consequences, alcohol caloric consumption (based on reported typical drinking), personalised wallet‐sized BAC card, perceived and descriptive norms and general information Delivery: face‐to‐face, mailed Duration: 45 minutes to 60 minutes for the BASICS‐only intervention Control: assessment only | |
| Outcomes | Peak BAC, typical weekly drinking (DDQ), RAPI, descriptive norms | |
| Funding and Declared Conflicts of Interest | Funded by NIAAA; no information about potential CoI | |
| Notes | ||
| Risk of bias | ||
| Bias | Authors' judgement | Support for judgement |
| Random sequence generation (selection bias) | Low risk | Computerised algorithm |
| Allocation concealment (selection bias) | Unclear risk | Not reported |
| Incomplete outcome data (attrition bias) | Low risk | Low attrition (14.5%) |
| Selective reporting (reporting bias) | Low risk | All outcomes reported |
| Blinding of participants and personnel (performance bias) | High risk | Blinding of participants and personnel not possible for the intervention |
| Blinding of outcome assessment (detection bias) | Unclear risk | Not reported |
| Methods | Design: RCT | |
| Participants | Age: mean = 19.7 years Allocation: no information | |
| Interventions | Intervention: based on Drinker's Check‐Up Duration: N/A | |
| Outcomes | Q/F Index, SIP, AUDIT, CHUG, BAC, norms | |
| Funding and Declared Conflicts of Interest | No information | |
| Notes | ||
| Risk of bias | ||
| Bias | Authors' judgement | Support for judgement |
| Random sequence generation (selection bias) | Unclear risk | No information |
| Allocation concealment (selection bias) | Unclear risk | Not discussed in this study |
| Incomplete outcome data (attrition bias) | Low risk | Low attrition (14%) |
| Selective reporting (reporting bias) | Low risk | All outcomes reported |
| Blinding of participants and personnel (performance bias) | High risk | Blinding of participants and personnel not possible for the intervention |
| Blinding of outcome assessment (detection bias) | Unclear risk | Blinding of outcome assessor not specified |
| Methods | Design: RCT | |
| Participants | Age: not given Allocation: no information | |
| Interventions | Intervention: based on Drinker's Check‐Up Duration: N/A | |
| Outcomes | 7‐day drinking diary; peak BAC; RAPI; norms | |
| Funding and Declared Conflicts of Interest | Funded by PRIME grant from the University of Texas School of Public Health; no information about potential CoI | |
| Notes | ||
| Risk of bias | ||
| Bias | Authors' judgement | Support for judgement |
| Random sequence generation (selection bias) | Unclear risk | No information |
| Allocation concealment (selection bias) | Unclear risk | Not discussed in the study |
| Incomplete outcome data (attrition bias) | High risk | Moderate attrition at 16 weeks (22.6%) |
| Selective reporting (reporting bias) | Low risk | All outcomes reported |
| Blinding of participants and personnel (performance bias) | High risk | Blinding of participants not possible for the intervention |
| Blinding of outcome assessment (detection bias) | Unclear risk | Blinding of outcome assessor not specified |
| Methods | Design: RCT Follow‐up: 3 months and 6 months Attrition: 10.4% at 3 months, 13.6% at 6 months | |
| Participants | Age: mean = 19.8 years Sex: 64.2% female Size: N = 136 heavy drinkers in trial arms included in this review Allocation: 67 intervention and 69 control Country: USA | |
| Interventions | Intervention: feedback only (FBO) and MI with feedback (MIF) arms Key components: feedback only arm: summary of drinking behaviour, compared with US campus and adult norms. Risk levels and estimated amount (USD) and income (%) spent. Normative feedback: Feedback included (1) a quantity‐frequency summary of drinking behaviour (e.g. standard drinks consumed in the last 30 days, estimated peak BAC, caloric intake), (2) comparison with US adult and campus norms, (3) level of risk (e.g. AUDIT score, tolerance, estimated genetic risk), (4) estimated dollar amount and percentage of income spent on alcohol and (5) local referral resources Duration: FBO arm: not discussed; MIF arm: mean length of 50.09 minutes Control: assessment only | |
| Outcomes | 7‐day drinking diary, peak BAC, RAPI, AUDIT | |
| Funding and Declared Conflicts of Interest | Funded by NIAAA; no information about potential CoI | |
| Notes | ||
| Risk of bias | ||
| Bias | Authors' judgement | Support for judgement |
| Random sequence generation (selection bias) | Unclear risk | Insufficient information to permit judgement |
| Allocation concealment (selection bias) | Low risk | Participants and investigators enrolling participants could not foresee assignment because of central allocation by computer |
| Incomplete outcome data (attrition bias) | Low risk | Low attrition (10.4%). Intention‐to‐treat analysis performed |
| Selective reporting (reporting bias) | Low risk | All outcomes reported |
| Blinding of participants and personnel (performance bias) | High risk | Participants and counsellors were not blind to the group assignment |
| Blinding of outcome assessment (detection bias) | Unclear risk | Insufficient information to permit judgement |
| Methods | Design: RCT | |
| Participants | Age: not given Allocation: 317 intervention and 317 control | |
| Interventions | Intervention: social norms campaign Duration: 20 minutes | |
| Outcomes | Frequency, quantity, binge, drunkenness, condom use, consequences of drinking, stages of initiating drinking | |
| Funding and Declared Conflicts of Interest | Funded by US Department of Education and Brooks Health Foundation; no information about potential CoI | |
| Notes | ||
| Risk of bias | ||
| Bias | Authors' judgement | Support for judgement |
| Random sequence generation (selection bias) | Unclear risk | No information |
| Allocation concealment (selection bias) | Unclear risk | Not reported |
| Incomplete outcome data (attrition bias) | Low risk | Low attrition (18%) |
| Selective reporting (reporting bias) | Low risk | All outcomes reported |
| Blinding of participants and personnel (performance bias) | High risk | Blinding of participants not possible for the intervention |
| Blinding of outcome assessment (detection bias) | Unclear risk | Blinding of outcome assessor not specified |
| Methods | Design: Cluster RCT, by fraternity / sorority house Follow‐up: 3 months Attrition: 80% (data cleaning led to removal of substantial number of respondents reporting high levels of consumption, with more removed from the intervention group) | |
| Participants | Age: 20 years on average Sex: 39% of sample from fraternity houses Size: N = 4 houses and N = 991 individuals Allocation: N = 442 individuals in the intervention N = 549 individuals in the control (unclear re: group allocation) Country: USA | |
| Interventions | Intervention: personalised normative feedback Duration: 10 minutes to 15 minutes | |
| Outcomes | Estimated blood alcohol concentration and alcohol problems | |
| Funding and Declared Conflicts of Interest | Funded by Social Sciences Program Enhancement Grant from the Florida State University (FSU) Council on Research and Creativity. No information or declarations about potential conflicts of interest | |
| Notes | ||
| Risk of bias | ||
| Bias | Authors' judgement | Support for judgement |
| Random sequence generation (selection bias) | Unclear risk | No information |
| Allocation concealment (selection bias) | Unclear risk | No information |
| Incomplete outcome data (attrition bias) | High risk | High attrition (80%) |
| Selective reporting (reporting bias) | Low risk | All outcomes reported |
| Blinding of participants and personnel (performance bias) | High risk | Participants unblinded. No information about blinding of MI counsellors |
| Blinding of outcome assessment (detection bias) | Unclear risk | No information |
| Methods | Design: RCT | |
| Participants | Age: 20 years to 24 years Allocation: no information | |
| Interventions | Programme type: BMI Duration: 45 minutes to 60 minutes Control group: no intervention given | |
| Outcomes | Q‐F, heavy drinking and problems from 36‐item Young Adult Alcohol Problems Screening Test (YAAPST) | |
| Funding and Declared Conflicts of Interest | Funded by NIAAA; no information about potential CoI | |
| Notes | Insufficient details for MA; study authors contacted for mean scores and SDs for outcomes | |
| Risk of bias | ||
| Bias | Authors' judgement | Support for judgement |
| Random sequence generation (selection bias) | Unclear risk | Not stated |
| Allocation concealment (selection bias) | Unclear risk | Not stated |
| Incomplete outcome data (attrition bias) | Unclear risk | Attrition not described |
| Selective reporting (reporting bias) | Low risk | All outcomes reported |
| Blinding of participants and personnel (performance bias) | High risk | Blinding of participants and personnel not possible for the intervention |
| Blinding of outcome assessment (detection bias) | Unclear risk | Not stated |
| Methods | Design: RCT Follow‐up: 10 months and 22 months Attrition: 9.2% at 10 months, 16% at 22 months. | |
| Participants | Age: mean age = 18.4 years (SD = 0.41) Sex: 57% female (N = 580) Size: N = 509 parent/student dyads in trial arms included in this review Allocation: 253 intervention and 256 control Country: USA | |
| Interventions | Intervention: BMI (BASICS) and booster session Key components: personalised normative feedback. Normative feedback: individualised feedback used to guide BMI sessions. Feedback on alcohol use, consequences, socio‐environmental influences, personal drinking patterns, HED, BAC, alcohol expectancies, peer and environmental influences on alcohol use, drinking norms. Self‐regulation and harm‐reduction strategies were discussed Delivery: individual face‐to‐face Duration: 45 minutes to 60 minutes, booster session of 20 minutes to 30 minutes Control group: assessment only | |
| Outcomes | Heavy episodic drinking, drinking frequency and quantity from 17‐item version of the Young Adult Alcohol Problems Screening Test | |
| Funding and Declared Conflicts of Interest | No information | |
| Notes | SEM model results reported—not in right format for MA. Study authors contacted | |
| Risk of bias | ||
| Bias | Authors' judgement | Support for judgement |
| Random sequence generation (selection bias) | Low risk | "Urn randomization by computer algorithm" |
| Allocation concealment (selection bias) | Unclear risk | Not stated |
| Incomplete outcome data (attrition bias) | Low risk | Low attrition (16%) |
| Selective reporting (reporting bias) | Low risk | All outcomes reported |
| Blinding of participants and personnel (performance bias) | High risk | Blinding of participants and personnel not possible for the intervention |
| Blinding of outcome assessment (detection bias) | Low risk | Interviewers were blind to experimental condition |
Abbreviations:
ACI: alcohol consumption inventory.
ADS: alcohol dependency scale.
ADU: alcohol and drug use.
AE: alcohol education.
AI: alcohol information.
APS: alcohol problems scale.
AREAS: academic role expectations and alcohol scale.
AUDIT: alcohol use disorders identification scale.
BAC: blood alcohol concentration.
BAL: blood alcohol level.
BASICS: brief alcohol screening and intervention of college students.
BDP: brief drinker profile.
BMI: brief motivational interview.
CAGE: Cut‐down; Annoyed; Guilty; Eye‐opener
CHUG: Check‐Up To Go
CoI: conflict of interest.
CRCT: Cluster Randomized Contriolled Trial.
DDQ: daily drinking questionnaire.
DIC‐21: drinker inventory of consequences.
DNRF: drinking norms rating form
e‐CHUG: Electronic‐Check Up To Go
e‐SBI: email‐based Internet alcohol intervention.
FU: follow‐up.
GMET: group motivational enhancement therapy.
IDS: inventory of drinking situations.
ITT: intention‐to‐treat.
LDQ: Leeds Dependence Questionnaire.
MA: Meta‐Analysis.
MET‐MATCH: Motivational Enhancement Therapy, Project MATCH.
MI: motivational interview.
NIAAA: National Institute on Alcohol Abuse and Alcoholism.
PBSF: protective behavioural strategies feedback.
PNF: personalised normative feedback.
QFS: quantity‐frequency scale.
RAPI: Rutgers Alcohol Problem Index.
RCT: randomised controlled trial.
RDD: retrospective drinking diary.
SAU: services as usual.
SD: standard deviation.
SEM: Structural Equation Modelling.
SNMA: Social Norms Marketing Approach.
SPSS: Statistical Package for the Social Sciences.
UAP: university assistance programme.
YAAPST: young adult alcohol problems screening test.
Characteristics of excluded studies [ordered by study ID]
| Study | Reason for exclusion |
| Have not evaluated social norms interventions/any interventions but made suggestions for their use | |
| Marked differences at baseline between intervention and control groups in number of variables, indicating failed randomisation | |
| Does not evaluate reduction in misuse or misperceptions after intervention, rather describes drinking misuse patterns and misperceptions | |
| No social norms intervention | |
| Process of randomisation failed | |
| Both groups received a social norms intervention | |
| Not an RCT | |
| Not an RCT | |
| Not an RCT | |
| No control condition | |
| Not an RCT | |
| Does not appear to evaluate use of SN intervention vs control but instead the association of factors such as ‘readiness to change,’ ‘need for change’ and ‘impulsivity/sensation‐seeking (IMPSS)’ with effect of SN intervention | |
| Both arms in the RCT received some sort of social norms feedback | |
| No appropriate control group. All three arms of the study included a social norms component | |
| No alcohol outcomes | |
| Not an RCT | |
| Seems not to be evaluating the effectiveness of social norms intervention but instead the predictability of the ‘readiness to change questionnaire’ | |
| Not university students | |
| Not an RCT | |
| Protocol only | |
| Insufficient follow‐up | |
| Feedback group without a social norms intervention | |
| Not a true randomisation. Students were asked if they wanted the intervention | |
| No university students | |
| Comparison between two social norms interventions, no appropriate control group for this review | |
| Not alcohol related | |
| Not university students, no social norms intervention | |
| No social norms intervention | |
| Not an RCT, no university students, no social norms intervention | |
| Not alcohol‐related | |
| Not an RCT, no social norms intervention | |
| Not an RCT | |
| Not an RCT | |
| Not an RCT | |
| All three groups received a social norms intervention that was included in the skills workbook | |
| No alcohol‐related outcomes. Evaluates secondary effects of alcohol intervention on illicit drug use | |
| Does not evaluate the intervention, rather the development of one | |
| Not an RCT | |
| Not an RCT | |
| Both study arms contained a social norms component | |
| Not alcohol‐related | |
| Not an RCT | |
| Not an RCT, not a social norms intervention | |
| Not university students | |
| No social norms relevant outcomes | |
| No normative feedback group | |
| Not an RCT | |
| Both study arms had social norms component, hence no appropriate control group | |
| Not an RCT | |
| Not an RCT | |
| Not alcohol‐related | |
| Social norms media campaign on campus at same time as the RCT, indicates contamination of the control group | |
| Not an RCT | |
| No between‐group analysis results reported, no alcohol outcomes measures available | |
| Duplicate study (Larimer 2009) | |
| Not an RCT | |
| Not an RCT | |
| Does not evaluate social norms intervention but instead the use of supervision post training in peer counselling groups | |
| Not a social norms intervention | |
| Not alcohol‐related | |
| Not an RCT: review article | |
| Both groups received a social norms intervention | |
| Both groups received a social norms intervention | |
| Protocol only | |
| No alcohol or social norms outcomes reported | |
| Does not evaluate the intervention but looks at the correlation between injunctive norms manipulation and different reference groups | |
| Not alcohol‐related | |
| Both study arms had social norms component | |
| Both groups received a social norms intervention | |
| No PNF data reported | |
| Not an RCT | |
| Not a social norms intervention | |
| Social norms media campaign on campus at same time as the RCT, indicates contamination of the control group | |
| Not university students | |
| Social norms media campaign on campus at same time as the RCT, indicates contamination of the control group | |
| Not an RCT | |
| No social norms intervention | |
| No social norms intervention | |
| Both groups received a social norms intervention | |
| Not an RCT | |
| Not an RCT | |
| Process of randomisation failed | |
| Intervention was delivered campus‐wide, therefore no appropriate control group for the purpose of this review | |
| Not a social norms intervention | |
| Not an RCT | |
| Not a social norms intervention | |
| Not a social norms intervention | |
| Not a social norms intervention | |
| Not a true control group | |
| Both groups received a social norms intervention | |
| No group randomly assigned to non‐SNF control | |
| No university or college students | |
| Not an RCT |
Characteristics of studies awaiting assessment [ordered by study ID]
| Methods | Design: randomised controlled trial Follow‐up: 4 weeks to 6 weeks Attrition: 41% |
| Participants | Age: 94% 17 years to 18 years Sex: 51% female Size: N = 3216 students Allocation: 1608 in each arm Country: USA |
| Interventions | AlcoholEDU online course; details of social normative component not clear |
| Outcomes | Prevalence of alcohol use; high‐risk behaviour; protective behaviour; harm experienced |
| Notes | Unclear whether this version of AlcoholEDU contained the normative feedback component that appeared in later versions |
| Methods | Design: randomised controlled trial Follow‐up: 3 months Attrition: no details |
| Participants | Age: no details Sex: no details Size: N = 103 students in relevant arms Allocation: no details Country: USA |
| Interventions | BASICS vs relaxation control condition; no further details |
| Outcomes | Insufficient information |
| Notes | Awaiting copy of full dissertation from study author |
Data and analyses
| Outcome or subgroup title | No. of studies | No. of participants | Statistical method | Effect size |
| 1 Alcohol‐related problems: up to 3 months Show forest plot | 37 | Std. Mean Difference (IV, Random, 95% CI) | Subtotals only | |
| Analysis 1.1  Comparison 1 Social norms (SN) vs control, Outcome 1 Alcohol‐related problems: up to 3 months. | ||||
| 1.1 Mailed feedback | 6 | 1045 | Std. Mean Difference (IV, Random, 95% CI) | 0.10 [‐0.02, 0.22] |
| 1.2 Web feedback | 21 | 10166 | Std. Mean Difference (IV, Random, 95% CI) | ‐0.15 [‐0.26, ‐0.05] |
| 1.3 Individual face‐to‐face | 8 | 1205 | Std. Mean Difference (IV, Random, 95% CI) | ‐0.14 [‐0.27, ‐0.00] |
| 1.4 Group face‐to‐face | 4 | 382 | Std. Mean Difference (IV, Random, 95% CI) | ‐0.16 [‐0.42, 0.10] |
| 2 Alcohol‐related problems: 4+ months Show forest plot | 30 | Std. Mean Difference (Random, 95% CI) | Subtotals only | |
| Analysis 1.2 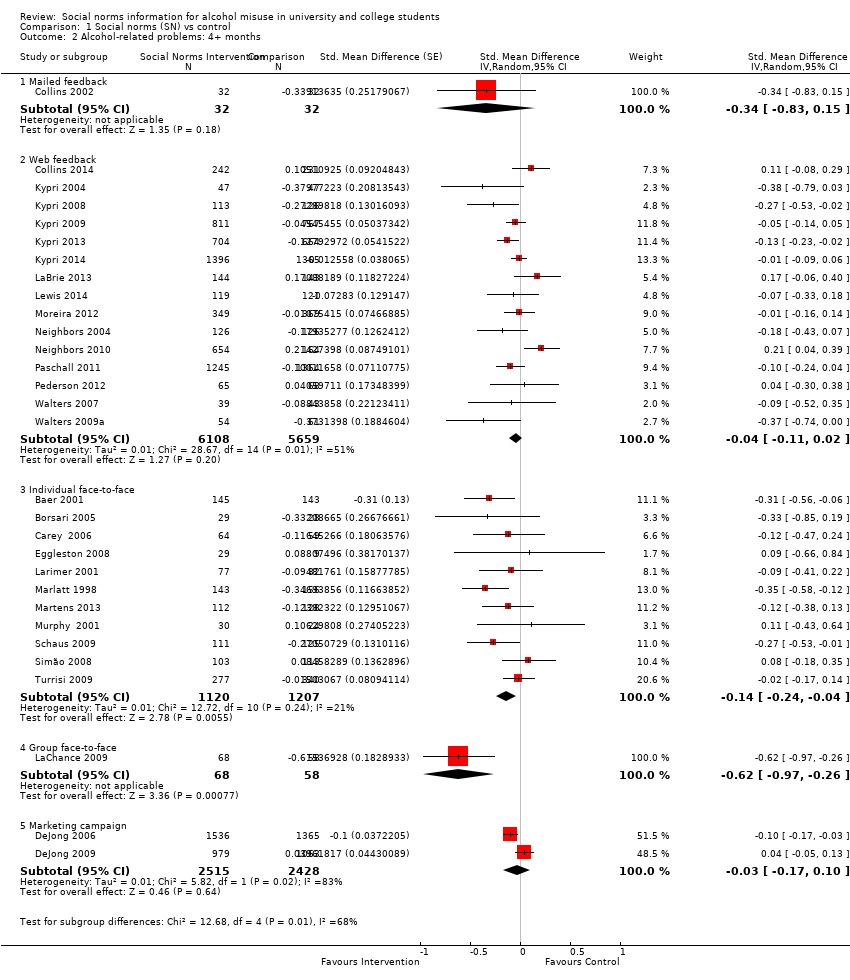 Comparison 1 Social norms (SN) vs control, Outcome 2 Alcohol‐related problems: 4+ months. | ||||
| 2.1 Mailed feedback | 1 | 64 | Std. Mean Difference (Random, 95% CI) | ‐0.34 [‐0.83, 0.15] |
| 2.2 Web feedback | 15 | 11767 | Std. Mean Difference (Random, 95% CI) | ‐0.04 [‐0.11, 0.02] |
| 2.3 Individual face‐to‐face | 11 | 2327 | Std. Mean Difference (Random, 95% CI) | ‐0.14 [‐0.24, ‐0.04] |
| 2.4 Group face‐to‐face | 1 | 126 | Std. Mean Difference (Random, 95% CI) | ‐0.62 [‐0.97, ‐0.26] |
| 2.5 Marketing campaign | 2 | 4943 | Std. Mean Difference (Random, 95% CI) | ‐0.03 [‐0.17, 0.10] |
| 3 Binge drinking: up to 3 months Show forest plot | 26 | 10667 | Std. Mean Difference (Random, 95% CI) | ‐0.17 [‐0.24, ‐0.09] |
| Analysis 1.3  Comparison 1 Social norms (SN) vs control, Outcome 3 Binge drinking: up to 3 months. | ||||
| 3.1 Mailed feedback | 2 | 615 | Std. Mean Difference (Random, 95% CI) | ‐0.07 [‐0.51, 0.36] |
| 3.2 Web feedback | 14 | 8744 | Std. Mean Difference (Random, 95% CI) | ‐0.15 [‐0.24, ‐0.06] |
| 3.3 Individual face‐to‐face | 6 | 932 | Std. Mean Difference (Random, 95% CI) | ‐0.21 [‐0.35, ‐0.07] |
| 3.4 Group face‐to‐face | 5 | 376 | Std. Mean Difference (Random, 95% CI) | ‐0.28 [‐0.48, ‐0.07] |
| 4 Binge drinking: 4+ months Show forest plot | 16 | 11292 | Std. Mean Difference (Random, 95% CI) | ‐0.06 [‐0.11, ‐0.02] |
| Analysis 1.4  Comparison 1 Social norms (SN) vs control, Outcome 4 Binge drinking: 4+ months. | ||||
| 4.1 Mailed feedback | 1 | 65 | Std. Mean Difference (Random, 95% CI) | ‐0.17 [‐0.66, 0.32] |
| 4.2 Web feedback | 10 | 10719 | Std. Mean Difference (Random, 95% CI) | ‐0.07 [‐0.12, ‐0.02] |
| 4.3 Individual face‐to‐face | 5 | 508 | Std. Mean Difference (Random, 95% CI) | 0.01 [‐0.17, 0.18] |
| 5 Quantity of drinking: up to 3 months Show forest plot | 45 | 14184 | Std. Mean Difference (IV, Random, 95% CI) | ‐0.14 [‐0.19, ‐0.09] |
| Analysis 1.5  Comparison 1 Social norms (SN) vs control, Outcome 5 Quantity of drinking: up to 3 months. | ||||
| 5.1 Mailed feedback | 5 | 1020 | Std. Mean Difference (IV, Random, 95% CI) | ‐0.04 [‐0.21, 0.13] |
| 5.2 Web feedback | 28 | 10889 | Std. Mean Difference (IV, Random, 95% CI) | ‐0.12 [‐0.18, ‐0.07] |
| 5.3 Individual face‐to‐face | 8 | 1309 | Std. Mean Difference (IV, Random, 95% CI) | ‐0.24 [‐0.38, ‐0.11] |
| 5.4 Group face‐to‐face | 5 | 411 | Std. Mean Difference (IV, Random, 95% CI) | ‐0.30 [‐0.49, ‐0.10] |
| 5.5 Marketing campaign | 1 | 555 | Std. Mean Difference (IV, Random, 95% CI) | ‐0.05 [‐0.22, 0.11] |
| 6 Quantity of drinking: 4+ months Show forest plot | 32 | 21169 | Std. Mean Difference (Random, 95% CI) | ‐0.08 [‐0.12, ‐0.04] |
| Analysis 1.6  Comparison 1 Social norms (SN) vs control, Outcome 6 Quantity of drinking: 4+ months. | ||||
| 6.1 Mailed feedback | 2 | 533 | Std. Mean Difference (Random, 95% CI) | ‐0.13 [‐0.32, 0.06] |
| 6.2 Web feedback | 18 | 13319 | Std. Mean Difference (Random, 95% CI) | ‐0.07 [‐0.12, ‐0.02] |
| 6.3 Individual face‐to‐face | 12 | 2374 | Std. Mean Difference (Random, 95% CI) | ‐0.15 [‐0.23, ‐0.08] |
| 6.4 Marketing campaign | 2 | 4943 | Std. Mean Difference (Random, 95% CI) | ‐0.02 [‐0.13, 0.09] |
| 7 Frequency: up to 3 months Show forest plot | 19 | Std. Mean Difference (IV, Random, 95% CI) | Subtotals only | |
| Analysis 1.7  Comparison 1 Social norms (SN) vs control, Outcome 7 Frequency: up to 3 months. | ||||
| 7.1 Mailed feedback | 1 | 521 | Std. Mean Difference (IV, Random, 95% CI) | 0.12 [‐0.05, 0.29] |
| 7.2 Web feedback | 12 | 6385 | Std. Mean Difference (IV, Random, 95% CI) | ‐0.17 [‐0.25, ‐0.09] |
| 7.3 Individual face‐to‐face | 4 | 515 | Std. Mean Difference (IV, Random, 95% CI) | ‐0.45 [‐0.63, ‐0.28] |
| 7.4 Group face‐to‐face | 3 | 264 | Std. Mean Difference (IV, Random, 95% CI) | ‐0.03 [‐0.27, 0.21] |
| 8 Frequency: 4+ months Show forest plot | 25 | Std. Mean Difference (Random, 95% CI) | Subtotals only | |
| Analysis 1.8 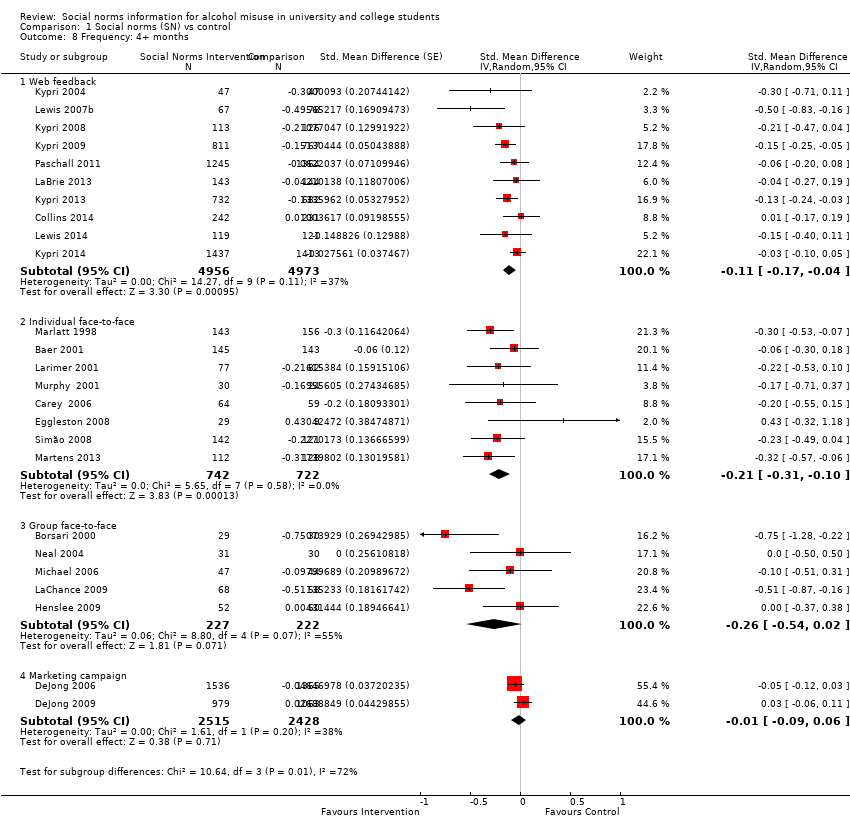 Comparison 1 Social norms (SN) vs control, Outcome 8 Frequency: 4+ months. | ||||
| 8.1 Web feedback | 10 | 9929 | Std. Mean Difference (Random, 95% CI) | ‐0.11 [‐0.17, ‐0.04] |
| 8.2 Individual face‐to‐face | 8 | 1464 | Std. Mean Difference (Random, 95% CI) | ‐0.21 [‐0.31, ‐0.10] |
| 8.3 Group face‐to‐face | 5 | 449 | Std. Mean Difference (Random, 95% CI) | ‐0.26 [‐0.54, 0.02] |
| 8.4 Marketing campaign | 2 | 4943 | Std. Mean Difference (Random, 95% CI) | ‐0.01 [‐0.09, 0.06] |
| 9 Peak BAC: up to 3 months Show forest plot | 11 | 1902 | Std. Mean Difference (IV, Random, 95% CI) | ‐0.22 [‐0.33, ‐0.11] |
| Analysis 1.9 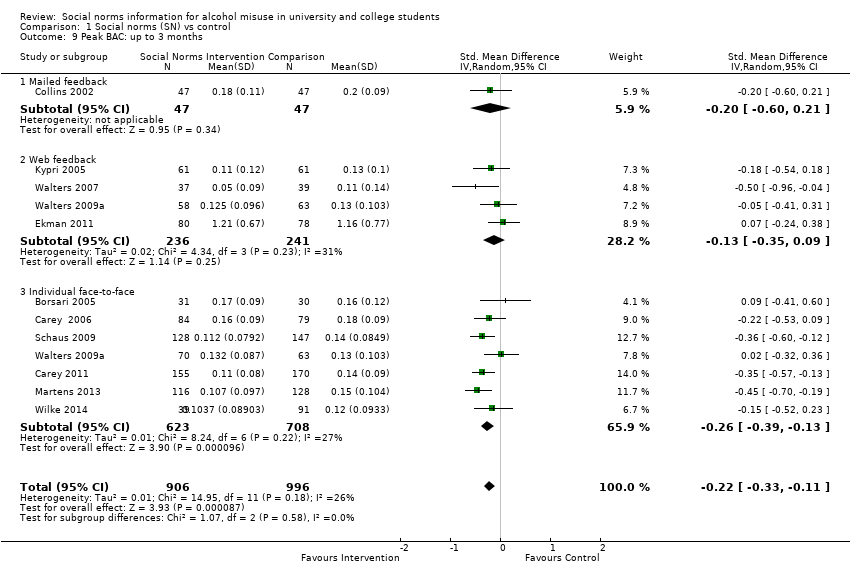 Comparison 1 Social norms (SN) vs control, Outcome 9 Peak BAC: up to 3 months. | ||||
| 9.1 Mailed feedback | 1 | 94 | Std. Mean Difference (IV, Random, 95% CI) | ‐0.20 [‐0.60, 0.21] |
| 9.2 Web feedback | 4 | 477 | Std. Mean Difference (IV, Random, 95% CI) | ‐0.13 [‐0.35, 0.09] |
| 9.3 Individual face‐to‐face | 7 | 1331 | Std. Mean Difference (IV, Random, 95% CI) | ‐0.26 [‐0.39, ‐0.13] |
| 10 Peak BAC: 4+ months Show forest plot | 11 | 7198 | Std. Mean Difference (IV, Random, 95% CI) | ‐0.08 [‐0.17, 0.00] |
| Analysis 1.10  Comparison 1 Social norms (SN) vs control, Outcome 10 Peak BAC: 4+ months. | ||||
| 10.1 Mailed feedback | 1 | 468 | Std. Mean Difference (IV, Random, 95% CI) | ‐0.13 [‐0.33, 0.08] |
| 10.2 Web feedback | 3 | 355 | Std. Mean Difference (IV, Random, 95% CI) | ‐0.08 [‐0.29, 0.13] |
| 10.3 Individual face‐to‐face | 7 | 1432 | Std. Mean Difference (IV, Random, 95% CI) | ‐0.16 [‐0.26, ‐0.05] |
| 10.4 Marketing campaign | 2 | 4943 | Std. Mean Difference (IV, Random, 95% CI) | 0.02 [‐0.18, 0.21] |
| 11 Typical BAC: up to 3 months Show forest plot | 8 | 1336 | Std. Mean Difference (IV, Random, 95% CI) | ‐0.17 [‐0.31, ‐0.03] |
| Analysis 1.11  Comparison 1 Social norms (SN) vs control, Outcome 11 Typical BAC: up to 3 months. | ||||
| 11.1 Mailed feedback | 3 | 253 | Std. Mean Difference (IV, Random, 95% CI) | ‐0.10 [‐0.35, 0.15] |
| 11.2 Web feedback | 1 | 282 | Std. Mean Difference (IV, Random, 95% CI) | ‐0.25 [‐0.48, ‐0.01] |
| 11.3 Individual face‐to‐face | 4 | 801 | Std. Mean Difference (IV, Random, 95% CI) | ‐0.14 [‐0.40, 0.12] |
| 12 Typical BAC: 4+ months Show forest plot | 4 | Std. Mean Difference (IV, Random, 95% CI) | Subtotals only | |
| Analysis 1.12 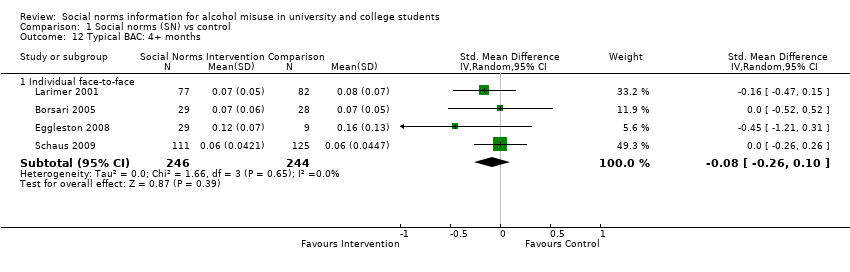 Comparison 1 Social norms (SN) vs control, Outcome 12 Typical BAC: 4+ months. | ||||
| 12.1 Individual face‐to‐face | 4 | 490 | Std. Mean Difference (IV, Random, 95% CI) | ‐0.08 [‐0.26, 0.10] |
| 13 Drinking norms: up to 3 months Show forest plot | 14 | Std. Mean Difference (IV, Random, 95% CI) | Subtotals only | |
| Analysis 1.13  Comparison 1 Social norms (SN) vs control, Outcome 13 Drinking norms: up to 3 months. | ||||
| 13.1 Mailed feedback | 2 | 698 | Std. Mean Difference (IV, Random, 95% CI) | ‐0.21 [‐0.56, 0.14] |
| 13.2 Web feedback | 8 | 1196 | Std. Mean Difference (IV, Random, 95% CI) | ‐0.51 [‐0.71, ‐0.31] |
| 13.3 Group face‐to‐face | 3 | 297 | Std. Mean Difference (IV, Random, 95% CI) | ‐0.44 [‐0.84, ‐0.04] |
| 13.4 Individual face‐to‐face | 1 | 244 | Std. Mean Difference (IV, Random, 95% CI) | ‐1.40 [‐1.68, ‐1.12] |
| 14 Drinking norms: 4+ months Show forest plot | 9 | Std. Mean Difference (Random, 95% CI) | Subtotals only | |
| Analysis 1.14 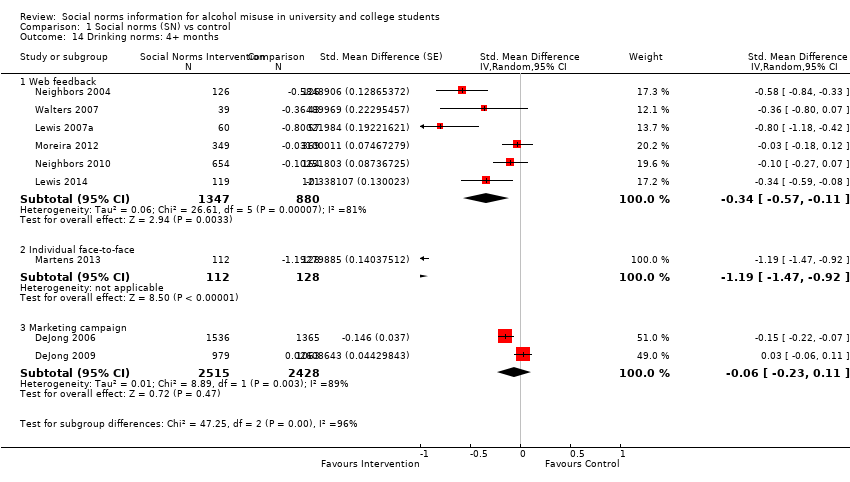 Comparison 1 Social norms (SN) vs control, Outcome 14 Drinking norms: 4+ months. | ||||
| 14.1 Web feedback | 6 | 2227 | Std. Mean Difference (Random, 95% CI) | ‐0.34 [‐0.57, ‐0.11] |
| 14.2 Individual face‐to‐face | 1 | 240 | Std. Mean Difference (Random, 95% CI) | ‐1.19 [‐1.47, ‐0.92] |
| 14.3 Marketing campaign | 2 | 4943 | Std. Mean Difference (Random, 95% CI) | ‐0.06 [‐0.23, 0.11] |
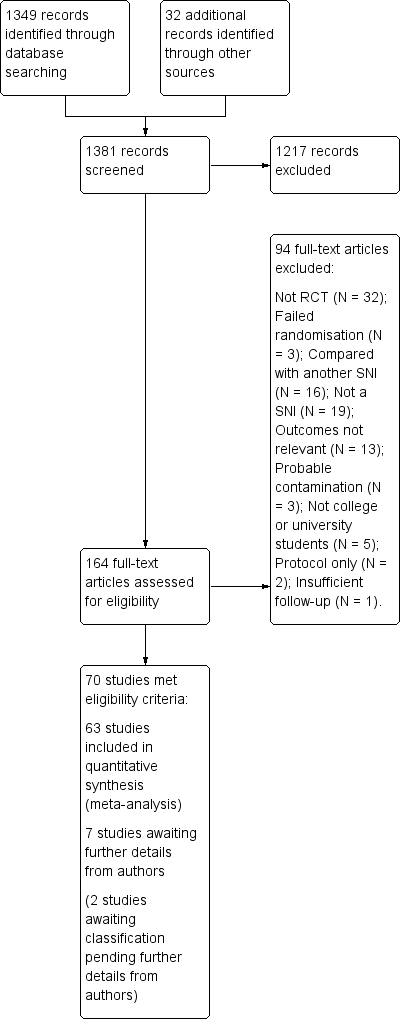
Study flow diagram.
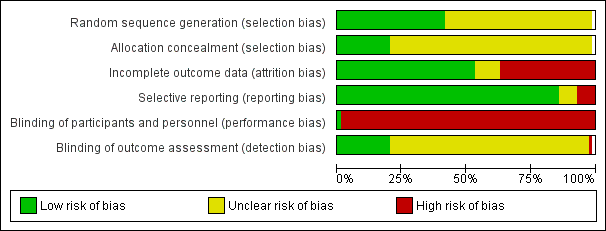
Methodological quality graph: review authors' judgements about each methodological quality item presented as percentages across all included studies.

Methodological quality summary: review authors' judgements about each methodological quality item for each included study.

Funnel plot of comparison: 1 Social norms (SN) vs control, outcome: 1.2 Alcohol‐related problems: 4+ months.

Funnel plot of comparison: 1 Social norms (SN) vs control, outcome: 1.4 Binge drinking: 4+ months.
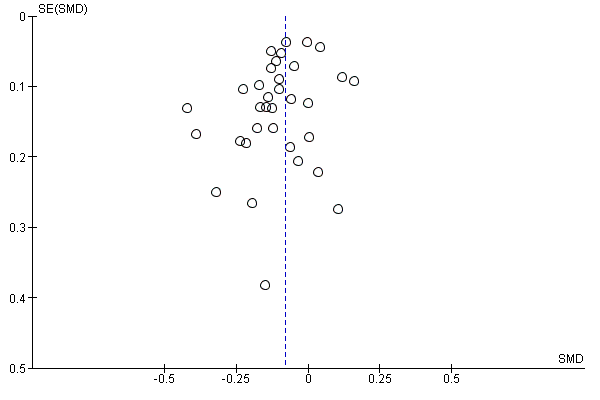
Funnel plot of comparison: 1 Social norms (SN) vs control, outcome: 1.6 Quantity of drinking: 4+ months.

Funnel plot of comparison: 1 Social norms (SN) vs control, outcome: 1.8 Frequency: 4+ months.
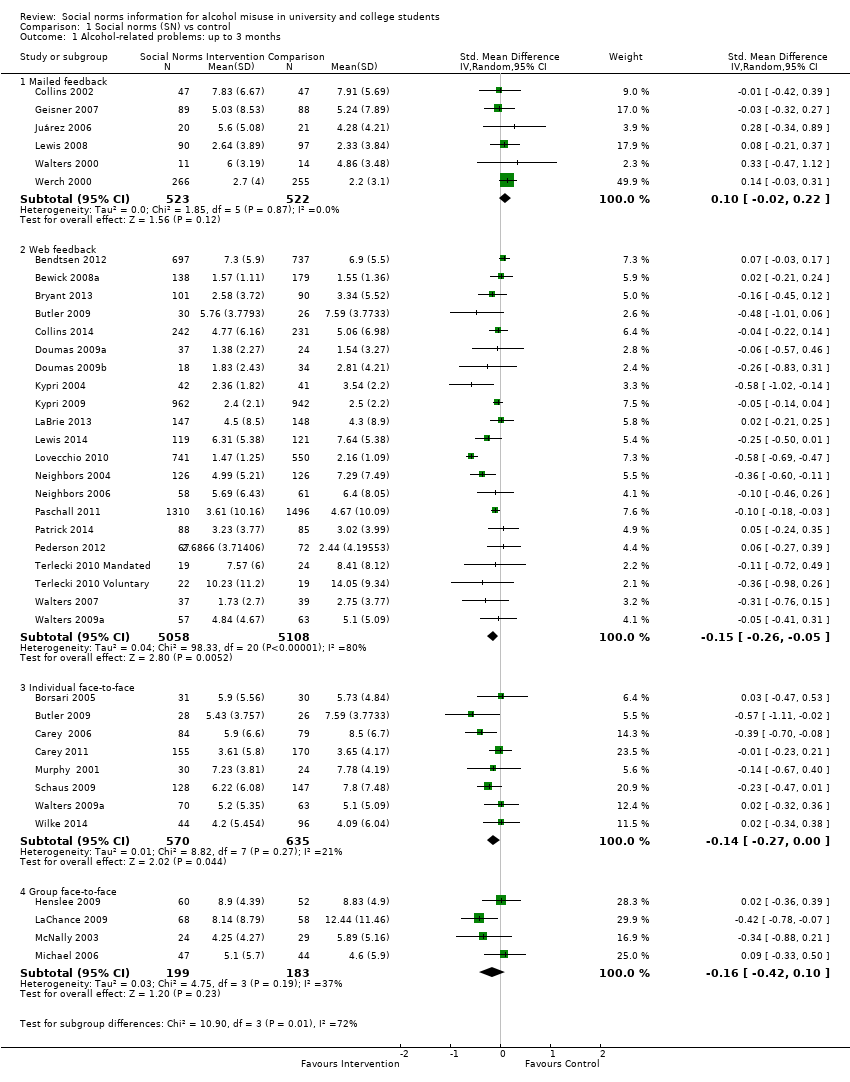
Comparison 1 Social norms (SN) vs control, Outcome 1 Alcohol‐related problems: up to 3 months.

Comparison 1 Social norms (SN) vs control, Outcome 2 Alcohol‐related problems: 4+ months.
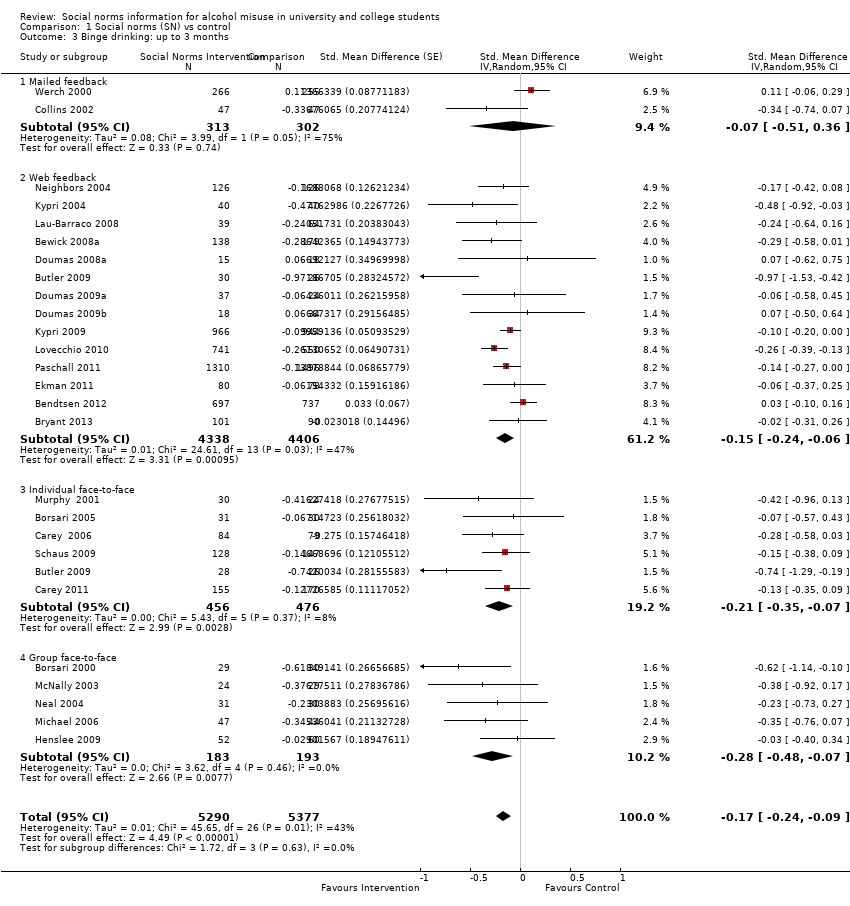
Comparison 1 Social norms (SN) vs control, Outcome 3 Binge drinking: up to 3 months.

Comparison 1 Social norms (SN) vs control, Outcome 4 Binge drinking: 4+ months.

Comparison 1 Social norms (SN) vs control, Outcome 5 Quantity of drinking: up to 3 months.

Comparison 1 Social norms (SN) vs control, Outcome 6 Quantity of drinking: 4+ months.

Comparison 1 Social norms (SN) vs control, Outcome 7 Frequency: up to 3 months.

Comparison 1 Social norms (SN) vs control, Outcome 8 Frequency: 4+ months.

Comparison 1 Social norms (SN) vs control, Outcome 9 Peak BAC: up to 3 months.

Comparison 1 Social norms (SN) vs control, Outcome 10 Peak BAC: 4+ months.

Comparison 1 Social norms (SN) vs control, Outcome 11 Typical BAC: up to 3 months.

Comparison 1 Social norms (SN) vs control, Outcome 12 Typical BAC: 4+ months.
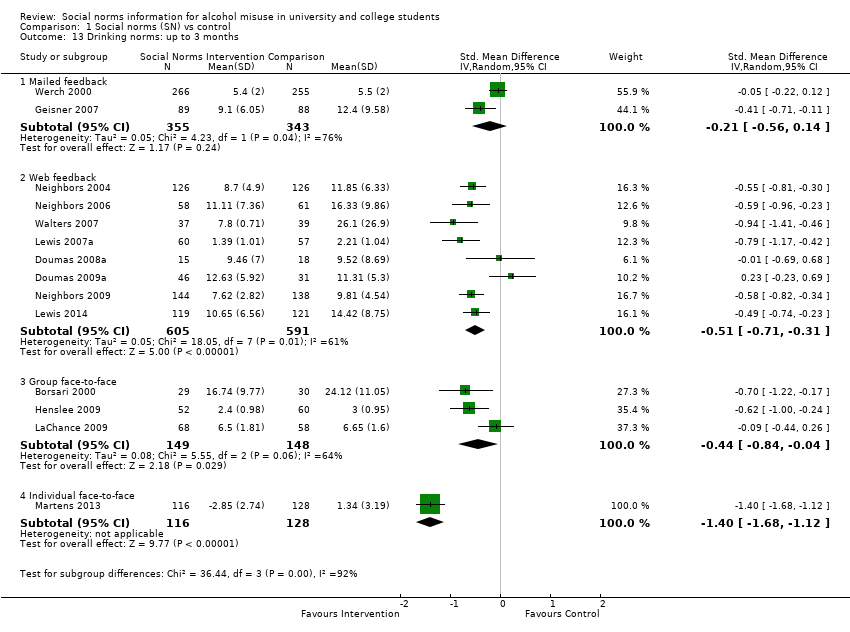
Comparison 1 Social norms (SN) vs control, Outcome 13 Drinking norms: up to 3 months.

Comparison 1 Social norms (SN) vs control, Outcome 14 Drinking norms: 4+ months.
| Social norms information compared with controls for prevention of alcohol misuse | ||||||
| Patient or population: university or college students Settings: college or university settings Intervention: social norms information (personalised feedback or information campaigns); by delivery mode if subgroup differences were noted between different delivery modes (mailed normative feedback; web/computer feedback; individual face‐to‐face feedback; group face‐to‐face feedback) Comparison: no intervention (assessment only or alcohol information or alternative (non‐normative) intervention) Follow‐up: 4+ months Measurement: self‐reported alcohol consumption (questionnaire scale) | ||||||
| Outcomes | Illustrative comparative risks* (95% CI) | Relative effect | Number of participants | Quality of the evidence | Comments | |
| Assumed risk | Corresponding risk | |||||
| Alcohol‐related problems: 4+ months—web/computer normative feedback | Mean alcohol problems scale score was 8.91 in the control group, with a standard deviation of 9.17 (the 69‐point RAPI scale was used by Martens 2013) | The SMD from the meta‐analysis (‐0.04) will result in a decrease of 0.37 in the alcohol problems scale score (95% CI 0.18 to 1.00), from an average of 8.91 to 8.54, based on Martens 2013 | (SMD ‐0.04, 95% CI ‐0.11 to 0.02) | 11,767 (15) | ⊕⊕⊝⊝ | Limitations in design and implementation, especially blinding and in some studies high risk of attrition bias (loss to follow‐up). Borderline substantial heterogeneity (I2 = 51%) |
| Alcohol‐related problems: 4+ months—individual face‐to‐face normative feedback | Mean alcohol problems scale score was 8.91 in the control group, with a standard deviation of 9.17 (the 69‐point RAPI scale was used by Martens 2013) | The SMD from the meta‐analysis (‐0.15) will result in a decrease of 1.28 in the alcohol problems scale score (95% CI 0.37 to 2.20), from an average of 8.91 to 7.63, based on Martens 2013 | (SMD ‐0.14, 95% CI ‐0.24 to ‐0.04) | 2327 (11) | ⊕⊕⊕⊝ | Limitations in design and implementation, especially blinding and in some studies high risk of attrition bias (loss to follow‐up) |
| Binge drinking: 4+ months (all delivery modes) | 43.9% of control group participants were binge drinkers, defined as those who drink above recommended limits for acute risk (> 40 g/> 60 g ethanol on 1 occasion in the preceding 4 weeks for women and men, respectively) in a study by Kypri 2014 | The SMD from the meta‐analysis (‐0.06) will result in 2.7% fewer binge drinkers (95% CI 0.9% to 4.8%), from 43.9% to 41.2%, based on Kypri 2014 | (SMD ‐0.06, 95% CI ‐0.11 to ‐0.02) | 11,292 (16) | ⊕⊕⊕⊝ | Limitations in design and implementation, especially blinding and in some studies high risk of attrition bias (loss to follow‐up) |
| Quantity of drinking: 4+ months (all delivery modes) | Mean number of drinks per week was 13.74 in the control group, with a standard deviation of 10.77, from the DDQ measure in Martens 2013 | The SMD from the meta‐analysis (‐0.08) will result in a decrease of 0.9 drinks consumed each week (95% CI 0.4 to 1.3), from an average of 13.7 drinks per week to 12.8 drinks per week, based on Martens 2013 | (SMD ‐0.08, 95% CI ‐0.12 to ‐0.04) | 21,169 (32) | ⊕⊕⊕⊝ | Limitations in design and implementation, especially blinding and in some studies high risk of attrition bias (loss to follow‐up) |
| Frequency: 4+ months—web/computer normative feedback | Mean number of drinking days per week was 2.74 in the control group, with a standard deviation of 1.54, from the DDQ measure in Martens 2013 | The SMD from the meta‐analysis (‐0.11) will result in a decrease of 0.17 drinking days per week (95% CI 0.06 to 0.26), from an average of 2.74 drinking days per week to 2.57 drinking days per week, based on Martens 2013 | (SMD ‐0.11, 95% CI ‐0.17 to ‐0.04) | 9929 (10) | ⊕⊕⊕⊝ | Limitations in design and implementation, especially blinding and in some studies high risk of attrition bias (loss to follow‐up) |
| Frequency: 4+ months—individual face‐to‐face normative feedback | Mean number of drinking days per week was 2.74 in the control group, with a standard deviation of 1.54, from the DDQ measure in Martens 2013 | The SMD from the meta‐analysis (‐0.21) will result in a decrease of 0.32 drinking days per week (95% CI 0.15 to 0.48), from an average of 2.74 drinking days per week to 2.42 drinking days per week, based on Martens 2013 | (SMD ‐0.21, 95% CI ‐0.31 to ‐0.10) | 1464 (8) | ⊕⊕⊕⊝ | Limitations in design and implementation, especially blinding and in some studies high risk of attrition bias (loss to follow‐up) |
| Frequency: 4+ months—group face‐to‐face normative feedback | Mean number of drinking days per week was 2.74 in the control group, with a standard deviation of 1.54, from the DDQ measure in Martens 2013 | The SMD from the meta‐analysis (‐0.26) will result in a decrease of 0.40 drinking days per week (95% CI 0.03 to 0.83), from an average of 2.74 drinking days per week to 2.34 drinking days per week, based on Martens 2013 | (SMD ‐0.26, 95% CI ‐0.54 to 0.02) | 449 (5) | ⊕⊕⊝⊝ | Limitations in design and implementation, especially blinding and in some studies high risk of attrition bias (loss to follow‐up). Substantial heterogeneity (I2 = 55%) |
| Peak BAC: 4+ months (all delivery modes) | Mean peak BAC was 0.144% in the control group, with a standard deviation of 0.111, from Martens 2013 | The SMD from the meta‐analysis (‐0.08) will result in a decrease of 0.009 for peak BAC (95% CI 0.000 to 0.019), from an average of 0.144% to 0.135%, based on Martens 2013 | (SMD ‐0.08, 95% CI ‐0.17 to 0.00) | 7198 (11) | ⊕⊕⊝⊝ | Limitations in design and implementation, especially blinding and in some studies high risk of attrition bias (loss to follow‐up). Borderline substantial heterogeneity (I2 = 50%) |
| Typical BAC: 4+ months—individual face‐to‐face normative feedback | Mean typical BAC was 0.08% in the control group, with a standard deviation of 0.048, from Schaus 2009 | The SMD from the meta‐analysis (‐0.08) will result in a decrease of 0.004 for typical BAC (95% CI ‐0.005 to 0.013), from an average of 0.080% to 0.076%, based on Schaus 2009 | (SMD ‐0.08, 95% CI ‐0.26 to 0.10) | 490 (4) | ⊕⊕⊕⊝ | Limitations in design and implementation, especially blinding and in some studies high risk of attrition bias (loss to follow‐up) |
| *The basis for the assumed risk is provided in footnotes. The corresponding risk (and its 95% confidence interval) is based on the assumed risk in the comparison group and the relative effect of the intervention (and its 95% CI). | ||||||
| GRADE Working Group grades of evidence. | ||||||
| In the columns illustrating comparative risks: for outcomes where the pooled analysis point estimate and confidence interval showed some effect, we have used results (mean scores and standard deviations) from Martens 2013 to illustrate the effect sizes in terms of the measures used in that study. We chose Martens 2013 because the outcome measures they use are well‐known, generally well regarded, and are typical of the measures used in this field of research: they used the Daily Drinking Questionnaire (DDQ) and the Rutgers Alcohol Problem Index (RAPI). | ||||||
| Outcome or subgroup title | No. of studies | No. of participants | Statistical method | Effect size |
| 1 Alcohol‐related problems: up to 3 months Show forest plot | 37 | Std. Mean Difference (IV, Random, 95% CI) | Subtotals only | |
| 1.1 Mailed feedback | 6 | 1045 | Std. Mean Difference (IV, Random, 95% CI) | 0.10 [‐0.02, 0.22] |
| 1.2 Web feedback | 21 | 10166 | Std. Mean Difference (IV, Random, 95% CI) | ‐0.15 [‐0.26, ‐0.05] |
| 1.3 Individual face‐to‐face | 8 | 1205 | Std. Mean Difference (IV, Random, 95% CI) | ‐0.14 [‐0.27, ‐0.00] |
| 1.4 Group face‐to‐face | 4 | 382 | Std. Mean Difference (IV, Random, 95% CI) | ‐0.16 [‐0.42, 0.10] |
| 2 Alcohol‐related problems: 4+ months Show forest plot | 30 | Std. Mean Difference (Random, 95% CI) | Subtotals only | |
| 2.1 Mailed feedback | 1 | 64 | Std. Mean Difference (Random, 95% CI) | ‐0.34 [‐0.83, 0.15] |
| 2.2 Web feedback | 15 | 11767 | Std. Mean Difference (Random, 95% CI) | ‐0.04 [‐0.11, 0.02] |
| 2.3 Individual face‐to‐face | 11 | 2327 | Std. Mean Difference (Random, 95% CI) | ‐0.14 [‐0.24, ‐0.04] |
| 2.4 Group face‐to‐face | 1 | 126 | Std. Mean Difference (Random, 95% CI) | ‐0.62 [‐0.97, ‐0.26] |
| 2.5 Marketing campaign | 2 | 4943 | Std. Mean Difference (Random, 95% CI) | ‐0.03 [‐0.17, 0.10] |
| 3 Binge drinking: up to 3 months Show forest plot | 26 | 10667 | Std. Mean Difference (Random, 95% CI) | ‐0.17 [‐0.24, ‐0.09] |
| 3.1 Mailed feedback | 2 | 615 | Std. Mean Difference (Random, 95% CI) | ‐0.07 [‐0.51, 0.36] |
| 3.2 Web feedback | 14 | 8744 | Std. Mean Difference (Random, 95% CI) | ‐0.15 [‐0.24, ‐0.06] |
| 3.3 Individual face‐to‐face | 6 | 932 | Std. Mean Difference (Random, 95% CI) | ‐0.21 [‐0.35, ‐0.07] |
| 3.4 Group face‐to‐face | 5 | 376 | Std. Mean Difference (Random, 95% CI) | ‐0.28 [‐0.48, ‐0.07] |
| 4 Binge drinking: 4+ months Show forest plot | 16 | 11292 | Std. Mean Difference (Random, 95% CI) | ‐0.06 [‐0.11, ‐0.02] |
| 4.1 Mailed feedback | 1 | 65 | Std. Mean Difference (Random, 95% CI) | ‐0.17 [‐0.66, 0.32] |
| 4.2 Web feedback | 10 | 10719 | Std. Mean Difference (Random, 95% CI) | ‐0.07 [‐0.12, ‐0.02] |
| 4.3 Individual face‐to‐face | 5 | 508 | Std. Mean Difference (Random, 95% CI) | 0.01 [‐0.17, 0.18] |
| 5 Quantity of drinking: up to 3 months Show forest plot | 45 | 14184 | Std. Mean Difference (IV, Random, 95% CI) | ‐0.14 [‐0.19, ‐0.09] |
| 5.1 Mailed feedback | 5 | 1020 | Std. Mean Difference (IV, Random, 95% CI) | ‐0.04 [‐0.21, 0.13] |
| 5.2 Web feedback | 28 | 10889 | Std. Mean Difference (IV, Random, 95% CI) | ‐0.12 [‐0.18, ‐0.07] |
| 5.3 Individual face‐to‐face | 8 | 1309 | Std. Mean Difference (IV, Random, 95% CI) | ‐0.24 [‐0.38, ‐0.11] |
| 5.4 Group face‐to‐face | 5 | 411 | Std. Mean Difference (IV, Random, 95% CI) | ‐0.30 [‐0.49, ‐0.10] |
| 5.5 Marketing campaign | 1 | 555 | Std. Mean Difference (IV, Random, 95% CI) | ‐0.05 [‐0.22, 0.11] |
| 6 Quantity of drinking: 4+ months Show forest plot | 32 | 21169 | Std. Mean Difference (Random, 95% CI) | ‐0.08 [‐0.12, ‐0.04] |
| 6.1 Mailed feedback | 2 | 533 | Std. Mean Difference (Random, 95% CI) | ‐0.13 [‐0.32, 0.06] |
| 6.2 Web feedback | 18 | 13319 | Std. Mean Difference (Random, 95% CI) | ‐0.07 [‐0.12, ‐0.02] |
| 6.3 Individual face‐to‐face | 12 | 2374 | Std. Mean Difference (Random, 95% CI) | ‐0.15 [‐0.23, ‐0.08] |
| 6.4 Marketing campaign | 2 | 4943 | Std. Mean Difference (Random, 95% CI) | ‐0.02 [‐0.13, 0.09] |
| 7 Frequency: up to 3 months Show forest plot | 19 | Std. Mean Difference (IV, Random, 95% CI) | Subtotals only | |
| 7.1 Mailed feedback | 1 | 521 | Std. Mean Difference (IV, Random, 95% CI) | 0.12 [‐0.05, 0.29] |
| 7.2 Web feedback | 12 | 6385 | Std. Mean Difference (IV, Random, 95% CI) | ‐0.17 [‐0.25, ‐0.09] |
| 7.3 Individual face‐to‐face | 4 | 515 | Std. Mean Difference (IV, Random, 95% CI) | ‐0.45 [‐0.63, ‐0.28] |
| 7.4 Group face‐to‐face | 3 | 264 | Std. Mean Difference (IV, Random, 95% CI) | ‐0.03 [‐0.27, 0.21] |
| 8 Frequency: 4+ months Show forest plot | 25 | Std. Mean Difference (Random, 95% CI) | Subtotals only | |
| 8.1 Web feedback | 10 | 9929 | Std. Mean Difference (Random, 95% CI) | ‐0.11 [‐0.17, ‐0.04] |
| 8.2 Individual face‐to‐face | 8 | 1464 | Std. Mean Difference (Random, 95% CI) | ‐0.21 [‐0.31, ‐0.10] |
| 8.3 Group face‐to‐face | 5 | 449 | Std. Mean Difference (Random, 95% CI) | ‐0.26 [‐0.54, 0.02] |
| 8.4 Marketing campaign | 2 | 4943 | Std. Mean Difference (Random, 95% CI) | ‐0.01 [‐0.09, 0.06] |
| 9 Peak BAC: up to 3 months Show forest plot | 11 | 1902 | Std. Mean Difference (IV, Random, 95% CI) | ‐0.22 [‐0.33, ‐0.11] |
| 9.1 Mailed feedback | 1 | 94 | Std. Mean Difference (IV, Random, 95% CI) | ‐0.20 [‐0.60, 0.21] |
| 9.2 Web feedback | 4 | 477 | Std. Mean Difference (IV, Random, 95% CI) | ‐0.13 [‐0.35, 0.09] |
| 9.3 Individual face‐to‐face | 7 | 1331 | Std. Mean Difference (IV, Random, 95% CI) | ‐0.26 [‐0.39, ‐0.13] |
| 10 Peak BAC: 4+ months Show forest plot | 11 | 7198 | Std. Mean Difference (IV, Random, 95% CI) | ‐0.08 [‐0.17, 0.00] |
| 10.1 Mailed feedback | 1 | 468 | Std. Mean Difference (IV, Random, 95% CI) | ‐0.13 [‐0.33, 0.08] |
| 10.2 Web feedback | 3 | 355 | Std. Mean Difference (IV, Random, 95% CI) | ‐0.08 [‐0.29, 0.13] |
| 10.3 Individual face‐to‐face | 7 | 1432 | Std. Mean Difference (IV, Random, 95% CI) | ‐0.16 [‐0.26, ‐0.05] |
| 10.4 Marketing campaign | 2 | 4943 | Std. Mean Difference (IV, Random, 95% CI) | 0.02 [‐0.18, 0.21] |
| 11 Typical BAC: up to 3 months Show forest plot | 8 | 1336 | Std. Mean Difference (IV, Random, 95% CI) | ‐0.17 [‐0.31, ‐0.03] |
| 11.1 Mailed feedback | 3 | 253 | Std. Mean Difference (IV, Random, 95% CI) | ‐0.10 [‐0.35, 0.15] |
| 11.2 Web feedback | 1 | 282 | Std. Mean Difference (IV, Random, 95% CI) | ‐0.25 [‐0.48, ‐0.01] |
| 11.3 Individual face‐to‐face | 4 | 801 | Std. Mean Difference (IV, Random, 95% CI) | ‐0.14 [‐0.40, 0.12] |
| 12 Typical BAC: 4+ months Show forest plot | 4 | Std. Mean Difference (IV, Random, 95% CI) | Subtotals only | |
| 12.1 Individual face‐to‐face | 4 | 490 | Std. Mean Difference (IV, Random, 95% CI) | ‐0.08 [‐0.26, 0.10] |
| 13 Drinking norms: up to 3 months Show forest plot | 14 | Std. Mean Difference (IV, Random, 95% CI) | Subtotals only | |
| 13.1 Mailed feedback | 2 | 698 | Std. Mean Difference (IV, Random, 95% CI) | ‐0.21 [‐0.56, 0.14] |
| 13.2 Web feedback | 8 | 1196 | Std. Mean Difference (IV, Random, 95% CI) | ‐0.51 [‐0.71, ‐0.31] |
| 13.3 Group face‐to‐face | 3 | 297 | Std. Mean Difference (IV, Random, 95% CI) | ‐0.44 [‐0.84, ‐0.04] |
| 13.4 Individual face‐to‐face | 1 | 244 | Std. Mean Difference (IV, Random, 95% CI) | ‐1.40 [‐1.68, ‐1.12] |
| 14 Drinking norms: 4+ months Show forest plot | 9 | Std. Mean Difference (Random, 95% CI) | Subtotals only | |
| 14.1 Web feedback | 6 | 2227 | Std. Mean Difference (Random, 95% CI) | ‐0.34 [‐0.57, ‐0.11] |
| 14.2 Individual face‐to‐face | 1 | 240 | Std. Mean Difference (Random, 95% CI) | ‐1.19 [‐1.47, ‐0.92] |
| 14.3 Marketing campaign | 2 | 4943 | Std. Mean Difference (Random, 95% CI) | ‐0.06 [‐0.23, 0.11] |