Social norms information for alcohol misuse in university and college students
Abstract
Background
Drinking is influenced by youth perceptions of how their peers drink. These perceptions are often incorrect, overestimating peer drinking norms. If inaccurate perceptions can be corrected, young people may drink less.
Objectives
To determine whether social norms interventions reduce alcohol‐related negative consequences, alcohol misuse or alcohol consumption when compared with a control (ranging from assessment only/no intervention to other educational or psychosocial interventions) among university and college students.
Search methods
The following electronic databases were searched up to July 2015: the Cochrane Central Register of Controlled Trials (CENTRAL) (The Cochrane Library), MEDLINE, EMBASE, PsycINFO. The Cumulative Index to Nursing and Allied Health Literature (CINAHL) only to March 2008. Reference lists of included studies and review articles were manually searched. No restriction based on language or date was applied.
Selection criteria
Randomised controlled trials or cluster‐randomised controlled trials that compared a social normative intervention versus no intervention, alcohol education leaflet or other 'non‐normative feedback' alcohol intervention and reported on alcohol consumption or alcohol‐related problems in university or college students.
Data collection and analysis
We used standard methodological procedures as expected by Cochrane. Each outcome was analysed by mode of delivery: mailed normative feedback (MF); web/computer normative feedback (WF); individual face‐to‐face normative feedback (IFF); group face‐to‐face normative feedback (GFF); and normative marketing campaign (MC).
Main results
A total of 70 studies (44,958 participants) were included in the review, and 63 studies (42,784 participants) in the meta‐analyses. Overall, the risk of bias assessment showed that these studies provided moderate or low quality evidence.
Outcomes at four or more months post‐intervention were of particular interest to assess when effects were sustained beyond the immediate short term. We have reported pooled effects across delivery modes only for those analyses for which heterogeneity across delivery modes is not substantial (I2 < 50%).
Alcohol‐related problems at four or more months: IFF standardised mean difference (SMD) ‐0.14, 95% confidence interval (CI) ‐0.24 to ‐0.04 (participants = 2327; studies = 11; moderate quality evidence), equivalent to a decrease of 1.28 points in the 69‐point alcohol problems scale score. No effects were found for WF or MF.
Binge drinking at four or more months: results pooled across delivery modes: SMD ‐0.06, 95% CI ‐0.11 to ‐0.02 (participants = 11,292; studies = 16; moderate quality evidence), equivalent to 2.7% fewer binge drinkers if 30‐day prevalence is 43.9%.
Drinking quantity at four or more months: results pooled across delivery modes: SMD ‐0.08, 95% CI ‐0.12 to ‐0.04 (participants = 21,169; studies = 32; moderate quality evidence), equivalent to a reduction of 0.9 drinks consumed each week, from a baseline of 13.7 drinks per week.
Drinking frequency at four or more months: WF SMD ‐0.11, 95% CI ‐0.17 to ‐0.04 (participants = 9929; studies = 10; moderate quality evidence), equivalent to a decrease of 0.17 drinking days/wk, from a baseline of 2.74 days/wk; IFF SMD ‐0.21, 95% CI ‐0.31 to ‐0.10 (participants = 1464; studies = 8; moderate quality evidence), equivalent to a decrease of 0.32 drinking days/wk, from a baseline of 2.74 days/wk. No effects were found for GFF or MC.
Estimated blood alcohol concentration (BAC) at four or more months: peak BAC results pooled across delivery modes: SMD ‐0.08, 95% CI ‐0.17 to 0.00 (participants = 7198; studies = 11; low quality evidence), equivalent to a reduction in peak BAC from an average of 0.144% to 0.135%. No effects were found for typical BAC with IFF.
Authors' conclusions
The results of this review indicate that no substantive meaningful benefits are associated with social norms interventions for prevention of alcohol misuse among college/university students. Although some significant effects were found, we interpret the effect sizes as too small, given the measurement scales used in the studies included in this review, to be of relevance for policy or practice. Moreover, the significant effects are not consistent for all misuse measures, heterogeneity was a problem in some analyses and bias cannot be discounted as a potential cause of these findings.
PICO
Plain language summary
Social norms interventions are not effective enough on their own to reduce alcohol use or misuse among university or college students
Background: Drinking is influenced by youth perceptions of how their peers drink. These perceptions are often incorrect, overestimating peer drinking norms. If inaccurate perceptions can be corrected, with social norms information or feedback, young people may drink less.
Search date: To July 2015.
Study characteristics: 70 studies were included in this review, with 44,958 students overall. We were interested mainly in studies with a follow‐up period of four or more months to assess whether any effects were sustained beyond the immediate short term. In 43 of the trials, the social norms intervention was targeted at higher‐risk students. 55 trials were conducted in the USA, with others form Australia, Brazil, New Zealand, Sweden and the United Kingdom.
Delivery of social norms information included mailed feedback, web/computer feedback, individual face‐to‐face feedback, group face‐to‐face feedback and general social norms marketing campaigns across college campuses.
Key findings
Over the longer‐term, after four or more months of follow‐up, there was only a small effect of social norms information on binge drinking, drinking quantity, and peak BAC. For these outcomes, effects were not any different across the different delivery modes.Only small effects were found for web feedback and individual face‐to‐face feedback on frequency of alcohol consumed. Only a small effect of individual face‐to‐face feedback on alcohol related problems, but no effects were found for mailed or web feedback. Similarly, no effects were found for group face‐to‐face feedback or for marketing campaigns on frequency of alcohol consumed and typical BAC.
Our reading of these results is that, although we found some significant effects of social norms information, the strength of the effects over the longer‐term is very small and therefore this information is unlikely to provide any advantage in practice.
Quality of the evidence
Overall, only low or moderate quality evidence was noted for the effects reported in this review. Problems with study quality could result in estimates of social norms effects that are too high, so we cannot rule out the chance that the effects observed in this review may be overstated.
The U.S. National Institutes of Health provided funding for just under half (33/70) of the studies included in this review. Eighteen studies provided no information about funding, and only 13 papers had a clear conflict of interest statement.
Authors' conclusions
Summary of findings
| Social norms information compared with controls for prevention of alcohol misuse | ||||||
| Patient or population: university or college students Settings: college or university settings Intervention: social norms information (personalised feedback or information campaigns); by delivery mode if subgroup differences were noted between different delivery modes (mailed normative feedback; web/computer feedback; individual face‐to‐face feedback; group face‐to‐face feedback) Comparison: no intervention (assessment only or alcohol information or alternative (non‐normative) intervention) Follow‐up: 4+ months Measurement: self‐reported alcohol consumption (questionnaire scale) | ||||||
| Outcomes | Illustrative comparative risks* (95% CI) | Relative effect | Number of participants | Quality of the evidence | Comments | |
| Assumed risk | Corresponding risk | |||||
| Alcohol‐related problems: 4+ months—web/computer normative feedback | Mean alcohol problems scale score was 8.91 in the control group, with a standard deviation of 9.17 (the 69‐point RAPI scale was used by Martens 2013) | The SMD from the meta‐analysis (‐0.04) will result in a decrease of 0.37 in the alcohol problems scale score (95% CI 0.18 to 1.00), from an average of 8.91 to 8.54, based on Martens 2013 | (SMD ‐0.04, 95% CI ‐0.11 to 0.02) | 11,767 (15) | ⊕⊕⊝⊝ | Limitations in design and implementation, especially blinding and in some studies high risk of attrition bias (loss to follow‐up). Borderline substantial heterogeneity (I2 = 51%) |
| Alcohol‐related problems: 4+ months—individual face‐to‐face normative feedback | Mean alcohol problems scale score was 8.91 in the control group, with a standard deviation of 9.17 (the 69‐point RAPI scale was used by Martens 2013) | The SMD from the meta‐analysis (‐0.15) will result in a decrease of 1.28 in the alcohol problems scale score (95% CI 0.37 to 2.20), from an average of 8.91 to 7.63, based on Martens 2013 | (SMD ‐0.14, 95% CI ‐0.24 to ‐0.04) | 2327 (11) | ⊕⊕⊕⊝ | Limitations in design and implementation, especially blinding and in some studies high risk of attrition bias (loss to follow‐up) |
| Binge drinking: 4+ months (all delivery modes) | 43.9% of control group participants were binge drinkers, defined as those who drink above recommended limits for acute risk (> 40 g/> 60 g ethanol on 1 occasion in the preceding 4 weeks for women and men, respectively) in a study by Kypri 2014 | The SMD from the meta‐analysis (‐0.06) will result in 2.7% fewer binge drinkers (95% CI 0.9% to 4.8%), from 43.9% to 41.2%, based on Kypri 2014 | (SMD ‐0.06, 95% CI ‐0.11 to ‐0.02) | 11,292 (16) | ⊕⊕⊕⊝ | Limitations in design and implementation, especially blinding and in some studies high risk of attrition bias (loss to follow‐up) |
| Quantity of drinking: 4+ months (all delivery modes) | Mean number of drinks per week was 13.74 in the control group, with a standard deviation of 10.77, from the DDQ measure in Martens 2013 | The SMD from the meta‐analysis (‐0.08) will result in a decrease of 0.9 drinks consumed each week (95% CI 0.4 to 1.3), from an average of 13.7 drinks per week to 12.8 drinks per week, based on Martens 2013 | (SMD ‐0.08, 95% CI ‐0.12 to ‐0.04) | 21,169 (32) | ⊕⊕⊕⊝ | Limitations in design and implementation, especially blinding and in some studies high risk of attrition bias (loss to follow‐up) |
| Frequency: 4+ months—web/computer normative feedback | Mean number of drinking days per week was 2.74 in the control group, with a standard deviation of 1.54, from the DDQ measure in Martens 2013 | The SMD from the meta‐analysis (‐0.11) will result in a decrease of 0.17 drinking days per week (95% CI 0.06 to 0.26), from an average of 2.74 drinking days per week to 2.57 drinking days per week, based on Martens 2013 | (SMD ‐0.11, 95% CI ‐0.17 to ‐0.04) | 9929 (10) | ⊕⊕⊕⊝ | Limitations in design and implementation, especially blinding and in some studies high risk of attrition bias (loss to follow‐up) |
| Frequency: 4+ months—individual face‐to‐face normative feedback | Mean number of drinking days per week was 2.74 in the control group, with a standard deviation of 1.54, from the DDQ measure in Martens 2013 | The SMD from the meta‐analysis (‐0.21) will result in a decrease of 0.32 drinking days per week (95% CI 0.15 to 0.48), from an average of 2.74 drinking days per week to 2.42 drinking days per week, based on Martens 2013 | (SMD ‐0.21, 95% CI ‐0.31 to ‐0.10) | 1464 (8) | ⊕⊕⊕⊝ | Limitations in design and implementation, especially blinding and in some studies high risk of attrition bias (loss to follow‐up) |
| Frequency: 4+ months—group face‐to‐face normative feedback | Mean number of drinking days per week was 2.74 in the control group, with a standard deviation of 1.54, from the DDQ measure in Martens 2013 | The SMD from the meta‐analysis (‐0.26) will result in a decrease of 0.40 drinking days per week (95% CI 0.03 to 0.83), from an average of 2.74 drinking days per week to 2.34 drinking days per week, based on Martens 2013 | (SMD ‐0.26, 95% CI ‐0.54 to 0.02) | 449 (5) | ⊕⊕⊝⊝ | Limitations in design and implementation, especially blinding and in some studies high risk of attrition bias (loss to follow‐up). Substantial heterogeneity (I2 = 55%) |
| Peak BAC: 4+ months (all delivery modes) | Mean peak BAC was 0.144% in the control group, with a standard deviation of 0.111, from Martens 2013 | The SMD from the meta‐analysis (‐0.08) will result in a decrease of 0.009 for peak BAC (95% CI 0.000 to 0.019), from an average of 0.144% to 0.135%, based on Martens 2013 | (SMD ‐0.08, 95% CI ‐0.17 to 0.00) | 7198 (11) | ⊕⊕⊝⊝ | Limitations in design and implementation, especially blinding and in some studies high risk of attrition bias (loss to follow‐up). Borderline substantial heterogeneity (I2 = 50%) |
| Typical BAC: 4+ months—individual face‐to‐face normative feedback | Mean typical BAC was 0.08% in the control group, with a standard deviation of 0.048, from Schaus 2009 | The SMD from the meta‐analysis (‐0.08) will result in a decrease of 0.004 for typical BAC (95% CI ‐0.005 to 0.013), from an average of 0.080% to 0.076%, based on Schaus 2009 | (SMD ‐0.08, 95% CI ‐0.26 to 0.10) | 490 (4) | ⊕⊕⊕⊝ | Limitations in design and implementation, especially blinding and in some studies high risk of attrition bias (loss to follow‐up) |
| *The basis for the assumed risk is provided in footnotes. The corresponding risk (and its 95% confidence interval) is based on the assumed risk in the comparison group and the relative effect of the intervention (and its 95% CI). | ||||||
| GRADE Working Group grades of evidence. | ||||||
| In the columns illustrating comparative risks: for outcomes where the pooled analysis point estimate and confidence interval showed some effect, we have used results (mean scores and standard deviations) from Martens 2013 to illustrate the effect sizes in terms of the measures used in that study. We chose Martens 2013 because the outcome measures they use are well‐known, generally well regarded, and are typical of the measures used in this field of research: they used the Daily Drinking Questionnaire (DDQ) and the Rutgers Alcohol Problem Index (RAPI). | ||||||
Background
Description of the condition
Alcohol misuse
A total of 2.5 million deaths and 58.3 million disability‐adjusted life‐years (DALYs) each year are caused by the harmful use of alcohol worldwide (World Health Organization 2011). In all, 9% of deaths among young people between the ages of 15 and 29 are due to alcohol‐related events (World Health Organization 2011). Accidental injuries are responsible for about one‐third of alcohol‐related deaths, and neuropsychiatric conditions are responsible for nearly 40% of the 58.3 million DALYs (World Health Organization 2011).
The European Union (EU) is the heaviest drinking region of the world, with the equivalent of 11 litres of pure alcohol taken per adult each year (Anderson 2006). More than one of four deaths among young men (aged 15 to 29 years) and one of every 10 deaths among young women in the EU are alcohol related (World Health Organization 2011). Young people (aged 15 to 24 years) contribute a high proportion to this burden, with more than 25% of young male mortality and approximately 10% of young female mortality due to alcohol (Anderson 2006). Some information is also available on the extent of social harm among young people, for example, a third of a million 15‐ to 16‐year‐old students in the EU report engaging in fights, and 200,000 report unprotected sex due to their own drinking (Anderson 2006).
Alcohol consumption and related problems have been widely studied in university and college students in the USA (Hingson 2005; Wechsler 1994). Drinking patterns of university students in Europe and in other parts of the world have been studied less In comparison (Karam 2007).
Research suggests that university students drink more than their non‐university peers (Carter 2010; Dawson 2004; Kypri 2005). Whilst non‐university peers drink more frequently, university students tend to drink excessively when they do drink (O' Malley 2002). A study of tertiary students living in halls of residence in New Zealand showed that 60% of males and 58% of females typically drank amounts that exceed the national safe drinking guidelines (Kypri 2002). A survey of alcohol and drug use among UK‐based dental undergraduates revealed that 63% of male students and 42% of female students drank amounts that exceed the national safe drinking guidelines (Underwood 2000). In a review paper, Carter 2010 reported that college students tend to be at greater risk for alcohol‐related problems, including alcohol abuse and alcohol dependence, than their non‐college peers. A US National Institutes of Health briefing paper on college drinking reported that almost 60% of college students aged 18 years to 22 years drank alcohol, and almost two‐thirds had been binge drinkers in the past month (NIAAA 2015).
Description of the intervention
Two different types of norms can be applied: injunctive and descriptive norms. The first type (injunctive social norms) is related to a person's viewpoint of what he or she thinks is right based on personal beliefs or morals. The second type (descriptive social norms) refers to perceptions of what is usually done by others and is the typical focus of social norms interventions. Social norms interventions can be universal or targeted and are classed as informational prevention according to the form and function classification system used for prevention interventions (Foxcroft 2014a; Foxcroft 2014b).
Descriptive social norms (hereafter referred to as social norms) interventions have typically come in one of two forms: social marketing of normative information, or normative feedback to individuals or small groups. Social marketing approaches rely on universal mass communications methods for educating students regarding actual drinking behaviours. Although social marketing approaches provide the advantage of reaching a larger audience, they can be costly and are limited by the fact that they are relatively impersonal and assume that students will both see and carefully process the information (Walters 2000).
Personalised normative feedback interventions provide students with information about actual student drinking norms. Feedback also provides comparisons between actual student drinking patterns and perceptions of the norm (Lewis 2006), pointing out discrepancies. A personal drinking profile is typically given to each student via email, by letter or in person along with information about quantity of alcohol consumption, money spent on alcohol, calorie intake, risk factors, negative consequences and normative comparisons (e.g. beliefs about peers' drinking, amount consumed in relation to peers). Normative feedback can be given as a stand‐alone intervention or as an adjunct to an individual or group counselling session. Normative feedback is usually given as a substantive part of an intervention that also comprises standard information on alcohol consumption and the risks associated with misuse.
How the intervention might work
Social norms interventions are predicated on how an individual's perceptions and beliefs about what constitutes 'normal' behaviour in similar people influence their own behaviour (Berkowitz 2005; Perkins 2003). So, for example, if an individual believes that his or her peers drink heavily, this influences the amount of alcohol that that individual drinks. The extent of contact that an individual has with the peer or reference group and how closely he or she identifies with the group can affect how much the perceived group norm influences the individual.
Research consistently shows that college and university students typically perceive peer norms incorrectly by overestimating the amount of alcohol consumed by peers (Mcalaney 2007; Perkins 1996; Perkins 2007). It is important to note that high levels of overestimated peer norms were shown to be associated with greater personal alcohol consumption (Mcalaney 2007; Perkins 1996; Perkins 2007). Use of social norms theory in applied prevention and intervention work relies on the fact that much of peer influence is due to incorrect perceptions of peer group attitudes and behaviours. Social norms‐based interventions aim to provide accurate information about prevailing norms for alcohol use, reducing the possibility of inaccurate perceptions.
Why it is important to do this review
If health professionals, prevention specialists, colleges and universities are to implement social norms interventions in practice, clear evidence on effectiveness and longer‐term sustained benefit is required, especially regarding effects on hazardous and harmful drinking amongst university and college students. Alcohol availability and marketing promote alcohol consumption and this pro‐alcohol messaging undoubtedly influences social norms for college student drinking. It is reasonable to suggest that public health attempts to bend social norms in the opposite direction would be a logical strategy to employ. Given the resources put behind alcohol availability and marketing campaigns it is important to know whether social norms interventions are having any impact to counter pro‐alcohol availability and messaging.
A few reviews have focused on social norms interventions (Bewick 2008b; Walters 2004): Bewick 2008b reviewed the published literature on the effectiveness of web‐based interventions in reducing alcohol consumption or preventing alcohol abuse, or both and concluded that evidence on the effectiveness of screening and brief intervention (eSBI) for alcohol use was inconsistent. Walters 2004 reviewed published studies that used feedback as the main component of an alcohol intervention for college students. Feedback appeared to change normative perceptions of drinking and was possibly more effective among students who drink for social reasons. The addition of an individual counselling or group session did not seem to increase the short‐term effect of the feedback. One (Tanner‐Smith 2015) reported that brief interventions led to significant reductions in alcohol consumption and alcohol‐related problems in adolescents and young adults, and that motivational interviewing was associated with larger effects than some other types of interventions. Social norms feedback was not distinguished from other forms of brief intervention in this review. In another review (Huh 2015) also reviewed brief interventions and undertook post‐hoc comparisons of different intervention types. They found that personalised feedback on its own did not show an effect when compared with control.
Objectives
To determine whether social norms interventions reduce alcohol‐related negative consequences, alcohol misuse or alcohol consumption when compared with a control (ranging from assessment only/no intervention to other educational or psychosocial interventions) among university and college students.
Methods
Criteria for considering studies for this review
Types of studies
We included all randomised controlled trials with individual or cluster designs.
Types of participants
We considered trials that included students from university or college settings.
Types of interventions
-
Universal personalised normative feedback to individuals in cases where all students are asked to participate regardless of drinking status or risk level.
-
Targeted interventions focused on members of a particular group, such as fraternity and sorority members, athletes or individuals deemed to be at higher risk for alcohol problems.
-
Social norms marketing campaigns (e.g. community‐wide electronic or print media campaigns, or both) that refer to normative drinking patterns.
Control intervention
-
Interventions with no social norms component including no intervention or minimal intervention in the form of a leaflet, or an educational or psychosocial intervention without a social norms component.
Types of outcome measures
The following primary and secondary outcome measures were of interest.
Primary outcomes
Self‐reported measures of alcohol‐related problems using a validated scale such as the Rutgers Alcohol Problem Index (RAPI), which typically includes questions regarding the following.
-
Adverse legal events as a consequence of alcohol (i.e. violence, driving offences).
-
Inappropriate risky behaviours (e.g. sex without use of condom) related to alcohol use.
-
Alcohol‐related injuries.
-
Illicit drugs consumption (e.g. marijuana, cocaine) associated with alcohol use.
Alcohol use documented by self‐reported measures of the following.
-
Binge drinking or heavy episodic drinking (e.g. four or more drinks for women, five or more drinks for men, on a drinking occasion).
-
Alcohol consumption (quantity): measured in terms of the number of drinks/units consumed over a specific period. When more than one measure of consumption was reported, for the purpose of meta‐analysis weekly consumption was the outcome of preference when provided. Tools typically used to measure quantity of consumption include a daily drinking questionnaire (DDQ) and quantity‐frequency scale(s).
-
Alcohol consumption (frequency), typically frequency of consumption during the past 30‐ or seven‐day period.
-
Peak blood alcohol content (peak BAC) calculated using a formula based on consumption, gender and weight.
-
Typical BAC calculated using a formula based on consumption, gender and weight.
Secondary outcomes
-
Drinking norms measured using validated scales such as the drinking norms rating form. When perceived peer use of alcohol was reported in terms of both quantity and frequency, only the quantity measure was included in the meta‐analysis.
Search methods for identification of studies
Electronic searches
Databases searched included the following.
-
Cochrane Central Register of Controlled Trials (CENTRAL) (The Cochrane Library) (issue 7, 2015).
-
Ovid MEDLINE (January 1966 to March 2008, and March 2008 to July 2015 for review update).
-
Ovid EMBASE (January 1988 to March 2008, and March 2008 to July 2015 for review update).
-
Ovid PsycINFO (1985 to March 2008, and March 2008 to July 2015 for review update).
-
Ovid Cumulative Index to Nursing and Allied Health Literature (CINAHL) (1982 to March 2008 only).
-
Cochrane Drugs and Alcohol Group Register of Trials (up to 2008 only); searched using the following terms: diagnosis = alcohol and intervention = social norms. The Cochrane Drugs and Alcohol Group Register of Trials has been merged with CENTRAL; therefore the search on CENTRAL up to July 2015 covers both registers.
To identify the studies included in this review and in the previous review (Moreira 2009), the same detailed search strategies were used for each database searched (Moreira 2009). These strategies were based on the search strategy developed for MEDLINE but were revised appropriately for each database to account for differences in controlled vocabulary and syntax rules. The search strategies are available in Appendix 1, Appendix 2 and Appendix 3.
Searching other resources
Unpublished reports, abstracts, briefs and preliminary reports were considered for inclusion on the same basis as published reports. No restriction based on language or date was applied. Reference lists of studies included in the update were manually searched.
Data collection and analysis
Selection of studies
Two out of three review authors (NS, TM, DF) read all titles or abstracts, or both resulting from the search process and eliminated obviously irrelevant studies. We obtained full copies of the remaining potentially relevant studies. Two out of three review authors (NS, TM, DF), acting independently, classified these as "clearly relevant", "meets all inclusion criteria therefore include", "clearly irrelevant therefore exclude", or "insufficient information to make a decision" whereby we contacted the study authors to ask for further information to aid the decision process. We based decisions on inclusion criteria (i.e. types of studies, types of participants, interventions and outcome measures used) and resolved differences in opinionthrough consensus or by referral to a third review author. We increased the amount of available information for each studyby using all companion publications.
Data extraction and management
Two out of three review authors (NS, TM, DF) independently extracted data from study sources using a data extraction form and then compared forms. The data extraction form collected information on study design, target population, reported outcomes, age, type of intervention and comparison, setting, inclusion/exclusion criteria, risk of bias, number eligible/recruited, risk of bias, and relevant results. When differences occurred, we resolved them through discussion, and, if necessary, by discussion with a third review author. When required, we obtained additional information by contacting the original study authors. We entered information from the data extraction forms into the Cochrane software programme, Review Manager version 5.3 (RevMan 2014) .
Assessment of risk of bias in included studies
We followed the recommended approach for assessing risk of bias in studies included in Cochrane reviews (see Appendix 4) based on evaluation of six specific methodological domains: (1) random sequence generation, (2) allocation concealment, (3) blinding of participants and personnel, (4) blinding of outcome assessors, (5) incomplete outcome data and (6) selective outcome reporting. For each study, the six domains were appraised and described as reported in the study, and a final judgement on the likelihood of bias was provided. This was achieved by using the 'Risk of bias' tool when a judgement of 'high risk' of bias, 'low risk' of bias or 'unclear risk' of bias was made for each of the domains in each included study. To make these judgements, we used the criteria indicated by the Cochrane Handbook for Systematic Reviews of Interventions (Higgins 2011a). In addition, for the domain of incomplete outcome data, we regarded attrition rates greater than 20% at final follow‐up as presenting high risk of bias, and rates of 20% or less with no evidence of differential attrition as showing low risk of bias.
Measures of treatment effect
Study follow‐up periods were a priori and arbitrarily categorised as follows: short‐term follow‐up, defined as data collected up to three months after the intervention; and longer‐term follow‐up, defined as data collected four or more months after the intervention. For some meta‐analysis effect sizes, we have calculated and reported the proportions of students in the intervention condition for which outcome score was changed, based on conversion of the standardised mean difference (SMD) into a Z score and expressed as a percentage (%) of participants with changed (typically decreased) scores. When possible, we have calculated from the SMD point estimate the reduction in outcome score; to do this, we used the standard deviation (SD) for each outcome measure from large sample studies: Carey 2004 (N = 391) (RAPI: SD 0.62; peak BAC: SD 0.11; frequency‐quantity questionnaire: SD 3 for frequency and SD 11.3 for quantity; binge drinking self‐report questionnaire: SD 4.4; DeJong 2006 (N = 2921) (drinking norms questionnaire: SD 3.6); and Carey 2011 (typical BAC: SD 0.6).
In the original review (Moreira 2009), heterogeneity of studies was problematic, making pooling of effects across delivery modes more difficult to interpret, so no pooled effects across delivery types were calculated. In this updated review, we have pooled effects across delivery modes only for those analyses for which heterogeneity across delivery modes is not substantial (I2 < 50%).
Assessment of heterogeneity
We considered heterogeneity test results alongside a qualitative assessment of the combinability of studies in this review. Heterogeneity was regarded as problematic if I2 was substantial (≥ 50%) (Deeks 2011).
Assessment of reporting biases
We assessed publication bias by constructing funnel plots for outcomes examined by a reasonable number of trials. Plots were visually inspected and were interpreted for potential risk of publication bias (Egger 1997).
Data synthesis
When possible we combined outcome measures from individual trials through meta‐analysis (comparability of interventions and outcomes between trials) using a random‐effects model. When heterogeneity was substantial (I2 > 50%), we report the pooled result but provide a note of caution regarding interpretation of the pooled result. To include studies that met the inclusion criteria but did not present means and standard deviations in their final results, we used the generic inverse variance method. We analysed studies by follow‐up period (short‐term: up to three months; and longer‐term: four or more months) and subgrouped them by delivery mode. We tested for subgroup differences; when these were statistically significant, we pooled data within each delivery mode. If subgroup differences were not found, we pooled data across delivery modes. Our a priori hypothesis was that effectiveness would vary by delivery mode. When this hypothesis was rejected according to statistical analysis, we pooled across delivery modes.
Subgroup analysis and investigation of heterogeneity
The original review (Moreira 2009) analysed gender‐specific feedback for male and female subgroups. These analyses showed that effects for males and females were very similar, and the original review concluded that no evidence showed that gender‐specific interventions were more efficient than general social norms interventions. In this updated review, we have not analysed normative feedback by gender. As in the original review, we grouped social norms interventions into five subtypes, representing alternative delivery modes: (1) mailed feedback; (2) computer/web feedback; (3) individual face‐to‐face feedback; (4) group face‐to‐face feedback; and (5) social marketing campaign.
Sensitivity analysis
When clear and notable concerns about methods or analysis were reported in studies included in this review, we assessed the contributions of these studies to pooled effects in a sensitivity analysis by removing them from the meta‐analysis.
One study (McNally 2003) reported outcomes for a subgroup analysis of "at‐risk drinkers" after randomisation. It was not clear whether this was a planned subgroup analysis, and no stratification by subgroup was undertaken in the design of the study. Sample sizes in subgroup analyses are frequently small; subgroup analyses therefore can lack statistical power. These analyses are also subject to the multiple comparison problem, and if not stratified, a comparison is not truly randomised. We performed sensitivity analysis for group face‐to‐face feedback by excluding McNally 2003.
Concerns about differential attrition (Lovecchio 2010) led us to perform sensitivity analyses for relevant outcomes by removing this study.
'Summary of findings' tables
We have used the GRADE (Grades of Recommendation, Assessment, Development and Evaluation) method to produce a 'Summary of findings' (SoF) table for studies with longer‐term follow‐up (four or more months), as these are of greater interest when the sustainability of intervention effects is considered (Schünemann 2011). Only analyses with at least four studies in the pooled analysis are included in the SoF table.
The Grading of Recommendation, Assessment, Development and Evaluation Working Group (GRADE) developed a system for grading the quality of evidence (GRADE 2004; Guyatt 2008; Guyatt 2011; Schunemann 2006) which takes into account issues not only related to internal validity but also to external validity, such as directness of results. The 'Summary of findings' tables present the main findings of a review in a transparent and simple tabular format. In particular, they provide key information concerning the quality of evidence, the magnitude of effect of the interventions examined and the sum of available data on the main outcomes.
The GRADE system uses the following criteria for assigning grades of evidence.
-
High: further research is very unlikely to change our confidence in the estimate of effect.
-
Moderate: further research is likely to have an important impact on our confidence in the estimate of effect and may change the estimate.
-
Low: further research is very likely to have an important impact on our confidence in the estimate of effect and is likely to change the estimate.
-
Very low: any estimate of effect is very uncertain.
Grading is decreased for the following reasons.
-
Serious (‐1) or very serious (‐2) limitation to study quality.
-
Important inconsistency (‐1).
-
Some (‐1) or major (‐2) uncertainty about directness.
-
Imprecise or sparse data (‐1).
-
High probability of reporting bias (‐1).
Grading is increased for the following reasons:
-
Strong evidence of association ‐ significant relative risk of > 2 (< 0.5) based on consistent evidence from two or more observational studies, with no plausible confounders (+1).
-
Very strong evidence of association ‐ significant relative risk of > 5 (< 0.2) based on direct evidence with no major threats to validity (+2).
-
Evidence of a dose response gradient (+1).
-
All plausible confounders would have reduced the effect (+1).
Results
Description of studies
Results of the search
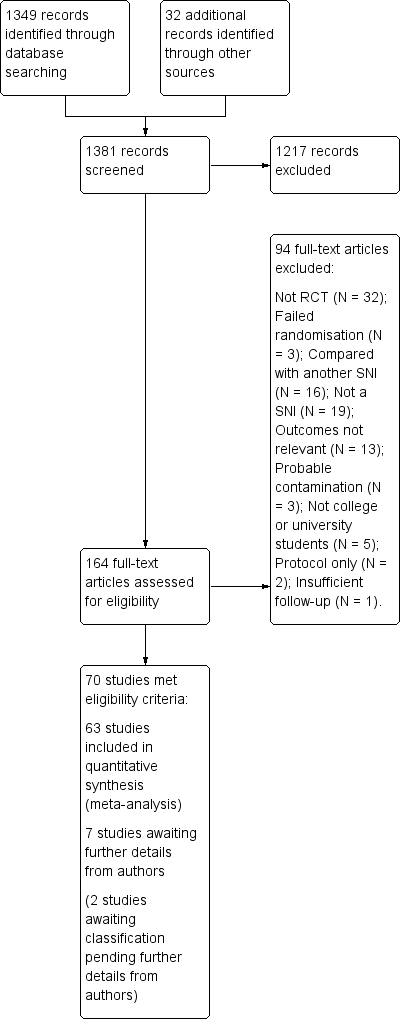
Of 1381 records identified through database searching (N = 1349) and from other sources (e.g. following up on reference lists from included studies (N = 32)), we identified 164 studies that initially appeared to meet our inclusion criteria. These studies were acquired in full text for more detailed evaluation. A total of 94 studies were excluded for a variety of reasons (see Figure 1), and 70 studies (44,958 participants) met the eligibility criteria for inclusion in this review. Two studies are awaiting classification (Croom 2009; Whiteside 2010) (see Characteristics of studies awaiting classification).

Study flow diagram.
A total of 63 studies (42,784 participants) were included in the quantitative synthesis (meta‐analysis), and seven studies (2174 participants; Amaro 2009; Bewick 2013; Bryant 2009; Neighbors 2011; Palfai 2011; Wood 2007; Wood 2010) are pending further information from study authors before they can be included in the quantitative synthesis. Two additional studies (Croom 2009; Whiteside 2010) are pending further information from study authors before they can be classified as eligible or ineligible for inclusion in this review.
One paper reported two separate trials: one with mandated students and one with voluntary students, with a separate randomised control group included for each intervention arm. Therefore for the purposes of this review and meta‐analysis, we have classified this paper as comprising two studies (Terlecki 2010 Mandated; Terlecki 2010 Voluntary).
Included studies
General characteristics of selected trials and methods used for the intervention are summarised in the Characteristics of included studies table.
Of the 70 included studies, 43 targeted students at increased risk, typically indicated by a higher score on a screening measure (N = 33 studies), a mandate to attend an intervention for violation of campus alcohol policy (N = 6 studies: Borsari 2005; Carey 2006; Carey 2011; Doumas 2009a; LaChance 2009; Terlecki 2010 Mandated), increased depression scores (N = 1 study: Geisner 2007); attendance at spring break festivities (Patrick 2014) or membership in a fraternity (N = 2 studies: Larimer 2001; Wilke 2014).
A total of 26 studies provided universal interventions and recruited from all available students: Bendtsen 2012; Bewick 2008a; Bewick 2010; Bewick 2013; Bryant 2009; Bryant 2013; Carey 2006; DeJong 2006; DeJong 2009; Doumas 2008a; Doumas 2009b; Henslee 2009; Larimer 2001; Lewis 2008; Lovecchio 2010; McNally 2003; Michael 2006; Moore 2013; Moreira 2012; Neighbors 2009; Palfai 2011; Paschall 2011; Pederson 2012; Terlecki 2010 Voluntary; Wood 2007; Wood 2010). One study was aimed at low‐risk students (Neighbors 2011).
Most (55/70) studies were conducted in the USA, with the exception of 15 studies, which were conducted in Australia (Kypri 2009; Ridout 2014), Brazil (Simão 2008), New Zealand (Kypri 2004; Kypri 2005; Kypri 2008; Kypri 2013; Kypri 2014), Sweden (Bendtsen 2012; Ekman 2011) and the United Kingdom (Bewick 2008a; Bewick 2010; Bewick 2013; Moore 2013; Moreira 2012).
Controls received no intervention (i.e. assessment only (51 studies)), brief alcohol‐relevant information (11 studies: Bryant 2013; Collins 2002; Ekman 2011; Geisner 2007; Henslee 2009; Kypri 2004; Kypri 2008; LaChance 2009; Larimer 2001; Neal 2004; Schaus 2009) or an alternative alcohol educational intervention that did not involve normative feedback (eight studies: Borsari 2005; Bryant 2009; Doumas 2008a; Doumas 2009a; Martens 2013; Murphy 2001; Patrick 2014; Werch 2000).
Interventions varied from no face‐to‐face contact session (paper or web feedback) to one or two face‐to‐face contact sessions with duration ranging from 45 minutes (Neal 2004) to 175 minutes (Michael 2006). Some studies involved a booster session after the initial intervention, providing students with personalised normative feedback at later time points (Baer 2001; Marlatt 1998; Neighbors 2010).
Seven outcomes were used in this systematic review to evaluate the effectiveness of social norms interventions that were reported by the included studies: (1) alcohol‐related problems; (2) binge drinking, reporting the frequency of heavy drinking; (3) quantity of drinking, reporting the typical number of drinks taken each day of the typical week or number of drinks taken per week in the past month; (4) frequency of drinking, reporting the number of days in the typical week or month that participants drank; (5) calculated peak BAC, reporting the maximum alcohol blood concentration during a usual drinking episode, using the formula [(number of drinks/2) * (9/weight for men or 7.5/weight for women) ‐ (0.016 * hours drinking)]; (6) calculated typical BAC, reporting the typical blood alcohol concentration during a usual drinking episode, using the formula [(number of drinks/2) * (9/weight for men or 7.5/weight for women) ‐ (0.016 * hours drinking)]; and (7) drinking norms, reporting the perceived number of drinks consumed per occasion by a typical student. No gold standard diagnostic measures of alcohol abuse or dependence were reported in any of the studies included in this review.
Follow‐up periods of included studies varied from immediate post intervention (e.g. Lewis 2008; Neal 2004; Neighbors 2009) to 12 months (e.g. Carey 2006; Carey 2011; Kypri 2008; Larimer 2001; Lewis 2007b; Moreira 2012; Schaus 2009), 24 months (Marlatt 1998; Neighbors 2010; Simão 2008), 36 months (DeJong 2006; DeJong 2009) or 48 months (Baer 2001).
Excluded studies
A total of 92 studies did not meet our inclusion criteria and are listed in the Characteristics of excluded studies table along with reasons for exclusion (also see Figure 1).
Risk of bias in included studies

Methodological quality graph: review authors' judgements about each methodological quality item presented as percentages across all included studies.

Methodological quality summary: review authors' judgements about each methodological quality item for each included study.
Allocation
All 70 studies were reported to have been randomised. Twenty‐eight studies provided adequate information on generation of the random sequence (Bendtsen 2012; Bewick 2008a; Borsari 2000; Borsari 2005; Collins 2014; Doumas 2009a; Ekman 2011; Geisner 2007; Kypri 2004; Kypri 2005; Kypri 2008; Kypri 2009; Kypri 2013; Kypri 2014; LaBrie 2013; LaChance 2009; Lewis 2014; Marlatt 1998; Martens 2013; McNally 2003; Moreira 2012; Neighbors 2010; Neighbors 2011; Pederson 2012; Ridout 2014; Schaus 2009; Turrisi 2009; Wood 2010) and were judged at low risk for this component. Two studies matched participant institutions before randomisation (DeJong 2006; DeJong 2009). All the other studies were judged at unclear risk.
Only 14 studies provided an adequate description of the allocation concealment mechanism (Bendtsen 2012; Collins 2014; Kypri 2004; Kypri 2005; Kypri 2008; Kypri 2009; Kypri 2013; Kypri 2014; Lewis 2014; Moore 2013; Moreira 2012; Pederson 2012; Schaus 2009; Walters 2009a) and were judged to be at low risk for this component. All the other studies were judged at unclear risk.
Blinding
All but one of the studies were classified as having high risk for performance bias (blinding of participants and personnel) because participants were not blinded to the intervention. In one study (Bendtsen 2012), participants were not aware that they were involved in a research study, so they can be regarded as blind to the study condition (low risk).
In 13 studies (Bendtsen 2012; Bewick 2008a; Bewick 2010; Ekman 2011; Kypri 2005; Kypri 2008; Kypri 2009; Kypri 2013; Kypri 2014; Moore 2013; Moreira 2012; Neighbors 2010; Wood 2010), outcome assessment was blinded by not informing outcome assessors of group allocation or by using remote web‐based administration of questionnaires, so risk of detection bias was low. In one study (Carey 2011), it was stated that outcome assessors were not blinded, so risk of detection bias was high. The remaining studies did not report on blinding of outcome assessors, so the risk was rated as unclear.
Incomplete outcome data
Losses to follow‐up were generally low (under 20%). Thirty‐two studies were judged at low risk for attrition bias. Three studies reported no loss to follow‐up (Borsari 2005; Michael 2006; Neal 2004) and were regarded as low risk. Three studies did not follow up on individual participants but undertook random sample surveys at intervention and control sites to assess effects of the intervention (DeJong 2006; DeJong 2009; Moore 2013). These studies were classified as having low risk of attrition bias.
Studies with attrition > 20% were regarded as high risk: 14 studies reported attrition rates of between 20% and 40% (Amaro 2009; Bewick 2008a; Butler 2009; Collins 2002; Collins 2014; Doumas 2009b; Juárez 2006; Kypri 2009; Kypri 2013; LaChance 2009; Larimer 2001; Lovecchio 2010; Schaus 2009; Walters 2007), and 11 studies attrition rates over 40% (Bendtsen 2012; Bewick 2010; Bryant 2009; Doumas 2008a; Eggleston 2008; Ekman 2011; Henslee 2009; Lau‐Barraco 2008; Lewis 2008; Moreira 2012; Wilke 2014), suggesting high risk of attrition bias.
Lovecchio 2010 reported major differences in follow‐up rates between arms of the trial: 91% follow‐up in the intervention arm compared with 68% in the control arm and was judged at high risk of bias for this domain.
Selective reporting
Most studies reported results for all outcome measures specified in the Methods sections of papers and were classified as having low risk of reporting bias. Six studies did not report all outcomes and were classified as having high risk of reporting bias (Bewick 2010; Bewick 2013; Eggleston 2008; Neighbors 2011; Palfai 2011; Walters 2009a).
Other potential sources of bias
Adjustment for cluster level effects
Of the 12 cluster‐randomised trials, three (LaChance 2009; Moore 2013; Paschall 2011) reported adequate adjustment for clustering. One (Larimer 2001) reported using an individual level co‐variate to adjust for clustering; it is not clear how appropriate this is. The other eight cluster trials did not adjust for cluster level effects (DeJong 2006; DeJong 2009; Doumas 2008a; Doumas 2009b; Henslee 2009; McNally 2003; Michael 2006; Wilke 2014).
Publication bias
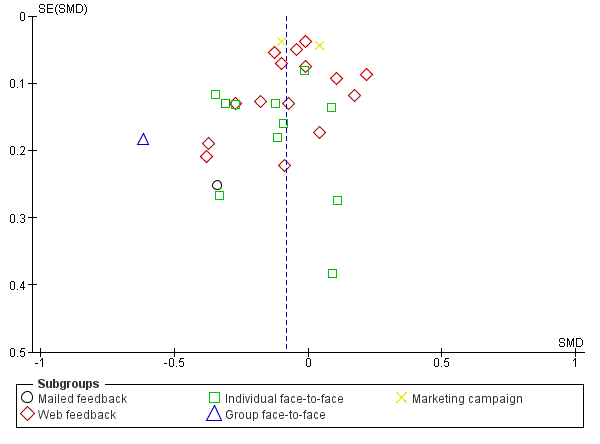
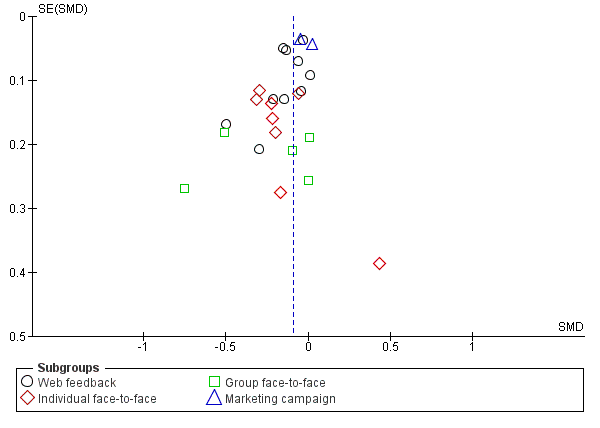
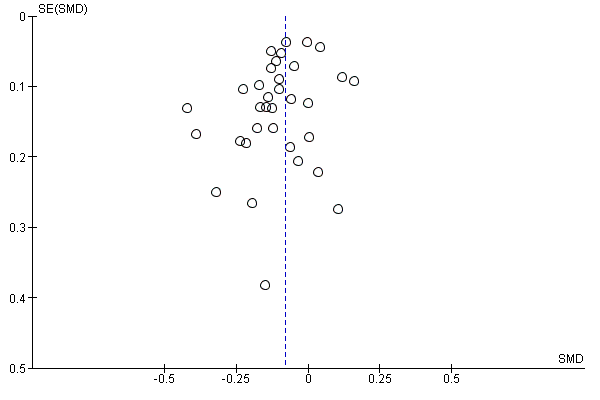
Publication bias presents a significant threat to the validity of any systematic review. Such bias appears when negative studies have a lower likelihood of being published or when outcome data from published reports are selectively neglected because of their negative outcomes. We constructed funnel plots for several outcomes when a reasonable number of trials were identified (Figure 4; Figure 5; Figure 6; Figure 7) and visually inspected the plots. In all plots, a negative SMD indicates an effect in favour of the motivational interview (MI) intervention.
Funnel plot of comparison: 1 Social norms (SN) vs control, outcome: 1.2 Alcohol‐related problems: 4+ months.

Funnel plot of comparison: 1 Social norms (SN) vs control, outcome: 1.4 Binge drinking: 4+ months.

Funnel plot of comparison: 1 Social norms (SN) vs control, outcome: 1.6 Quantity of drinking: 4+ months.
Funnel plot of comparison: 1 Social norms (SN) vs control, outcome: 1.8 Frequency: 4+ months.
Our interpretation is that many plots showed evidence of asymmetry. This suggests that risk of publication bias may be present in our results, but it is possible that other factors may have contributed to the asymmetry, for example, poorer study quality in smaller studies, or studies with different sizes including participants with different risk profiles.
In Figure 4, the main outliers are Eggleston 2008 and LaChance 2009. In Figure 5 and Figure 6, the main outlier is Eggleston 2008, and in Figure 7, the main outliers are Borsari 2000 and Eggleston 2008. Eggleston 2008 was a small sample study with substantially different numbers allocated to intervention and control, and with very high attrition. This suggests high risk of selection bias in this study. LaChance 2009 and Borsari 2000 also used small sample studies, but with no clear indication of poor quality or risk profiles that are distinctive from those of the other studies included in the analysis.
Effects of interventions
See: Summary of findings for the main comparison
Primary and secondary outcomes grouped according to delivery mode (mailed feedback, web feedback, individual face‐to‐face, group face‐to‐face, social marketing) for immediate (up to three months) and longer‐term (four months or more) follow‐up periods are presented below. See summary of findings Table for the main comparison
Alcohol‐related problems
Analysis 1.1: up to three months' follow‐up
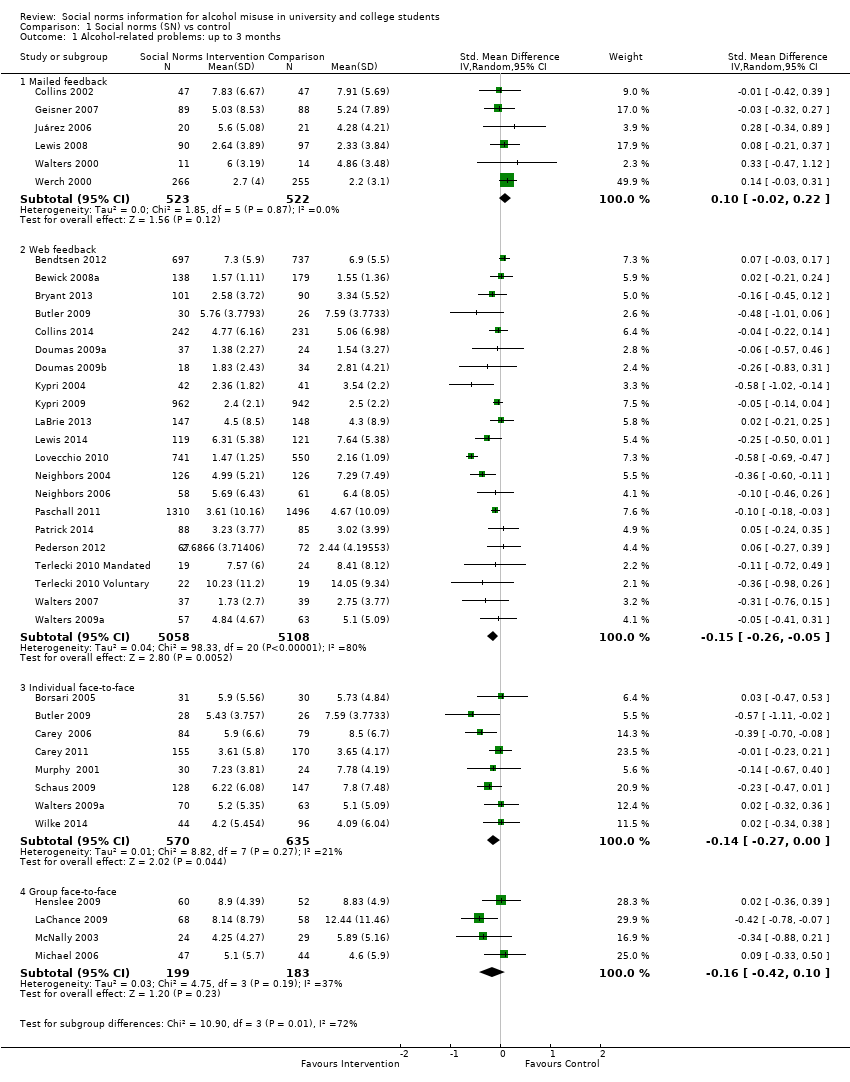
A total of 37 studies with 12,798 participants reported on alcohol‐related problems and provided data from follow‐up over three months. A test for subgroup differences (Chi² = 10.9, df = 3 (P value 0.01), I² = 72.5%) indicated differences according to delivery mode, so we report results separately for each mode.
-
For mailed feedback, no evidence of an effect was found (SMD 0.10, 95% CI ‐0.02 to 0.22; participants = 1045; studies = 6; I2 = 0%)
-
For web/computer feedback, evidence of an effect was found (SMD ‐0.15, 95% CI ‐0.26 to ‐0.05; participants = 10,166; studies = 21; I2 = 80%); this is equivalent to a reduction of 1.4 points in Rutgers Alcohol Problem Index (RAPI) score, assuming an SD of 9.17 (Martens 2013). As heterogeneity was very high, this pooled result should be interpreted with caution.
-
For individual face‐to‐face feedback, no evidence of an effect was found (SMD ‐0.14, 95% CI ‐0.27 to ‐0.00; participants = 1205; studies = 8; I2 = 21%), moderate quality evidence.
-
For group face‐to‐face feedback, no evidence suggested an effect (SMD ‐0.16, 95% CI ‐0.42 to 0.10; participants = 382; studies = 4; I2 = 37%).
When sensitivity analysis was performed for web feedback by omitting Lovecchio 2010, the effect estimate was reduced (SMD ‐0.08, 95% CI ‐0.15 to ‐0.02) and the I2 value was reduced markedly: from 80% to 32%. We performed sensitivity analysis for group face‐to‐face feedback by omitting McNally 2003, and the effect estimate changed only slightly (SMD ‐0.12, 95% CI ‐0.44 to 0.20; I2 = 53%). As heterogeneity was very high, this pooled result should be interpreted with caution.
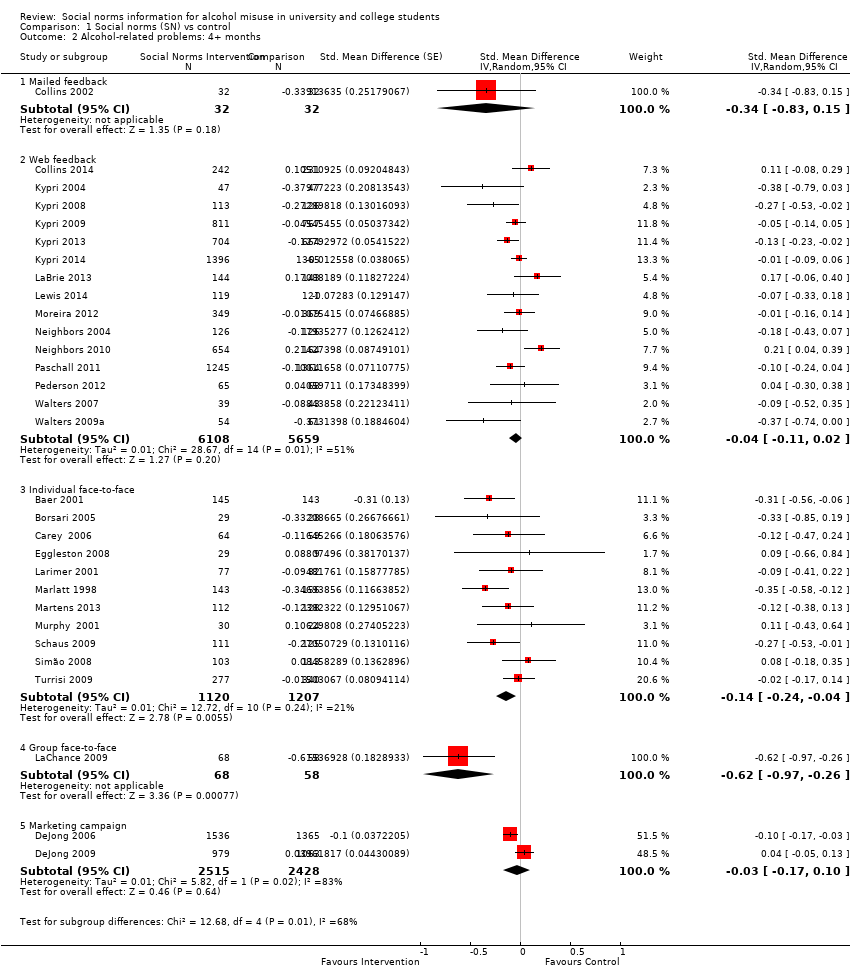
Analysis 1.2: four or more months' follow‐up
A total of 30 studies with 19,227 participants reported on alcohol‐related problems and provided data for follow‐up at four or more months. Only one study was included for each delivery mode: mailed feedback (Collins 2002) and group face‐to‐face feedback (LaChance 2009), so we do not report the pooled results here. A test for subgroup differences (Chi² = 13.34, df = 4 (P value 0.01), I² = 70.0%) showed differences according to delivery mode, so we report pooled results separately for each mode when more than one study is included.
-
For web/computer feedback, no evidence of an effect was found (SMD ‐0.04, 95% CI ‐0.11 to 0.02; participants = 11,767; studies = 15; I2 = 51%). As heterogeneity was high, this pooled result should be interpreted with caution.
-
For individual face‐to‐face feedback, evidence of an effect was noted (SMD ‐0.14, 95% CI ‐0.24 to ‐0.04; I2 = 21%); this was equivalent to a reduction of 1.4 points in RAPI score, assuming an SD of 9.17 (Carey 2004).
-
For social marketing campaigns, no evidence of an effect was found (SMD ‐0.03, 95% CI ‐0.17 to 0.10; participants = 4943; studies = 2; I2 = 83%). As heterogeneity was very high, this pooled result should be interpreted with caution.
RAPI measures the frequency of occurrence of 23 problems from "None" (scored 0) to "More than 5 times" (scored 3) to give a range of scores from 0 to 69.
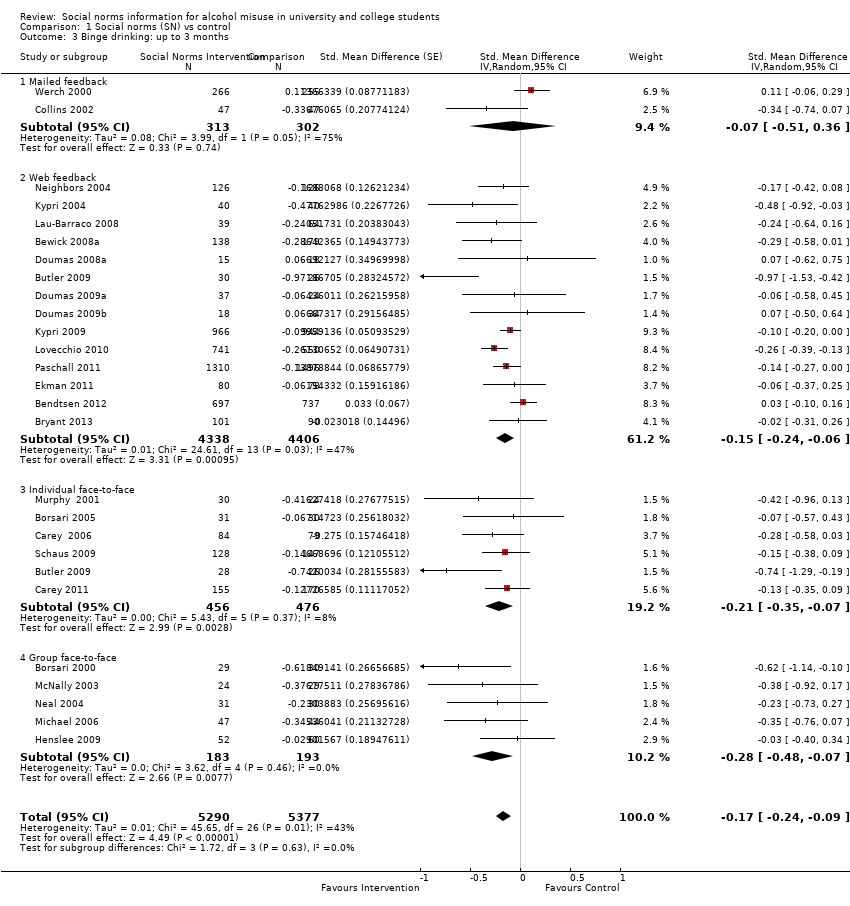
Binge drinking
Analysis 1.3: up to three months' follow‐up
A total of 26 studies with 10,667 participants reported on binge drinking and provided data for follow‐up over three months. A test for subgroup differences (Chi² = 1.72, df = 3 (P value 0.63, I2 = 0%) showed no differences according to delivery mode, so we report the pooled result across all delivery modes. Evidence of an effect was found (SMD ‐0.17, 95% CI ‐0.24 to ‐0.09; I2 = 43%); this was equivalent to a reduction of 7.4% in binge drinking in the previous month, assuming a baseline prevalence of 43.90% (Kypri 2014).
When sensitivity analysis was performed for web feedback by omitting Lovecchio 2010 and McNally 2003, the effect estimate changed only slightly (SMD ‐0.15, 95% CI ‐0.23 to ‐0.08; I2 = 40%).
Analysis 1.4: four or more months' follow‐up
A total of 16 studies with 11,292 participants reported on binge drinking and provided data for follow‐up at four or more months. A test for subgroup differences (Chi² = 0.83, df = 2 (P value 0.66), I² = 0%) showed no differences according to delivery mode, so we report the pooled result across all delivery modes. Evidence of an effect was found (SMD ‐0.06, 95% CI ‐0.11 to ‐0.02; I2 = 0%), moderate quality evidence; this was equivalent to a reduction of 2.7% in binge drinking in the previous month, assuming a baseline prevalence of 43.9% (Kypri 2014).
Quantity of drinking
Analysis 1.5: up to three months' follow‐up
A total of 45 studies with 14,184 participants reported on quantity of drinking and provided data for follow‐up over three months. A test for subgroup differences (Chi² = 7.4, df = 4 (P value 0.12), I² = 46%) showed no differences according to delivery mode, so we report the pooled result across all delivery modes. Evidence of an effect was found (SMD ‐0.14, 95% CI ‐0.19 to ‐0.09; I2 = 36%); this was equivalent to a reduction of 1.5 points in DDQ scale score, assuming an SD of 10.77 (Martens 2013).
When sensitivity analysis was performed for web feedback by omitting Lovecchio 2010 and McNally 2003, the effect estimate did not change (SMD ‐0.14, 95% CI ‐0.19 to ‐0.09; I2 = 38%).
Analysis 1.6: four or more months' follow‐up
A total of 32 studies with 21,169 participants reported on quantity of drinking and provided data for follow‐up at four or more months. A test for subgroup differences (Chi² = 4.88, df = 3 (P value 0.18), I² = 38.5%) showed no differences according to delivery mode, so we report the pooled result across all delivery modes. Evidence of an effect was found (SMD ‐0.08, 95% CI ‐0.12 to ‐0.04; I2 = 24%) moderate quality evidence; this was equivalent to a reduction of 0.9 points in DDQ scale score, assuming an SD of 10.77 (Martens 2013).
Frequency of drinking
Analysis 1.7: up to three months' follow‐up
A total of 19 studies with 7685 participants reported on frequency of drinking and provided data for follow‐up over three months. A test for subgroup differences (Chi² = 21.97, df = 3, df = 3 (P value <0.0001), I² = 86.30%) showed differences according to delivery mode, so we report results separately for each mode when more than one study was included.
-
For web/computer feedback, evidence of an effect was found (SMD ‐0.17, 95% CI ‐0.25 to ‐0.09; participants = 6385; studies = 12; I2 = 31%) moderate quality evidence; this was equivalent to a reduction of 0.3 points in DDQ scale score, assuming an SD of 1.54 (Martens 2013).
-
For individual face‐to‐face feedback, evidence of an effect was found (SMD ‐0.45, 95% CI ‐0.63 to ‐0.28; participants = 515; studies = 4; I2 = 0%); this was equivalent to a reduction of 0.7 points in DDQ scale score, assuming an SD of 1.54 (Martens 2013).
-
For group face‐to‐face feedback, no evidence of an effect was found (SMD ‐0.03, 95% CI ‐0.27 to 0.21; participants = 264; studies = 3; I2 = 0%).
Analysis 1.8: four or more months' follow‐up
A total of 25 studies with 16,785 participants reported on frequency of drinking and provided data for follow‐up at four or more months. A test for subgroup differences (Chi² = 10.64, df = 3 (P value 0.01), I² = 71.8%) showed differences according to delivery mode, so we report pooled results separately for each mode for which more than one study was included.
-
For web/computer feedback, evidence of an effect was found (SMD ‐0.11, 95% CI ‐0.17 to ‐0.04; participants = 9929; studies = 10; I2 = 37%); this was equivalent to a reduction of 0.2 points in DDQ scale score, assuming an SD of 1.54 (Martens 2013).
-
For individual face‐to‐face feedback, evidence of an effect was found (SMD ‐0.21, 95% CI ‐0.31 to ‐0.10; participants = 1464; studies = 8; I2 = 0%); this was equivalent to a reduction of 0.3 points in DDQ scale score, assuming an SD of 1.54 (Martens 2013).
-
For group face‐to‐face feedback, no evidence of an effect was found (SMD ‐0.26, 95% CI ‐0.54 to 0.02; participants = 449; studies = 5; I2 = 55%). As heterogeneity was high, this pooled result should be interpreted with caution.
-
For social marketing campaigns, no evidence of an effect was found (SMD ‐0.01, 95% CI ‐0.09 to 0.06; participants = 4943; studies = 2; I2 = 38%) .
Peak BAC
Analysis 1.9: up to three months' follow‐up
A total of 11 studies reported peak BAC with 1902 participants and provided data for follow‐up over three months. A test for subgroup differences (Chi² = 1.07, df = 2 (P value 0.58), I² = 0%) showed no differences according to delivery mode, so we report the pooled result across all delivery modes. Evidence of an effect was found (SMD ‐0.22, 95% CI ‐0.33 to ‐0.11; I2 = 26%); this was equivalent to a reduction of 0.024 in peak BAC, assuming an SD of 0.111 (Martens 2013).
Analysis 1.10: four or more months' follow‐up
A total of 11 studies reported peak BAC with 7198 participants and provided data for follow‐up at four or more months. A test for subgroup differences (Chi² = 2.49, df = 3 (P value 0.48), I² = 0%) showed no differences according to delivery mode, so we report the pooled result across all delivery modes. No clear evidence of an effect was found, so possibly only marginal (SMD ‐0.08, 95% CI ‐0.17 to 0.00; I2 = 50%).
Typical BAC
Analysis 1.11: up to three months' follow‐up
Eight studies reported typical BAC with 1336 participants and provided data for follow‐up over three months. A test for subgroup differences (Chi² = 0.80, df = 2 (P value 0.67), I² = 0%) showed no differences according to delivery mode, so we report the pooled result across all delivery modes. Evidence of an effect was found (SMD ‐0.17, 95% CI ‐0.31 to ‐0.03; I2 = 32%); this was equivalent to a reduction of 0.008 in typical BAC, assuming an SD of 0.046 (Schaus 2009).
Analysis 1.12: four or more months' follow‐up
Four studies reported typical BAC with 490 participants and provided data for follow‐up at four or more months. All four studies assessed the effects of individual face‐to‐face feedback. No evidence of an effect was found (SMD ‐0.08, 95% CI ‐0.26 to 0.10; I2 = 0%).
Drinking norms
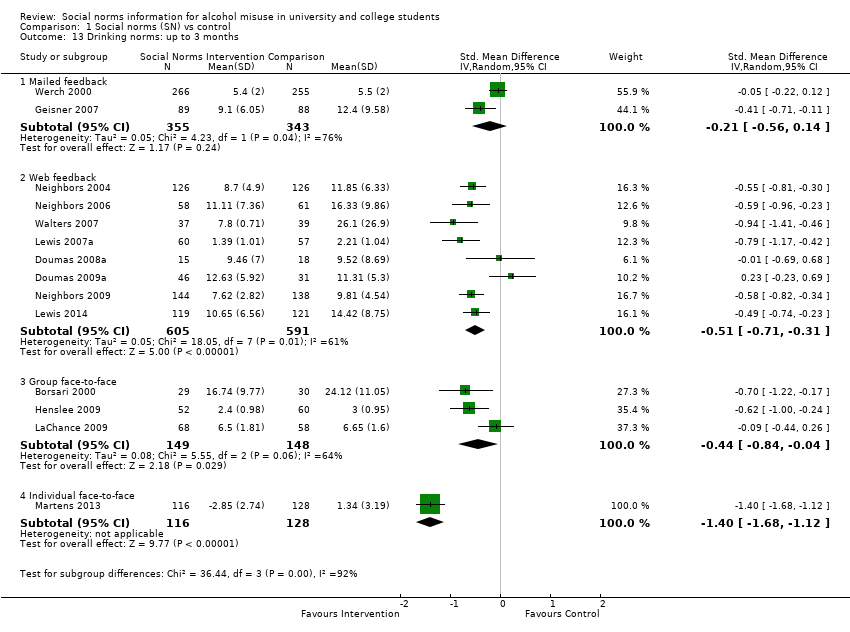
Analysis 1.13: up to three months' follow‐up
A total of 14 studies with 2435 participants reported on drinking norms and provided data for follow‐up over three months. A test for subgroup differences (Chi² = 36.44, df = 3 (P value < 0.00001), I2 = 91.8%) indicated differences according to delivery mode, so we report results separately for each mode for which more than one study was included.
-
For mailed feedback, no evidence of an effect was found (SMD ‐0.21, 95% CI ‐0.56 to 0.14; participants = 698; studies = 2; I2 = 76%). As heterogeneity was very high, this pooled result should be interpreted with caution.
-
For web/computer feedback, evidence of an effect was found (SMD ‐0.51, 95% CI ‐0.71 to ‐0.31; participants = 1196; studies = 8; I2 = 61%); this was equivalent to an improvement in perceived drinking norms of 1.8 points on the drinking norms questionnaire, assuming an SD of 3.6 (DeJong 2006). As heterogeneity was high, this pooled result should be interpreted with caution.
-
For group face‐to‐face feedback, evidence of an effect was found (SMD ‐0.44, 95% CI ‐0.84 to ‐0.04; participants = 297; studies = 3; I2 = 64%); this was equivalent to an improvement in perceived drinking norms of 1.6 points on the drinking norms questionnaire, assuming an SD of 3.6 (DeJong 2006). As heterogeneity was high, this pooled result should be interpreted with caution.
Analysis 1.14: four or more months' follow‐up
Nine studies with 7410 participants reported on drinking norms and provided data for follow‐up over four or more months. A test for subgroup differences (Chi² = 47.25, df = 2 (P value < 0.00001), I2 = 95.8%) showed differences according to delivery mode, so we report results separately for each mode for which more than one study was included.
-
For web/computer feedback, evidence of an effect was found (SMD ‐0.34, 95% CI ‐0.57 to ‐0.11; participants = 2227; studies = 6; I2 = 81%). As heterogeneity was very high, this pooled result should be interpreted with caution.
-
For marketing campaign delivery, no evidence of an effect was found (SMD ‐0.06, 95% CI ‐0.23 to 0.11; participants = 4943; studies = 2; I2 = 89%). As heterogeneity was very high, this pooled result should be interpreted with caution.
Discussion
Summary of main results
This systematic review assessed the effectiveness of social norms information interventions for prevention of alcohol misuse in university or college students. Seventy studies involving 44,958 participants were included.
Our primary outcome measure was alcohol misuse, measured as alcohol‐related problems, binge drinking or measures of quantity or frequency of consumption. We were particularly interested in evidence for sustained effects beyond the immediate short term, so we undertook separate analyses for outcomes up to three months post‐intervention and outcomes four or more months after the intervention. We undertook subgroup analysis according to mode of delivery of the intervention (mailed feedback, web/computer feedback, individual face‐to‐face feedback, group face‐to‐face feedback, campus‐wide marketing campaigns) if evidence suggested that effects varied across delivery modes.
A meta‐analysis of twelve studies showed a difference in favour of social norms information for alcohol‐related problems at four or more months for individual face‐to‐face feedback (SMD ‐0.14, 95% CI ‐0.24 to ‐0.04). No effects on alcohol‐related problems at four or more months were found for web/computer feedback or mailed feedback. In a separate meta‐analysis of 16 studies, an effect in favour of social norms information was found on binge drinking (SMD ‐0.06, 95% CI ‐0.11 to ‐0.02). Similarly, in a meta‐analysis of 32 studies, an effect in favour of social norms information was found for quantity of alcohol consumed (SMD ‐0.08, 95% CI ‐0.12 to ‐0.04) at four or more months. For the frequency of consumption outcome, evidence showed different effects according to mode of delivery. For web/computer feedback, a meta‐analysis of 10 studies showed a difference in favour of social norms information (SMD ‐0.11, 95% CI ‐0.17 to ‐0.04) at four or more months; and for individual face‐to‐face feedback, a meta‐analysis of eight studies showed a difference in favour of social norms information (SMD ‐0.21, 95% CI ‐0.31 to ‐0.10) at four or more months. No effects on frequency of consumption were found for group face‐to‐face feedback or campus‐wide marketing campaigns. In a separate meta‐analysis of 11 studies, no effect of social norms information was found for peak blood alcohol concentration (BAC). No effects were found for individual face‐to‐face feedback on typical BAC.
Our interpretation of these results is that, although we found some effects, the effect sizes were small and were unlikely to be of meaningful benefit in practice. For example, by using mean and standard deviation figures from Martens 2013 to illustrate effect size characteristics, we estimate that for alcohol‐related problems at four or more months, the SMD from the meta‐analysis of individual face‐to‐face feedback (‐0.14) will result in a decrease of 1.28 points on the alcohol problems scale score (the 69‐point RAPI scale was used by Martens 2013) from a score of about from 8.91 to 7.63. Similarly, for binge drinking at four or more months, the SMD from the meta‐analysis (‐0.07) will result in 3.1% fewer 30‐day binge drinkers when the baseline prevalence is around 44% (from Kypri 2014). For quantity of alcohol consumed at four or more months, the SMD from the meta‐analysis (‐0.08) will result in a decrease in the number of drinks consumed each week from around 13.7 drinks/wk to 12.8 drinks/wk, on average, based on figures from Martens 2013. For frequency of consumption at four or more months (web/computer feedback), the SMD from the meta‐analysis (‐0.11) will result in a fall from 2.74 drinking days/wk to 2.58 drinking days/wk, based on figures from Martens 2013. And for frequency of consumption at four or more months (individual face‐to‐face feedback), the SMD from the meta‐analysis (‐0.21) will result in a fall from 2.74 drinking days/wk to 2.42 drinking days/wk, based on figures from Martens 2013.
Overall completeness and applicability of evidence
This review found a large number of studies and participants, with social norms interventions implemented using a range of delivery modes. Sufficient studies were found for web/computer feedback and individual face‐to‐face feedback to promote confidence in the completeness of the results. Fewer studies were found for other delivery modes, so this evidence is less complete. For example, we included only three studies that assessed the effects of social norms information marketing campaigns across campuses, and these results are equivocal: one large study from the United States (USA) found an effect, whereas another large study from the USA and a smaller study from Wales found no effects.
Most of the included studies were conducted in the USA, and the rest were completed in Australia, Brazil, New Zealand, Sweden and the United Kingdom. It is not clear whether the results of this review will be applicable in other settings in which societal norms and cultural practices for alcohol are substantially different from those seen in these countries.
This review may lack generalisability because of the nature of the samples recruited into the trials. A substantial number of studies included in this review selected participants from psychology courses or delivered interventions to high‐risk students only.
Quality of the evidence
Overall, only low or moderate quality evidence was found for the effects included in our analyses. Internal validity varied markedly even though all trials were randomised. Fewer than half of the studies reported how randomisation was done, and less than a fifth of studies reported adequate allocation concealment. Only a few studies carried out blinding; this may have led to performance or detection bias. Attrition rates were unacceptable in more than a third of studies; this may limit the power of the study to detect prespecified between‐group differences or extent of applicability of study results, or both (Fewtrell 2008). Lack of adequate allocation concealment, blinding and attrition bias is associated with poor estimation of intervention effects; therefore we cannot rule out the possibility that the effects observed in this review may be exaggerated as the result of methodological limitations. To a certain extent we have considered some forms of bias in the sensitivity analysis though this should not be regarded as complete. Of particular concern in research which includes participants that are not blinded to study condition and in which outcomes are based on self‐reported behaviour, is the potential for overestimation of treatment effects. In a systematic review of the effects of blinding participants in trials with self‐reported outcomes, Hrobjartsson 2014 found that non‐blinded participants exaggerated the effect size by an average of 0.56 of a standard deviation (though with considerable variation). It is therefore a strong plausible hypothesis that the impact of non‐blinding of participants in social norms trials could fully account for any small effects found in the current review. Moreover, in a systematic review and meta‐analysis of 300 randomized trials, Petrosino 2005 looked at the impact of non‐independent researchers and found that in those trials where programme developers were also the researchers the mean effect size was 0.47, compared with 0.00 when the evaluation team were external and independent. Petrosino 2005 concluded that "studies in which evaluators were greatly influential in the design and implementation of treatment report consistently and substantially larger effect sizes than other types of evaluators". The Cochrane risk of bias approach does not include an assessment of this particular risk of bias, and it is not always clear from studies the extent to which programme evaluators were involved in developing and delivering the intervention. Therefore we cannot rule out the possibility that the effect sizes obtained in the current review may be inflated by a conflict‐of‐interest bias.
See summary of findings Table for the main comparison for the quality of evidence on the main outcomes considered.
Potential biases in the review process
We found no non‐English language studies for inclusion. Only studies written in English were included, making the review potentially vulnerable to English‐language bias, as eligible studies may have been published in other languages. Although we searched for non‐English language literature, the bibliographic databases that we searched are geared toward publications in English. We consider this to introduce low risk, as a substantial number of large trials in other languages, which we did not find in our searches, would be needed to alter the conclusions of the review.
Our arbitrary a priori distinction of short‐ and long‐term as less than four or four or more months may have affected the results. As far as we know there is no empirical, theoretical or policy evidence or criteria that should be used for identifying an appropriate cut‐point. However, in our experience policy makers and cost‐benefit analysts are interested in longer‐term rather than immediate or short‐term impacts, and in our experience four months is a fairly low threshold for defining longer‐term effects. Therefore we suggest that the distinction we have used in this review is policy‐ and practice‐relevant.
In order to pool more studies in the meta‐analysis we used Cohens d rather than Hedges g as our effect size measure. Hedges g is more robust with small samples, but its calculation would have meant several studies could not have been pooled as they did not provide results in the right format for calculating Hedges g. We checked the difference between estimates of Cohens d and Hedges g in those studies where we had sufficient information, and the estimates hardly differed (typically only by a third or fourth decimal place). Therefore, although this is a theoretical risk, in practice our approach will not have biased the calculated results.
Agreements and disagreements with other studies or reviews
Our findings are generally in agreement with those of narrative reviews conducted by other review authors. For example, Walters 2004 reported that feedback appears to change normative perceptions of drinking and may be more effective among students who drink for social reasons. Another review (Fager 2004) evaluated the effectiveness of interventions intended to reduce alcohol use in college students, and reported some empirical support for the use of interventions that incorporated normative feedback to reduce alcohol use and misuse. The review by Carey 2007 suggested that individual face‐to‐face feedback was associated with reductions in alcohol‐related problems. The review by Cronce 2010 reported significant effects of personalised normative feedback interventions. Bewick 2008b found only 10 studies for inclusion in her systematic review of web‐based normative feedback interventions, and concluded that more research was needed in the light of this insufficient evidence base.
However, our interpretation of the evidence is different because we conclude that effect sizes are too small to be of meaningful policy or practice benefit. This interpretation is consistent with that of another recent review that we have undertaken to examine the effectiveness of motivational interviewing, which sometimes incorporates normative feedback, for prevention of alcohol misuse in young adults (Foxcroft 2016). Moreover, we conclude that, at least for web/computer feedback and for individual face‐to‐face feedback, sufficient evidence is available for the findings to be robust, and we do not suggest that further trials are needed.
Study flow diagram.
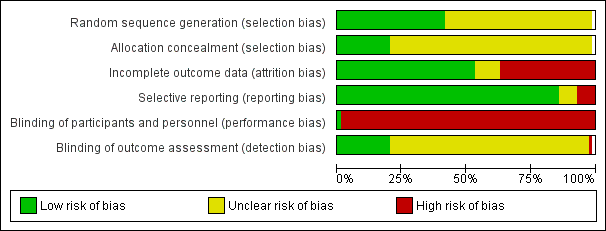
Methodological quality graph: review authors' judgements about each methodological quality item presented as percentages across all included studies.

Methodological quality summary: review authors' judgements about each methodological quality item for each included study.

Funnel plot of comparison: 1 Social norms (SN) vs control, outcome: 1.2 Alcohol‐related problems: 4+ months.

Funnel plot of comparison: 1 Social norms (SN) vs control, outcome: 1.4 Binge drinking: 4+ months.
Funnel plot of comparison: 1 Social norms (SN) vs control, outcome: 1.6 Quantity of drinking: 4+ months.

Funnel plot of comparison: 1 Social norms (SN) vs control, outcome: 1.8 Frequency: 4+ months.
Comparison 1 Social norms (SN) vs control, Outcome 1 Alcohol‐related problems: up to 3 months.
Comparison 1 Social norms (SN) vs control, Outcome 2 Alcohol‐related problems: 4+ months.
Comparison 1 Social norms (SN) vs control, Outcome 3 Binge drinking: up to 3 months.

Comparison 1 Social norms (SN) vs control, Outcome 4 Binge drinking: 4+ months.

Comparison 1 Social norms (SN) vs control, Outcome 5 Quantity of drinking: up to 3 months.

Comparison 1 Social norms (SN) vs control, Outcome 6 Quantity of drinking: 4+ months.

Comparison 1 Social norms (SN) vs control, Outcome 7 Frequency: up to 3 months.

Comparison 1 Social norms (SN) vs control, Outcome 8 Frequency: 4+ months.

Comparison 1 Social norms (SN) vs control, Outcome 9 Peak BAC: up to 3 months.

Comparison 1 Social norms (SN) vs control, Outcome 10 Peak BAC: 4+ months.

Comparison 1 Social norms (SN) vs control, Outcome 11 Typical BAC: up to 3 months.

Comparison 1 Social norms (SN) vs control, Outcome 12 Typical BAC: 4+ months.
Comparison 1 Social norms (SN) vs control, Outcome 13 Drinking norms: up to 3 months.

Comparison 1 Social norms (SN) vs control, Outcome 14 Drinking norms: 4+ months.
| Social norms information compared with controls for prevention of alcohol misuse | ||||||
| Patient or population: university or college students Settings: college or university settings Intervention: social norms information (personalised feedback or information campaigns); by delivery mode if subgroup differences were noted between different delivery modes (mailed normative feedback; web/computer feedback; individual face‐to‐face feedback; group face‐to‐face feedback) Comparison: no intervention (assessment only or alcohol information or alternative (non‐normative) intervention) Follow‐up: 4+ months Measurement: self‐reported alcohol consumption (questionnaire scale) | ||||||
| Outcomes | Illustrative comparative risks* (95% CI) | Relative effect | Number of participants | Quality of the evidence | Comments | |
| Assumed risk | Corresponding risk | |||||
| Alcohol‐related problems: 4+ months—web/computer normative feedback | Mean alcohol problems scale score was 8.91 in the control group, with a standard deviation of 9.17 (the 69‐point RAPI scale was used by Martens 2013) | The SMD from the meta‐analysis (‐0.04) will result in a decrease of 0.37 in the alcohol problems scale score (95% CI 0.18 to 1.00), from an average of 8.91 to 8.54, based on Martens 2013 | (SMD ‐0.04, 95% CI ‐0.11 to 0.02) | 11,767 (15) | ⊕⊕⊝⊝ | Limitations in design and implementation, especially blinding and in some studies high risk of attrition bias (loss to follow‐up). Borderline substantial heterogeneity (I2 = 51%) |
| Alcohol‐related problems: 4+ months—individual face‐to‐face normative feedback | Mean alcohol problems scale score was 8.91 in the control group, with a standard deviation of 9.17 (the 69‐point RAPI scale was used by Martens 2013) | The SMD from the meta‐analysis (‐0.15) will result in a decrease of 1.28 in the alcohol problems scale score (95% CI 0.37 to 2.20), from an average of 8.91 to 7.63, based on Martens 2013 | (SMD ‐0.14, 95% CI ‐0.24 to ‐0.04) | 2327 (11) | ⊕⊕⊕⊝ | Limitations in design and implementation, especially blinding and in some studies high risk of attrition bias (loss to follow‐up) |
| Binge drinking: 4+ months (all delivery modes) | 43.9% of control group participants were binge drinkers, defined as those who drink above recommended limits for acute risk (> 40 g/> 60 g ethanol on 1 occasion in the preceding 4 weeks for women and men, respectively) in a study by Kypri 2014 | The SMD from the meta‐analysis (‐0.06) will result in 2.7% fewer binge drinkers (95% CI 0.9% to 4.8%), from 43.9% to 41.2%, based on Kypri 2014 | (SMD ‐0.06, 95% CI ‐0.11 to ‐0.02) | 11,292 (16) | ⊕⊕⊕⊝ | Limitations in design and implementation, especially blinding and in some studies high risk of attrition bias (loss to follow‐up) |
| Quantity of drinking: 4+ months (all delivery modes) | Mean number of drinks per week was 13.74 in the control group, with a standard deviation of 10.77, from the DDQ measure in Martens 2013 | The SMD from the meta‐analysis (‐0.08) will result in a decrease of 0.9 drinks consumed each week (95% CI 0.4 to 1.3), from an average of 13.7 drinks per week to 12.8 drinks per week, based on Martens 2013 | (SMD ‐0.08, 95% CI ‐0.12 to ‐0.04) | 21,169 (32) | ⊕⊕⊕⊝ | Limitations in design and implementation, especially blinding and in some studies high risk of attrition bias (loss to follow‐up) |
| Frequency: 4+ months—web/computer normative feedback | Mean number of drinking days per week was 2.74 in the control group, with a standard deviation of 1.54, from the DDQ measure in Martens 2013 | The SMD from the meta‐analysis (‐0.11) will result in a decrease of 0.17 drinking days per week (95% CI 0.06 to 0.26), from an average of 2.74 drinking days per week to 2.57 drinking days per week, based on Martens 2013 | (SMD ‐0.11, 95% CI ‐0.17 to ‐0.04) | 9929 (10) | ⊕⊕⊕⊝ | Limitations in design and implementation, especially blinding and in some studies high risk of attrition bias (loss to follow‐up) |
| Frequency: 4+ months—individual face‐to‐face normative feedback | Mean number of drinking days per week was 2.74 in the control group, with a standard deviation of 1.54, from the DDQ measure in Martens 2013 | The SMD from the meta‐analysis (‐0.21) will result in a decrease of 0.32 drinking days per week (95% CI 0.15 to 0.48), from an average of 2.74 drinking days per week to 2.42 drinking days per week, based on Martens 2013 | (SMD ‐0.21, 95% CI ‐0.31 to ‐0.10) | 1464 (8) | ⊕⊕⊕⊝ | Limitations in design and implementation, especially blinding and in some studies high risk of attrition bias (loss to follow‐up) |
| Frequency: 4+ months—group face‐to‐face normative feedback | Mean number of drinking days per week was 2.74 in the control group, with a standard deviation of 1.54, from the DDQ measure in Martens 2013 | The SMD from the meta‐analysis (‐0.26) will result in a decrease of 0.40 drinking days per week (95% CI 0.03 to 0.83), from an average of 2.74 drinking days per week to 2.34 drinking days per week, based on Martens 2013 | (SMD ‐0.26, 95% CI ‐0.54 to 0.02) | 449 (5) | ⊕⊕⊝⊝ | Limitations in design and implementation, especially blinding and in some studies high risk of attrition bias (loss to follow‐up). Substantial heterogeneity (I2 = 55%) |
| Peak BAC: 4+ months (all delivery modes) | Mean peak BAC was 0.144% in the control group, with a standard deviation of 0.111, from Martens 2013 | The SMD from the meta‐analysis (‐0.08) will result in a decrease of 0.009 for peak BAC (95% CI 0.000 to 0.019), from an average of 0.144% to 0.135%, based on Martens 2013 | (SMD ‐0.08, 95% CI ‐0.17 to 0.00) | 7198 (11) | ⊕⊕⊝⊝ | Limitations in design and implementation, especially blinding and in some studies high risk of attrition bias (loss to follow‐up). Borderline substantial heterogeneity (I2 = 50%) |
| Typical BAC: 4+ months—individual face‐to‐face normative feedback | Mean typical BAC was 0.08% in the control group, with a standard deviation of 0.048, from Schaus 2009 | The SMD from the meta‐analysis (‐0.08) will result in a decrease of 0.004 for typical BAC (95% CI ‐0.005 to 0.013), from an average of 0.080% to 0.076%, based on Schaus 2009 | (SMD ‐0.08, 95% CI ‐0.26 to 0.10) | 490 (4) | ⊕⊕⊕⊝ | Limitations in design and implementation, especially blinding and in some studies high risk of attrition bias (loss to follow‐up) |
| *The basis for the assumed risk is provided in footnotes. The corresponding risk (and its 95% confidence interval) is based on the assumed risk in the comparison group and the relative effect of the intervention (and its 95% CI). | ||||||
| GRADE Working Group grades of evidence. | ||||||
| In the columns illustrating comparative risks: for outcomes where the pooled analysis point estimate and confidence interval showed some effect, we have used results (mean scores and standard deviations) from Martens 2013 to illustrate the effect sizes in terms of the measures used in that study. We chose Martens 2013 because the outcome measures they use are well‐known, generally well regarded, and are typical of the measures used in this field of research: they used the Daily Drinking Questionnaire (DDQ) and the Rutgers Alcohol Problem Index (RAPI). | ||||||
| Outcome or subgroup title | No. of studies | No. of participants | Statistical method | Effect size |
| 1 Alcohol‐related problems: up to 3 months Show forest plot | 37 | Std. Mean Difference (IV, Random, 95% CI) | Subtotals only | |
| 1.1 Mailed feedback | 6 | 1045 | Std. Mean Difference (IV, Random, 95% CI) | 0.10 [‐0.02, 0.22] |
| 1.2 Web feedback | 21 | 10166 | Std. Mean Difference (IV, Random, 95% CI) | ‐0.15 [‐0.26, ‐0.05] |
| 1.3 Individual face‐to‐face | 8 | 1205 | Std. Mean Difference (IV, Random, 95% CI) | ‐0.14 [‐0.27, ‐0.00] |
| 1.4 Group face‐to‐face | 4 | 382 | Std. Mean Difference (IV, Random, 95% CI) | ‐0.16 [‐0.42, 0.10] |
| 2 Alcohol‐related problems: 4+ months Show forest plot | 30 | Std. Mean Difference (Random, 95% CI) | Subtotals only | |
| 2.1 Mailed feedback | 1 | 64 | Std. Mean Difference (Random, 95% CI) | ‐0.34 [‐0.83, 0.15] |
| 2.2 Web feedback | 15 | 11767 | Std. Mean Difference (Random, 95% CI) | ‐0.04 [‐0.11, 0.02] |
| 2.3 Individual face‐to‐face | 11 | 2327 | Std. Mean Difference (Random, 95% CI) | ‐0.14 [‐0.24, ‐0.04] |
| 2.4 Group face‐to‐face | 1 | 126 | Std. Mean Difference (Random, 95% CI) | ‐0.62 [‐0.97, ‐0.26] |
| 2.5 Marketing campaign | 2 | 4943 | Std. Mean Difference (Random, 95% CI) | ‐0.03 [‐0.17, 0.10] |
| 3 Binge drinking: up to 3 months Show forest plot | 26 | 10667 | Std. Mean Difference (Random, 95% CI) | ‐0.17 [‐0.24, ‐0.09] |
| 3.1 Mailed feedback | 2 | 615 | Std. Mean Difference (Random, 95% CI) | ‐0.07 [‐0.51, 0.36] |
| 3.2 Web feedback | 14 | 8744 | Std. Mean Difference (Random, 95% CI) | ‐0.15 [‐0.24, ‐0.06] |
| 3.3 Individual face‐to‐face | 6 | 932 | Std. Mean Difference (Random, 95% CI) | ‐0.21 [‐0.35, ‐0.07] |
| 3.4 Group face‐to‐face | 5 | 376 | Std. Mean Difference (Random, 95% CI) | ‐0.28 [‐0.48, ‐0.07] |
| 4 Binge drinking: 4+ months Show forest plot | 16 | 11292 | Std. Mean Difference (Random, 95% CI) | ‐0.06 [‐0.11, ‐0.02] |
| 4.1 Mailed feedback | 1 | 65 | Std. Mean Difference (Random, 95% CI) | ‐0.17 [‐0.66, 0.32] |
| 4.2 Web feedback | 10 | 10719 | Std. Mean Difference (Random, 95% CI) | ‐0.07 [‐0.12, ‐0.02] |
| 4.3 Individual face‐to‐face | 5 | 508 | Std. Mean Difference (Random, 95% CI) | 0.01 [‐0.17, 0.18] |
| 5 Quantity of drinking: up to 3 months Show forest plot | 45 | 14184 | Std. Mean Difference (IV, Random, 95% CI) | ‐0.14 [‐0.19, ‐0.09] |
| 5.1 Mailed feedback | 5 | 1020 | Std. Mean Difference (IV, Random, 95% CI) | ‐0.04 [‐0.21, 0.13] |
| 5.2 Web feedback | 28 | 10889 | Std. Mean Difference (IV, Random, 95% CI) | ‐0.12 [‐0.18, ‐0.07] |
| 5.3 Individual face‐to‐face | 8 | 1309 | Std. Mean Difference (IV, Random, 95% CI) | ‐0.24 [‐0.38, ‐0.11] |
| 5.4 Group face‐to‐face | 5 | 411 | Std. Mean Difference (IV, Random, 95% CI) | ‐0.30 [‐0.49, ‐0.10] |
| 5.5 Marketing campaign | 1 | 555 | Std. Mean Difference (IV, Random, 95% CI) | ‐0.05 [‐0.22, 0.11] |
| 6 Quantity of drinking: 4+ months Show forest plot | 32 | 21169 | Std. Mean Difference (Random, 95% CI) | ‐0.08 [‐0.12, ‐0.04] |
| 6.1 Mailed feedback | 2 | 533 | Std. Mean Difference (Random, 95% CI) | ‐0.13 [‐0.32, 0.06] |
| 6.2 Web feedback | 18 | 13319 | Std. Mean Difference (Random, 95% CI) | ‐0.07 [‐0.12, ‐0.02] |
| 6.3 Individual face‐to‐face | 12 | 2374 | Std. Mean Difference (Random, 95% CI) | ‐0.15 [‐0.23, ‐0.08] |
| 6.4 Marketing campaign | 2 | 4943 | Std. Mean Difference (Random, 95% CI) | ‐0.02 [‐0.13, 0.09] |
| 7 Frequency: up to 3 months Show forest plot | 19 | Std. Mean Difference (IV, Random, 95% CI) | Subtotals only | |
| 7.1 Mailed feedback | 1 | 521 | Std. Mean Difference (IV, Random, 95% CI) | 0.12 [‐0.05, 0.29] |
| 7.2 Web feedback | 12 | 6385 | Std. Mean Difference (IV, Random, 95% CI) | ‐0.17 [‐0.25, ‐0.09] |
| 7.3 Individual face‐to‐face | 4 | 515 | Std. Mean Difference (IV, Random, 95% CI) | ‐0.45 [‐0.63, ‐0.28] |
| 7.4 Group face‐to‐face | 3 | 264 | Std. Mean Difference (IV, Random, 95% CI) | ‐0.03 [‐0.27, 0.21] |
| 8 Frequency: 4+ months Show forest plot | 25 | Std. Mean Difference (Random, 95% CI) | Subtotals only | |
| 8.1 Web feedback | 10 | 9929 | Std. Mean Difference (Random, 95% CI) | ‐0.11 [‐0.17, ‐0.04] |
| 8.2 Individual face‐to‐face | 8 | 1464 | Std. Mean Difference (Random, 95% CI) | ‐0.21 [‐0.31, ‐0.10] |
| 8.3 Group face‐to‐face | 5 | 449 | Std. Mean Difference (Random, 95% CI) | ‐0.26 [‐0.54, 0.02] |
| 8.4 Marketing campaign | 2 | 4943 | Std. Mean Difference (Random, 95% CI) | ‐0.01 [‐0.09, 0.06] |
| 9 Peak BAC: up to 3 months Show forest plot | 11 | 1902 | Std. Mean Difference (IV, Random, 95% CI) | ‐0.22 [‐0.33, ‐0.11] |
| 9.1 Mailed feedback | 1 | 94 | Std. Mean Difference (IV, Random, 95% CI) | ‐0.20 [‐0.60, 0.21] |
| 9.2 Web feedback | 4 | 477 | Std. Mean Difference (IV, Random, 95% CI) | ‐0.13 [‐0.35, 0.09] |
| 9.3 Individual face‐to‐face | 7 | 1331 | Std. Mean Difference (IV, Random, 95% CI) | ‐0.26 [‐0.39, ‐0.13] |
| 10 Peak BAC: 4+ months Show forest plot | 11 | 7198 | Std. Mean Difference (IV, Random, 95% CI) | ‐0.08 [‐0.17, 0.00] |
| 10.1 Mailed feedback | 1 | 468 | Std. Mean Difference (IV, Random, 95% CI) | ‐0.13 [‐0.33, 0.08] |
| 10.2 Web feedback | 3 | 355 | Std. Mean Difference (IV, Random, 95% CI) | ‐0.08 [‐0.29, 0.13] |
| 10.3 Individual face‐to‐face | 7 | 1432 | Std. Mean Difference (IV, Random, 95% CI) | ‐0.16 [‐0.26, ‐0.05] |
| 10.4 Marketing campaign | 2 | 4943 | Std. Mean Difference (IV, Random, 95% CI) | 0.02 [‐0.18, 0.21] |
| 11 Typical BAC: up to 3 months Show forest plot | 8 | 1336 | Std. Mean Difference (IV, Random, 95% CI) | ‐0.17 [‐0.31, ‐0.03] |
| 11.1 Mailed feedback | 3 | 253 | Std. Mean Difference (IV, Random, 95% CI) | ‐0.10 [‐0.35, 0.15] |
| 11.2 Web feedback | 1 | 282 | Std. Mean Difference (IV, Random, 95% CI) | ‐0.25 [‐0.48, ‐0.01] |
| 11.3 Individual face‐to‐face | 4 | 801 | Std. Mean Difference (IV, Random, 95% CI) | ‐0.14 [‐0.40, 0.12] |
| 12 Typical BAC: 4+ months Show forest plot | 4 | Std. Mean Difference (IV, Random, 95% CI) | Subtotals only | |
| 12.1 Individual face‐to‐face | 4 | 490 | Std. Mean Difference (IV, Random, 95% CI) | ‐0.08 [‐0.26, 0.10] |
| 13 Drinking norms: up to 3 months Show forest plot | 14 | Std. Mean Difference (IV, Random, 95% CI) | Subtotals only | |
| 13.1 Mailed feedback | 2 | 698 | Std. Mean Difference (IV, Random, 95% CI) | ‐0.21 [‐0.56, 0.14] |
| 13.2 Web feedback | 8 | 1196 | Std. Mean Difference (IV, Random, 95% CI) | ‐0.51 [‐0.71, ‐0.31] |
| 13.3 Group face‐to‐face | 3 | 297 | Std. Mean Difference (IV, Random, 95% CI) | ‐0.44 [‐0.84, ‐0.04] |
| 13.4 Individual face‐to‐face | 1 | 244 | Std. Mean Difference (IV, Random, 95% CI) | ‐1.40 [‐1.68, ‐1.12] |
| 14 Drinking norms: 4+ months Show forest plot | 9 | Std. Mean Difference (Random, 95% CI) | Subtotals only | |
| 14.1 Web feedback | 6 | 2227 | Std. Mean Difference (Random, 95% CI) | ‐0.34 [‐0.57, ‐0.11] |
| 14.2 Individual face‐to‐face | 1 | 240 | Std. Mean Difference (Random, 95% CI) | ‐1.19 [‐1.47, ‐0.92] |
| 14.3 Marketing campaign | 2 | 4943 | Std. Mean Difference (Random, 95% CI) | ‐0.06 [‐0.23, 0.11] |