Contenido relacionado
Revisiones y protocolos relacionados
Bianca Hemmingsen, David P Sonne, Maria‐Inti Metzendorf, Bernd Richter | 10 mayo 2017
Filip Gnesin, Anne Cathrine Baun Thuesen, Lise Katrine Aronsen Kähler, Sten Madsbad, Bianca Hemmingsen | 5 junio 2020
Shaun Wen Huey Lee, Won Sun Chen, Renukha Sellappans, Shakirah Binti Md.Sharif, Maria-Inti Metzendorf, Nai Ming Lai | 12 julio 2023
Clement Loa, Tadashi Toyamaa, Megumi Oshima, Min Jun, Ken L Chin, Carmel M Hawley, Sophia Zoungas | 30 julio 2020
Floris A Van de Laar, Peter LBJ Lucassen, Reinier P Akkermans, Eloy H Van de Lisdonk, Guy EHM Rutten, Chris Van Weel | 20 abril 2005
Suzanne VL Moelands, Peter LBJ Lucassen, Reinier P Akkermans, Wim JC De Grauw, Floris A Van de Laar | 28 diciembre 2018
Nyoli Valentine, Floris A Van de Laar, Mieke L van Driel | 14 noviembre 2012
Corri Black, Peter Donnelly, Linda McIntyre, Pamela Royle, Jonathan J Shepherd, Sian Thomas | 18 abril 2007
Birgit Fullerton, Andrea Siebenhofer, Klaus Jeitler, Karl Horvath, Thomas Semlitsch, Andrea Berghold, Ferdinand M Gerlach | 17 diciembre 2018
Cheow Peng Ooi, Seng Cheong Loke | 12 diciembre 2012
Respuestas clínicas Cochrane
Elie Mulhem | 2 enero 2013


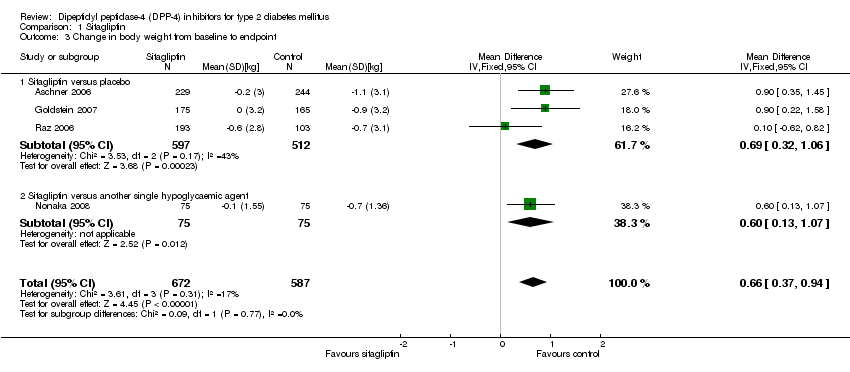
![Comparison 1 Sitagliptin, Outcome 2 Adverse events [n].](/es/cdsr/doi/10.1002/14651858.CD006739.pub2/media/CDSR/CD006739/image_n/nCD006739-CMP-001-02.png)

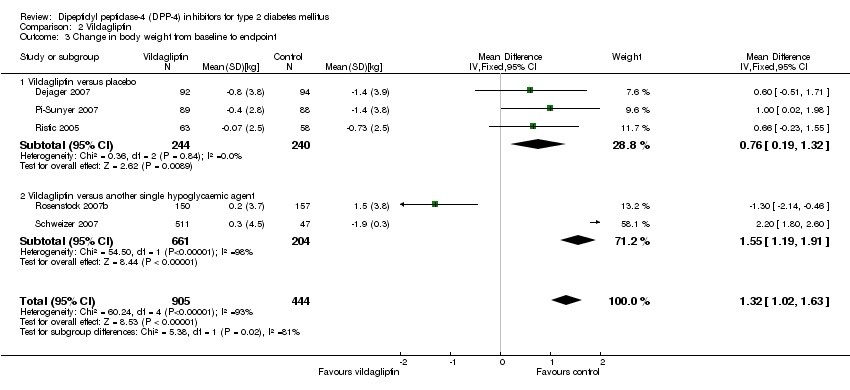
![Comparison 2 Vildagliptin, Outcome 2 Adverse events [n].](/es/cdsr/doi/10.1002/14651858.CD006739.pub2/media/CDSR/CD006739/image_n/nCD006739-CMP-002-02.png)