| 1 Pain: VAS (0: no pain to 10: worst pain) at end of treatment Show forest plot | 4 | 161 | Mean Difference (IV, Random, 95% CI) | ‐0.15 [‐1.15, 0.85] |
|
| 1.1 No exercise co‐intervention | 2 | 62 | Mean Difference (IV, Random, 95% CI) | ‐0.10 [‐0.91, 0.72] |
| 1.2 Same exercises given to all participants | 3 | 99 | Mean Difference (IV, Random, 95% CI) | ‐0.16 [‐1.67, 1.34] |
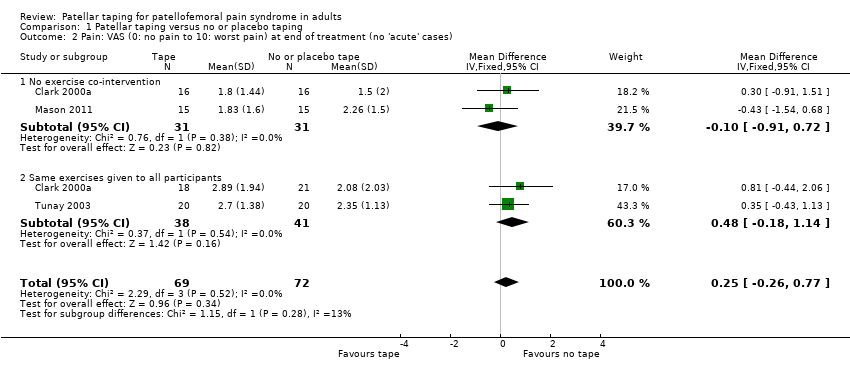
| 2 Pain: VAS (0: no pain to 10: worst pain) at end of treatment (no 'acute' cases) Show forest plot | 3 | 141 | Mean Difference (IV, Fixed, 95% CI) | 0.25 [‐0.26, 0.77] |
|
| 2.1 No exercise co‐intervention | 2 | 62 | Mean Difference (IV, Fixed, 95% CI) | ‐0.10 [‐0.91, 0.72] |
| 2.2 Same exercises given to all participants | 2 | 79 | Mean Difference (IV, Fixed, 95% CI) | 0.48 [‐0.18, 1.14] |
| 3 Pain: VAS (0: no pain to 10: worst pain) at 12 months Show forest plot | 1 | | Mean Difference (IV, Fixed, 95% CI) | Totals not selected |
|
| 3.1 No exercise co‐intervention | 1 | | Mean Difference (IV, Fixed, 95% CI) | 0.0 [0.0, 0.0] |
| 3.2 Same exercises given to all participants | 1 | | Mean Difference (IV, Fixed, 95% CI) | 0.0 [0.0, 0.0] |
| 4 Functional index questionnaire (FIQ) score (16 = no problems) at end of treatment Show forest plot | 1 | | Mean Difference (IV, Fixed, 95% CI) | Totals not selected |
|
| 4.1 No exercise co‐intervention | 0 | | Mean Difference (IV, Fixed, 95% CI) | 0.0 [0.0, 0.0] |
| 4.2 Same exercises given to all participants | 1 | | Mean Difference (IV, Fixed, 95% CI) | 0.0 [0.0, 0.0] |
| 5 Cincinnati knee activity score (100 = full activity) at end of treatment Show forest plot | 1 | | Mean Difference (IV, Fixed, 95% CI) | Totals not selected |
|
| 5.1 No exercise co‐intervention | 0 | | Mean Difference (IV, Fixed, 95% CI) | 0.0 [0.0, 0.0] |
| 5.2 Same exercises given to all participants | 1 | | Mean Difference (IV, Fixed, 95% CI) | 0.0 [0.0, 0.0] |
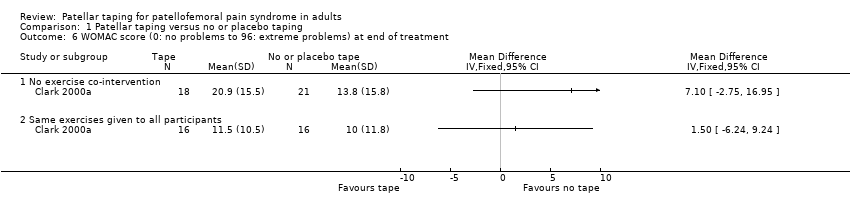
| 6 WOMAC score (0: no problems to 96: extreme problems) at end of treatment Show forest plot | 1 | | Mean Difference (IV, Fixed, 95% CI) | Totals not selected |
|
| 6.1 No exercise co‐intervention | 1 | | Mean Difference (IV, Fixed, 95% CI) | 0.0 [0.0, 0.0] |
| 6.2 Same exercises given to all participants | 1 | | Mean Difference (IV, Fixed, 95% CI) | 0.0 [0.0, 0.0] |
| 7 WOMAC score (0: no problems to 96: extreme problems) at 12 months Show forest plot | 1 | | Mean Difference (IV, Fixed, 95% CI) | Totals not selected |
|
| 7.1 No exercise co‐intervention | 1 | | Mean Difference (IV, Fixed, 95% CI) | 0.0 [0.0, 0.0] |
| 7.2 Same exercises given to all participants | 1 | | Mean Difference (IV, Fixed, 95% CI) | 0.0 [0.0, 0.0] |
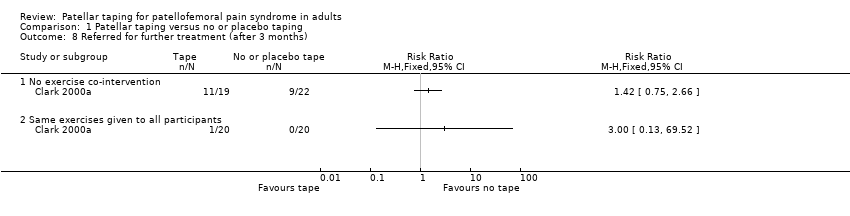
| 8 Referred for further treatment (after 3 months) Show forest plot | 1 | | Risk Ratio (M‐H, Fixed, 95% CI) | Totals not selected |
|
| 8.1 No exercise co‐intervention | 1 | | Risk Ratio (M‐H, Fixed, 95% CI) | 0.0 [0.0, 0.0] |
| 8.2 Same exercises given to all participants | 1 | | Risk Ratio (M‐H, Fixed, 95% CI) | 0.0 [0.0, 0.0] |
| 9 Further course of physiotherapy (after 3 months) Show forest plot | 1 | | Risk Ratio (M‐H, Fixed, 95% CI) | Totals not selected |
|
| 9.1 No exercise co‐intervention | 1 | | Risk Ratio (M‐H, Fixed, 95% CI) | 0.0 [0.0, 0.0] |
| 9.2 Same exercises given to all participants | 1 | | Risk Ratio (M‐H, Fixed, 95% CI) | 0.0 [0.0, 0.0] |