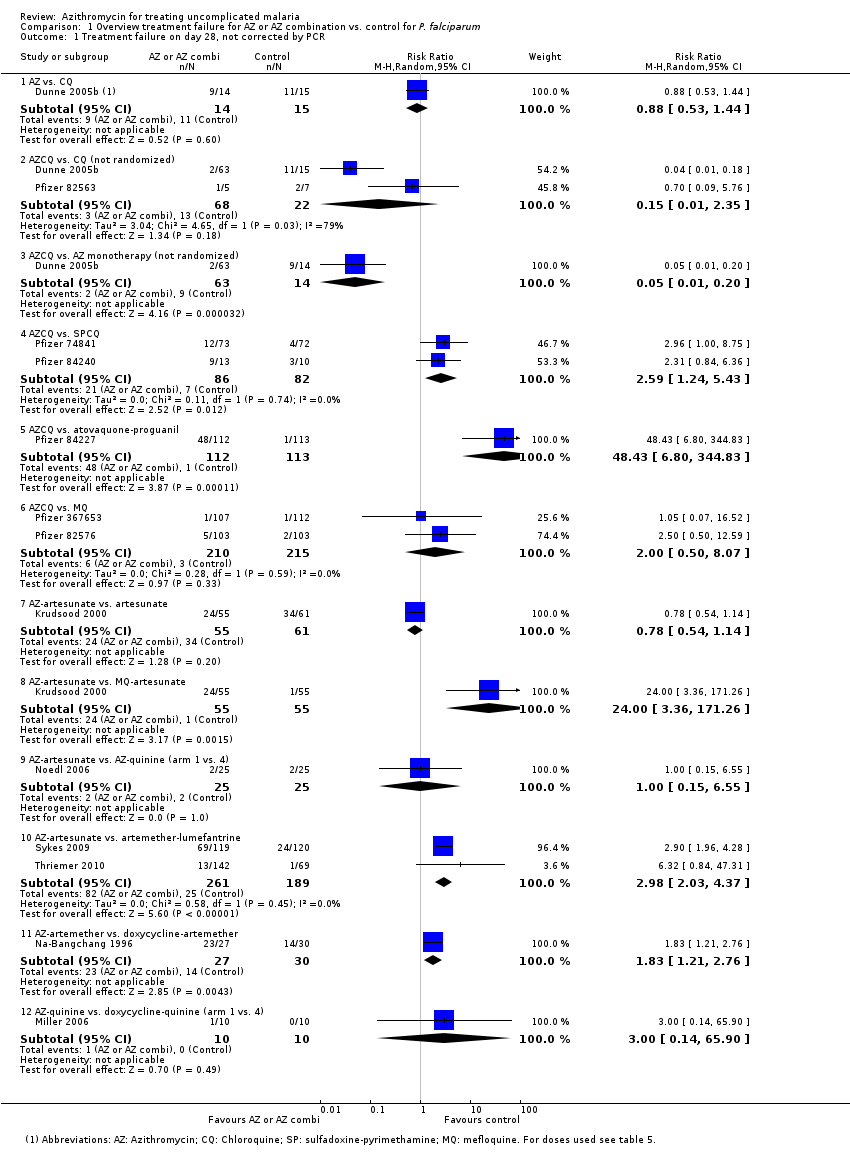
| 1 Treatment failure on day 28, not corrected by PCR Show forest plot | 13 | | Risk Ratio (M‐H, Random, 95% CI) | Subtotals only |
|
| 1.1 AZ vs. CQ | 1 | 29 | Risk Ratio (M‐H, Random, 95% CI) | 0.88 [0.53, 1.44] |
| 1.2 AZCQ vs. CQ (not randomized) | 2 | 90 | Risk Ratio (M‐H, Random, 95% CI) | 0.15 [0.01, 2.35] |
| 1.3 AZCQ vs. AZ monotherapy (not randomized) | 1 | 77 | Risk Ratio (M‐H, Random, 95% CI) | 0.05 [0.01, 0.20] |
| 1.4 AZCQ vs. SPCQ | 2 | 168 | Risk Ratio (M‐H, Random, 95% CI) | 2.59 [1.24, 5.43] |
| 1.5 AZCQ vs. atovaquone‐proguanil | 1 | 225 | Risk Ratio (M‐H, Random, 95% CI) | 48.43 [6.80, 344.83] |
| 1.6 AZCQ vs. MQ | 2 | 425 | Risk Ratio (M‐H, Random, 95% CI) | 2.00 [0.50, 8.07] |
| 1.7 AZ‐artesunate vs. artesunate | 1 | 116 | Risk Ratio (M‐H, Random, 95% CI) | 0.78 [0.54, 1.14] |
| 1.8 AZ‐artesunate vs. MQ‐artesunate | 1 | 110 | Risk Ratio (M‐H, Random, 95% CI) | 24.00 [3.36, 171.26] |
| 1.9 AZ‐artesunate vs. AZ‐quinine (arm 1 vs. 4) | 1 | 50 | Risk Ratio (M‐H, Random, 95% CI) | 1.0 [0.15, 6.55] |
| 1.10 AZ‐artesunate vs. artemether‐lumefantrine | 2 | 450 | Risk Ratio (M‐H, Random, 95% CI) | 2.98 [2.03, 4.37] |
| 1.11 AZ‐artemether vs. doxycycline‐artemether | 1 | 57 | Risk Ratio (M‐H, Random, 95% CI) | 1.83 [1.21, 2.76] |
| 1.12 AZ‐quinine vs. doxycycline‐quinine (arm 1 vs. 4) | 1 | 20 | Risk Ratio (M‐H, Random, 95% CI) | 3.0 [0.14, 65.90] |
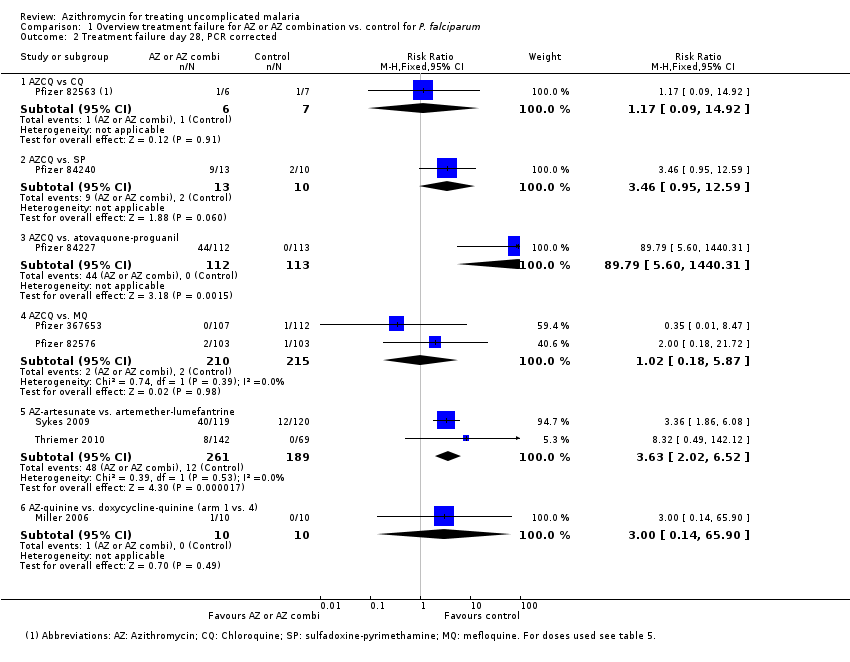
| 2 Treatment failure day 28, PCR corrected Show forest plot | 8 | | Risk Ratio (M‐H, Fixed, 95% CI) | Subtotals only |
|
| 2.1 AZCQ vs CQ | 1 | 13 | Risk Ratio (M‐H, Fixed, 95% CI) | 1.17 [0.09, 14.92] |
| 2.2 AZCQ vs. SP | 1 | 23 | Risk Ratio (M‐H, Fixed, 95% CI) | 3.46 [0.95, 12.59] |
| 2.3 AZCQ vs. atovaquone‐proguanil | 1 | 225 | Risk Ratio (M‐H, Fixed, 95% CI) | 89.79 [5.60, 1440.31] |
| 2.4 AZCQ vs. MQ | 2 | 425 | Risk Ratio (M‐H, Fixed, 95% CI) | 1.02 [0.18, 5.87] |
| 2.5 AZ‐artesunate vs. artemether‐lumefantrine | 2 | 450 | Risk Ratio (M‐H, Fixed, 95% CI) | 3.63 [2.02, 6.52] |
| 2.6 AZ‐quinine vs. doxycycline‐quinine (arm 1 vs. 4) | 1 | 20 | Risk Ratio (M‐H, Fixed, 95% CI) | 3.0 [0.14, 65.90] |
| 3 Treatment failure on day 42, not corrected by PCR Show forest plot | 2 | 445 | Risk Ratio (M‐H, Fixed, 95% CI) | 1.90 [1.44, 2.49] |
|
| 3.1 AZ‐artesunate vs. artemether‐lumefantrine | 2 | 445 | Risk Ratio (M‐H, Fixed, 95% CI) | 1.90 [1.44, 2.49] |
| 4 Treatment failure on day 42, (partially) corrected by PCR Show forest plot | 2 | 445 | Risk Ratio (M‐H, Fixed, 95% CI) | 2.47 [1.53, 3.99] |
|
| 4.1 AZ‐artesunate vs. artemether‐lumefantrine | 2 | 445 | Risk Ratio (M‐H, Fixed, 95% CI) | 2.47 [1.53, 3.99] |