肺复张在患有急性呼吸窘迫综合征并接受机械通气的成人中的管理
Abstract
研究背景
肺复张在器械通气过程中涉及短暂提高气道压力,以打开(恢复健康)折叠的肺单位和增加参与潮汐通气的肺泡数量。肺复张通常用于重症监护中患有急性呼吸窘迫综合征(ARDS)的患者,但还未能证实这种治疗方法对临床结果的影响。本系统综述是2009年发表的Cochrane综述的更新。
研究目的
我们的主要目的是确定肺复张对成人急性呼吸窘迫综合征死亡率的影响。
我们的次要目的是在相同的人群中,确定肺复张对氧化和不良事件(如气压创伤率)的影响。
检索策略
对于本次更新的综述,我们检索了Cochrane对照试验中心注册库(Cochrane Central Register of Controlled Trials, CENTRAL),MEDLINE,Embase,护理和相关健康文献(CINAHL,EBSCO),拉丁美洲和加勒比健康科学(LILACS)和国际标准随机对照试验编号(ISRCTN)的累积指数,从建库时间到2016年8月。
标准/纳入排除标准
我们纳入了诊断为ARDS的成人患者使用器械通气的随机对照试验(RCTs),这些试验比较了肺复张与标准治疗。
数据收集与分析
两位综述作者独立评估了试验质量并提取了资料。我们还联系了原作者来获取更多的信息。
主要结果
10个试验符合本综述的纳入标准(n = 1658名参与者)。我们发现有5个试验的偏倚风险低,5个试验的偏倚风险中等。其中六项试验使用肺复张作为打开肺通气方法的一部分,这些方法除去肺复张的其他方法与对照组(如通气方式、较高的呼气末正压(PEEP)滴定和较低的潮气量或高原压力)不同。有六项研究报告了死亡率结局。五个试验(受试者1370人)的汇集数据显示可以减少重症监护室(ICU)死亡率(风险比(RR) 0.83, 95%可信区间(CI) [0.72 , 0.97], P = 0.02,低质量的证据);汇集了五个试验(受试者1450)的数据显示28天死亡率这项数据没有区别(RR=0.86,95%CI [0.74, 1.01],P = 0.06,低质量的证据)和汇集了四个试验(受试者1313)的数据显示住院死亡率没有区别(RR=0.88,95%CI [0.77, 1.01],P = 0.07,低质量证据)。数据显示遭受气压伤的方面,没有风险差异(RR=1.09, 95% CI [0.78, 1.53],P = 0.60, 7项研究,1508名受试者,中等质量证据)。
作者结论
在纳入的10项试验中,我们发现了显著的临床异质性。结果是基于几个(五)试验的结果,包括一个“肺通气策略”,即干预组与对照组在除了肺复张(包括共同干预措施,如更高的呼气末正压通气,不同的通风方式和更高的稳定压力)的其他方面使解释结果变的困难。在不增加气压伤风险的情况下,对ARDS患者采用包括肺复张的通气策略,可以降低重症监护病人的死亡率,但对28天死亡率和住院死亡率没有影响。我们将证据的质量降至低级,因为大多数纳入的试验将肺通气治疗方法做为联合治疗的一部分,这可能影响了结果。
PICO
Plain language summary
肺复张作为因肺损伤导致急性呼吸窘迫综合症成人患者的通气方法
研究背景:成年人因急性呼吸衰竭进入重症监护病房(ICUs),这在全世界都是常见情况。很多因素可以造成呼吸衰竭,它可能是被称为急性呼吸窘迫综合征(ARDS)造成的。这一术语描述的是由于各种原因造成的肺部损伤和发炎,它们不能正常地为身体提供氧气和清除二氧化碳。这导致了血液中氧气减少。病人可能需要呼吸机来辅助呼吸。这种疗法被称为器械通气。器械通气辅助治疗是ARDS标准治疗的重要支柱。
尽管器械通气能挽救生命,但它也可能通过使肺扩张、收缩或使肺组织过度扩张而进一步造成肺损伤。为了最大限度地减少对肺部的损伤,使用低压、较弱的空气流以及呼气末正压通气(PEEP)。这种通气方法已被证明可以缩短患者需要使用通气器械的时间,同时提高生存率;它已被用于重症监护的ARDS患者的标准护理方法。
随着这一治疗方法的实施,还研究了其他通气方法。其中一项技术被称为肺复张;当与较高PEEP相结合时,被称为开放肺通气策略。肺复张通过持续的深呼吸来帮助复张或重新打开折叠的肺部。这能增加可供呼吸的肺部大小,并能改善患者的结局指标。肺复张效果尚未确定。
检索日期 证据截止到2016年8月。
研究特征: 我们在本综述中纳入了10个试验,共1658名患有急性呼吸窘迫综合征的受试者。
主要结果:低质量的证据表明,肺复张方法提高了ICU的存活率,但不能提高28天内或医院的存活率。肺复张对肺部漏气的风险没有影响。
证据质量: 我们发现大多数结果的证据都是低质量或中等质量的,主要是因为纳入研究的试验设计。许多试验将肺复张与其他通气技术或治疗方法结合使用,这可能会影响结果。总结单独使用肺复张的有效性时,应谨慎行事。
Authors' conclusions
Summary of findings
| Recruitment manoeuvres compared with standard care for adults with acute respiratory distress syndrome who were mechanically ventilated | ||||||
| Patient or population: mechanically ventilated adults with acute respiratory distress syndrome. Participants were recruited from ICUs internationally, including Australia, Brazil, China, Europe, Canada, Korea, Seoul, Taiwan and the United States. Settings: intensive care unit Intervention: recruitment manoeuvres Comparison: standard care | ||||||
| Outcomes | Illustrative comparative risks* (95% CI) | Relative effect | Number of participants | Quality of the evidence | Comments | |
| Assumed risk | Corresponding risk | |||||
| Control | Intervention | |||||
| 28‐Day mortality | Risk for the population | RR 0.86 (0.74 to 1.01) | 1450 | ⊕⊕⊝⊝ | Four of the 5 trials include co‐interventions that may influence the result of the outcome. | |
| 347 per 1000 | 294 per 1000 | |||||
| ICU mortality | Risk for the population | RR 0.83 (0.72 to 0.97) | 1370 | ⊕⊕⊝⊝ | Four of the 5 trials include co‐interventions that may influence the result of the outcome. | |
| 362 per 1000 | 303 per 1000 | |||||
| In‐hospital mortality | Risk for the population | RR 0.88 (0.77 to 1.01) | 1313 | ⊕⊕⊝⊝ | Three of the 4 trials include co‐interventions that may influence the result of the outcome. | |
| 405 per 1000 | 356 per 1000 | |||||
| Rate of barotrauma | Risk for the population | RR 1.09 (0.78 to 1.51) | 1508 | ⊕⊕⊕⊝ | ||
| 90 per 1000 | 86 per 1000 | |||||
| *The basis for the assumed risk (e.g. median control group risk across studies) is provided in footnotes. The corresponding risk (and its 95% confidence interval) is based on the assumed risk in the comparison group and the relative effect of the intervention (and its 95% CI). | ||||||
| GRADE Working Group grades of evidence | ||||||
| aLung recruitment manoeuvres were used with co‐interventions that may affect the result of the outcome (Hodgson 2011; Meade 2008; Huh 2009; Kacmarek 2016; Liu 2011). We downgraded the quality of the evidence by two levels for indirectness of evidence. We made this decision a priori. bWe noted no heterogeneity among trial effect estimates but observed that reported confidence intervals around effect estimates were wide. We downgraded the quality of the evidence by one level for imprecision in results. | ||||||
Background
Description of the condition
Acute respiratory distress syndrome (ARDS) is an inflammatory condition of the lung parenchyma that causes impaired gas exchange (ARDS Definition Task Force 2012). According to the Berlin definition, each stage of mild, moderate and severe ARDS are associated with increasing mortality (ARDS Definition Task Force 2012). Patients with ARDS present with bilateral lung infiltrates on chest radiograph and hypoxaemia with concomitant systemic inflammatory mediator release, frequently causing multiple organ failure and death (Gattinoni 2006). In a recent international, multi‐centre observational study, ARDS accounted for 10.4% of all intensive care unit (ICU) beds, with a mortality rate of 34.9% for mild ARDS, 40.3% for moderate ARDS and 46.1% for severe ARDS (Bellani et al, 2016).
Description of the intervention
Patients with ARDS in the ICU may require mechanical ventilation to survive (Amato 1998; ARDS Definition Task Force 2012; Sevransky 2004). However, mechanical ventilation can injure lungs through alveolar distension, cyclical collapse and reopening of alveolar units and failure to expand collapsed alveolar units (Gattinoni 2006). To minimize damage to injured lungs, small ventilatory tidal volumes and low plateau pressures have been used. Additionally, higher positive end‐expiratory pressure (PEEP) reduces collapse of alveoli at the end of expiration and decreases atelectrauma (Briel 2010). These techniques when combined are known as protective lung ventilation; they may reduce mortality and the duration of mechanical ventilation (Amato 1998; ARDSnet 2000) and have become standard care.
Recruitment manoeuvres (RMs) have been used in the ventilatory treatment of patients with ARDS (Fan 2008). Recruitment manoeuvres re‐inflate collapsed regions of the lungs by briefly raising intrapulmonary pressure to levels higher than those achieved during tidal ventilation (Brower 2003). They may be used intermittently throughout the day, or on a single occasion, to re‐inflate collapsed alveoli. A variety of RMs have been described, including prolonged continuous positive airway pressure (30 to 40 cm H2O) and stepwise or staircase RMs, which are based on progressive incremental increases in PEEP at constant driving pressure. Recruitment manoeuvres (usually) are associated with short‐term physiological benefits such as reduced intrapulmonary shunt and increased pulmonary compliance. They remain controversial because they may be harmful (Fan 2008). Recruitment manoeuvres increase intrathoracic pressure and can transiently reduce venous return and cardiac output (Odenstedt 2005). The increase in intrapulmonary pressure that results may cause barotrauma (Brower 2003; Levy 2005).
How the intervention might work
Use of a ventilation strategy that included recruitment manoeuvres and higher positive end‐expiratory pressure based on the pressure‐volume curve, which was higher than in the control group, improved survival in patients with acute respiratory distress syndrome (Amato 1998). Recruitment manoeuvres have been investigated in animal models (Funk 2004; Lim 2004) and in ventilated patients (Amato 1998; Brower 2003; Levy 2005) with variable outcomes. The reason for variability in response is not well understood.
Why it is important to do this review
This is an update of a Cochrane review that was first published in 2009 (Hodgson 2009). We have included eight new trials in this updated version (Cavalcanti et al, 2013; Hodgson 2011; Huh 2009; Kacmarek 2016; Liu 2011; Wang 2009; Xi 2010; Yang 2011). Techniques used to apply a recruitment manoeuvre vary in duration, maximum pressure and end‐expiratory pressure (Fan 2008; Suzumura 2014). This variation has made it difficult to extrapolate research findings to clinical practice. Effects of a recruitment manoeuvre may vary with the cause of lung injury (Borges 2006; Brower 2003; Kacmarek 2007). A small number of papers have reported reviews on the safety and efficacy of recruitment manoeuvres in ventilated patients (Fan 2008; Fan 2012; Lapinsky 2005; Piacentini 2004; Richard 2004), including a recent meta‐analysis (Suzumura 2014) and a Scandanavian clinical practice guideline for managing mechanical ventilation for patients with ARDS (Laake et al, 2015).
Objectives
Our primary objective was to determine the effects of recruitment manoeuvres on mortality in adults with acute respiratory distress syndrome.
Our secondary objective was to determine, in the same population, the effects of recruitment manoeuvres on oxygenation and adverse events (e.g. rate of barotrauma).
Methods
Criteria for considering studies for this review
Types of studies
We included prospective, randomized controlled trials (RCTs).
In this updated review, we excluded cross‐over trials, as they are not appropriate for assessing the primary outcome (mortality).
Types of participants
We included adults (at least 18 years of age) with acute respiratory distress (ARDS Definition Task Force 2012; Bernard 1994) who were intubated and mechanically ventilated in intensive care for at least 24 hours.
We excluded studies that enrolled children younger than 18 years of age or animals.
Types of interventions
We included RCTs that compared recruitment manoeuvres versus standard care. We defined a recruitment manoeuvre as any technique that transiently increased alveolar pressure above normal tidal ventilation (which may have included an increase in any pressure, such as plateau, peak or end‐expiratory pressure) and sustained that pressure beyond the normal time. We defined standard care as protective lung ventilation including tidal volume and pressure limitation (ARDSnet 2000) without recruitment manoeuvres. We excluded any trial that did not use standard care ventilation, as the ventilation strategy in the control group may have caused a difference in outcomes.
Types of outcome measures
Primary outcomes
We included trials that reported the primary outcome of mortality (28‐day mortality, ICU mortality and in‐hospital mortality).
Secondary outcomes
We included trials that reported the following secondary outcomes.
-
Barotrauma.
-
Hypoxaemia requiring use of rescue therapies.
-
Oxygenation (partial pressure of oxygen (PaO2)/fraction of inspired oxygen (FiO2 ratio).
In this version of the review, we excluded:
-
blood pressure as an outcome measure (as it was considered to be a transient outcome measure that was not measured beyond the first day); and
-
length of stay in ICU and in hospital, as these were not reported separately for survivors and non‐survivors.
Search methods for identification of studies
Electronic searches
We updated our previous search of the Cochrane Central Register of Controlled Trials (CENTRAL), MEDLINE (OVID), Embase (OVID), the Cumulative Index to Nursing and Allied Health Literature (CINAHL, EBSCO), Latin American and Caribbean Health Sciences (LILACS) and the International Standard Randomized Controlled Trial Number (ISRCTN) registry, from inception to August 2016.
We adapted our MEDLINE search strategy for use with other electronic databases. Our search strategies can be found in the appendices (MEDLINE, Appendix 1; CINAHL, Appendix 2; CENTRAL, Appendix 3; EMBASE, Appendix 4; LILACS, Appendix 5).
Searching other resources
We handsearched the bibliographies of all retrieved articles to identify potentially relevant trials.
We applied no language restrictions.
We attempted to identify unpublished trials by contacting experts in the field of recruitment manoeuvre research.
We tracked the citations of authors of included studies.
Data collection and analysis
Selection of studies
We (CH, SB, EG) independently and sequentially excluded studies by reading titles, abstracts, then full papers. We resolved disagreements by discussion.
Data extraction and management
We (CH, SB, EG, MY) independently extracted relevant data from included trials. We extracted study location, population description, intervention description, intervention dosage (frequency, intensity, repetition, duration), hospital environment and participant and hospital outcome data. We resolved disagreements by discussion. When information regarding the outcomes of interest was inadequate, we contacted the study authors directly (via email).
We planned to include funnel plots for any analyses that contained at least five studies. Funnel plot asymmetry may be caused by selection bias (publication or location bias); poor methodological quality of smaller studies (design, analysis, fraud); true heterogeneity (variation in effect size); and artefact or chance (Egger 1997). We performed a meta‐analysis by using Cochrane Review Manager software (RevMan 5.3).
Assessment of risk of bias in included studies
We appraised each included study according to the criteria described below (CH, EG, MY).
Under the following criteria, the response ’Yes’ indicates low risk of bias, ’No’ represents high risk of bias and ’Unclear’ means that insufficient information was available to permit a judgement.
Adequacy of the sequence generation (randomization)
Yes: Adequate sequence generation was reported via computer‐generated random numbers or codes or sealed envelopes.
No: Inadequate sequence generation was reported.
Unclear: Investigators did not describe one of the adequate methods but mentioned randomization.
Adequacy of allocation concealment
Yes: A randomization method was described that would not allow an investigator or a participant to know or influence allocation to an intervention group before an eligible participant entered the study.
No: An inadequate method of allocation was used, such as alternate medical record numbers or unsealed envelopes; or information in the study report indicated that investigators or participants were aware of group allocation before enrolment.
Unclear: The trial report mentioned randomization but provided no information on the method used, or study authors reported a method that was not clearly adequate.
Blinding of participants
We graded this item as ’Yes’ for blinded participants, ’Unclear’ if relevant information was not stated in the trial report and ’No’ for unblinded participants.
Blinding of outcome assessors
We graded this item as ’Yes’ for blinded outcome assessment, ’Unclear’ if relevant information was not stated in the trial report and ’No’ for unblinded outcome assessment.
Free of other sources of bias
Yes (low risk of bias): The trial appears to be free of other components that could put it at risk of bias.
No (high risk of bias): Other factors in the trial could put it at risk of bias, such as inadequate size calculation, early stopping or an extreme baseline imbalance.
Measures of treatment effect
Data analysis
Dichotomous data
We calculated the risk ratio (RR) and absolute risk reduction (ARR), as well as associated 95% confidence intervals (CIs). When possible, we calculated and reported the number needed to treat for one patient to benefit compared with a control (NNTB).
Continuous data
We calculated the mean difference (MD) and the associated 95% CI. We used the standardized mean difference (SMD) for data that we could not convert to a uniform scale.
We pooled data using the random‐effects model or the fixed‐effect model, depending on the presence or absence of statistical heterogeneity.
Unit of analysis issues
The unit of analysis was the individual.
We did not include studies with a cross‐over design because this study design was not appropriate for this research question.
Dealing with missing data
We reported incomplete outcome data in the following ways.
Incomplete outcome data
Yes: Numbers of withdrawals per group were reported, with reasons provided; or it was clear from the report that no withdrawals occurred.
No: Some withdrawals were evident, but numbers per group and reasons were not provided.
Incomplete outcome data addressed (use of intention‐to‐ treat (ITT) analysis)
We defined ITT analysis as analysis conducted when all trial participants were analysed in the group to which they had been randomized, regardless of which (or how much) treatment they actually received, and regardless of other protocol irregularities, such as ineligibility.
Yes: The trial report stated that ITT was undertaken and this was confirmed on study assessment, or it was not stated but was evident from study assessment that ITT was undertaken.
No: Intention‐to‐treat analysis was not confirmed on study assessment (participants who were randomized were not included in the analysis because they did not receive the study intervention, they withdrew from the study or they had committed a protocol violation), regardless of whether the analysis was described as ITT.
Assessment of heterogeneity
Clinical and statistical heterogeneity
We used the term 'clinical heterogeneity' to describe differences between participants, interventions and outcomes that might reasonably impact the effect of recruitment manoeuvres. We measured statistical heterogeneity by using the I2 statistic (Higgins 2002), which describes the percentage of variability in effect estimates that is due to heterogeneity rather than to sampling error or chance. We considered a value greater than 50% to indicate that an outcome was significantly heterogeneous. In the absence of clinical heterogeneity, we pooled studies on a case‐by‐case basis. We assessed the interaction of study variables with effects of recruitment manoeuvres in predefined sensitivity and subgroup analyses.
Assessment of reporting biases
Reporting bias refers to systematic differences between reported and unreported findings. We planned to contact trial authors to request missing data. We extracted data regarding intention‐to‐treat. analysis. If study authors did not perform ITT analysis, and if less than 20% of participants were lost to follow‐up, but sufficient raw data were available, we planned to conduct an ITT analysis before entering data into RevMan 5.3.
We planned to use funnel plot analysis to assess publication bias when more than five studies were included in the meta‐analysis, and to use the Egger test to assess funnel plot asymmetry (Egger 1997). A thorough search of grey literature for unpublished studies and contact with known experts in the field assisted review authors in reducing the risk of publication bias.
Data synthesis
We carried out statistical analysis using Review Manager software. One review author (CH) entered data into Review Manager 5.3, and a second review author (MY) checked these data for accuracy (RevMan 5.3). If the outcome of heterogeneity was low, as indicated by an I² statistic less than 50%, we planned to use the fixed‐effect model to synthesize results. If heterogeneity was moderate or high, as indicated by an I² statistic greater than 50%, we planned to use the random‐effects model to synthesize results, or to refrain from pooling, and we restricted the analysis to a qualitative overview when I² statistical values were above 60%.
Subgroup analysis and investigation of heterogeneity
Subgroup analysis
We planned to assess the interaction between cause of lung injury (intrapulmonary vs extrapulmonary) (Richard 2004) and effects of recruitment manoeuvres.
We planned to assess the interaction between type of recruitment manoeuvre and effect, while dichotomising studies according to the following definitions.
-
A manoeuvre that included a plateau pressure of 40 cm H2O or higher that was sustained for 40 seconds or longer and had a PEEP after the manoeuvre of at least 15 cm H2O, with a plan to repeat or actual repetition of the recruitment manoeuvre (Hedenstierna 2002).
-
All other recruitment manoeuvres.
Sensitivity analysis
We aimed to determine whether conclusions were robust with regards to decisions made during the review process, such as inclusion/exclusion of particular studies. We pooled all studies for analysis, then performed a sensitivity analysis excluding studies that used co‐interventions that may have influenced study outcomes.
Summary of findings table and GRADE
We used the principles of the GRADE system to assess the quality of the body of evidence associated with specific outcomes in our review, and we constructed summary of findings Table for the main comparison by using GRADEpro software (Guyatt 2008). We included these specific outcomes in the table.
-
28‐Day mortality.
-
ICU mortality.
-
In‐hospital mortality.
-
Barotrauma.
The GRADE approach appraises the quality of a body of evidence on the basis of the extent to which one can be confident that an estimate of effect or association reflects the item assessed. Assessment of the quality of a body of evidence considers within‐study risk of bias (methodological quality), directness of the evidence, heterogeneity of the data, precision of effect estimates and risk of publication bias. A priori, we agreed to lower the GRADE assessment of evidence if the results of studies may have been influenced by co‐interventions.
Results
Description of studies
Results of the search
We initially identified 26,255 citations through database searches, manual searches, citation review and contact with experts (Figure 1). After screening by title and then abstract, we obtained full‐text articles for 29 citations and two abstracts that were potentially eligible for inclusion in the review. We excluded 18 of these for reasons described in the Characteristics of excluded studies table.
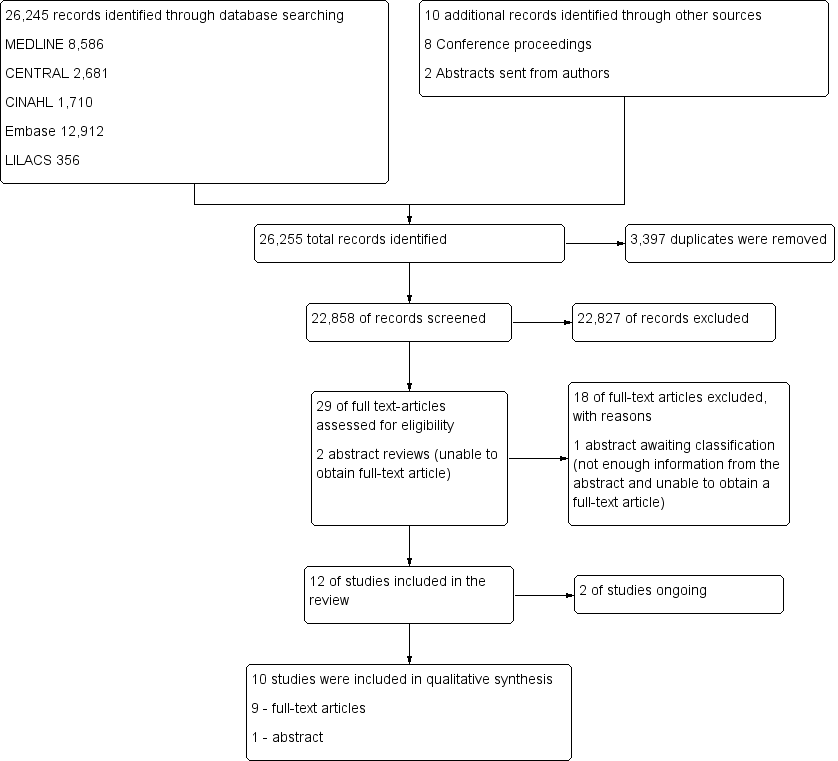
Study flow diagram.29
Included studies
We included in our review 10 trials (Cavalcanti et al, 2013; Hodgson 2011; Huh 2009; Kacmarek 2016; Liu 2011; Meade 2008; Oczenski 2004; Wang 2009; Xi 2010; Yang 2011) that enrolled 1658 participants. The number of participants in each study varied from 20 in a pilot RCT (Hodgson 2011) to 983 in a Phase III multi‐centre RCT (Meade 2008). All trials included participants with acute respiratory distress syndrome (ARDS). Most used the definition of ARDS provided by the North American‐European Consensus Conference (NAECC) (Bernard 1994). Two trials used the NAECC definition but included patients with a ratio of partial pressure of arterial oxygen to fraction of inspired oxygen (PaO2/FiO2) less than 250 (Liu 2011; Meade 2008). For full details of the 10 included trials, see the Characteristics of included studies table.
The included trials fell broadly into two groups.
-
Effects of open lung ventilation (which included co‐interventions such as differences in mode of ventilation and titration of PEEP, as well as recruitment manoeuvres) compared with standard care (Cavalcanti et al, 2013; Hodgson 2011; Huh 2009; Kacmarek 2016; Liu 2011; Meade 2008). Participants were allocated to the treatment group (open lung ventilation including a recruitment manoeuvre) or to a control group (standard care that did not include recruitment manoeuvres). Outcome measures included mortality, oxygenation and hypoxaemia requiring use of rescue therapies and barotrauma.
-
Effect of recruitment manoeuvres alone (treatment and control groups received the same mode of ventilation and PEEP). Participants were allocated to receive a recruitment manoeuvre or to not receive an RM (Oczenski 2004; Xi 2010; Wang 2009; Yang 2011), and other variables were held constant (mode of ventilation, PEEP).
Recruitment manoeuvres varied between trials (Table 1). Four trials used a staircase or stepwise increment in PEEP (Cavalcanti et al, 2013; Hodgson 2011; Huh 2009; Kacmarek 2016) to a maximum peak pressure of 55 to 60 cm H2O, and four trials used an increase in PEEP to a set pressure (40 to 50 cm H2O) for a short time (30 to 40 seconds) (Meade 2008; Oczenski 2004; Xi 2010; Yang 2011). Two trials did not provide details of the recruitment manoeuvre (Liu 2011; Wang 2009).
| Study | Mode | Peak pressure (cm H2O) | Time (sec) | PEEP titration differed between groups | Mean PEEP after RM (cm H2O) | Repetitions |
| PCV | 60 (delivered incrementally) | 240 | Yes | 16.1 | Daily (+ after desaturation or disconnection) | |
| PCV | 55 (delivered incrementally) | 360 | Yes | 17.4 | Daily (+ after desaturation or disconnection) | |
| VCV | ≤ 55 (delivered incrementally to 25 cm H2O PEEP with decremental tidal volume setting) | NS | Yes | 10 | Daily (+ after desaturation or disconnection) | |
| PCV | ≤ 60 depending on the participant's response (delivered incrementally to PEEP 35 to 45 cm H2O) | 120 | Yes | 15.8 | NS | |
| NS | NS | NS | Yes | NS | NS | |
| PCV | 40 | 40 | Yes | 14.6 | Frequently after disconnection | |
| PCV | 50 | 30 | No | 15.1 | Once | |
| BIPAP | NS | NS | N/A | NS | Eight‐hourly | |
| CPAP | 40 (cm H2O CPAP) | 40 | No | 10.5 | Eight‐hourly | |
| CPAP | 40 (cm H2O CPAP) | 30 | No | NS | Eight‐hourly |
Huh 2009 ‐ RM with incremental and decremental titration cycled twice over 10 minutes.
BIPAP = bi‐level positive airway pressure; CPAP = continuous positive airway pressure; NS = not stated; PCV = pressure‐cycled ventilation; sec = seconds; VCV = volume‐cycled ventilation.
Outcome measures varied (Table 2). Five trials assessed mortality at 28 days (Huh 2009; Kacmarek 2016; Liu 2011; Meade 2008; Xi 2010) (Figure 2); five trials assessed mortality at intensive care discharge (Hodgson 2011; Huh 2009; Kacmarek 2016; Meade 2008; Xi 2010) (Figure 3); and four in‐hospital (Hodgson 2011; Kacmarek 2016; Meade 2008; Xi 2010). Mortality was also reported during mechanical ventilation (Meade 2008). Eight trials reported the rate of radiological evidence of barotrauma (Cavalcanti et al, 2013; Hodgson 2011; Huh 2009; Kacmarek 2016; Liu 2011; Meade 2008; Xi 2010; Yang 2011). Three trials reported severe hypoxaemia requiring the use of rescue therapies (Hodgson 2011; Huh 2009; Meade 2008), and six trials reported changes in oxygenation (PaO2/FiO2 ratio) at 24 hours or at 48 hours (Cavalcanti et al, 2013; Hodgson 2011; Huh 2009; Meade 2008; Wang 2009; Xi 2010).
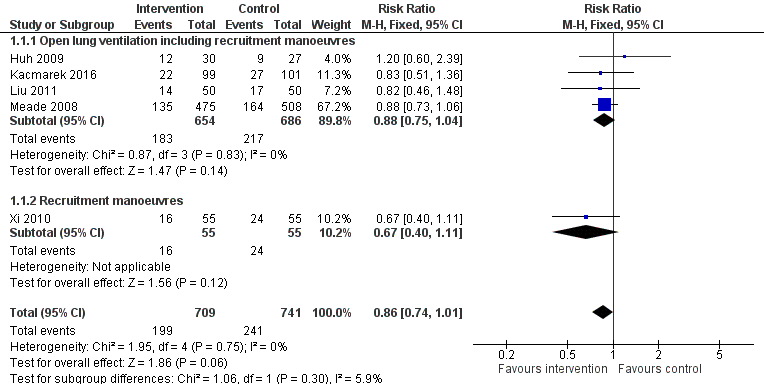
Forest plot of comparison: 1 Recruitment manoeuvres versus no recruitment manoeuvres, outcome: 1.1 28‐Day mortality.
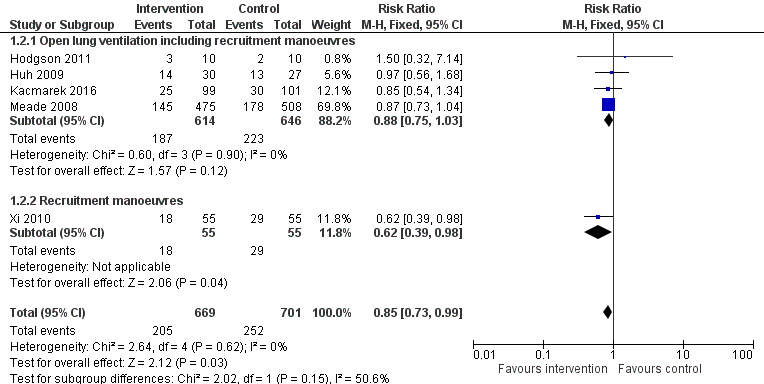
Forest plot of comparison: 1 Recruitment manoeuvres versus no recruitment manoeuvres, outcome: 1.7 ICU mortality.
| Study | Mortality | Oxygenation | Adverse events |
| N/A | PaO2/FiO2 | Barotrauma | |
| 1. in hospital | PaO2/FiO2 | Barotrauma Rescue therapies | |
| 1. 28‐day 2. in ICU | PaO2/FiO2 | Barotrauma Rescue therapies | |
| 1. in hospital 2. in ICU | Barotrauma | ||
| 28‐day | PaO2/FiO2 | Barotrauma | |
|
| PaO2/FiO2 | Barotrauma Rescue therapies | |
| N/A | PaO2/FiO2 | N/A | |
| N/A | PaO2/FiO2 | N/A | |
|
| PaO2/FiO2 | Barotrauma | |
| N/A |
| Barotrauma Pneumonia |
CO = cardiac output; FiO2/PEEP step = changes in level of inspired oxygen at set levels of positive end‐expiratory pressure; HR = heart rate; ICU = intensive care unit; MAP = mean arterial pressure; N/A = not available; PaO2/FiO2 = fraction of arterial oxygen to inspired oxygen; SBP = systolic blood pressure; SpO2 = oxygen saturation from pulse oximetry.
Awaiting classification
One study is awaiting classification (Wang 2007), as the full article was written in Mandarin and we were unable to contact the study author or the journal for further information. For details, see Characteristics of studies awaiting classification.
Ongoing studies
Two studies are ongoing (ART STudy Investigators; PHARLAP Group Investigators); see Characteristics of ongoing studies for details.
Excluded studies
We excluded from the review 18 full‐text articles (Amato 1995; Amato 1998; Barker 2002; Bollen 2005; Brower 2003; Constantin 2010; Derdak 2002; Dolinay 2011; Dyhr 2003; Foti 2000; Gattinoni 2006; Holzapfel 1987; Hurst 1990; Lasocki 2005; Lim 2003; Lowhagen 2011; Meade 2002; Stewart 2002) (Figure 1). For details of excluded trials, see the Characteristics of excluded studies table.
Risk of bias in included studies
The 10 trials included in this systematic review had low to moderate risk of bias (Figure 4). Five trials demonstrated low risk of bias (Cavalcanti et al, 2013; Hodgson 2011; Kacmarek 2016; Meade 2008; Oczenski 2004), and five demonstrated moderate risk (Huh 2009; Liu 2011; Wang 2009; Xi 2010; Yang 2011) (Figure 5).
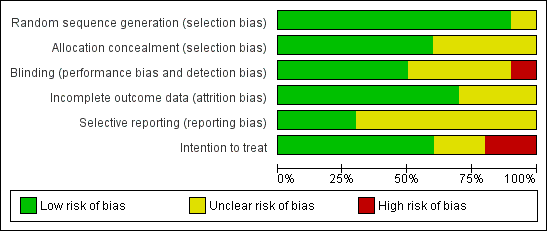
Risk of bias graph: review authors' judgements about each risk of bias item presented as percentages across all included studies.
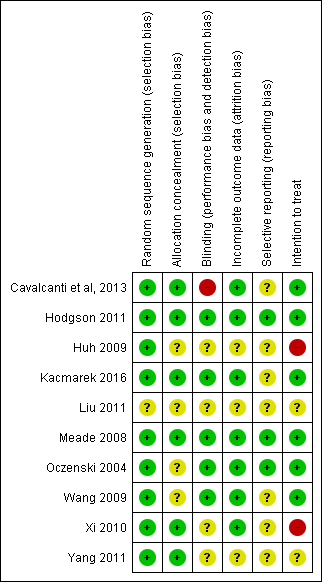
Risk of bias summary: review authors' judgements about each risk of bias item for each included study.
Allocation
Five trials (Cavalcanti et al, 2013; Hodgson 2011; Kacmarek 2016; Meade 2008; Xi 2010) clearly used adequate randomization and allocation schemes (see Characteristics of included studies table). One trial reported a programming error in the allocation procedure that occurred late in the study and disrupted specific randomization blocks; this may have accounted for modest baseline imbalances in age and presence of sepsis (Meade 2008). We addressed this by performing secondary analysis with adjustments for age, sepsis, acute physiology and duration of hospitalization.
Blinding
The intervention did not allow investigators or bedside staff to be blinded to group allocation. We assumed that participants were unaware of group allocation because they were critically ill, and consent for participation in the study was gained from the next of kin. No trials described blinding of the outcome assessor, and one trial described the data analysis as blinded (Meade 2008).
Incomplete outcome data
All trials completely reported mortality, except one trial, which excluded 15 participants for failure to follow the study protocol ‐ three in the control group and 12 in the intervention group ‐ and did not analyse these participants as intention‐to‐treat (Xi 2010).
Selective reporting
One trial excluded 15 participants for failure to follow the study protocol ‐ three in the control group and 12 in the intervention group ‐ and did not analyse these participants as intention‐to‐treat (Xi 2010).
Other potential sources of bias
We observed significant clinical heterogeneity. Recruitment manoeuvres varied between trials in terms of maximum pressure achieved, duration of maximum pressure, mode of delivery and PEEP after the recruitment manoeuvre (Table 1). Five trials included recruitment manoeuvres as part of an open lung ventilation strategy that was different from the control ventilation in aspects other than the recruitment manoeuvre (such as PEEP titration) (Hodgson 2011; Huh 2009; Kacmarek 2016; Liu 2011; Meade 2008).
Effects of interventions
See: Summary of findings for the main comparison
Primary outcome: mortality
One trial assessed effects of recruitment manoeuvres alone on the primary outcome of mortality (Xi 2010). This trial had a moderate risk of bias and did not use intention‐to‐treat analysis (Analysis 1.1).
Five trials assessed effects of open lung ventilation that included recruitment manoeuvres (along with other co‐interventions such as differences in PEEP) and reported primary outcomes (Hodgson 2011; Huh 2009; Kacmarek 2016; Liu 2011; Meade 2008) (see Table 2). As these trials were randomized controlled trials that included recruitment manoeuvres, we have provided the results below, but we acknowledge that effects of recruitment manoeuvres cannot be isolated from co‐interventions of the open lung ventilation strategy, as outlined in the discussion (Analysis 1.1). For this reason, we downgraded mortality outcomes from high to low quality.
28‐Day mortality
Analysis 1.1: Huh 2009, Kacmarek 2016, Liu 2011, Meade 2008 and Xi 2010 examined 28‐day mortality (five trials; N = 1450). We used the fixed‐effect model to pool data from these trials, as the funnel plot demonstrated minimal asymmetry (I2 = 0%). Ventilatory strategies that included recruitment manoeuvres did not appear to reduce 28‐day mortality (RR 0.86, 95% CI 0.74 to 1.01, P = 0.06) (Figure 2). Effects on 28‐day mortality were not different for trials of open lung ventilation that included recruitment manoeuvres (Huh 2009; Kacmarek 2016; Liu 2011; Meade 2008) compared with the one trial that provided recruitment manoeuvres alone (Xi 2010).
ICU mortality
Analysis 1.2: Hodgson 2011, Huh 2009, Kacmarek 2016, Meade 2008 and Xi 2010 examined ICU mortality (five trials; N = 1370). We used the fixed‐effect model to pool data from these trials, as the funnel plot demonstrated minimal asymmetry (I2 = 0%). Recruitment manoeuvres significantly reduced mortality in intensive care (RR 0.83, 95% CI 0.72 to 0.97, P = 0.02) (Figure 3). Effects on ICU mortality were different for trials of open lung ventilation that included recruitment manoeuvres (RR 0.86, 95% CI 0.74 to 1.01, P = 0.07) (Huh 2009; Kacmarek 2016; Liu 2011; Meade 2008) compared with the one trial that provided recruitment manoeuvres alone (RR 0.62, 95% CI 0.39 to 0.98, P = 0.04) (Xi 2010).
In‐hospital mortality
Analysis 1.3: Hodgson 2011, Kacmarek 2016, Meade 2008 and Xi 2010 examined in‐hospital mortality (four studies; N = 1313). We used the fixed‐effect model to pool data from these trials, as the funnel plot demonstrated minimal asymmetry (I2 = 0%). Recruitment manoeuvres did not reduce mortality in‐hospital (RR 0.88, 95% CI 0.77 to 1.01, P = 0.07). Effects on hospital mortality were not different for trials of open lung ventilation that included recruitment manoeuvres (Huh 2009; Kacmarek 2016; Liu 2011; Meade 2008) compared with the one trial that provided recruitment manoeuvres alone (Xi 2010).
Secondary outcomes
Many of the secondary outcomes described in this section were measured at different time points. When possible, we pooled results based on outcomes with similar time points of measurement.
Barotrauma
Analysis 1.4: Eight trials reported rates of barotrauma (Cavalcanti et al, 2013; Hodgson 2011; Huh 2009; Kacmarek 2016; Liu 2011; Meade 2008; Xi 2010; Yang 2011). We used the fixed‐effect model to pool data, as the funnel plot demonstrated minimal asymmetry for seven studies (I2 = 0%). Recruitment manoeuvres did not significantly affect the risk of barotrauma (RR 1.09, 95% CI 0.78 to 1.53, P = 0.60). Three trials reported no barotrauma in intervention or control groups (Hodgson 2011; Xi 2010; Yang 2011). One study reported no differences in the rate of barotrauma between groups and did not report specific numbers of participants (RR 0.78, 95% CI 0.19 to 3.30; Cavalcanti et al, 2013).
Rescue therapies
Analysis 1.5: Three trials reported use of rescue therapies for participants with severe hypoxaemia (Hodgson 2011; Huh 2009; Meade 2008). We used the random‐effects model to pool data (I2 = 74%). An open lung ventilation strategy that included recruitment manoeuvres had no effect on the use of rescue therapies for participants with severe hypoxaemia (RR 0.64, 95% CI 0.27 to 1.51, P = 0.31).
Oxygenation
Analysis 1.6: Six trials reported changes in oxygenation (PaO2/FiO2 from baseline to 24 or 48 hours after randomization) with a recruitment manoeuvre (Cavalcanti et al, 2013; Hodgson 2011; Huh 2009; Meade 2008; Wang 2009; Xi 2010); however, four of these trials included open lung ventilation along with other changes in the intervention group such as increased PEEP (Cavalcanti et al, 2013; Hodgson 2011; Huh 2009; Meade 2008).
Several trials measured oxygenation at more than one time point. For inclusion of these trials, we chose the time point closest to 24 hours after the recruitment manoeuvre. We used a random‐effects model to analyse study results (I2 = 88%). Recruitment manoeuvres improved oxygenation 24 to 48 hours after randomization compared with standard care (MD ‐39.10, 95% CI ‐57.64 to ‐20.56, P < 0.0001). The funnel plot demonstrated significant asymmetry indicating selection bias (publication or location bias); poor methodological quality of smaller studies (design, analysis, fraud); true heterogeneity (variation in effect size); and artefact or chance differences in study samples.
One trial reported a positive response to a recruitment manoeuvre that was maintained for only a few minutes (Oczenski 2004) and was not included in the analysis. Oczenski 2004 randomly assigned 30 participants from a positive end‐expiratory (PEEP) trial who had low tidal volumes and high PEEP to receive a recruitment manoeuvre or to not receive an RM. Compared with control, a recruitment manoeuvre significantly increased the PaO2/FiO2 ratio (139 ± 46 vs 246 ± 111, P < 0.001) and the shunt fraction (30.8 ± 5.8 vs 29.2 ± 7.4) three minutes later. In both groups, values returned to baseline within 30 minutes, and no significant differences between groups were noted.
Two trials investigated recruitment manoeuvres alone compared with standard care (with no other changes in ventilation strategy such as PEEP or plateau pressure) and found no differences in oxygenation at 24 to 48 hours (Wang 2009; Xi 2010).
Subgroup analyses
We found insufficient data and clinical heterogeneity in the included trials, and we were unable to perform planned subgroup analyses.
Discussion
Summary of main results
We included 10 trials in this systematic review (Cavalcanti et al, 2013; Hodgson 2011; Huh 2009; Kacmarek 2016; Liu 2011; Meade 2008; Oczenski 2004; Wang 2009; Xi 2010; Yang 2011). We pooled data from eight of the nine randomized controlled trials that provided mechanical ventilation for participants with acute respiratory distress syndrome (ARDS) with an intervention that included recruitment manoeuvres (RMs) compared with standard care (without RMs) (Cavalcanti et al, 2013; Hodgson 2011; Huh 2009; Kacmarek 2016; Liu 2011; Meade 2008; Xi 2010; Yang 2011). Trials varied with regards to the RM used (duration, maximum pressure, mode of delivery) and with regards to risk of bias. Six trials included an "open lung ventilation strategy" whereby the intervention group differed from the control group in providing co‐interventions other than the RM (such as higher positive end‐expiratory pressure (PEEP)) (Cavalcanti et al, 2013; Hodgson 2011; Huh 2009; Kacmarek 2016; Liu 2011; Meade 2008). Clinical heterogeneity of these studies makes it difficult to interpret results.
Six trials reported on events for our primary outcome (mortality) (Hodgson 2011; Huh 2009; Kacmarek 2016; Liu 2011; Meade 2008; Xi 2010). The intervention group in five of these trials received open lung ventilation with co‐interventions, such as increased PEEP, as well as RMs (Hodgson 2011; Huh 2009; Kacmarek 2016; Liu 2011; Meade 2008). Recruitment manoeuvres were not allowed in control participants. Results demonstrated statistically significant differences in intensive care unit (ICU) mortality, but not in 28‐day or hospital mortality. The composite design of these interventions means that any difference in outcomes between control and intervention groups could be due to any of the components of the intervention, or, as likely, to the combined synergistic effects of two or more of these components. A recent individual participant data meta‐analysis reported an association between improved survival in participants with acute respiratory distress who were mechanically ventilated and reduced driving pressure during mechanical ventilation (Amato 2015). It is possible that trials included in this review that provided an intervention with open lung ventilation including RMs may have also used reduced driving pressure (as a result of increased PEEP combined with protective lung ventilation), and this may have had an effect on mortality. Only one trial isolated the effects of RMs on our primary outcome and showed no difference between intervention and control groups (Xi 2010); however, this trial had a moderately high risk of bias (Figure 5).
Recruitment manoeuvres were performed at different time points following randomization in the included trials; they were performed in response to both disconnection and desaturation in several trials, further complicating interpretation of results. In the largest trial (Meade 2008), the intervention group (n = 423) received an RM at the start of the trial, and 366 received at least one additional RM following ventilator disconnection (but 57 did not receive the additional RM). Hodgson 2011 applied a daily staircase RM in the intervention group that lasted up to six minutes but performed brief RMs throughout the day for disconnection or desaturation. Three trials performed RMs eight‐hourly (Wang 2009; Xi 2010; Yang 2011). As a result of the clinical heterogeneity associated with dose and repetition of RMs, as well as the use of co‐interventions, it is not clear whether one or multiple RMs might have caused the effect. Additionally, we found limited information on who was involved in ventilatory management within the ICU, so we can draw no conclusions about international differences in ventilatory management for patients with ARDS.
We pooled the results of seven randomized trials and found that RMs did not affect the rate of barotrauma (Hodgson 2011; Huh 2009; Kacmarek 2016; Liu 2011; Meade 2008; Xi 2010; Yang 2011). These results support a recent systematic review of RMs and clinical outcomes (Suzumura 2014) and may indicate that RMs are safe; however, clinical heterogeneity between studies was significant. Evidence previously obtained by computerized tomography (Gattinoni 2006) indicated that response to high PEEP is heterogeneous in patients with ARDS and may lead to over‐distension rather than to lung recruitment.Study authors reported that some participants with ARDS might benefit from an RM and high PEEP, although for others, this approach may be harmful. Future individual participant data meta‐analyses may answer specific questions regarding response to RMs (i.e. responders vs non‐responders).
This review reported an increase in oxygenation from baseline to 24 to 48 hours after RMs were commenced in six pooled trials (Cavalcanti et al, 2013; Hodgson 2011; Huh 2009; Meade 2008; Wang 2009; Xi 2010). However, the isolated effect of RMs in Oczenski 2004 increased the fraction of arterial oxygen to inspired oxygen (PaO2/FiO2) for three minutes (returning to baseline levels within 30 minutes). Similarly, two trials of RMs (in isolation from other components of open lung ventilation) reported that oxygenation was unchanged compared with control at 24 or 48 hours after RMs (Wang 2009; Xi 2010). Additional studies are needed to determine effects of RMs in isolation from other co‐interventions on sustained changes in oxygenation.
Overall completeness and applicability of evidence
In two trials comparing open lung ventilation (Hodgson 2011; Meade 2008), sample size was calculated before the study commenced. The target sample was reached in Meade 2008, which reported no loss to follow‐up. The Hodgson 2011 pilot study recruited 20 participants at a single centre as planned, which limits the external validity of the study. Kacmarek 2016 was stopped early owing to slow recruitment, although it was a multi‐centre study.
Quality of the evidence
Although we judged the included trials to be at varying risks of bias overall, we drew evidence for our main outcomes from studies at low risk of bias. Effects of additional ventilatory co‐interventions were not controlled (Cavalcanti et al, 2013; Hodgson 2011; Huh 2009; Kacmarek 2016; Liu 2011; Meade 2008). Recruitment manoeuvres were applied inconsistently and in some cases were linked to ventilatory disconnection and desaturation. Investigators did not blind treatment or assessor, and only one trial reported blinding of the analysis (Meade 2008). One trial did not use intention‐to‐treat analysis (Xi 2010) and excluded 15 participants from the final analysis for failure to adhere to the study protocol; this limits the applicability of the evidence, and we rated this study as having high risk of bias.
Potential biases in the review process
We identified several potential biases in the review process. First, we excluded studies with cross‐over design, as we could not assess the primary outcome. However, other outcomes (barotrauma, oxygenation) may have been relevant to the review. Second, we excluded length of stay as an outcome measure (hospital length of stay; ICU length of stay), as survivors and non‐survivors were not reported separately. In the future, we recommend that randomized controlled trials should report length of stay for both survivors and non‐survivors separately. Third, we included studies with a transient increase in pressure from baseline as an RM. In doing so, we excluded studies of airway pressure release ventilation, which is a mode of ventilation that is used to recruit alveoli and may be considered a type of RM. The study by Kacmarek was completed in 2007 but was not published until 2014. Finally, one study not included in the review is awaiting classification, as we were unable to contact the study author (Wang 2009).
Agreements and disagreements with other studies or reviews
Some issues remain open for debate. In particular, do recruitment manoeuvres, in isolation from other co‐interventions, have an impact on outcomes such as survival? Data are currently insufficient to answer this question. It is plausible that RMs alone are not sufficient to improve longer‐term outcomes, but they add value when used with co‐interventions as part of an open lung ventilation strategy that includes low tidal volumes, high PEEP and limited plateau pressures (Amato 2015; ARDSnet 2000; Kacmarek 2007; Meade 2008).
Also, if RMs have a beneficial effect on outcomes, what would be the optimal inspiratory pulmonary pressure, length of time and level of PEEP needed to maintain such effects? All of the included studies used different inspiratory pressures for different lengths of time, with varying levels of PEEP (Table 1). The mode of ventilation used to achieve an RM also varied widely. Any given inspiratory pressure might be effective in some patients, ineffective in some and harmful in others (for instance, by overdistending lung units). It may be important to determine the minimum PEEP that sustains the benefits of an RM (Briel 2010; Kacmarek 2007; Lapinsky 2005).
Evidence is insufficient to show the optimal frequency of delivering an RM in patients with acute respiratory distress syndrome.

Study flow diagram.29

Forest plot of comparison: 1 Recruitment manoeuvres versus no recruitment manoeuvres, outcome: 1.1 28‐Day mortality.

Forest plot of comparison: 1 Recruitment manoeuvres versus no recruitment manoeuvres, outcome: 1.7 ICU mortality.

Risk of bias graph: review authors' judgements about each risk of bias item presented as percentages across all included studies.

Risk of bias summary: review authors' judgements about each risk of bias item for each included study.

Comparison 1 Recruitment manoeuvres versus no recruitment manoeuvres, Outcome 1 28‐Day mortality.

Comparison 1 Recruitment manoeuvres versus no recruitment manoeuvres, Outcome 2 ICU mortality.

Comparison 1 Recruitment manoeuvres versus no recruitment manoeuvres, Outcome 3 In‐hospital mortality.

Comparison 1 Recruitment manoeuvres versus no recruitment manoeuvres, Outcome 4 Rate of barotrauma.

Comparison 1 Recruitment manoeuvres versus no recruitment manoeuvres, Outcome 5 Use of rescue therapies.

Comparison 1 Recruitment manoeuvres versus no recruitment manoeuvres, Outcome 6 PaO2/FiO2 ratio at 24 to 48 hours.
| Recruitment manoeuvres compared with standard care for adults with acute respiratory distress syndrome who were mechanically ventilated | ||||||
| Patient or population: mechanically ventilated adults with acute respiratory distress syndrome. Participants were recruited from ICUs internationally, including Australia, Brazil, China, Europe, Canada, Korea, Seoul, Taiwan and the United States. Settings: intensive care unit Intervention: recruitment manoeuvres Comparison: standard care | ||||||
| Outcomes | Illustrative comparative risks* (95% CI) | Relative effect | Number of participants | Quality of the evidence | Comments | |
| Assumed risk | Corresponding risk | |||||
| Control | Intervention | |||||
| 28‐Day mortality | Risk for the population | RR 0.86 (0.74 to 1.01) | 1450 | ⊕⊕⊝⊝ | Four of the 5 trials include co‐interventions that may influence the result of the outcome. | |
| 347 per 1000 | 294 per 1000 | |||||
| ICU mortality | Risk for the population | RR 0.83 (0.72 to 0.97) | 1370 | ⊕⊕⊝⊝ | Four of the 5 trials include co‐interventions that may influence the result of the outcome. | |
| 362 per 1000 | 303 per 1000 | |||||
| In‐hospital mortality | Risk for the population | RR 0.88 (0.77 to 1.01) | 1313 | ⊕⊕⊝⊝ | Three of the 4 trials include co‐interventions that may influence the result of the outcome. | |
| 405 per 1000 | 356 per 1000 | |||||
| Rate of barotrauma | Risk for the population | RR 1.09 (0.78 to 1.51) | 1508 | ⊕⊕⊕⊝ | ||
| 90 per 1000 | 86 per 1000 | |||||
| *The basis for the assumed risk (e.g. median control group risk across studies) is provided in footnotes. The corresponding risk (and its 95% confidence interval) is based on the assumed risk in the comparison group and the relative effect of the intervention (and its 95% CI). | ||||||
| GRADE Working Group grades of evidence | ||||||
| aLung recruitment manoeuvres were used with co‐interventions that may affect the result of the outcome (Hodgson 2011; Meade 2008; Huh 2009; Kacmarek 2016; Liu 2011). We downgraded the quality of the evidence by two levels for indirectness of evidence. We made this decision a priori. bWe noted no heterogeneity among trial effect estimates but observed that reported confidence intervals around effect estimates were wide. We downgraded the quality of the evidence by one level for imprecision in results. | ||||||
| Study | Mode | Peak pressure (cm H2O) | Time (sec) | PEEP titration differed between groups | Mean PEEP after RM (cm H2O) | Repetitions |
| PCV | 60 (delivered incrementally) | 240 | Yes | 16.1 | Daily (+ after desaturation or disconnection) | |
| PCV | 55 (delivered incrementally) | 360 | Yes | 17.4 | Daily (+ after desaturation or disconnection) | |
| VCV | ≤ 55 (delivered incrementally to 25 cm H2O PEEP with decremental tidal volume setting) | NS | Yes | 10 | Daily (+ after desaturation or disconnection) | |
| PCV | ≤ 60 depending on the participant's response (delivered incrementally to PEEP 35 to 45 cm H2O) | 120 | Yes | 15.8 | NS | |
| NS | NS | NS | Yes | NS | NS | |
| PCV | 40 | 40 | Yes | 14.6 | Frequently after disconnection | |
| PCV | 50 | 30 | No | 15.1 | Once | |
| BIPAP | NS | NS | N/A | NS | Eight‐hourly | |
| CPAP | 40 (cm H2O CPAP) | 40 | No | 10.5 | Eight‐hourly | |
| CPAP | 40 (cm H2O CPAP) | 30 | No | NS | Eight‐hourly | |
| Huh 2009 ‐ RM with incremental and decremental titration cycled twice over 10 minutes. BIPAP = bi‐level positive airway pressure; CPAP = continuous positive airway pressure; NS = not stated; PCV = pressure‐cycled ventilation; sec = seconds; VCV = volume‐cycled ventilation. | ||||||
| Study | Mortality | Oxygenation | Adverse events |
| N/A | PaO2/FiO2 | Barotrauma | |
| 1. in hospital | PaO2/FiO2 | Barotrauma Rescue therapies | |
| 1. 28‐day 2. in ICU | PaO2/FiO2 | Barotrauma Rescue therapies | |
| 1. in hospital 2. in ICU | Barotrauma | ||
| 28‐day | PaO2/FiO2 | Barotrauma | |
|
| PaO2/FiO2 | Barotrauma Rescue therapies | |
| N/A | PaO2/FiO2 | N/A | |
| N/A | PaO2/FiO2 | N/A | |
|
| PaO2/FiO2 | Barotrauma | |
| N/A |
| Barotrauma Pneumonia | |
| CO = cardiac output; FiO2/PEEP step = changes in level of inspired oxygen at set levels of positive end‐expiratory pressure; HR = heart rate; ICU = intensive care unit; MAP = mean arterial pressure; N/A = not available; PaO2/FiO2 = fraction of arterial oxygen to inspired oxygen; SBP = systolic blood pressure; SpO2 = oxygen saturation from pulse oximetry. | |||
| Outcome or subgroup title | No. of studies | No. of participants | Statistical method | Effect size |
| 1 28‐Day mortality Show forest plot | 5 | 1450 | Risk Ratio (M‐H, Fixed, 95% CI) | 0.86 [0.74, 1.01] |
| 1.1 Open lung ventilation including recruitment manoeuvres | 4 | 1340 | Risk Ratio (M‐H, Fixed, 95% CI) | 0.88 [0.75, 1.04] |
| 1.2 Recruitment manoeuvres | 1 | 110 | Risk Ratio (M‐H, Fixed, 95% CI) | 0.67 [0.40, 1.11] |
| 2 ICU mortality Show forest plot | 5 | 1370 | Risk Ratio (M‐H, Fixed, 95% CI) | 0.85 [0.73, 0.99] |
| 2.1 Open lung ventilation including recruitment manoeuvres | 4 | 1260 | Risk Ratio (M‐H, Fixed, 95% CI) | 0.88 [0.75, 1.03] |
| 2.2 Recruitment manoeuvres | 1 | 110 | Risk Ratio (M‐H, Fixed, 95% CI) | 0.62 [0.39, 0.98] |
| 3 In‐hospital mortality Show forest plot | 4 | 1313 | Risk Ratio (M‐H, Fixed, 95% CI) | 0.88 [0.77, 1.01] |
| 3.1 Open lung ventilation including recruitment manoeuvres | 3 | 1203 | Risk Ratio (M‐H, Fixed, 95% CI) | 0.90 [0.78, 1.04] |
| 3.2 Recruitment manoeuvres | 1 | 110 | Risk Ratio (M‐H, Fixed, 95% CI) | 0.74 [0.50, 1.09] |
| 4 Rate of barotrauma Show forest plot | 7 | 1508 | Risk Ratio (M‐H, Fixed, 95% CI) | 1.09 [0.78, 1.51] |
| 4.1 Open lung ventilation including recruitment manoeuvres | 6 | 1398 | Risk Ratio (M‐H, Fixed, 95% CI) | 1.09 [0.78, 1.51] |
| 4.2 Recruitment manoeuvres | 1 | 110 | Risk Ratio (M‐H, Fixed, 95% CI) | 0.0 [0.0, 0.0] |
| 5 Use of rescue therapies Show forest plot | 3 | 1060 | Risk Ratio (M‐H, Random, 95% CI) | 0.64 [0.27, 1.51] |
| 6 PaO2/FiO2 ratio at 24 to 48 hours Show forest plot | 6 | 1270 | Mean Difference (IV, Random, 95% CI) | ‐39.10 [‐57.64, ‐20.56] |
| 6.1 Open lung ventilation including recruitment manoeuvres | 5 | 1160 | Mean Difference (IV, Random, 95% CI) | ‐44.76 [‐66.29, ‐23.22] |
| 6.2 Recruitment manoeuvres | 1 | 110 | Mean Difference (IV, Random, 95% CI) | ‐17.0 [‐37.19, 3.19] |