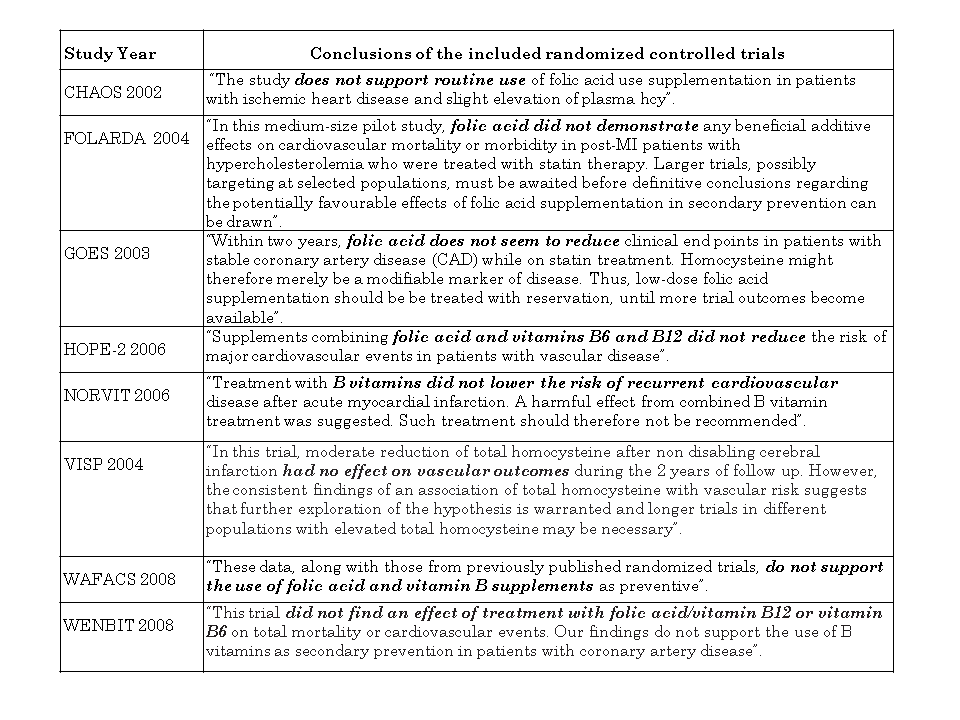
Scolaris Content Display Scolaris Content Display

Blood homocysteine levels.
Figuras y tablas -
Figure 1

Blood homocysteine levels.

Methodological quality graph: review authors' judgements about each methodological quality item presented as percentages across all included studies.
Figuras y tablas -
Figure 2

Methodological quality graph: review authors' judgements about each methodological quality item presented as percentages across all included studies.

Methodological quality summary: review authors' judgements about each methodological quality item for each included study.
Figuras y tablas -
Figure 3

Methodological quality summary: review authors' judgements about each methodological quality item for each included study.

Funnel plot for myocardial infarction.
Figuras y tablas -
Figure 4

Funnel plot for myocardial infarction.

Funnel plot for stroke
Figuras y tablas -
Figure 5

Funnel plot for stroke

Funnel plot for death
Figuras y tablas -
Figure 6

Funnel plot for death

Conclusions from the included RCT in this Cochrane review
Figuras y tablas -
Figure 7

Conclusions from the included RCT in this Cochrane review

Comparison 1 Homocysteine‐lowering treatment versus other (any comparisons), Outcome 1 Myocardial infarction.
Figuras y tablas -
Analysis 1.1

Comparison 1 Homocysteine‐lowering treatment versus other (any comparisons), Outcome 1 Myocardial infarction.

Comparison 1 Homocysteine‐lowering treatment versus other (any comparisons), Outcome 2 Stroke.
Figuras y tablas -
Analysis 1.2

Comparison 1 Homocysteine‐lowering treatment versus other (any comparisons), Outcome 2 Stroke.

Comparison 1 Homocysteine‐lowering treatment versus other (any comparisons), Outcome 3 First unstable angina pectoris episode requiring hospitalization.
Figuras y tablas -
Analysis 1.3

Comparison 1 Homocysteine‐lowering treatment versus other (any comparisons), Outcome 3 First unstable angina pectoris episode requiring hospitalization.

Comparison 1 Homocysteine‐lowering treatment versus other (any comparisons), Outcome 4 Death by any cause.
Figuras y tablas -
Analysis 1.4

Comparison 1 Homocysteine‐lowering treatment versus other (any comparisons), Outcome 4 Death by any cause.

Comparison 1 Homocysteine‐lowering treatment versus other (any comparisons), Outcome 5 Serious adverse events (Cancer).
Figuras y tablas -
Analysis 1.5

Comparison 1 Homocysteine‐lowering treatment versus other (any comparisons), Outcome 5 Serious adverse events (Cancer).

Comparison 2 Homocysteine‐lowering treatment versus other (Sensitivity analysis), Outcome 1 Myocardial infarction.
Figuras y tablas -
Analysis 2.1

Comparison 2 Homocysteine‐lowering treatment versus other (Sensitivity analysis), Outcome 1 Myocardial infarction.

Comparison 2 Homocysteine‐lowering treatment versus other (Sensitivity analysis), Outcome 2 Stroke.
Figuras y tablas -
Analysis 2.2

Comparison 2 Homocysteine‐lowering treatment versus other (Sensitivity analysis), Outcome 2 Stroke.

Comparison 2 Homocysteine‐lowering treatment versus other (Sensitivity analysis), Outcome 3 First unstable angina pectoris episode requiring hospitalization.
Figuras y tablas -
Analysis 2.3

Comparison 2 Homocysteine‐lowering treatment versus other (Sensitivity analysis), Outcome 3 First unstable angina pectoris episode requiring hospitalization.

Comparison 2 Homocysteine‐lowering treatment versus other (Sensitivity analysis), Outcome 4 Death by any cause.
Figuras y tablas -
Analysis 2.4

Comparison 2 Homocysteine‐lowering treatment versus other (Sensitivity analysis), Outcome 4 Death by any cause.

Summary of findings for the main comparison. Homocysteine‐lowering treatments for preventing cardiovascular events compared to placebo or standard care

Homocysteine‐lowering treatments for preventing cardiovascular events compared to placebo or standard care

Patient or population: patients with preventing cardiovascular events
Settings: Patients with known risk factors
Intervention: Homocysteine‐lowering treatments

Outcomes

Illustrative comparative risks* (95% CI)

Relative effect
(95% CI)

No of Participants
(studies)

Quality of the evidence
(GRADE)

Comments

Assumed risk

Corresponding risk

Control

Homocysteine‐lowering treatments

Myocardial infarction

Low risk population

RR 1.03
(0.94 to 1.13)

20561
(7 studies)

⊕⊕⊕⊝
moderate1

50 per 1000

51 per 1000
(47 to 56)

High risk population

100 per 1000

103 per 1000
(94 to 113)

Stroke

Low risk population

RR 0.89
(0.73 to 1.08)

18086
(5 studies)

⊕⊕⊕⊝
moderate

50 per 1000

44 per 1000
(37 to 54)

High risk population

100 per 1000

89 per 1000
(73 to 108)

Death by any cause

Low risk population

RR 1
(0.92 to 1.09)

18679
(6 studies)

⊕⊕⊕⊝
moderate

50 per 1000

50 per 1000
(46 to 55)

High risk population

100 per 1000

100 per 1000
(92 to 109)

Serious adverse events (Cancer)

Low risk population

RR 1.06
(0.9 to 1.25)

12361
(3 studies)

⊕⊕⊕⊝
moderate

10 per 1000

11 per 1000
(9 to 12)

High risk population

50 per 1000

53 per 1000
(45 to 62)

*The basis for the assumed risk (e.g. the median control group risk across studies) is provided in footnotes. The corresponding risk (and its 95% confidence interval) is based on the assumed risk in the comparison group and the relative effect of the intervention (and its 95% CI).
CI: Confidence interval; RR: Risk ratio;

GRADE Working Group grades of evidence
High quality: Further research is very unlikely to change our confidence in the estimate of effect.
Moderate quality: Further research is likely to have an important impact on our confidence in the estimate of effect and may change the estimate.
Low quality: Further research is very likely to have an important impact on our confidence in the estimate of effect and is likely to change the estimate.
Very low quality: We are very uncertain about the estimate.

1 The interventions have different characteristis across studies

Figuras y tablas -
Summary of findings for the main comparison. Homocysteine‐lowering treatments for preventing cardiovascular events compared to placebo or standard care
Table 1. Burden of deaths attributable to cardiovascular diseases (%) (From Gaziano 2006)

Region

%

Sub‐Saharan Africa, parts of all regions excluding high‐income regions

5 to 10

South Asia, southern East Asia and the Pacific, parts of Latin America and the Caribbean

15 to 35

Europe and Central Asia, northern East Asia and the Pacific, Latin America and the Caribbean,

Middle East and North Africa, and urban parts of most low‐income regions (especially India)

> 50

High‐income countries, parts of Latin America and the Caribbean

< 50

Figuras y tablas -
Table 1. Burden of deaths attributable to cardiovascular diseases (%) (From Gaziano 2006)
Table 2. Composition of intervention and control groups

Study

Year

Folic acid (mg/d)

Vitamin B12 (mg/d)

Vitamin B6 (mg/d)

Control

CHAOS‐2

2002

5

None

None

Placebo

FOLARDA

2004

5

None

None

Standard care

GOES

2003

0.5

None

None

Standard care

HOPE‐2

2006

2.5

1

50

Placebo

NORVIT

2006

Group A: 0.8; Group B: 0.8; Gruop C: none

Group A: 0.4; Group B: 0.4; Group C: none

Group A: none; Group B: none; Group C: 40

Placebo

VISP

2004

2.5

0.4

25

Folic acid: 0.02; Vit.B12: 0.06; Vita B6: 0.2

WAFACS

2008

2.5

1

50

Placebo

WENBIT

2008

Group A: 0.8; Group B: 0.8; Gruop C: none

Group A: 0.4; Group B: 0.4; Group C: none

Group A: none; Group B: none; Group C: 40

Placebo

Figuras y tablas -
Table 2. Composition of intervention and control groups
Table 3. Components of the composite outcomes

Study

Year

Components

CHAOS‐2

2002

Non‐fatal myocardial infarction; cardiovascular death; unplanned revascularization.

FOLARDA

2004

Cardiovascular death (sudden death; fatal recurrent myocardial infarction; fatal stroke; death from cardiovascular).

GOES

2003

Death from cardiovascular cause; death from non‐cardiovascular cause; recurrent myocardial infarction; invasive coronary procedures; stroke; other vascular surgery.

HOPE‐2

2006

Death from cardiovascular; myocardial infarction; stroke.

NORVIT

2006

Myocardial infarction (fatal and non‐fatal); stroke (fatal and non‐fatal); sudden death attributed to coronary heart disease.

WAFACS

2008

Myocardial infarction; stroke; revascularization; death from cardiovascular cause.

WENBIT

2008

All‐cause death; nonfatal acute myocardial infarction; acute hospitalisation for unstable angina pectoris; nonfatal thromboembolic stroke.

Figuras y tablas -
Table 3. Components of the composite outcomes
Table 4. Definitions of myocardial infarction (MI), stroke, unstable angina, and death.

Study

Year

MI

Stroke

Unstable angina

Death

Notes

CHAOS‐2

2002

Not available.

Not evaluated in this study.

Not evaluated in this study.

Not available.

FOLARDA

2004

Creatinine kinase elevation at least two times the upper limit of normal and in addition one of the following: On EKG, new pathological Q‐waves in at least two contiguous leads or new left bundle branch block or chest pain longer than 30 min.

Unequivocal signs of focal or global neurological deficit with sudden onset was present with a duration greater than 24 h and which were judged to be vascular in origin.

Recurrence of typical or atypical anginal pain at rest or at effort with the appearance of a ST segment change >0.1mV and/or T wave inversion in at least 2 of 12 leads.

Not available.

GOES

2003

Two out of three criteria should be positive: chest pain lasting _30 min, creatine kinase elevation _2 times the upper limit of normal or new pathological Q waves of 0.04‐s duration or 25% of the corresponding R‐wave amplitude, both in at least two contiguous leads.

Not available.

Not available.

Not available.

HOPE‐2

2006

Two of the following three criteria were met: typical symptoms, increased cardiac‐enzyme levels, and diagnostic electrocardiographic changes$.

Focal neurologic deficit lasting more than 24 hours. Computed tomography or magnetic resonance imaging was recommended to identify the type of stroke (ischaemic or hemorrhagic). When these tools were not available, the stroke was classified as of uncertain type.

Not available.

Cardiovascular causes were unexpected deaths presumed to be due to ischaemic cardiovascular disease and occurring within 24 hours after the onset of symptoms
without clinical or postmortem evidence of another cause, deaths from myocardial infarction or stroke within 7 days after the event, deaths associated with cardiovascular interventions within 30 days after cardiovascular surgery or within 7 days after percutaneous interventions, and deaths from congestive heart failure, arrhythmia, pulmonary embolism, or ruptured aortic aneurysm. Deaths from uncertain causes were presumed to be due to cardiovascular causes.

$ Alpert JS, Thygesen K, Antman E, Bassand JP. Myocardial infarction redefined ‐ a consensus document of the joint European Society of Cardiology/American College of Cardiology Committee for the
redefinition of myocardial infarction. J Am Coll Cardiol 2000;36:959‐69. [Erratum, J Am Coll Cardiol 2001;37:973.]
: source not available.

NORVIT

2006

See supplementary appendix: www.nejm.org

See supplementary appendix: www.nejm.org

See supplementary appendix: www.nejm.org

See supplementary appendix: www.nejm.org

Definitions are very longer to resume here.

VISP

2004

New ECG changes including Q waves or marked ST‐T changes plus abnormal cardiac enzymes, cardiac symptoms plus abnormal enzymes, or symptoms plus hyperacute ECG changes resolving with thrombolysis.

Evidence of sudden onset of focal neurologic deficit lasting at least 24 hours accompanied by an increased NIHSS Score in an area that was previously normal. When the sudden onset of symptoms lasting at least 24 hours was not accompanied by an increased NIHSS Score in an area that was previously normal, then recurrent stroke was diagnosed using cranial CT or MRI evidence of new infarction consistent with the clinical presentation.

Not available.

Not available.

WAFACS

2008

According to World Health Organizations's criteria.

A new neurologic deficit of sudden onset that persisted for more than 24 jours or until death within 24 hours.

Not available.

Due to cardiovascular disease was confirmed by examinations of autopsy reports, death certificates, medical records, and information obtained from the next kin or other family members. Death from any cause was confirmed by the end point committee on the basis of a death certificate.

WENBIT

2008

According to The Joint European Society of Cardiology/American College of Cardiology Committee. Eur Heart J. 2000;21:1502‐13.

According to Cannon CP, Battler A, Brindis RG, Cox JL, Ellis SG, Every NR et al. A report of the American College of Cardiology Task Force on Clinical Data Standards (Acute Coronary Syndromes Writing Committee). J Am Coll Cardiol. 2001;38:2114‐30.

According to Cannon CP, Battler A, Brindis RG, Cox JL, Ellis SG, Every NR et al. A report of the American College of Cardiology Task Force on Clinical Data Standards (Acute Coronary Syndromes Writing Committee). J Am Coll Cardiol. 2001; 38:2114‐30.

If death occurred within 28 days
after the onset of an event, the event
was classified as fatal.

Figuras y tablas -
Table 4. Definitions of myocardial infarction (MI), stroke, unstable angina, and death.
Table 5. Secondary publication

Included Study

Reference

Objective

Data added addendum

GOES 2003

Liem A, Reynierse‐Buitenwerf GH, Zwinderman AH, Jukema JW, van Veldhuisen DJ. Secondary prevention with folic acid: results of the Goes extension study. Heart 2005;91:1213‐4.

To report the results of the study with a mean (SD) follow up of 42 (10)
months.

Hcy has to be interpreted as a modifiable risk marker without apparent clinically
salutary effects on hard clinical outcomes in patients with stable coronary artery disease.

VISP 2004

Spence JD, Bang H, Chambless LE, Stampfer MJ. Vitamin Intervention For Stroke Prevention trial: an efficacy analysis. Stroke 2005;36:2404‐09.

This RCT was an efficacy analysis limited to patients most likely to benefit from the treatment, based on hypotheses arising from evidence developed since VISP was initiated.

In the era of folate fortification, B12 plays a key role in vitamin therapy for total homocysteine. Higher doses of B12, and other treatments to lower total homocysteine may be needed for some patients.

WAFACS 2008

Redbeg RF, Block PC. A randomised trial of folic acid and B‐vitamins in the secondary prevention of cardiovascular events in women: Results from the Women's Antioxidant and Folic Acid Cardiovascular Study (WAFACS). ACC Cardiosource Review Journal. 2006;16(7):52‐58.

This RCT is a preliminary report of WAFAC study.

Figuras y tablas -
Table 5. Secondary publication
Comparison 1. Homocysteine‐lowering treatment versus other (any comparisons)

Outcome or subgroup title

No. of studies

No. of participants

Statistical method

Effect size

1 Myocardial infarction Show forest plot

8

Risk Ratio (M‐H, Random, 95% CI)

Subtotals only

1.1 Homocysteine‐lowering versus placebo

7

20561

Risk Ratio (M‐H, Random, 95% CI)

1.03 [0.94, 1.13]

1.2 Homocysteine‐lowering treatment at high dose versus low dose

1

3649

Risk Ratio (M‐H, Random, 95% CI)

0.90 [0.66, 1.23]

2 Stroke Show forest plot

6

Risk Ratio (M‐H, Random, 95% CI)

Subtotals only

2.1 Homocysteine‐lowering treatment versus placebo

5

18086

Risk Ratio (M‐H, Random, 95% CI)

0.89 [0.73, 1.08]

2.2 Homocysteine‐lowering treatment at high dose versus low dose

1

3649

Risk Ratio (M‐H, Random, 95% CI)

1.04 [0.84, 1.29]

3 First unstable angina pectoris episode requiring hospitalization Show forest plot

4

12644

Risk Ratio (M‐H, Random, 95% CI)

0.98 [0.80, 1.21]

4 Death by any cause Show forest plot

7

Risk Ratio (M‐H, Random, 95% CI)

Subtotals only

4.1 Homocysteine‐lowering treatment versus placebo

6

18679

Risk Ratio (M‐H, Random, 95% CI)

1.00 [0.92, 1.09]

4.2 Homocysteine‐lowering treatments at high dose versus low dose

1

3649

Risk Ratio (M‐H, Random, 95% CI)

0.86 [0.66, 1.11]

5 Serious adverse events (Cancer) Show forest plot

3

12361

Risk Ratio (M‐H, Random, 95% CI)

1.06 [0.90, 1.25]

Figuras y tablas -
Comparison 1. Homocysteine‐lowering treatment versus other (any comparisons)
Comparison 2. Homocysteine‐lowering treatment versus other (Sensitivity analysis)

Outcome or subgroup title

No. of studies

No. of participants

Statistical method

Effect size

1 Myocardial infarction Show forest plot

4

17803

Risk Ratio (M‐H, Random, 95% CI)

1.02 [0.93, 1.13]

1.1 Trials with low risk of bias (mixed populations)

3

12361

Risk Ratio (M‐H, Random, 95% CI)

1.04 [0.94, 1.15]

1.2 Trials with low risk of bias (only women included)

1

5442

Risk Ratio (M‐H, Random, 95% CI)

0.88 [0.63, 1.22]

2 Stroke Show forest plot

4

17803

Risk Ratio (M‐H, Random, 95% CI)

0.89 [0.72, 1.09]

2.1 Trials with low risk of bias (mixed populations)

3

12361

Risk Ratio (M‐H, Random, 95% CI)

0.79 [0.65, 0.97]

2.2 Trials with low risk of bias (only women included)

1

5442

Risk Ratio (M‐H, Random, 95% CI)

1.14 [0.83, 1.57]

3 First unstable angina pectoris episode requiring hospitalization Show forest plot

3

12361

Risk Ratio (M‐H, Random, 95% CI)

0.99 [0.79, 1.24]

4 Death by any cause Show forest plot

4

17803

Risk Ratio (M‐H, Random, 95% CI)

1.00 [0.92, 1.09]

4.1 Trials with low risk of bias (mixed populations)

3

12361

Risk Ratio (M‐H, Random, 95% CI)

1.01 [0.91, 1.12]

4.2 Trials with low risk of bias (only women included)

1

5442

Risk Ratio (M‐H, Random, 95% CI)

0.98 [0.83, 1.15]

Figuras y tablas -
Comparison 2. Homocysteine‐lowering treatment versus other (Sensitivity analysis)