Scolaris Content Display Scolaris Content Display

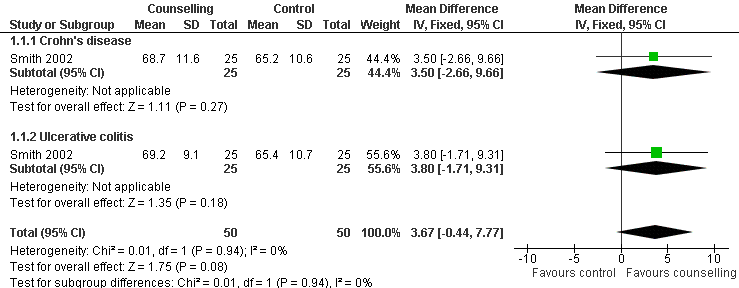
Forest plot of comparison: 1 Active counselling versus control, outcome: 1.1 Mean mental health scores (SF‐36) at 6 months.
Figuras y tablas -
Figure 1

Forest plot of comparison: 1 Active counselling versus control, outcome: 1.1 Mean mental health scores (SF‐36) at 6 months.

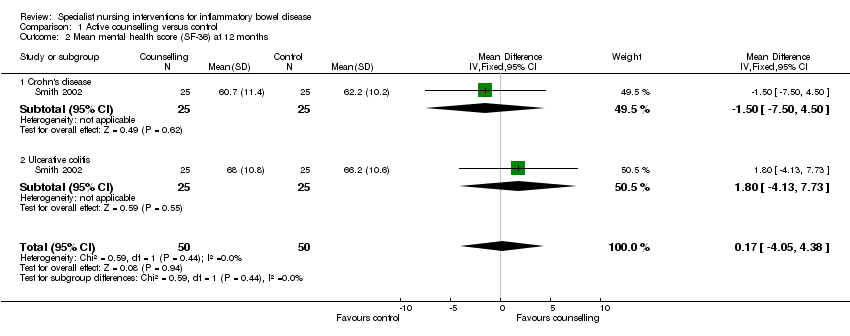
Forest plot of comparison: 1 Active counselling versus control, outcome: 1.2 Mean mental health score (SF‐36) at 12 months.
Figuras y tablas -
Figure 2

Forest plot of comparison: 1 Active counselling versus control, outcome: 1.2 Mean mental health score (SF‐36) at 12 months.

Comparison 1 Active counselling versus control, Outcome 1 Mean mental health scores (SF‐36) at 6 months.
Figuras y tablas -
Analysis 1.1

Comparison 1 Active counselling versus control, Outcome 1 Mean mental health scores (SF‐36) at 6 months.

Comparison 1 Active counselling versus control, Outcome 2 Mean mental health score (SF‐36) at 12 months.
Figuras y tablas -
Analysis 1.2

Comparison 1 Active counselling versus control, Outcome 2 Mean mental health score (SF‐36) at 12 months.

Comparison 1 Active counselling versus control, Outcome 3 Mean HAD anxiety scores at 6 months.
Figuras y tablas -
Analysis 1.3

Comparison 1 Active counselling versus control, Outcome 3 Mean HAD anxiety scores at 6 months.

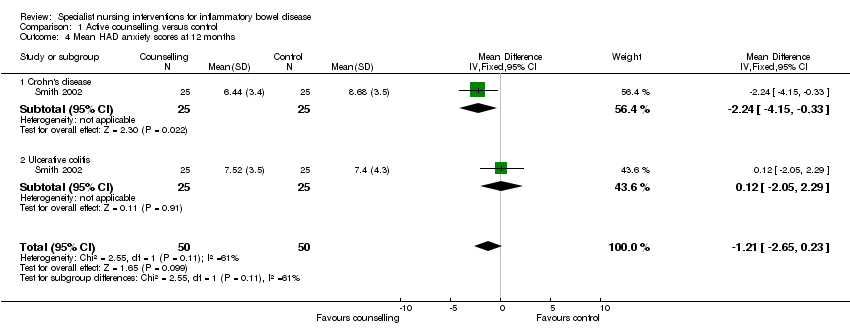
Comparison 1 Active counselling versus control, Outcome 4 Mean HAD anxiety scores at 12 months.
Figuras y tablas -
Analysis 1.4

Comparison 1 Active counselling versus control, Outcome 4 Mean HAD anxiety scores at 12 months.

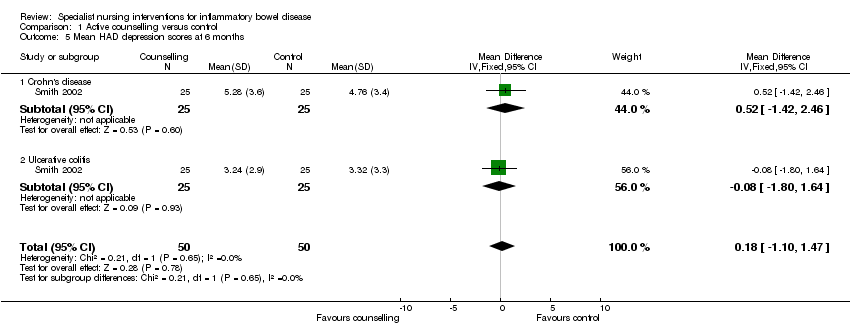
Comparison 1 Active counselling versus control, Outcome 5 Mean HAD depression scores at 6 months.
Figuras y tablas -
Analysis 1.5

Comparison 1 Active counselling versus control, Outcome 5 Mean HAD depression scores at 6 months.

Comparison 1 Active counselling versus control, Outcome 6 Mean HAD depression scores at 12 months.
Figuras y tablas -
Analysis 1.6

Comparison 1 Active counselling versus control, Outcome 6 Mean HAD depression scores at 12 months.

Comparison 1 Active counselling versus control, Outcome 7 Emotional coping for Crohn's patients.
Figuras y tablas -
Analysis 1.7

Comparison 1 Active counselling versus control, Outcome 7 Emotional coping for Crohn's patients.

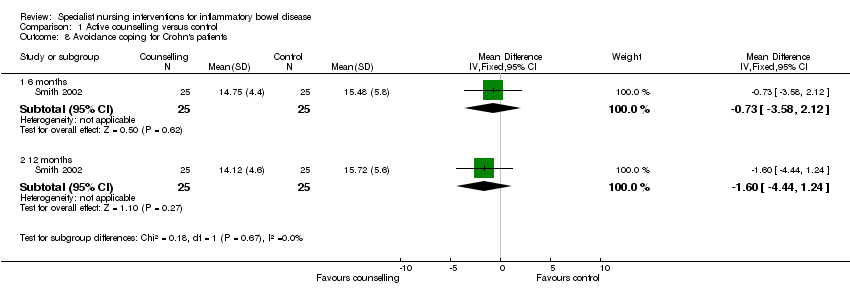
Comparison 1 Active counselling versus control, Outcome 8 Avoidance coping for Crohn's patients.
Figuras y tablas -
Analysis 1.8

Comparison 1 Active counselling versus control, Outcome 8 Avoidance coping for Crohn's patients.

Comparison 1 Active counselling versus control, Outcome 9 Maladaptive coping for Crohn's patients.
Figuras y tablas -
Analysis 1.9

Comparison 1 Active counselling versus control, Outcome 9 Maladaptive coping for Crohn's patients.

Comparison 1. Active counselling versus control

Outcome or subgroup title

No. of studies

No. of participants

Statistical method

Effect size

1 Mean mental health scores (SF‐36) at 6 months Show forest plot

1

100

Mean Difference (IV, Fixed, 95% CI)

3.67 [‐0.44, 7.77]

1.1 Crohn's disease

1

50

Mean Difference (IV, Fixed, 95% CI)

3.5 [‐2.66, 9.66]

1.2 Ulcerative colitis

1

50

Mean Difference (IV, Fixed, 95% CI)

3.80 [‐1.71, 9.31]

2 Mean mental health score (SF‐36) at 12 months Show forest plot

1

100

Mean Difference (IV, Fixed, 95% CI)

0.17 [‐4.05, 4.38]

2.1 Crohn's disease

1

50

Mean Difference (IV, Fixed, 95% CI)

‐1.5 [‐7.50, 4.50]

2.2 Ulcerative colitis

1

50

Mean Difference (IV, Fixed, 95% CI)

1.80 [‐4.13, 7.73]

3 Mean HAD anxiety scores at 6 months Show forest plot

1

100

Mean Difference (IV, Fixed, 95% CI)

‐0.49 [‐1.94, 0.96]

3.1 Crohn's disease

1

50

Mean Difference (IV, Fixed, 95% CI)

‐0.96 [‐2.96, 1.04]

3.2 Ulcerative colitis

1

50

Mean Difference (IV, Fixed, 95% CI)

0.04 [‐2.08, 2.16]

4 Mean HAD anxiety scores at 12 months Show forest plot

1

100

Mean Difference (IV, Fixed, 95% CI)

‐1.21 [‐2.65, 0.23]

4.1 Crohn's disease

1

50

Mean Difference (IV, Fixed, 95% CI)

‐2.24 [‐4.15, ‐0.33]

4.2 Ulcerative colitis

1

50

Mean Difference (IV, Fixed, 95% CI)

0.12 [‐2.05, 2.29]

5 Mean HAD depression scores at 6 months Show forest plot

1

100

Mean Difference (IV, Fixed, 95% CI)

0.18 [‐1.10, 1.47]

5.1 Crohn's disease

1

50

Mean Difference (IV, Fixed, 95% CI)

0.52 [‐1.42, 2.46]

5.2 Ulcerative colitis

1

50

Mean Difference (IV, Fixed, 95% CI)

‐0.08 [‐1.80, 1.64]

6 Mean HAD depression scores at 12 months Show forest plot

1

100

Mean Difference (IV, Fixed, 95% CI)

0.04 [‐1.25, 1.34]

6.1 Crohn's disease

1

50

Mean Difference (IV, Fixed, 95% CI)

‐0.48 [‐2.45, 1.49]

6.2 Ulcerative colitis

1

50

Mean Difference (IV, Fixed, 95% CI)

0.44 [‐1.28, 2.16]

7 Emotional coping for Crohn's patients Show forest plot

1

Mean Difference (IV, Fixed, 95% CI)

Subtotals only

7.1 6 months

1

50

Mean Difference (IV, Fixed, 95% CI)

0.84 [‐2.13, 3.81]

7.2 12 months

1

50

Mean Difference (IV, Fixed, 95% CI)

‐2.14 [‐3.00, 0.72]

8 Avoidance coping for Crohn's patients Show forest plot

1

Mean Difference (IV, Fixed, 95% CI)

Subtotals only

8.1 6 months

1

50

Mean Difference (IV, Fixed, 95% CI)

‐0.73 [‐3.58, 2.12]

8.2 12 months

1

50

Mean Difference (IV, Fixed, 95% CI)

‐1.60 [‐4.44, 1.24]

9 Maladaptive coping for Crohn's patients Show forest plot

1

Mean Difference (IV, Fixed, 95% CI)

Subtotals only

9.1 6 months

1

50

Mean Difference (IV, Fixed, 95% CI)

‐0.03 [‐2.47, 2.41]

9.2 12 months

1

50

Mean Difference (IV, Fixed, 95% CI)

‐1.88 [‐4.29, 0.53]

Figuras y tablas -
Comparison 1. Active counselling versus control