| 1 Mean daily rating of problem severity Show forest plot | 2 | | Mean Difference (IV, Fixed, 95% CI) | Subtotals only |
|
| 1.1 Cycles 1 to 3 | 2 | 513 | Mean Difference (IV, Fixed, 95% CI) | ‐7.92 [‐11.16, ‐4.67] |
| 1.2 Cycles 4 to 6 (crossover) | 1 | 64 | Mean Difference (IV, Fixed, 95% CI) | ‐7.0 [‐17.01, 3.01] |
| 2 Responders (>= 50% decrease in daily symptom score) Show forest plot | 1 | 449 | Peto Odds Ratio (Peto, Fixed, 95% CI) | 1.65 [1.13, 2.40] |
|
| 3 Mean change in daily rating of functional impairment: reduction of productivity Show forest plot | 2 | | Mean Difference (IV, Fixed, 95% CI) | Subtotals only |
|
| 3.1 Cycles 1 to 3 | 2 | 432 | Mean Difference (IV, Fixed, 95% CI) | ‐0.31 [‐0.55, ‐0.08] |
| 3.2 Cycles 4 to 6 (crossover) | 1 | 34 | Mean Difference (IV, Fixed, 95% CI) | ‐1.1 [‐1.70, ‐0.50] |
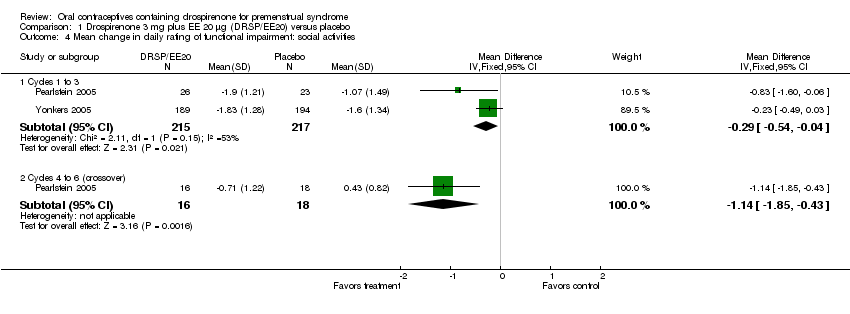
| 4 Mean change in daily rating of functional impairment: social activities Show forest plot | 2 | | Mean Difference (IV, Fixed, 95% CI) | Subtotals only |
|
| 4.1 Cycles 1 to 3 | 2 | 432 | Mean Difference (IV, Fixed, 95% CI) | ‐0.29 [‐0.54, ‐0.04] |
| 4.2 Cycles 4 to 6 (crossover) | 1 | 34 | Mean Difference (IV, Fixed, 95% CI) | ‐1.14 [‐1.85, ‐0.43] |
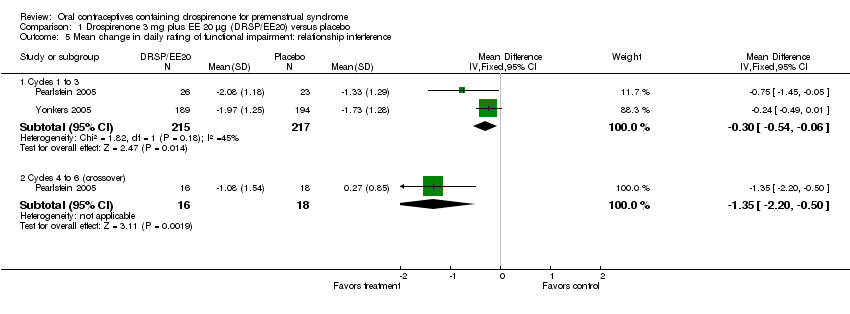
| 5 Mean change in daily rating of functional impairment: relationship interference Show forest plot | 2 | | Mean Difference (IV, Fixed, 95% CI) | Subtotals only |
|
| 5.1 Cycles 1 to 3 | 2 | 432 | Mean Difference (IV, Fixed, 95% CI) | ‐0.30 [‐0.54, ‐0.06] |
| 5.2 Cycles 4 to 6 (crossover) | 1 | 34 | Mean Difference (IV, Fixed, 95% CI) | ‐1.35 [‐2.20, ‐0.50] |
| 6 Change in Endicott Q‐LES‐Q Overall Life Satisfaction item Show forest plot | 2 | | Mean Difference (IV, Fixed, 95% CI) | Subtotals only |
|
| 6.1 Cycles 1 to 3 | 2 | 431 | Mean Difference (IV, Fixed, 95% CI) | 0.07 [‐0.15, 0.30] |
| 6.2 Cycles 4 to 6 (crossover) | 1 | 29 | Mean Difference (IV, Fixed, 95% CI) | 0.43 [‐0.35, 1.21] |
| 7 Changes in Premenstrual Tension Scale scores Show forest plot | 2 | | Mean Difference (IV, Fixed, 95% CI) | Subtotals only |
|
| 7.1 Observer‐rated score (cycles 1 to 3) | 1 | 387 | Mean Difference (IV, Fixed, 95% CI) | ‐2.05 [‐4.08, ‐0.02] |
| 7.2 Self‐rated score (cycles 1 to 3) | 2 | 438 | Mean Difference (IV, Fixed, 95% CI) | ‐3.78 [‐5.97, ‐1.58] |
| 8 Adverse events Show forest plot | 2 | | Peto Odds Ratio (Peto, Fixed, 95% CI) | Subtotals only |
|
| 8.1 Nausea | 2 | 552 | Peto Odds Ratio (Peto, Fixed, 95% CI) | 3.15 [1.90, 5.22] |
| 8.2 Headache | 2 | 552 | Peto Odds Ratio (Peto, Fixed, 95% CI) | 0.97 [0.63, 1.49] |
| 8.3 Intermenstrual bleeding | 2 | 552 | Peto Odds Ratio (Peto, Fixed, 95% CI) | 4.92 [3.03, 7.96] |
| 8.4 Breast pain | 2 | 552 | Peto Odds Ratio (Peto, Fixed, 95% CI) | 2.67 [1.50, 4.78] |
| 8.5 Nervousness | 1 | 103 | Peto Odds Ratio (Peto, Fixed, 95% CI) | 2.25 [0.49, 10.37] |
| 8.6 Asthenia | 2 | 552 | Peto Odds Ratio (Peto, Fixed, 95% CI) | 1.82 [0.92, 3.61] |
| 8.7 Pain or abdominal pain | 2 | 552 | Peto Odds Ratio (Peto, Fixed, 95% CI) | 1.36 [0.58, 3.20] |
| 8.8 Dymenorrhea | 1 | 103 | Peto Odds Ratio (Peto, Fixed, 95% CI) | 2.54 [0.35, 18.62] |
| 8.9 Menstrual disorder | 1 | 103 | Peto Odds Ratio (Peto, Fixed, 95% CI) | 7.00 [0.71, 68.99] |
| 8.10 Total adverse events related to study drug | 1 | 449 | Peto Odds Ratio (Peto, Fixed, 95% CI) | 2.36 [1.62, 3.44] |
| 9 Mean change in daily rating of functional impairment: social activities Show forest plot | 2 | | Mean Difference (IV, Random, 95% CI) | Subtotals only |
|
| 9.1 Cycles 1 to 3 | 2 | 432 | Mean Difference (IV, Random, 95% CI) | ‐0.42 [‐0.96, 0.13] |
| 9.2 Cycles 4 to 6 (crossover) | 1 | 34 | Mean Difference (IV, Random, 95% CI) | ‐1.14 [‐1.85, ‐0.43] |
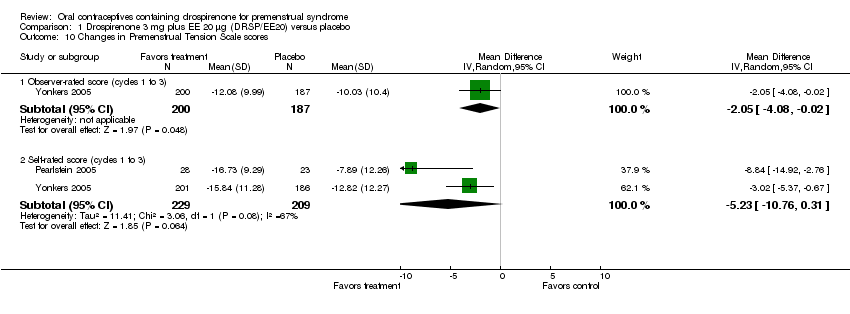
| 10 Changes in Premenstrual Tension Scale scores Show forest plot | 2 | | Mean Difference (IV, Random, 95% CI) | Subtotals only |
|
| 10.1 Observer‐rated score (cycles 1 to 3) | 1 | 387 | Mean Difference (IV, Random, 95% CI) | ‐2.05 [‐4.08, ‐0.02] |
| 10.2 Self‐rated score (cycles 1 to 3) | 2 | 438 | Mean Difference (IV, Random, 95% CI) | ‐5.23 [‐10.76, 0.31] |