针对患有哮喘的少数民族儿童和成人的文化特定计划
摘要
研究背景
少数民族的哮喘患者预后通常较差,包括因急性哮喘恶化而就医的次数更多。用于教育和增强哮喘患者能力的各种计划先前已被证明可以改善某些哮喘结局(例如依从性结局、儿童和父母的哮喘知识得分以及成本效益)。少数民族慢性病的照护模式通常包括关注个人的文化背景,而不仅仅是疾病的症状。因此,需要回答的问题是,针对少数民族人群的文化特异性哮喘教育计划是否能有效改善哮喘相关结局,这些方案是否可行,是否具有成本效益。
研究目的
确定与普通哮喘教育方案或常规照护相比,针对特定文化的哮喘教育计划是否改善少数民族儿童和成人哮喘患者的哮喘相关结局。
检索策略
我们检索了Cochrane对照试验中心注册库(Cochrane Central Register of Controlled Trials, CENTRAL)、Cochrane呼吸道组专业注册库(Cochrane Airways Group Specialised Register)、MEDLINE、Embase、综述文章和相关文章的参考文献列表。完全纳入本系统综述的最新检索是在2016年6月进行的。
纳入排除标准
在患有哮喘的少数民族成人或儿童中比较特定文化哮喘教育计划与普通哮喘教育计划或常规照护使用的随机对照试验(randomised controlled trials, RCTs)。
资料收集与分析
两位综述作者独立筛选、提取和评价纳入的资料。如果需要,我们联系研究作者以获取更多信息。
主要结果
在本次综述更新中,增加了另外三项研究和220名受试者。共有7项RCTs(成人2项,儿童4项,儿童和成人各1项),有837名来自少数民族群体的哮喘患者(年龄从1至63岁)符合本综述的纳入条件。研究的方法学质量从极低到低不等。对于我们的主要结局(随访期间哮喘恶化)来说,所有结局的证据质量都为低。在成年人中,与普通计划或常规照护相比,使用特定文化计划并没有显著减少两项研究的以下方面的受试者人数,这两项研究共有294名受试者:随访期间出现一次或多次的恶化(比值比(odds ratio, OR)=0.80, 95% 置信区间(confidence interval, CI) [0.50, 1.26])、12个月以上的住院(OR=0.83, 95% CI [0.31, 2.22])和病情恶化需要口服皮质类固醇(OR=0.97, 95% CI [0.55, 1.73])。然而,在两项研究中,使用特定文化计划改善了280名成年人的哮喘生活质量评分(均差(mean difference, MD)=0.26,95% CI [0.17, 0.36])(尽管MD小于评分的最小重要差异)。在儿童中,两项涉及305名儿童的研究显示,使用特定培养方案能够减轻需要住院治疗的严重哮喘恶化(率比=0.48,95% CI [0.24, 0.95])、一项涉及62名儿童的哮喘对照的研究和三项涉及213名儿童的研究在生活质量方面优于通用方案或常规照护,但在来自两项研究的100名儿童中,随访期间的加重次数(OR=1.55, 95% CI [0.66, 3.66])或加重次数(MD=0.18,95% CI [‐0.25, 0.62])多于优于通用方案或常规照护。
作者结论
现有证据表明,针对少数民族的成人和儿童的特定文化教育计划可能有效改善哮喘相关结局。本系统综述受到研究数量小和极低至低质量证据的限制。并非所有哮喘相关结局都可以通过针对成人和儿童的特定文化计划得到改善。然而,虽然改进的特定文化教育计划通常更耗时,但本综述的结果建议针对少数民族的儿童和成人使用特定文化哮喘教育计划。然而,需要更稳健的随机对照试验来进一步提高证据质量,并确定特定文化计划的成本效益。
PICO
简语概要
针对患有哮喘的少数民族儿童和成人的文化特定计划
系统综述背景
少数民族的哮喘患者哮喘预后较差。具有特定文化背景的哮喘教育可能会改善哮喘相关结局。
系统综述问题
特定文化的哮喘教育计划(与普通哮喘教育计划或常规照护相比)能否改善少数民族的儿童和成人哮喘相关结局?
我们发现了什么证据?
本次系统综述更新纳入了7项研究,共涉及837名受试者,年龄从1岁到63岁不等。该系统综述受到研究样本量小和证据质量极低至低的限制,。在成人中,我们发现特定文化计划并没有改善我们的任何主要结局,但在改善生活质量方面更好(尽管均差小于得分的最小重要差异)(次要结局)。然而,在儿童中,当结合研究资料时,特定文化计划减轻了需要住院治疗的严重恶化(主要结局),而单个研究显示改善了哮喘控制、哮喘知识和依从性的次要结局。
结论
现有证据表明,针对少数民族的成人和儿童的特定文化教育计划可能有效改善哮喘相关结局。尽管需要更稳健的证据,但在慢性病治疗以及健康结局和文化的复杂背景下,哮喘教育计划应尽可能具有文化特异性。在没有任何经济资料的情况下,还需要成本效益研究。
证据质量
所有结局的证据质量从极低至低不等。
Authors' conclusions
Summary of findings
| Culture‐specific asthma education program compared to Generic asthma education (or usual care) for asthma in children | ||||||
| Patient or population: Children from minority groups with doctor diagnosed asthma Settings: Any Intervention: Culture‐specific asthma education program Comparison: Generic asthma education program (or usual care) | ||||||
| Outcomes | Anticipated absolute effects* (95% CI) | Relative effect | No of Participants | Quality of the evidence | Comments | |
| Risk with generic asthma education or usual care | Risk with Culture‐specific asthma education program | |||||
| Severe exacerbations requiring hospitalisation over the study period follow‐up: 6‐12 months | 434 per 1,000 | 545 per 1000 (336 to 737) | OR 1.55 (0.6 to 3.66) | 88 (1 RCT) | ⊕⊕⊝⊝ | |
| Number of exacerbations over 52 weeks follow‐up: 12 months | ‐ | Mean number of exacerbations over 52 weeks (exacerbation rate) in the intervention group was 0.18 MD higher (0.25 lower to 0.62 higher) | ‐ | 110 | ⊕⊕⊕⊝ | |
| Severe exacerbations requiring hospitalisation over the study period follow‐up: 6‐12 months | RR 0.48 (0.24 to 0.95) | ‐ | 305 | ⊕⊕⊕⊝ | ||
| *The risk in the intervention group (and its 95% confidence interval) is based on the assumed risk in the comparison group and the relative effect of the intervention (and its 95% CI). | ||||||
| This table was created using the GRADE Pro software (GRADEpro GDT 2015) GRADE Working Group grades of evidence | ||||||
| * Only one study with small number of participants was included in this analysis. This RCT was unblinded (downgrades for risk of bias and imprecision) (Valery 2010) # One study by Valery 2010 carried 85.4% of the weight of the results, which may have introduced bias. This RCT was also unblinded (downgrades for risk of bias and imprecision). ^ One study carried 75.1% of the analysis weight (Canino 2008). Both studies (Canino 2008; Valery 2010) were unblinded which may have introduced bias (downgrades for risk of bias and inconsistency). | ||||||
| Culture‐specific asthma education program compared to generic asthma education (or usual care) for asthma in adults | ||||||
| Participant or population: Adults from minority groups with doctor diagnosed asthma | ||||||
| Outcomes | Anticipated absolute effects* (95% CI) | Relative effect | № of participants | Quality of the evidence | Comments | |
| Risk with generic asthma education or usual care | Risk with Culture‐specific asthma education program | |||||
| Number of participants who had one or more exacerbation of the study period follow‐up: 12 months | 559 per 1,000 | 504 per 1000 | OR 0.80 | 294 | ⊕⊝⊝⊝ | |
| Number of participants requiring oral corticosteroids over the study period follow‐up: 12 months | 203 per 1,000 | 198 per 1000 | OR 0.97 | 294 | ⊕⊝⊝⊝ | |
| Severe exacerbations requiring hospitalisation over the study period follow‐up: 12 months | 63 per 1,000 | 53 per 1000 | OR 0.83 | 294 | ⊕⊝⊝⊝ | |
| *The risk in the intervention group (and its 95% confidence interval) is based on the assumed risk in the comparison group and the relative effect of the intervention (and its 95% CI). | ||||||
| This table was created using the GRADE Pro software (GRADEpro GDT 2015) GRADE Working Group grades of evidence | ||||||
| * The sole study (Moudgil 2000) was of very low quality. There were many uncertainties in this study particularly with regard to outcomes reported (e.g. participants from the age of 11 were included, however the data presented combine adult data, thus outcomes are not shown separately for the paediatric population), allocation concealment, performance/detection bias, reporting bias and imprecision (3 downgrades for these items). | ||||||
Background
Description of the condition
Asthma education is regarded as an important management step in national asthma guidelines (National Asthma Council Australia 2015; BTS 2016). Asthma education, defined as provision of information on asthma, encompasses various formats which include face‐to‐face encounters, group sessions, outreach, home visits, provision of asthma action plans, recognition of loss of asthma control and self‐management skills (BTS 2016). The effects on asthma‐related outcomes of many of these various forms of education have been addressed in other Cochrane reviews (Powell 2002; Wolf 2002; Gibson 2002a; Gibson 2002b; Tapp 2007; Toelle 2011).
Racial and socio‐economic factors can influence both asthma severity and rates of recurrent acute presentations to emergency health facilities (Coultas 1994; de Oliveira 1999; Sin 2002; Haselkorn 2008). The reasons for this are unclear, however contributing factors are arguably likely to include broad service delivery issues rather than a reflection of intrinsic asthma severity (Enarson 1999; Chang 2002). Other cultural influences and barriers on the management of asthma include symptom perception, low literacy levels, and understanding of disease and self‐management (Enarson 1999; Poureslami 2012; Stewart 2013; Harrington 2015).
Description of the intervention
An appropriate model of care is important to successfully deliver services to improve outcomes for people with asthma (Partridge 2000; Chang 2002; Mitchell 2016). The model of care should arguably be culturally appropriate (Enarson 1999; Poureslami 2012; Press 2012) and modified to fit within the local context. As outlined by the World Health Organization's model of health care for chronic diseases in low‐income settings, "health care should facilitate an ongoing relationship between provider and patient and help patients to make full use of their own and their community's resources for health" (Swartz 2002). This is further supported by the implementation of chronic care models in low‐ to middle‐income countries to facilitate chronic disease care (Beaglehole 2008) and asthma guidelines (National Asthma Council Australia 2015; BTS 2016). Not surprisingly, in the health literature, the model of care for chronic diseases in Indigenous people includes the involvement of Indigenous healthcare workers (IHWs) (Hamdorf 1996; Chino 2006; Abbott 2007). Amongst other factors, involvement of IHWs in a supportive service delivery system would theoretically facilitate provider‐patient relationships and could potentially reduce prejudices and inequities that exist in some areas of healthcare systems (Eades 2000; Schmidt 2016). The involvement of IHWs specifically as an inclusion factor has been addressed in another Cochrane review (Chang 2010).
How the intervention might work
For a variety of reasons (e.g. availability) not all culture‐specific asthma programmes involve intervention by IHWs (Anderson 2004). Also, many minority groups are non‐Indigenous to their country of residence (e.g. Latino groups in the United States of America). People from these groups have also been shown to have poorer asthma outcomes (Anderson 2004; La Roche 2006; Alicea‐Alvarez 2014). Furthermore, there is a growing body of literature highlighting the need to tailor asthma education programs specifically for ethnic and cultural groups to improve asthma outcomes (Poureslami 2012; Press 2012; Douglas 2013; Stewart 2013; Alicea‐Alvarez 2014; Speck 2014; National Asthma Council Australia 2015; BTS 2016). It is therefore not surprising that publications such as the Australian National Strategic Improvement Framework for Asthma makes special reference to disadvantaged/minority groups (NHPAC 2006). However, culture‐specific programmes are likely more expensive than generic programmes as they involve specifically designed programmes to fit within the local context. It is therefore important that the efficacy of culture‐specific education programmes for asthma is systematically examined.
There is no universally accepted definition of a culture appropriate program; however it usually refers to adapting the program to the culture‐values, language, and/or using educators that come from the same culture, inclusion of beliefs and practices, culturally appropriate role models, involvement of local community health workers to support clinical teams, to that of the recipients (BTS 2016). Such adaptation impacts on the understanding and/or how well it is received and thus more likely to be effective (compared to non adapted programs).
Why it is important to do this review
Arguably, the most important asthma education outcome is to improve self‐management, so as to prevent morbidity and death from acute exacerbations. Other outcomes include reduction of day to day morbidity from asthma symptoms (e.g. improved asthma control scores and quality of life measures) and objective measurements of asthma severity (e.g. lung function data) (National Asthma Council Australia 2015; BTS 2016).
This systematic review update examines whether culture‐specific asthma education programmes improve asthma‐related outcomes in children and adults from minority groups who have asthma. This review update will provide much needed evidence to guide asthma specific clinical practice guidelines and health policy.
Objectives
To determine whether culture‐specific asthma education programmes in comparison to generic asthma education programmes or usual care, improve asthma‐related outcomes in children and adults diagnosed with asthma who belong to minority groups.
Methods
Criteria for considering studies for this review
Types of studies
We included randomised controlled trials (RCTs) with parallel group design, comparing specifically developed culture‐orientated asthma education programmes in comparison to generic asthma education programmes or usual care for children and adults who belong to minority groups.
Types of participants
Inclusion criteria: Children (≤ 18 years) and adults from minority groups with physician diagnosed asthma. Minority was defined by study authors according to their respective country's definition.
Exclusion criteria: Eosinophilic bronchitis, asthma related to an underlying lung disease such as bronchiectasis and chronic obstructive airway disease, or diagnostic categories such as 'cough variant asthma' and 'wheezy bronchitis' where controversy exists.
Types of interventions
We included RCTs involving comparisons of specifically developed culture‐orientated asthma programmes with their local generic asthma education programmes or usual care. We considered studies that involved the use of other education and other interventions for inclusion if all participants had equal access to such interventions. An education programme is defined as a programme which transfers information about asthma in any form, including but not limited to, adapting the program to the culture‐values, language, and/or using educators who come from the same culture, inclusion of beliefs and practices, culturally appropriate role models, involvement of local community health workers to support clinical teams etc,
Types of outcome measures
Attempts were made to obtain data on at least one of the following outcome measures. All analyses were planned separately for adults and children.
Primary outcomes
Asthma exacerbations during follow‐up defined as:
-
Number of participants who had one or more exacerbation over the study period
-
Number of exacerbations over 52 weeks (exacerbation rate)
-
Severe exacerbations requiring oral corticosteroids over the study period
-
Severe exacerbations requiring hospitalisation over the study period
Secondary outcomes
-
Objective measurements of asthma control (FEV1, peak flow, airway hyper‐responsiveness)
-
Asthma Control Score (score ≤ 19 = uncontrolled asthma)
-
Asthma quality of life (QoL) score
-
Other asthma symptom scores (e.g. diary cards)
-
Adherence outcomes
-
Asthma knowledge factors
-
Economic data
Search methods for identification of studies
Electronic searches
Studies were identified from the following sources.
-
The Cochrane Airways Group Specialised Trials Register (1950 to June 2016).
-
The Cochrane Central Register of Controlled Trials (CENTRAL), the Cochrane Library, 2016, Issue 6.
-
MEDLINE (1950 to June 2016). Topic search strategy combined with the RCT search filter as outlined in the Airways Group module.
-
Embase (1980 to June 2016).Topic search strategy combined with the RCT search filter as outlined in the Airways Group module.
-
Clinical trials registries: ClinicalTrials.gov and the WHO trials portal (all years to June 2016).
Conference abstracts and grey literature were searched for through the CENTRAL database. We did not impose any restrictions on language of publication. Full search strategies are listed in Appendix 1.
Searching other resources
In addition to the electronic search, we checked reference lists of relevant publications for additional studies.
Data collection and analysis
Selection of studies
Retrieval of studies: Using article titles abstracts, or descriptors, two review authors (EJB and ABC in original and 2009 reviews; GBM and ABC in search from 2009 to 2016) independently reviewed literature searches to identify potentially relevant studies for full review. They conducted searches of bibliographies and texts to identify additional studies. From the full‐text articles, the two review authors independently assessed studies for inclusion on the basis of specific criteria.
Data extraction and management
We had no disagreements but had planned to resolve disagreements through discussion with another review author (PSM). We extracted data using a standardised data collection form and entered the data in Review Manager 5.3 (Review Manager (RevMan)), in accordance with recommendations provided in the Cochrane Handbook for Systematic Review of Interventions (Higgins 2011). When required, we sought further information from study authors. We recorded the selection process in the PRISMA flow diagram (Figure 1).

Study flow diagram.
Assessment of risk of bias in included studies
Two review authors (GBM and ABC) independently assessed risk of bias for each study using the criteria outlined in the Cochrane Handbook for Systematic Review of Interventions (Higgins 2011). It was planned that disagreements would be resolved by discussion or by third party adjudication. We assessed risk of bias according to the following domains.
-
Allocation sequence generation (selection bias)
-
Concealment of allocation (selection bias)
-
Blinding of participants (performance bias)
-
Outcome assessment (detection bias)
-
Incomplete outcome data (attrition bias)
-
Selective outcome reporting (reporting bias)
We graded each potential source of bias as low, unclear or high and provided a justification for our judgement in the "Risk of bias" tables (Figure 2).

Risk of bias summary: review authors' judgements about each risk of bias item for each included study.
Measures of treatment effect
We analysed dichotomous data as odds ratios (OR) and continuous data as mean difference (MD) and planned to use standardised mean difference (SMD) if necessary. We then entered data presented as a scale with a consistent direction of effect. We undertook meta‐analyses only where it was meaningful. This took into account differences in study populations, inclusion/exclusion criteria, interventions, outcome assessment, and estimated effect size. We described skewed data which was reported as medians and interquartile ranges (IQR) in the text.
Unit of analysis issues
For dichotomous data, we reported the proportion of participants contributing to each outcome in comparison with the total number randomised. For rate ratios of common events whereby one participant may have more than one event, generic inverse variance (GIV) was used. The rate ratios were taken from the published papers and the standard errors calculated from confidence intervals or P values published in the papers. Cross‐over trials are not appropriate for this intervention and therefore were not planned for inclusion in any meta‐analysis performed.
Dealing with missing data
We planned to contact investigators or study sponsors to verify key study characteristics and to provide missing numerical outcome data when necessary. Three study authors (Canino 2008; Poureslami 2012; Valery 2010) were contacted for further information, with responses from all three (Canino 2008; Poureslami 2012; Valery 2010).
Assessment of heterogeneity
It was proposed that any heterogeneity between the study results would be described and tested to see if it reached statistical significance using a Chi2. The 95% confidence interval (CI), estimated using a random‐effects model, would be included whenever there are concerns about statistical heterogeneity. Heterogeneity is considered significant when the P value is less than 0.10 (Higgins 2011).
Assessment of reporting biases
If reporting bias was suspected (see 'Selective reporting (reporting bias)' in the 'Risk of bias in included studies' table), we planned to contact the study authors to ask them to provide missing outcome data. We planned that if missing data were not provided, and if this was thought to introduce serious bias, the impact of including such studies in the overall assessment would be explored through a sensitivity analysis.
Data synthesis
The results from studies that met the inclusion criteria and which reported any of the outcomes of interest (as defined above) were included in the subsequent meta‐analyses. The summary weighted rate ratio and 95% CI (fixed‐effect model) was calculated (Review Manager (RevMan) using generic inverse ratio (GIV), whereby one participant may have more than one event. The risk ratios were taken from the published papers and the standard errors were calculated from CIs or P values in the published papers. The outcome indices would be assumed to be normally distributed continuous variables so theMD in outcomes could be estimated. If studies had reported outcomes using different measurement scales, we planned to estimate the SMD.
'Summary of findings' (SoF) tables
We created 'Summary of findings' tables, using the primary outcomes (where able) (summary of findings Table for the main comparison; summary of findings Table 2)
Subgroup analysis and investigation of heterogeneity
We planned to carry out the following a priori subgroup analysis.
-
Different settings (rural versus non‐rural: as defined by study authors)
Sensitivity analysis
Sensitivity analyses were planned to assess the impact of the potentially important factors on the overall outcomes.
-
Study quality (adequate allocation concealment and blinding)
-
Study size
-
Variation in the inclusion criteria
-
Differences in outcome measures
-
Analysis using random‐effects model
-
Analysis by "treatment received"
Results
Description of studies
See Characteristics of included studies, Characteristics of excluded studies and Characteristics of ongoing studies.
Results of the search
From the previous versions of this review (2007 and 2009), the Cochrane Airways Group Specialised Register (CAGR) identified 228 potentially relevant titles (29 abstracts with four studies satisfying the inclusion criteria for the reviews) (Figure 1). An additional 170 articles were identified from the updated search (up to June 2016), with a further four titles identified from reference lists. After duplicates were removed, 96 titles were considered for the review. After assessing abstracts, 20 studies were retrieved for full review, 15 studies were excluded, with three additional studies (Valery 2010; Poureslami 2012; Grover 2016) fulfilling the eligibility criteria for this update (Figure 1). Two other studies remain ongoing at the time of the review (Janevic 2012; Patel 2014) (see'Characteristics of ongoing studies'). Another two studies are awaiting classification (Buist 2001; Butz 2004) (see 'Characteristics of studies awaiting classification'). An update search run in June 2017 returned three potentially relevant trials which have been added to Studies awaiting classification (Feldman 2016; Griffiths 2016; Patel 2016) and have not been fully incorporated into the review.
Included studies
For this review update seven studies were included (see 'Characteristics of included studies'). A total of 837 participants with asthma from an ethnic minority group were included in this review. Two studies were multi‐centre (Moudgil 2000; Valery 2010) and five were single‐centre studies (Blixen 2001; La Roche 2006; Canino 2008; Poureslami 2012; Grover 2016). Two studies (Blixen 2001; Poureslami 2012) examined adults and four studies examined children (La Roche 2006; Canino 2008; Valery 2010; Grover 2016). The study by (Moudgil 2000) included both adults and children, however specific results for adults and children were not presented in the published paper. The study by (Poureslami 2012), reported outcomes from four treatment groups. For our analysis, we chose to report data from group three (intervention) and group four (control) as we believe group three was the true intervention (participants viewed both the community and knowledge video). The study duration varied ranging from six to 12 months. Exacerbations were defined differently in each study. Culture‐specific programs and controls were defined differently for each study and are further described in (Table 1).
| Study ID | Setting | Definition of minority | Participants | Description of Culture‐specific intervention | Description of control |
| Paediatric studies | |||||
| Community Health Centre | African‐American and Hispanic people living in the USA | African‐American or Hispanic descent, children aged 7‐13 years (n = 22) | Multi‐family asthma group treatment (MFAGT) was based on allocentric self‐orientation and socio‐economic context of ethnic minorities. Program delivery included a Hispanic and African‐American educator/psychologist emphasising relational and collaborative asthma management among children, families, primary physician, and mental health specialist (as opposed to learning in isolation from others). Families received three one‐hour education sessions (separate days) covering three modules 1. Identify and monitor asthma symptoms; effectively use medications/resources (e.g. peak flow, medications) to control symptoms. 2. Identifying and preventing asthma triggers 3. Preventing and coping with an asthma attack (e.g. asthma action plans) | Standard Psycho‐educational Asthma Intervention (SPAI). SPAI has the same 3 education modules as intervention group but followed a structured teaching approach without locating asthma symptoms within the socioeconomic or cultural context. | |
| Home visits | Socially disadvantaged (low‐income and poor) Puerto Rican families living in the USA. They were identified from the national health plan insurance claims database | Poor Puerto Rican children aged 5 to 12 years (n = 221) | Eight asthma education modules, delivered at 2 home visits with telephone contact for follow‐up and reinforcement of recommended plans and assignments. Modules were culturally adapted with inclusions such as common practices and myths that Puerto Rican parents have about asthma, home remedies, culturally congruent pictures, and common asthma triggers in the island, such as Sahara dust and eruptions from Caribbean volcanoes. | Participants given 5 flyers that contained information on asthma (e.g. what is asthma, control and rescue medications, common allergens (including food) and triggers, how to take care of asthma equipment. | |
| Community Health Centre | First nations people of Australia who make up a minority of the whole Australian population. They are generally a socially disadvantaged group in a high‐income country | Aboriginal or Torres Strait Islander children aged < 18 years (n = 113) | Three additional education sessions delivered by trained Indigenous Health Care Workers, using existing paediatric asthma and respiratory education resources which were adapted to support Torres Strait culture at baseline, 1, 3 and 6 months | Education session (identical to intervention group) delivered at baseline | |
| Hospital (chest clinic) | Indian residents whose first language was not English living in India | Indian children aged between 7 and 12 years (n = 40) | Culturally adapted asthma education program to Indian parents and children with asthma (underpinned by GINA guidelines) using age appropriate, graphically appealing and culturally relevant educational materials. The education program was designed based on key principles of health education and pedagogy and intervention delivered by 2 pharmacists. Asthma education was delivered over 1 hr with child/family, workbooks, goal setting and setting asthma action plan with physician. | Parents and children were given a standard information pack for asthma in line with GINA guidelines. | |
| Adult studies | |||||
| General practitioners | A sub group of Indian sub‐continent people living in the UK whose first language was not English | White European (WE) or Indian sub‐continent (ISC) participants aged between 11 to 59 years (n = 689) | Individual asthma education session of 40 minutes duration with an asthma educator fluent in each participants own dialect (e.g. English, Punjabi, Hindi or Urdu). Education sessions included; advising GP changes to treatment; optimising treatment, drug delivery, technique, improved knowledge of asthma, disease severity and medication. | Usual care and follow‐up; 'generic' asthma programme. | |
| Hospital | African‐American people living in the USA. They are generally a socially disadvantaged group in a high‐income country | African‐American adults aged between 18 to 50 years (n = 28) | Three one‐hour individual asthma self‐management educational sessions; workbook modified to be culturally appropriate to African Americans; MDI technique and peak flow monitoring video featuring a well‐known African‐American asthma researcher. | Usual care and follow‐up; 'generic' asthma programme. | |
| Usually home or pulmonary clinic | Immigrants to Canada whose first language was not English (e.g. non‐Indigenous to Canada) | Migrants in greater Vancouver Area, who spoke Mandarin, Cantonese or Punjabi with asthma aged > 21 years (n = 92) | Effectiveness of different formats of culturally and linguistically modified asthma education and their impact on self‐management.Participants were allocated to one of three groups below. 1. Physician‐led knowledge video 2. Patient‐generated community video 3. Knowledge and community video | Received a pictorial pamphlet on asthma. | |
Participants
The seven studies used different inclusion and exclusion criteria for participation. All participants had 'doctor diagnosed asthma', but the definition varied across the studies.
Paediatric studies
La Roche 2006 enrolled families (of African‐American or Hispanic descent) with children aged one to 13 years with physician diagnosed asthma. Canino 2008 enrolled poor (defined by utilisation of the Peurto Rico Health Insurance Administration Agency Plan which required that the family be close to the poverty level) Peurto Rican families, with a child aged five to 12 years who had utilised health services for asthma within the previous 12 months. Valery 2010 enrolled Australian Indigenous children (Aboriginal or Torres Strait Islander) aged one to 17 years from Thursday Island and Horn Island with doctor diagnosed asthma. The study by Grover 2016 enrolled Indian children aged seven to 12 years with asthma, who had at least two asthma‐related visits to hospital in the previous 12 months.
Adult studies
Moudgil 2000 enrolled participants (adults and children) with asthma aged 11 to 59 years from participating General Practices (GP) in the United Kingdom (UK). Specific data for children could not be obtained. Of the 689 participants, only 344 were from of an ethnic minority (i.e. Indian Sub‐Continent (ISC)). The remainder (n = 345) were of White European descent. We included this study in the review but only examined data relevant to the ISC participants as published outcomes were stratified by ethnic descent as well as intervention group allocation. Blixen 2001 enrolled African‐American adults, aged 18 to 50 years who had been hospitalised for at least one night with a primary diagnosis of asthma. Poureslami 2012 enrolled adults aged > 21 years with physician diagnosed asthma who had immigrated to Canada within the last 20 years, lived in the Greater Vancouver Area, and spoke Mandarin, Cantonese or Punjabi.
Outcomes
Paediatric studies
Three studies (La Roche 2006; Canino 2008; Valery 2010) used asthma exacerbations as their primary outcome. The study by Grover 2016 used paediatric asthma caregiver quality of life (QoL) as their primary outcome. For other primary outcomes, Canino 2008 was the only study to report the use of oral corticosteroids over the study period. Two studies (Canino 2008; Valery 2010) reported on severe asthma exacerbations requiring hospitalisation.
Secondary outcomes varied between studies. Two studies (Canino 2008; Valery 2010) used the change in Juniper Asthma QoL (Juniper 1992; Juniper 1993). Valery 2010 also reported on adherence outcomes using parents' descriptions of asthma action plan (AAP). Asthma knowledge factors were assessed differently between studies. La Roche 2006 used the individualism‐collectivism scale to measure asthma behavioural assessment for both career/parent and children; where Canino 2008 used change in carers knowledge on triggers and treatment. Grover 2016 used modified scores for asthma knowledge, asthma control and medication adherence.
Adult studies
Two studies (Moudgil 2000; Blixen 2001) used asthma exacerbations as their primary outcome. Moudgil 2000 also reported other primary outcomes such as the use of oral corticosteroids over the study period and severe exacerbations requiring hospitalisation.
Secondary outcomes varied between studies. Objective measurements (FEV1) were used in the Moudgil 2000 study. Symptoms of asthma (QoL) were used in the Moudgil 2000 and Blixen 2001 studies. Asthma knowledge factors were reported by a single study (Poureslami 2012). Poureslami 2012 reported on the proper use of inhaler technique and knowledge of asthma symptoms.
All study characteristics are described in the Characteristics of included studies table.
Excluded studies
The main reason that studies were excluded from the review related to non culture‐specific interventions in minority groups, or non‐randomised controlled studies (see 'Characteristics of excluded studies' table).
Risk of bias in included studies
Risk of bias for included studies are summarised in Figure 2.
Allocation
Valery 2010 was the sole study assessed at low risk for both selection bias domains, as the authors adequately described the method of randomisation using computer‐generated block randomisation sequencing with concealed allocation. Moudgil 2000 and Canino 2008 reported that randomisation was computer generated and randomly allocated, however did not describe the method of concealment allocation (unclear risk). The three remaining studies (Blixen 2001; La Roche 2006; Poureslami 2012) were assessed as an unclear risk; Blixen 2001 and Poureslami 2012 did not describe the method of randomisation or method of concealment allocation. La Roche 2006 reported that randomisation was computer generated, yet did not describe method or how the allocation method was maintained. The study by Grover 2016 reported that randomisation was generated randomly, however it was considered high risk, as the authors reported that allocation concealment was not implemented. There was an imbalance of allocation of treatment groups at baseline.
Blinding
One study (Poureslami 2012) was assessed as low risk for both blinding domains. The authors adequately described how outcome measures were assessed where blinding was not feasible. Two studies (Canino 2008; Grover 2016) were assessed as a high risk for both domains, as they did not describe how blinding was maintained for participants, study personal and did not describe if outcome assessors were blinded. The study by Valery 2010 was assessed as high risk for performance bias as participants and study personal were unblinded and unclear risk for detection bias,as it was not clear whether outcome assessors were blinded. The study by Blixen 2001 was assessed as high risk for performance bias, as participants were unblinded, but low risk for detection bias as outcome assessors were blinded to groups. The remaining two studies (Moudgil 2000; La Roche 2006;) were assessed as an unclear risk as study authors did not describe how blinding was maintained or if outcome assessors were blinded to treatment allocation.
Incomplete outcome data
Three studies (La Roche 2006; Canino 2008; Grover 2016) were assessed as low risk, as > 90% of participants were followed up. Three studies (Moudgil 2000; Poureslami 2012; Valery 2010) were assessed as an unclear risk. In the Moudgil 2000 study, clinical data were only available in 86% of participants and 76% for asthma QoL at the 12‐month follow‐up. Poureslami 2012 did not describe if any participants withdrew or were lost to follow‐up. The Valery 2010 study described that authors did not follow‐up five children due to costs of travel. The study by Blixen 2001 was assessed as high risk as only 46% of participants were able to be contacted for the six‐month follow‐up.
Selective reporting
Six studies (Moudgil 2000; Blixen 2001; La Roche 2006; Canino 2008; Valery 2010; Grover 2016) were assessed as low risk. They adequately described method of analysis (e.g. intention‐to‐treat or by per protocol analysis). Poureslami 2012 was assessed as an unclear risk, as they did not report complete baseline data (some variables presented as grouped data), thus it was difficult to determine differences between the four groups.
Other potential sources of bias
Sources of bias were determined by the review authors and reported in each 'Risk of bias' table.
Effects of interventions
See: Summary of findings for the main comparison Summary of findings (paediatric studies); Summary of findings 2 Summary of Findings (adult studies)
See 'Summary of findings' tables for the main comparisons (summary of findings Table for the main comparison; summary of findings Table 2).
Three paediatric (La Roche 2006; Canino 2008; Valery 2010) and two adult (Moudgil 2000; Blixen 2001) studies used asthma exacerbations as their primary outcome. The study by Grover 2016 did not report any primary outcome data. Primary and secondary outcome data are reported below in accordance to the adult or paediatric studies.
Paediatric studies (Comparison 1)
Primary outcome
Asthma exacerbations during follow‐up defined as:
Number of participants who had one or more exacerbations over the study period
Three studies (La Roche 2006; Canino 2008; Valery 2010) reported exacerbation data, however we were only able to obtain data for one study (Valery 2010), thus meta‐analysis was not possible. The study by Valery 2010 reported exacerbation data over a 12‐month period in 88 children. There was no significant difference between groups for this outcome (odds ratio (OR) 1.55, 95% confidence interval (CI) 0.66 to 3.66) (Analysis 1.1; Figure 3).

Forest plot of comparison: 1 Paediatric studies, outcome: 1.1 Number of participants who had one or more exacerbation over the study period.
Number of exacerbations over 52 weeks (exacerbation rate)
Combined data from two studies in 110 children (La Roche 2006; Valery 2010) did not show significant differences of the number of exacerbations over 52 weeks between groups (mean difference (MD 0).18, 95% CI ‐0.25 to 0.62) (Analysis 1.2; Figure 4). Canino 2008 presented data on emergency department (ED) presentations post intervention (in the following six‐month period), but these data could not be combined in the meta‐analysis.

Forest plot of comparison: 1 Paediatric studies, outcome: 1.2 Mean number of exacerbations over 52 weeks (exacerbation rate).
Severe exacerbations requiring oral corticosteroids over the study period
Canino 2008 reported this outcome over the 12‐month study period. The number of events per group include 33 in the culture‐specific group compared to 30 in the controls. We were, however unable to obtain further data from the study authors.
Severe exacerbations requiring hospitalisations
Combined data from two studies in 305 children (Canino 2008; Valery 2010) showed significantly improved outcomes in the culture‐specific group compared to the control group (Rate Ratio 0.48, 95% CI 0.24 to 0.95) (Analysis 1.3; Figure 5). It is important to note that Canino 2008 reported on hospitalisations for asthma in the six‐month period, whilst Valery 2010 study reported on hospitalisations for asthma in the 12‐month period.

Forest plot of comparison: 1 Paediatric studies, outcome: 1.3 Severe exacerbations requiring hospitalisation over the study period.
Secondary outcomes
Objective measurements of asthma control (FEV1, peak flow, airway hyper‐responsiveness)
No studies reported this outcome.
Asthma Control Score
Asthma Control Score
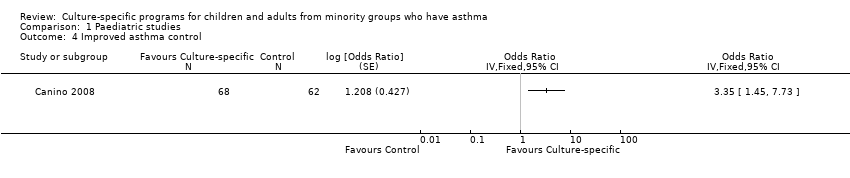
One study (Canino 2008) reported this outcome over the 12‐month study period, with the outcome being the proportion of children (n=62) with good asthma control based on the score. They reported an OR 3.35, (95% CI 1.45 to 7.73), significantly favouring the group receiving the culture‐specific intervention compared to the control group (Analysis 1.4; Figure 6).

Forest plot of comparison: 1 Paediatric studies, outcome: 1.4 Improved asthma control.
Asthma Control Questionnaire
One study (Grover 2016) reported this outcome in 40 children over the six‐month study period. They used a validated modified Hindi/English version of the asthma control questionnaire and reported a significant improvement in the intervention group compared to controls (Analysis 1.5).
Change in parent proxy asthma QoL score
Three studies (Canino 2008; Valery 2010; Grover 2016) reported this outcome. Data from Valery 2010 could not be combined.The follow‐up period varied for each study; six months in Grover 2016 and 12 months in Canino 2008 and Valery 2010. Additional data were obtained directly from the study authors (Valery 2010; Grover 2016). The study by Valery 2010 measured the change in parent QoL at 12 months (88 parents), but there was no significant difference between the groups (MD ‐0.04; 95% CI ‐0.25 to 0.17). The studies by Canino 2008 and Grover 2016 reported an improvement favouring the culturally‐specific group, but these were not significant. Canino 2008 in 109 parents (MD 3.15; 95% CI ‐0.13 to 6.43) and Grover 2016 in 16 parents (MD 0.70; 95% CI 0.26 to 1.14). The study by Grover 2016 was a feasibility study and of low quality and thus the certainty of this outcome is poor. The clinically minimum important difference (MID) in the QOL scores differ in accordance to the type of QoLs. The most common asthma QoL used in studies is that of Junper where the MID is 0.5 points (Juniper 1996).
Other asthma symptoms scores (e.g. diary cards)
No studies reported this outcome.
Adherence outcomes
Parent description of Asthma Action Plan (AAP)
Two studies reported on use of AAP (Valery 2010; Grover 2016) but data were only available in the Valery 2010 study. Valery 2010 measured the change in 88 parents' description of AAP when the child was well. The outcome significantly favoured the group who received the culture‐specific program (OR 2.82, 95% CI 1.17 to 6.83) (Figure 7). The study by Grover 2016 reported that none of the participants in either treatment group had a written AAP at baseline. All children in the intervention group were subsequently provided an AAP after baseline and education session. By six months, all participants in the intervention group reported they were confident in using their AAP. Children in the control group were provided a blank template in their information pack at baseline, however no additional data were provided if they were completed or used.

Forest plot of comparison: 1 Paediatric studies, outcome: 1.8 Parent description of AAP when child is well.
Self‐reported medication adherence (using brief medication questionnaire)
A single study (Grover 2016), measured adherence to medications in 40 participants using a validated medication adherence questionnaire (see Characteristics of included studies tables). Study authors reported an improvement in score from baseline in the culture‐specific group compared to the controls.
Asthma knowledge factors
Parent asthma knowledge scores
One study La Roche 2006 reported this outcome in 22 parents. They used a behavioural assessment score. There was an improvement in mean asthma knowledge scores favouring the culture‐specific intervention, but the confidence interval includes no between‐group difference (MD 1.90, 95% CI ‐0.04 to 3.84) (Analysis 1.10).
Child asthma knowledge scores
Only one study La Roche 2006 reported this outcome in 22 parents. The outcome significantly favoured the group who received the culture‐specific programme; MD 3.30, (95% CI 1.04 to 5.56) (Analysis 1.10).
Asthma knowledge (change in parent knowledge on triggers and treatment)
The Canino 2008 study presented change from baseline for 218 parents asthma knowledge on asthma triggers and treatment. This outcome favoured the group receiving the culture‐specific program (MD 0.94, 95% CI 0.31 to 1.57) (Analysis 1.10).
Change in asthma knowledge
The study by Grover 2016, used a customised knowledge questionnaire and reported that participants in the intervention group had significantly higher knowledge at the six‐month follow‐up compared to those in the control group.
Economic data
The La Roche 2006 study estimated that the economic savings made by using the culturally specific education programme, based on the reduction of ED presentations was $4675. The estimated total cost of the culturally specific programme for asthma education was $2295.
Adult studies (Comparison 2)
Primary outcome
Asthma exacerbations during follow‐up defined as:
Number of participants who had one or more exacerbations over the study period
Two studies (Moudgil 2000; Blixen 2001) reported exacerbations but numerical data were only provided by one paper (Moudgil 2000), therefore meta‐analysis was not possible. Blixen 2001 stated that there was no statistically significant differences between groups in asthma‐related healthcare resource (defined as hospitalisations, ED visits and physician visits) but no figures were given. In the Moudgil 2000 study, we used the outcome of GP consultations for asthma exacerbations in 294 participants. There was no significant differences between groups (OR 0.80; 95% CI 0.50 to 1.26) (Figure 8).

Forest plot of comparison: 2 Adult studies, outcome: 2.1 Asthma exacerbations during follow‐up.
Number of exacerbations over 52 weeks (exacerbation rate)
Two studies reported exacerbations over 52 weeks. Moudgil 2000 reported the number of events in each group (e.g. culture‐specific n = 218 compared to controls n = 212), however we were unable to obtain or calculate the standard error. Blixen 2001 stated that there was no statistically significant differences between groups but no figures were given. Thus meta‐analysis was not possible for this outcome.
Severe exacerbations requiring oral corticosteroids over the study period
One study (Moudgil 2000) reported data for this outcome. There was no significant difference between groups for those participants (n=294) who required additional corticosteroids (OR 0.97; 95% CI 0.55 to 1.73) (Figure 8).
Severe exacerbations requiring hospitalisations
Two studies (Moudgil 2000; Blixen 2001) reported this outcome, but numerical data could only be obtained from one study (Moudgil 2000). Blixen 2001 stated that there was no statistically significant differences between groups. There was no significant difference between the groups for number of participants (n=294) who were hospitalised for asthma (OR 0.83; 95% CI 0.31 to 2.22) (Figure 8).
Secondary outcomes
Objective measurements of asthma control (FEV1, peak flow, airway hyper‐responsiveness)
One study (Moudgil 2000) reported there was no statistically significant differences between groups for lung function, however numerical data were not provided, therefore meta‐analysis was not possible. We were unable to obtain any further details from study authors.
Asthma Control Score
No studies reported this outcome.
Change in asthma QoL score
Two studies reported this outcome (Moudgil 2000; Blixen 2001). An improved asthma QoL score (the change in score Analysis 2.2) was seen in those who received the culture‐specific education programme when compared to controls (MD 0.26, 95% CI 0.17 to 0.36) (Figure 9). For this outcome, the study authors (Moudgil 2000) report that 280 participants completed the end of study QoL, but the specific numbers for each group was not reported and we assumed that n = 140 was for each group. We could not obtain any further data from the primary author.

Forest plot of comparison: 2 Adult studies, outcome: 2.2 Change in AQLQ.
Other asthma symptoms scores (e.g. diary cards)
No studies reported this outcome.
Adherence outcomes
No studies reported this outcome.
Asthma knowledge factors
Proper use of inhaler
One study (Poureslami 2012) reported outcome data on improvement of the proper use of inhaler technique in 42 participants. There was no significant differences between groups (Analysis 2.3).
Knowledge of asthma symptoms
One study (Poureslami 2012) reported improvement in knowledge of asthma symptoms in 42 participants. There was no significant difference between groups (Analysis 2.3).
Economic data
No studies reported this outcome.
Subgroup analysis
Different settings (rural versus non‐rural)
We did not perform a separate subgroup analysis, as there was only one study in each subgroup (Analysis 1.2). The study by La Roche 2006 was conducted in an urban setting in Boston, USA, whereas the study by Valery 2010 was conducted in two Indigenous communities in remote Australia.
Sensitivity analysis
There were insufficient data to undertake any sensitivity analysis.
Discussion
Summary of main results
In this updated review, an additional three studies and 220 participants were added, with a total of seven randomised controlled trials (RCTs) with 837 participants with asthma from ethnic minority groups. Two were multi‐centre and five single‐centre with study durations ranging from six to 12 months. There were two adult‐based studies and four paediatric‐based studies, while one study included both adult and children. This updated review improves the evidence from the previous review supporting the use of culture‐specific asthma education programmes for adults and children from minority groups with asthma. The benefit of culture‐specific asthma education programmes (compared to generic or usual education programme) was stronger in children than in adults. In children, significant differences between groups were found for reducing hospitalisations and improving the outcomes of asthma control, asthma knowledge and adherence. In adults, asthma‐related QoL was the only outcome where there was statistical significance between groups (although clinically the evidence was weak). In both children and adults, there was no difference between groups for the outcome of all exacerbations. A single study examined economic cost and described a significant benefit in cost saving when culture‐specific asthma education programmes were used.
Overall completeness and applicability of evidence
This systematic review is substantially limited by few studies and by a lack of available data preventing combining outcomes for meta‐analysis. Statistical difference between the groups were not found in all outcomes, although this may be related to insufficient sample size (discussed below). While the studies shared some common themes, there were also differences among the studies; notably, the type of interventions used, ethnic groups being investigated and outcomes measured. Furthermore, several studies did not report follow‐up data for clinical outcomes; Blixen 2001 did not report hospitalisations, emergency department (ED) visits etc, and Moudgil 2000 did not report objective measurements e.g. peak flow. Also, La Roche 2006 and colleagues' study was small, leading to baseline imbalances in the asthma knowledge scores. It was also unclear whether there were any participants lost to follow‐up in the Poureslami 2012 study. The study by Grover 2016 was a small feasibility RCT which had some baseline imbalances at randomisation.
The absence of a significant difference between groups for all‐types of asthma exacerbations may be related to a type 1 error (inadequate sample size). Therefore, while both this review and the review from Tapp 2007 found no improvement in adult ED presentations or exacerbations over the study period, the type of educational intervention used can affect self‐reported asthma‐related QoL of participants. In this instance, we could theorise that the use of a culture‐specific programme enables participants (adults) to more fully engage in the education being provided and in turn have a positive effect on QoL scores. These results however should be interpreted with caution due to the small number of included studies that measured asthma QoL (two studies) and the relatively small sample size (n = 308) in those studies (Moudgil 2000; Blixen 2001). Similar to previous updates, we were unable to include results from Canino 2008, which also included an asthma QoL outcome. In children however, a reduction with severe asthma exacerbations requiring hospitalisations was seen (Figure 5).
For the purpose of this review, it was assumed that 'usual care' for asthma presentations would include the provision of generic asthma education, in accordance with recommendations such as the 1997 National Asthma Education and Prevention Program Guidelines (Edmond 1998). Therefore, while the studies by Blixen 2001 and Moudgil 2000 do not specify the nature of the education that control group participants received, it has been assumed that through the provision of 'usual care', participants would have received some form of education during the clinical encounter.
Ideally, this review would have included RCTs in both adults and children with larger sample sizes and have presented more data regarding asthma exacerbation outcomes (e.g. hospitalisations, ED visits, use of rescue oral corticosteroids). This review is limited by the relatively small number of studies and sample sizes, and by the high rate of attrition of participants (clinical outcomes were measured for 329 participants from an original total sample size of 396). It should be noted that three of the studies (Blixen 2001; La Roche 2006; Grover 2016) were pilot/feasibility studies. There were significant differences in several outcomes, however where outcomes did not reach statistical significance, the direction of results tended to favour the culture‐specific programmes.
It has been recognized by Swartz and Dick that in models of care for chronic diseases, the focus must be on the person in his or her own context (Swartz 2002). Certainly this ideal has been met with the intervention in the study by La Roche and colleagues, with one focus of the intervention being to locate the signs and symptoms of asthma within the cultural context of the participant and family (La Roche 2006). La Roche and colleagues also trialled their culturally specific intervention against a generic education programme (La Roche 2006), whereas the control groups in the two other included studies (Moudgil 2000; Blixen 2001) received 'usual care' (standard asthma education) and participants were asked to continue with their usual follow‐up routine. The interventions used by Blixen 2001 and Moudgil 2000 could be argued to be culturally modified, rather than culturally specific, with both studies using interventions that have been used in populations understood to be white participants, and modified through the use of language, images and other additions. However, the decision was made to include these two studies as it was felt that the modifications and delivery of the intervention were specific to the ethnic groups to which the participants belonged. It should also be noted that while all the studies trialled interventions in minority groups, only two studies (Valery 2010; Grover 2016) involved a population who were Indigenous to the study setting.
Quality of the evidence
The 'Summary of findings' tables report the available evidence for our primary outcomes related to asthma exacerbations and our justification for the quality of evidence (summary of findings Table for the main comparison; summary of findings Table 2). Overall, the quality of evidence of the studies was very low to low, due to methodological differences, lack of objective measurements, reporting and imprecision of data.
Potential biases in the review process
One of the authors of this review is the senior author on the Valery 2010 paper. Additional data were obtained by direct contact with A/Prof Valery and data extraction was performed by another review author using data from another Cochrane review (Chang 2010).
Agreements and disagreements with other studies or reviews
This review's findings are in agreement with the review examining the efficacy of involvement of an Indigenous healthcare worker (IHW) in comparison to absence of an IHW in asthma education programs in improving asthma‐related outcomes in Indigenous children and adults with asthma (Chang 2010). Other systematic reviews on culture‐specific interventions have like‐wise found that culture‐adapted programs were more efficacious than generic programs such as interventions that target smoking cessation, diet, and/or physical activity (Nierkens 2013). However, for health promotion interventions, other systematic reviews have also called for more evidence as there is yet insufficient evidence on the clinical effectiveness or cost‐effectiveness of these adapted approaches although it has been shown that culturally adapting interventions increases salience, acceptability and uptake (Liu 2012; Davidson 2014).
The results of another Cochrane review in adults found that asthma education interventions in the ED, while effective at reducing hospital admission, did not significantly reduce subsequent ED visits (Tapp 2007). The review by Tapp and colleagues also found no significant difference in QoL scores between treatment and control groups (Tapp 2007), whereas the review presented here found a significant improvement in asthma QoL scores for adult participants, although the difference between groups was lower then the minimum important difference for the QoL tool.

Study flow diagram.

Risk of bias summary: review authors' judgements about each risk of bias item for each included study.

Forest plot of comparison: 1 Paediatric studies, outcome: 1.1 Number of participants who had one or more exacerbation over the study period.

Forest plot of comparison: 1 Paediatric studies, outcome: 1.2 Mean number of exacerbations over 52 weeks (exacerbation rate).

Forest plot of comparison: 1 Paediatric studies, outcome: 1.3 Severe exacerbations requiring hospitalisation over the study period.

Forest plot of comparison: 1 Paediatric studies, outcome: 1.4 Improved asthma control.

Forest plot of comparison: 1 Paediatric studies, outcome: 1.8 Parent description of AAP when child is well.

Forest plot of comparison: 2 Adult studies, outcome: 2.1 Asthma exacerbations during follow‐up.

Forest plot of comparison: 2 Adult studies, outcome: 2.2 Change in AQLQ.

Comparison 1 Paediatric studies, Outcome 1 Number of participants who had one or more exacerbation over the study period.

Comparison 1 Paediatric studies, Outcome 2 Mean number of exacerbations over 52 weeks (exacerbation rate).

Comparison 1 Paediatric studies, Outcome 3 Severe exacerbations requiring hospitalisation over the study period.
Comparison 1 Paediatric studies, Outcome 4 Improved asthma control.

Comparison 1 Paediatric studies, Outcome 5 Asthma control questionnaire.

Comparison 1 Paediatric studies, Outcome 6 Improvement in carer's asthma QoL scores (parent/carer PACQLQ).

Comparison 1 Paediatric studies, Outcome 7 Change in Carers' Asthma QoL (PACQLQ).

Comparison 1 Paediatric studies, Outcome 8 Parent description of AAP when child is well.

Comparison 1 Paediatric studies, Outcome 9 Self‐reported medication adherence (brief medication questionnaire).

Comparison 1 Paediatric studies, Outcome 10 Asthma Knowledge Factors.

Comparison 2 Adult studies, Outcome 1 Asthma exacerbations during follow‐up.

Comparison 2 Adult studies, Outcome 2 Change in AQLQ.

Comparison 2 Adult studies, Outcome 3 Asthma Knowledge Factors.
| Culture‐specific asthma education program compared to Generic asthma education (or usual care) for asthma in children | ||||||
| Patient or population: Children from minority groups with doctor diagnosed asthma Settings: Any Intervention: Culture‐specific asthma education program Comparison: Generic asthma education program (or usual care) | ||||||
| Outcomes | Anticipated absolute effects* (95% CI) | Relative effect | No of Participants | Quality of the evidence | Comments | |
| Risk with generic asthma education or usual care | Risk with Culture‐specific asthma education program | |||||
| Severe exacerbations requiring hospitalisation over the study period follow‐up: 6‐12 months | 434 per 1,000 | 545 per 1000 (336 to 737) | OR 1.55 (0.6 to 3.66) | 88 (1 RCT) | ⊕⊕⊝⊝ | |
| Number of exacerbations over 52 weeks follow‐up: 12 months | ‐ | Mean number of exacerbations over 52 weeks (exacerbation rate) in the intervention group was 0.18 MD higher (0.25 lower to 0.62 higher) | ‐ | 110 | ⊕⊕⊕⊝ | |
| Severe exacerbations requiring hospitalisation over the study period follow‐up: 6‐12 months | RR 0.48 (0.24 to 0.95) | ‐ | 305 | ⊕⊕⊕⊝ | ||
| *The risk in the intervention group (and its 95% confidence interval) is based on the assumed risk in the comparison group and the relative effect of the intervention (and its 95% CI). | ||||||
| This table was created using the GRADE Pro software (GRADEpro GDT 2015) GRADE Working Group grades of evidence | ||||||
| * Only one study with small number of participants was included in this analysis. This RCT was unblinded (downgrades for risk of bias and imprecision) (Valery 2010) # One study by Valery 2010 carried 85.4% of the weight of the results, which may have introduced bias. This RCT was also unblinded (downgrades for risk of bias and imprecision). ^ One study carried 75.1% of the analysis weight (Canino 2008). Both studies (Canino 2008; Valery 2010) were unblinded which may have introduced bias (downgrades for risk of bias and inconsistency). | ||||||
| Culture‐specific asthma education program compared to generic asthma education (or usual care) for asthma in adults | ||||||
| Participant or population: Adults from minority groups with doctor diagnosed asthma | ||||||
| Outcomes | Anticipated absolute effects* (95% CI) | Relative effect | № of participants | Quality of the evidence | Comments | |
| Risk with generic asthma education or usual care | Risk with Culture‐specific asthma education program | |||||
| Number of participants who had one or more exacerbation of the study period follow‐up: 12 months | 559 per 1,000 | 504 per 1000 | OR 0.80 | 294 | ⊕⊝⊝⊝ | |
| Number of participants requiring oral corticosteroids over the study period follow‐up: 12 months | 203 per 1,000 | 198 per 1000 | OR 0.97 | 294 | ⊕⊝⊝⊝ | |
| Severe exacerbations requiring hospitalisation over the study period follow‐up: 12 months | 63 per 1,000 | 53 per 1000 | OR 0.83 | 294 | ⊕⊝⊝⊝ | |
| *The risk in the intervention group (and its 95% confidence interval) is based on the assumed risk in the comparison group and the relative effect of the intervention (and its 95% CI). | ||||||
| This table was created using the GRADE Pro software (GRADEpro GDT 2015) GRADE Working Group grades of evidence | ||||||
| * The sole study (Moudgil 2000) was of very low quality. There were many uncertainties in this study particularly with regard to outcomes reported (e.g. participants from the age of 11 were included, however the data presented combine adult data, thus outcomes are not shown separately for the paediatric population), allocation concealment, performance/detection bias, reporting bias and imprecision (3 downgrades for these items). | ||||||
| Study ID | Setting | Definition of minority | Participants | Description of Culture‐specific intervention | Description of control |
| Paediatric studies | |||||
| Community Health Centre | African‐American and Hispanic people living in the USA | African‐American or Hispanic descent, children aged 7‐13 years (n = 22) | Multi‐family asthma group treatment (MFAGT) was based on allocentric self‐orientation and socio‐economic context of ethnic minorities. Program delivery included a Hispanic and African‐American educator/psychologist emphasising relational and collaborative asthma management among children, families, primary physician, and mental health specialist (as opposed to learning in isolation from others). Families received three one‐hour education sessions (separate days) covering three modules 1. Identify and monitor asthma symptoms; effectively use medications/resources (e.g. peak flow, medications) to control symptoms. 2. Identifying and preventing asthma triggers 3. Preventing and coping with an asthma attack (e.g. asthma action plans) | Standard Psycho‐educational Asthma Intervention (SPAI). SPAI has the same 3 education modules as intervention group but followed a structured teaching approach without locating asthma symptoms within the socioeconomic or cultural context. | |
| Home visits | Socially disadvantaged (low‐income and poor) Puerto Rican families living in the USA. They were identified from the national health plan insurance claims database | Poor Puerto Rican children aged 5 to 12 years (n = 221) | Eight asthma education modules, delivered at 2 home visits with telephone contact for follow‐up and reinforcement of recommended plans and assignments. Modules were culturally adapted with inclusions such as common practices and myths that Puerto Rican parents have about asthma, home remedies, culturally congruent pictures, and common asthma triggers in the island, such as Sahara dust and eruptions from Caribbean volcanoes. | Participants given 5 flyers that contained information on asthma (e.g. what is asthma, control and rescue medications, common allergens (including food) and triggers, how to take care of asthma equipment. | |
| Community Health Centre | First nations people of Australia who make up a minority of the whole Australian population. They are generally a socially disadvantaged group in a high‐income country | Aboriginal or Torres Strait Islander children aged < 18 years (n = 113) | Three additional education sessions delivered by trained Indigenous Health Care Workers, using existing paediatric asthma and respiratory education resources which were adapted to support Torres Strait culture at baseline, 1, 3 and 6 months | Education session (identical to intervention group) delivered at baseline | |
| Hospital (chest clinic) | Indian residents whose first language was not English living in India | Indian children aged between 7 and 12 years (n = 40) | Culturally adapted asthma education program to Indian parents and children with asthma (underpinned by GINA guidelines) using age appropriate, graphically appealing and culturally relevant educational materials. The education program was designed based on key principles of health education and pedagogy and intervention delivered by 2 pharmacists. Asthma education was delivered over 1 hr with child/family, workbooks, goal setting and setting asthma action plan with physician. | Parents and children were given a standard information pack for asthma in line with GINA guidelines. | |
| Adult studies | |||||
| General practitioners | A sub group of Indian sub‐continent people living in the UK whose first language was not English | White European (WE) or Indian sub‐continent (ISC) participants aged between 11 to 59 years (n = 689) | Individual asthma education session of 40 minutes duration with an asthma educator fluent in each participants own dialect (e.g. English, Punjabi, Hindi or Urdu). Education sessions included; advising GP changes to treatment; optimising treatment, drug delivery, technique, improved knowledge of asthma, disease severity and medication. | Usual care and follow‐up; 'generic' asthma programme. | |
| Hospital | African‐American people living in the USA. They are generally a socially disadvantaged group in a high‐income country | African‐American adults aged between 18 to 50 years (n = 28) | Three one‐hour individual asthma self‐management educational sessions; workbook modified to be culturally appropriate to African Americans; MDI technique and peak flow monitoring video featuring a well‐known African‐American asthma researcher. | Usual care and follow‐up; 'generic' asthma programme. | |
| Usually home or pulmonary clinic | Immigrants to Canada whose first language was not English (e.g. non‐Indigenous to Canada) | Migrants in greater Vancouver Area, who spoke Mandarin, Cantonese or Punjabi with asthma aged > 21 years (n = 92) | Effectiveness of different formats of culturally and linguistically modified asthma education and their impact on self‐management.Participants were allocated to one of three groups below. 1. Physician‐led knowledge video 2. Patient‐generated community video 3. Knowledge and community video | Received a pictorial pamphlet on asthma. | |
| Outcome or subgroup title | No. of studies | No. of participants | Statistical method | Effect size |
| 1 Number of participants who had one or more exacerbation over the study period Show forest plot | 1 | 88 | Odds Ratio (M‐H, Fixed, 95% CI) | 1.55 [0.66, 3.66] |
| 2 Mean number of exacerbations over 52 weeks (exacerbation rate) Show forest plot | 2 | 110 | Mean Difference (IV, Fixed, 95% CI) | 0.18 [‐0.25, 0.62] |
| 3 Severe exacerbations requiring hospitalisation over the study period Show forest plot | 2 | 305 | Rate Ratio (Fixed, 95% CI) | 0.48 [0.24, 0.95] |
| 4 Improved asthma control Show forest plot | 1 | Odds Ratio (Fixed, 95% CI) | Totals not selected | |
| 5 Asthma control questionnaire Show forest plot | 1 | Mean Difference (IV, Fixed, 95% CI) | Totals not selected | |
| 6 Improvement in carer's asthma QoL scores (parent/carer PACQLQ) Show forest plot | 1 | 88 | Mean Difference (IV, Fixed, 95% CI) | ‐0.04 [‐0.25, 0.17] |
| 7 Change in Carers' Asthma QoL (PACQLQ) Show forest plot | 2 | Mean Difference (Fixed, 95% CI) | Subtotals only | |
| 8 Parent description of AAP when child is well Show forest plot | 1 | 88 | Odds Ratio (M‐H, Fixed, 95% CI) | 2.82 [1.17, 6.83] |
| 9 Self‐reported medication adherence (brief medication questionnaire) Show forest plot | 1 | Mean Difference (IV, Fixed, 95% CI) | Totals not selected | |
| 10 Asthma Knowledge Factors Show forest plot | 2 | Mean Difference (IV, Fixed, 95% CI) | Totals not selected | |
| 10.1 Parent/carer Asthma Knowledge (behavioural assessment ‐ score 0‐12) | 1 | Mean Difference (IV, Fixed, 95% CI) | 0.0 [0.0, 0.0] | |
| 10.2 Child Asthma Knowledge (behavioural assessment ‐ score 0‐12) | 1 | Mean Difference (IV, Fixed, 95% CI) | 0.0 [0.0, 0.0] | |
| 10.3 Parent/carer Asthma knowledge (triggers and treatment) | 1 | Mean Difference (IV, Fixed, 95% CI) | 0.0 [0.0, 0.0] | |
| Outcome or subgroup title | No. of studies | No. of participants | Statistical method | Effect size |
| 1 Asthma exacerbations during follow‐up Show forest plot | 1 | Odds Ratio (M‐H, Fixed, 95% CI) | Totals not selected | |
| 1.1 Number of participants who had one or more exacerbation over the study period | 1 | Odds Ratio (M‐H, Fixed, 95% CI) | 0.0 [0.0, 0.0] | |
| 1.2 Number of participants requiring oral corticosteroids over the study period | 1 | Odds Ratio (M‐H, Fixed, 95% CI) | 0.0 [0.0, 0.0] | |
| 1.3 Severe exacerbations requiring hospitalisation over the study period | 1 | Odds Ratio (M‐H, Fixed, 95% CI) | 0.0 [0.0, 0.0] | |
| 2 Change in AQLQ Show forest plot | 2 | Mean Difference (Fixed, 95% CI) | 0.26 [0.17, 0.36] | |
| 3 Asthma Knowledge Factors Show forest plot | 1 | Mean Difference (IV, Fixed, 95% CI) | Totals not selected | |
| 3.1 Proper use of inhaler technique | 1 | Mean Difference (IV, Fixed, 95% CI) | 0.0 [0.0, 0.0] | |
| 3.2 Knowledge of asthma symptoms | 1 | Mean Difference (IV, Fixed, 95% CI) | 0.0 [0.0, 0.0] | |