Antiviral prophylaxis for the prevention of chronic hepatitis C virus in patients undergoing liver transplantation
Referencias
References to studies included in this review
References to studies excluded from this review
Additional references
References to other published versions of this review
Characteristics of studies
Characteristics of included studies [ordered by study ID]
Ir a:
| Methods | Randomised clinical trial. | |
| Participants | Country: Italy. | |
| Interventions | The participants were randomly assigned to 1 of 2 groups. Timing of commencement of treatment: as soon as patients could tolerate food. | |
| Outcomes | Graft rejection and adverse effects of drug. | |
| Notes | Reasons for post‐randomisation drop‐out: initially 37 patients were randomised to 1 of 3 groups. Only 2 groups were included for this review. Overall, 7 patients died. It is not clear how many died in each group. Hence, these data could not be used in our review. Attempted to contact the authors in September 2010. No replies were received. Consent for liver donation: not stated. | |
| Risk of bias | ||
| Bias | Authors' judgement | Support for judgement |
| Random sequence generation (selection bias) | Unclear risk | Comment: this information was not available. |
| Allocation concealment (selection bias) | Unclear risk | Comment: this information was not available. |
| Blinding (performance bias and detection bias) | Unclear risk | Comment: this information was not available. |
| Incomplete outcome data (attrition bias) | High risk | Comment: post‐randomisation drop‐outs could be related to the outcomes. |
| Selective reporting (reporting bias) | High risk | Comment: important outcomes such as mortality and retransplantation were not reported. |
| Free from source of funding bias? | Unclear risk | Comment: this information was not available. |
| Methods | Randomised clinical trial. | |
| Participants | Country: USA. | |
| Interventions | The participants were randomly assigned to 1 of 2 groups. Timing of commencement of treatment: 3 weeks after liver transplantation. | |
| Outcomes | Mortality, graft rejection, and adverse effects. | |
| Notes | Attempted to contact the authors in September 2010. No replies were received. Consent for liver donation: not stated. | |
| Risk of bias | ||
| Bias | Authors' judgement | Support for judgement |
| Random sequence generation (selection bias) | Unclear risk | Comment: this information was not available. |
| Allocation concealment (selection bias) | Unclear risk | Comment: this information was not available. |
| Blinding (performance bias and detection bias) | Unclear risk | Comment: this information was not available. |
| Incomplete outcome data (attrition bias) | High risk | Comment: fibrosis and activity scores reported only in 12 patients in the intervention group and 11 patients in the control group. |
| Selective reporting (reporting bias) | High risk | Comment: important outcomes such as retransplantation were not reported. |
| Free from source of funding bias? | High risk | Quote: "supported by a grant from Roche Laboratories Inc., Nutley, NJ". |
| Methods | Randomised clinical trial. | |
| Participants | Country: USA. | |
| Interventions | The participants were randomly assigned to 1 of 2 groups. Timing of commencement of treatment: 10 to 26 weeks after liver transplantation. | |
| Outcomes | Mortality, graft rejection, and adverse effects. | |
| Notes | Reason for post‐randomisation drop‐outs: not stated. Attempted to contact the authors in September 2010. No replies were received. Consent for liver donation: not stated. | |
| Risk of bias | ||
| Bias | Authors' judgement | Support for judgement |
| Random sequence generation (selection bias) | Unclear risk | Comment: this information was not available. |
| Allocation concealment (selection bias) | Unclear risk | Comment: this information was not available. |
| Blinding (performance bias and detection bias) | Unclear risk | Comment: this information was not available. |
| Incomplete outcome data (attrition bias) | High risk | Comment: post‐randomisation dropouts could be related to outcomes. |
| Selective reporting (reporting bias) | High risk | Comment: important outcomes such as retransplantation were not reported. |
| Free from source of funding bias? | High risk | Quote: "Grant/Research Support: Roche". |
| Methods | Randomised clinical trial. | |
| Participants | Country: USA. Mean age: 59 years. | |
| Interventions | The participants were randomly assigned to 1 of 2 groups. Timing of commencement of treatment: day of liver transplantation. | |
| Outcomes | Mortality and adverse effects. | |
| Notes | Reasons for post‐randomisation drop‐outs: did not undergo transplantation (n = 1); did not receive treatment (n = 1). Attempted to contact the authors in February 2013. No replies were received. Consent for liver donation: not stated. The study report stated that ethical approval was obtained for the research. | |
| Risk of bias | ||
| Bias | Authors' judgement | Support for judgement |
| Random sequence generation (selection bias) | Unclear risk | Comment: this information was not available. |
| Allocation concealment (selection bias) | Unclear risk | Comment: this information was not available. |
| Blinding (performance bias and detection bias) | Low risk | Quote: "This randomized, double‐blind, placebo‐controlled trial was conducted at eight transplant centers between August 2010 and June 2011….The study sponsor, investigators, subjects and laboratory personnel were blinded to treatment assignment". |
| Incomplete outcome data (attrition bias) | Unclear risk | Comment: there were post‐randomisation drop‐outs. |
| Selective reporting (reporting bias) | High risk | Comment: important outcomes such as retransplantation were not reported. |
| Free from source of funding bias? | High risk | Quote: "This study was funded by MassBiologics, University of Massachusetts, Boston, MA. CTSA grant (UL1TR000067) awarded to Mt. Sinai School of Medicine for CRC research support. RTC was supported in part by NIH DK078772". |
| Methods | Randomised clinical trial. | |
| Participants | Country: USA. | |
| Interventions | The participants were randomly assigned to 1 of 3 groups. Timing of commencement of treatment: reperfusion of graft during liver transplantation. | |
| Outcomes | Mortality, retransplantation, and fibrosis worsening. | |
| Notes | Attempted to contact the authors in September 2010. Authors provided replies related to randomisation. Consent for liver donation: not stated. The study report stated that ethical approval was obtained for the research. | |
| Risk of bias | ||
| Bias | Authors' judgement | Support for judgement |
| Random sequence generation (selection bias) | Low risk | Quote: "The randomization sequence was computer generated" (author replies). |
| Allocation concealment (selection bias) | Low risk | Quote: "Each site held a sequence in sealed envelopes held by the pharmacy" (author replies). |
| Blinding (performance bias and detection bias) | Unclear risk | Comment: this information was not available. |
| Incomplete outcome data (attrition bias) | Low risk | Comment: there were no post‐randomisation drop‐outs. |
| Selective reporting (reporting bias) | Low risk | Comment: important outcomes such as mortality and retransplantation were reported. |
| Free from source of funding bias? | High risk | Quote: "C.V.S. (one of the authors) is an employee of Nabi Biopharmaceuticals". |
| Methods | Randomised clinical trial. | |
| Participants | Country: Italy. | |
| Interventions | The participants were randomly assigned to 1 of 3 groups. Timing of commencement of treatment: within 4 weeks after liver transplantation. | |
| Outcomes | Graft rejection. | |
| Notes | Attempted to contact the authors in September 2010. No replies were received. Consent for liver donation: not stated. | |
| Risk of bias | ||
| Bias | Authors' judgement | Support for judgement |
| Random sequence generation (selection bias) | Unclear risk | Comment: this information was not available. |
| Allocation concealment (selection bias) | Unclear risk | Comment: this information was not available. |
| Blinding (performance bias and detection bias) | Unclear risk | Comment: this information was not available. |
| Incomplete outcome data (attrition bias) | Low risk | Comment: there were no post‐randomisation drop‐outs. |
| Selective reporting (reporting bias) | High risk | Comment: important outcomes such as mortality and retransplantation were not reported. |
| Free from source of funding bias? | Unclear risk | Comment: this information was not available. |
| Methods | Randomised clinical trial. | |
| Participants | Country: USA. | |
| Interventions | The participants were randomly assigned to 1 of 2 groups. Timing of commencement of treatment: 2‐4 weeks after liver transplantation. | |
| Outcomes | Adverse effects. | |
| Notes | Attempted to contact the authors in September 2010. No replies were received. Consent for liver donation: not stated. | |
| Risk of bias | ||
| Bias | Authors' judgement | Support for judgement |
| Random sequence generation (selection bias) | Unclear risk | Comment: this information was not available. |
| Allocation concealment (selection bias) | Unclear risk | Comment: this information was not available. |
| Blinding (performance bias and detection bias) | Unclear risk | Comment: this information was not available. |
| Incomplete outcome data (attrition bias) | Unclear risk | Comment: this information was not available. |
| Selective reporting (reporting bias) | High risk | Comment: important outcomes such as mortality and retransplantation were not reported. |
| Free from source of funding bias? | Unclear risk | Comment: this information was not available. |
| Methods | Randomised clinical trial. | |
| Participants | Country: USA/ Israel. | |
| Interventions | The participants were randomly assigned to 1 of 3 groups. Timing of commencement of treatment: anhepatic phase of liver transplantation. | |
| Outcomes | Mortality. | |
| Notes | Attempted to contact the authors in September 2010. No replies were received. Consent for liver donation: not stated. The study report stated that ethical approval was obtained for the research. | |
| Risk of bias | ||
| Bias | Authors' judgement | Support for judgement |
| Random sequence generation (selection bias) | Unclear risk | Comment: this information was not available. |
| Allocation concealment (selection bias) | Unclear risk | Comment: this information was not available. |
| Blinding (performance bias and detection bias) | Low risk | Quote: "This was a multicenter, randomised, double‐blind, placebo‐controlled, dose‐escalation trial". |
| Incomplete outcome data (attrition bias) | Low risk | Comment: there were no post‐randomisation drop‐outs. |
| Selective reporting (reporting bias) | High risk | Comment: important outcomes such as retransplantation were not reported. |
| Free from source of funding bias? | High risk | Quote: "Supported by XTL Biopharmaceuticals Ltd., the developer of HCV‐AbXTL68". |
| Methods | Randomised clinical trial. | |
| Participants | Country: USA, Israel. | |
| Interventions | The participants were randomly assigned to 1 of 2 groups. Timing of commencement of treatment: within 2 weeks after liver transplantation. | |
| Outcomes | Mortality, retransplantation, graft rejection, and recurrence of viral hepatitis. | |
| Notes | Reasons for post‐randomisation drop‐out: low white cell count (n = 3); adjuvant chemotherapy (n = 1); refusal to enter (n = 1). Attempted to contact the authors in September 2010. No replies were received. Consent for liver donation: not stated. The study report stated that ethical approval was obtained for the research. | |
| Risk of bias | ||
| Bias | Authors' judgement | Support for judgement |
| Random sequence generation (selection bias) | Unclear risk | Comment: this information was not available. |
| Allocation concealment (selection bias) | Unclear risk | Comment: this information was not available. |
| Blinding (performance bias and detection bias) | High risk | Quote: "Protocol biopsies were also reviewed by three pathologists blinded to study group". |
| Incomplete outcome data (attrition bias) | High risk | Comment: post‐randomisation drop‐outs could be related to the outcomes. |
| Selective reporting (reporting bias) | Low risk | Comment: important outcomes such as mortality and retransplantation were reported. |
| Free from source of funding bias? | High risk | Quote: "Supported in part by Ortho Biotech, Raritan, NJ". |
| Methods | Randomised clinical trial. | |
| Participants | Country: USA. | |
| Interventions | The participants were randomly assigned to 1 of 2 groups. Timing of commencement of treatment: 2 to 6 weeks after liver transplantation. | |
| Outcomes | None of the outcomes of interest for this review were reported in this trial. | |
| Notes | Attempted to contact the authors in September 2010. No replies were received. Consent for liver donation: not stated. | |
| Risk of bias | ||
| Bias | Authors' judgement | Support for judgement |
| Random sequence generation (selection bias) | Unclear risk | Comment: this information was not available. |
| Allocation concealment (selection bias) | Unclear risk | Comment: this information was not available. |
| Blinding (performance bias and detection bias) | Unclear risk | Comment: this information was not available. |
| Incomplete outcome data (attrition bias) | Low risk | Comment: there were no post‐randomisation drop‐outs. |
| Selective reporting (reporting bias) | High risk | Comment: important outcomes such as mortality and retransplantation were not reported. |
| Free from source of funding bias? | High risk | Quote: "The study was supported by Fugisawa Healthcare, Inc., and the UCSF Liver Center P30 DK26743 Clinical and Translational Core". |
| Methods | Randomised clinical trial. | |
| Participants | Country: USA. | |
| Interventions | The participants were randomly assigned to 1 of 2 groups. Timing of commencement of treatment: 2 weeks after liver transplantation. | |
| Outcomes | Mortality, retransplantation, graft rejection, and recurrence. | |
| Notes | Attempted to contact the authors in September 2010. No replies were received. Consent for liver donation: not stated. The study report stated that ethical approval was obtained for the research. | |
| Risk of bias | ||
| Bias | Authors' judgement | Support for judgement |
| Random sequence generation (selection bias) | Unclear risk | Comment: this information was not available. |
| Allocation concealment (selection bias) | Unclear risk | Comment: this information was not available. |
| Blinding (performance bias and detection bias) | Unclear risk | Comment: this information was not available. |
| Incomplete outcome data (attrition bias) | Low risk | Comment: there were no post‐randomisation drop‐outs. |
| Selective reporting (reporting bias) | Low risk | Comment: important outcomes such as mortality and retransplantation were reported. |
| Free from source of funding bias? | Unclear risk | Comment: this information was not available. |
| Methods | Randomised clinical trial. | |
| Participants | Country: Canada. | |
| Interventions | The participants were randomly assigned to 1 of 3 groups. Timing of commencement of treatment: anhepatic phase of liver transplantation. | |
| Outcomes | None of the outcomes of interest for this review were reported in this trial. | |
| Notes | Attempted to contact the authors in September 2010. No replies were received. Consent for liver donation: not stated. | |
| Risk of bias | ||
| Bias | Authors' judgement | Support for judgement |
| Random sequence generation (selection bias) | Unclear risk | Comment: this information was not available. |
| Allocation concealment (selection bias) | Unclear risk | Comment: this information was not available. |
| Blinding (performance bias and detection bias) | Low risk | Quote: "Twenty‐six HCV‐RNA positive OLT [orthotopic liver transplantation] candidates were randomly assigned at the time of transplantation to one of three treatment schedules in a double‐blind fashion". |
| Incomplete outcome data (attrition bias) | Unclear risk | Comment: this information was not available. |
| Selective reporting (reporting bias) | High risk | Comment: important outcomes such as mortality and retransplantation were not reported. |
| Free from source of funding bias? | Unclear risk | Comment: this information was not available. |
HBV: hepatitis B virus; HCV: hepatitis C virus; HIV: human immunodeficiency virus; IM: intramuscular; RNA: ribonucleic acid; SC: subcutaneous.
Characteristics of excluded studies [ordered by study ID]
Ir a:
| Study | Reason for exclusion |
| Not a randomised clinical trial. | |
| Not a randomised clinical trial. | |
| Comment on a trial of antiviral therapy in patients with recurrent hepatitis C virus infection after liver transplantation. | |
| Not a randomised clinical trial. | |
| Not a randomised clinical trial. | |
| Not a randomised clinical trial. | |
| Editorial. | |
| No separate data for patients involved in the randomised clinical trial. | |
| Review. | |
| Not a randomised clinical trial. | |
| Editorial. | |
| Editorial. | |
| Comments on trial in patients with recurrent hepatitis C virus infection after liver transplantation. | |
| Comment on a trial of antiviral therapy in patients with recurrent hepatitis C virus infection after liver transplantation. |
Data and analyses
| Outcome or subgroup title | No. of studies | No. of participants | Statistical method | Effect size |
| 1 90‐day mortality Show forest plot | 5 | Risk Ratio (M‐H, Fixed, 95% CI) | Subtotals only | |
| Analysis 1.1  Comparison 1 Intervention versus control, Outcome 1 90‐day mortality. | ||||
| 1.1 Interferon vs. no intervention | 1 | 81 | Risk Ratio (M‐H, Fixed, 95% CI) | 1.31 [0.41, 4.19] |
| 1.2 Pegylated interferon plus ribavirin vs. no intervention | 1 | 115 | Risk Ratio (M‐H, Fixed, 95% CI) | 1.82 [0.46, 7.25] |
| 1.3 HCV antibody vs. placebo | 3 | 53 | Risk Ratio (M‐H, Fixed, 95% CI) | 0.69 [0.15, 3.11] |
| 1.4 HCV antibody (high dose) vs. HCV antibody (low dose) | 2 | 31 | Risk Ratio (M‐H, Fixed, 95% CI) | 2.75 [0.30, 25.35] |
| 2 Mortality at maximal follow‐up Show forest plot | 3 | Risk Ratio (M‐H, Fixed, 95% CI) | Subtotals only | |
| Analysis 1.2  Comparison 1 Intervention versus control, Outcome 2 Mortality at maximal follow‐up. | ||||
| 2.1 Interferon vs. no intervention | 2 | 105 | Risk Ratio (M‐H, Fixed, 95% CI) | 0.86 [0.36, 2.08] |
| 2.2 Pegylated interferon vs. no intervention | 1 | 54 | Risk Ratio (M‐H, Fixed, 95% CI) | 0.54 [0.05, 5.59] |
| 3 Mortality (hazard ratio) Show forest plot | 1 | Hazard Ratio (Fixed, 95% CI) | Subtotals only | |
| Analysis 1.3  Comparison 1 Intervention versus control, Outcome 3 Mortality (hazard ratio). | ||||
| 3.1 Interferon vs. no intervention | 1 | Hazard Ratio (Fixed, 95% CI) | 0.45 [0.13, 1.56] | |
| 4 90‐day retransplantation Show forest plot | 1 | Risk Ratio (M‐H, Fixed, 95% CI) | Subtotals only | |
| Analysis 1.4  Comparison 1 Intervention versus control, Outcome 4 90‐day retransplantation. | ||||
| 4.1 HCV antibody vs. placebo | 1 | 18 | Risk Ratio (M‐H, Fixed, 95% CI) | 1.71 [0.09, 32.93] |
| 4.2 HCV antibody (high dose) vs. HCV antibody (low dose) | 1 | 12 | Risk Ratio (M‐H, Fixed, 95% CI) | 3.0 [0.15, 61.74] |
| 5 Retransplantation at maximal follow‐up Show forest plot | 2 | Risk Ratio (M‐H, Fixed, 95% CI) | Subtotals only | |
| Analysis 1.5  Comparison 1 Intervention versus control, Outcome 5 Retransplantation at maximal follow‐up. | ||||
| 5.1 Interferon vs. no intervention | 2 | 105 | Risk Ratio (M‐H, Fixed, 95% CI) | 1.17 [0.22, 6.20] |
| 6 Serious adverse events Show forest plot | 3 | Risk Ratio (M‐H, Fixed, 95% CI) | Subtotals only | |
| Analysis 1.6  Comparison 1 Intervention versus control, Outcome 6 Serious adverse events. | ||||
| 6.1 Pegylated interferon vs. no intervention | 1 | 54 | Risk Ratio (M‐H, Fixed, 95% CI) | 0.97 [0.47, 2.00] |
| 6.2 Pegylated interferon plus ribavirin vs. no intervention | 1 | 115 | Risk Ratio (M‐H, Fixed, 95% CI) | 1.79 [1.03, 3.12] |
| 6.3 HCV antibody vs. placebo | 1 | 11 | Risk Ratio (M‐H, Fixed, 95% CI) | 0.21 [0.03, 1.31] |
| 7 Anaemia Show forest plot | 4 | Risk Ratio (M‐H, Fixed, 95% CI) | Subtotals only | |
| Analysis 1.7  Comparison 1 Intervention versus control, Outcome 7 Anaemia. | ||||
| 7.1 Interferon plus ribavirin vs. no intervention | 1 | 32 | Risk Ratio (M‐H, Fixed, 95% CI) | 13.64 [0.88, 210.72] |
| 7.2 Pegylated interferon vs. no intervention | 1 | 54 | Risk Ratio (M‐H, Fixed, 95% CI) | 0.43 [0.09, 2.03] |
| 7.3 Pegylated interferon plus ribavirin vs. no intervention | 1 | 100 | Risk Ratio (M‐H, Fixed, 95% CI) | 11.07 [1.51, 81.47] |
| 7.4 Ribavirin vs. no intervention | 1 | 19 | Risk Ratio (M‐H, Fixed, 95% CI) | 6.75 [0.41, 110.01] |
| 8 Leukopenia Show forest plot | 4 | Risk Ratio (M‐H, Fixed, 95% CI) | Subtotals only | |
| Analysis 1.8  Comparison 1 Intervention versus control, Outcome 8 Leukopenia. | ||||
| 8.1 Interferon vs. no intervention | 1 | 24 | Risk Ratio (M‐H, Fixed, 95% CI) | 5.0 [0.27, 94.34] |
| 8.2 Pegylated interferon vs. no intervention | 1 | 54 | Risk Ratio (M‐H, Fixed, 95% CI) | 1.29 [0.45, 3.73] |
| 8.3 Pegylated interferon plus ribavirin vs. no intervention | 1 | 100 | Risk Ratio (M‐H, Fixed, 95% CI) | 3.98 [1.22, 12.98] |
| 8.4 HCV monoclonal antibody vs. placebo | 1 | 11 | Risk Ratio (M‐H, Fixed, 95% CI) | 0.21 [0.03, 1.31] |
| 9 Graft rejection requiring retransplantation Show forest plot | 1 | Risk Ratio (M‐H, Fixed, 95% CI) | Subtotals only | |
| Analysis 1.9  Comparison 1 Intervention versus control, Outcome 9 Graft rejection requiring retransplantation. | ||||
| 9.1 Interferon vs. no intervention | 1 | 31 | Risk Ratio (M‐H, Fixed, 95% CI) | 0.0 [0.0, 0.0] |
| 9.2 Interferon plus ribavirin vs. no intervention | 1 | 32 | Risk Ratio (M‐H, Fixed, 95% CI) | 0.0 [0.0, 0.0] |
| 9.3 Ribavirin plus interferon vs. interferon | 1 | 43 | Risk Ratio (M‐H, Fixed, 95% CI) | 0.0 [0.0, 0.0] |
| 10 Graft rejection requiring steroids or equivalent drugs Show forest plot | 4 | Risk Ratio (M‐H, Fixed, 95% CI) | Subtotals only | |
| Analysis 1.10  Comparison 1 Intervention versus control, Outcome 10 Graft rejection requiring steroids or equivalent drugs. | ||||
| 10.1 Interferon vs. no intervention | 3 | 136 | Risk Ratio (M‐H, Fixed, 95% CI) | 1.02 [0.68, 1.51] |
| 10.2 Interferon plus ribavirin vs. no intervention | 1 | 32 | Risk Ratio (M‐H, Fixed, 95% CI) | 0.0 [0.0, 0.0] |
| 10.3 Pegylated interferon vs. no intervention | 1 | 54 | Risk Ratio (M‐H, Fixed, 95% CI) | 0.81 [0.20, 3.27] |
| 10.4 Ribavirin plus interferon vs. interferon | 1 | 43 | Risk Ratio (M‐H, Fixed, 95% CI) | 0.0 [0.0, 0.0] |
| 11 Graft rejection (others) Show forest plot | 4 | Risk Ratio (M‐H, Fixed, 95% CI) | Subtotals only | |
| Analysis 1.11  Comparison 1 Intervention versus control, Outcome 11 Graft rejection (others). | ||||
| 11.1 Interferon vs. no intervention | 1 | 31 | Risk Ratio (M‐H, Fixed, 95% CI) | 0.0 [0.0, 0.0] |
| 11.2 Interferon plus ribavirin vs. no intervention | 1 | 32 | Risk Ratio (M‐H, Fixed, 95% CI) | 0.0 [0.0, 0.0] |
| 11.3 Pegylated interferon vs. no intervention | 1 | 54 | Risk Ratio (M‐H, Fixed, 95% CI) | 0.21 [0.01, 4.28] |
| 11.4 Pegylated interferon plus ribavirin vs. no intervention | 1 | 115 | Risk Ratio (M‐H, Fixed, 95% CI) | 1.64 [0.49, 5.49] |
| 11.5 Ribavirin vs. no intervention | 1 | 19 | Risk Ratio (M‐H, Fixed, 95% CI) | 1.09 [0.23, 5.09] |
| 11.6 Ribavirin plus interferon vs. interferon | 1 | 43 | Risk Ratio (M‐H, Fixed, 95% CI) | 0.0 [0.0, 0.0] |
| 12 Fibrosis worsening Show forest plot | 1 | Risk Ratio (M‐H, Fixed, 95% CI) | Subtotals only | |
| Analysis 1.12  Comparison 1 Intervention versus control, Outcome 12 Fibrosis worsening. | ||||
| 12.1 HCV antibody vs. placebo | 1 | 18 | Risk Ratio (M‐H, Fixed, 95% CI) | 0.86 [0.17, 4.43] |
| 12.2 HCV antibody (high dose) vs. HCV antibody (low dose) | 1 | 12 | Risk Ratio (M‐H, Fixed, 95% CI) | 0.33 [0.02, 6.86] |
| 13 Recurrence (hazard ratio) Show forest plot | 2 | Hazard Ratio (Fixed, 95% CI) | Subtotals only | |
| Analysis 1.13  Comparison 1 Intervention versus control, Outcome 13 Recurrence (hazard ratio). | ||||
| 13.1 Interferon vs. no intervention | 2 | Hazard Ratio (Fixed, 95% CI) | 0.87 [0.61, 1.24] | |

Study flow diagram.
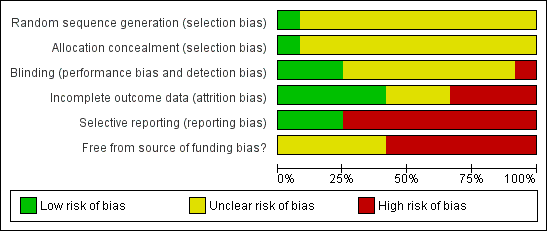
Methodological quality graph: review authors' judgements about each methodological quality item presented as percentages across all included studies.

Methodological quality summary: review authors' judgements about each methodological quality item for each included study.

Trial sequential analysis of 90‐day mortality (hepatitis C virus antibody versus placebo)
The diversity‐adjusted required information size (DARIS) was calculated with 10,577 patients, based on the proportion of patients in the control group with the outcome of 6.3%, a relative risk reduction of 20%, an alpha of 5%, a beta of 20%, and a diversity of 0%. To account for zero event groups, a continuity correction of 0.01 was used in the calculation of the cumulative Z‐curve (blue line). After accruing 53 participants in three trials, only 0.5% of the DARIS was reached. Accordingly, the trial sequential analysis does not show the required information size and the trial sequential monitoring boundaries. As shown, the conventional boundaries (dotted red line) have also not been crossed by the cumulative Z‐curve.

Trial sequential analysis of 90‐day mortality (hepatitis C virus antibody (high dose) versus hepatitis C virus antibody (low dose))
The diversity‐adjusted required information size (DARIS) was calculated with 11,338 patients, based on the proportion of patients in the control group with the outcome of 5.9%, a relative risk reduction of 20%, an alpha of 5%, a beta of 20%, and a diversity of 0%. To account for zero event groups, a continuity correction of 0.01 was used in the calculation of the cumulative Z‐curve (blue line). After accruing 31 participants in two trials, only 0.27% of the DARIS has been reached. Accordingly, the trial sequential analysis does not show the required information size and the trial sequential monitoring boundaries. As shown, the conventional boundaries (dotted red line) have also not been crossed by the cumulative Z‐curve.

Trial sequential analysis of mortality at maximal follow‐up (interferon versus no intervention)
The diversity‐adjusted required information size (DARIS) was calculated with 3796 patients, based on the proportion of patients in the control no intervention group with the outcome of 17.2%, a relative risk reduction of 20%, an alpha of 5%, a beta of 20%, and a diversity of 8.54%. To account for zero event groups, a continuity correction of 0.01 was used in the calculation of the cumulative Z‐curve (blue line). After accruing 105 participants in two trials, only 2.77% of the DARIS has been reached. Accordingly, the trial sequential analysis does not show the required information size and the trial sequential monitoring boundaries. As shown, the conventional boundaries (dotted red line) have also not been crossed by the cumulative Z‐curve.

Trial sequential analysis of retransplantation at maximal follow‐up (interferon versus no intervention)
The diversity‐adjusted required information size (DARIS) was calculated with 20,141 patients, based on the proportion of patients in the no intervention control group with the outcome of 3.4%, a relative risk reduction of 20%, an alpha of 5%, a beta of 20%, and a diversity of 8.54%. To account for zero event groups, a continuity correction of 0.01 was used in the calculation of the cumulative Z‐curve (blue line). After accruing 105 participants in two trials, only 0.52% of the DARIS has been reached. Accordingly, the trial sequential analysis does not show the required information size and the trial sequential monitoring boundaries. As shown, the conventional boundaries (dotted red line) have also not been crossed by the cumulative Z‐curve.

Trial sequential analysis of graft rejection requiring steroids or equivalent drugs (interferon versus no intervention)
The diversity‐adjusted required information size (DARIS) was calculated with 1079 patients, based on the proportion of patients in the no intervention control group with the outcome of 41.2%, a relative risk reduction of 20%, an alpha of 5%, a beta of 20%, and a diversity of 8.54%. To account for zero event groups, a continuity correction of 0.01 was used in the calculation of the cumulative Z‐curve (blue line). After accruing 136 participants in three trials, only 12.60% of the DARIS has been reached. Accordingly, the trial sequential analysis does not show the futility area. Neither the trial sequential boundaries (continuous red line) nor the conventional boundaries (dotted red line) have been crossed by the cumulative Z‐curve.

Comparison 1 Intervention versus control, Outcome 1 90‐day mortality.

Comparison 1 Intervention versus control, Outcome 2 Mortality at maximal follow‐up.

Comparison 1 Intervention versus control, Outcome 3 Mortality (hazard ratio).

Comparison 1 Intervention versus control, Outcome 4 90‐day retransplantation.

Comparison 1 Intervention versus control, Outcome 5 Retransplantation at maximal follow‐up.

Comparison 1 Intervention versus control, Outcome 6 Serious adverse events.

Comparison 1 Intervention versus control, Outcome 7 Anaemia.

Comparison 1 Intervention versus control, Outcome 8 Leukopenia.

Comparison 1 Intervention versus control, Outcome 9 Graft rejection requiring retransplantation.

Comparison 1 Intervention versus control, Outcome 10 Graft rejection requiring steroids or equivalent drugs.

Comparison 1 Intervention versus control, Outcome 11 Graft rejection (others).

Comparison 1 Intervention versus control, Outcome 12 Fibrosis worsening.

Comparison 1 Intervention versus control, Outcome 13 Recurrence (hazard ratio).
| Mortality | |||||
| Patient or population: patients undergoing liver transplantation for chronic hepatitis C viral infection. | |||||
| Outcomes | Illustrative comparative risks* (95% CI) | Relative effect | No of participants | Quality of the evidence | |
| Assumed risk | Corresponding risk | ||||
| Control | Intervention | ||||
| Interferon vs. control | |||||
| 90‐day mortality | 109 per 1000 | 142 per 1000 | RR 1.31 | 81 | ⊕⊝⊝⊝ |
| Mortality at maximal follow‐up | 172 per 1000 | 148 per 1000 | RR 0.86 | 105 | ⊕⊝⊝⊝ |
| Mortality (HR) | 100 per 1000 | 46 per 1000 | HR 0.45 | 81 | ⊕⊝⊝⊝ |
| Pegylated interferon vs. control | |||||
| Mortality at maximal follow‐up | 71 per 1000 | 39 per 1000 | RR 0.54 | 54 | ⊕⊝⊝⊝ |
| Pegylated interferon plus ribavirin vs. control | |||||
| 90‐day mortality | 50 per 1000 | 91 per 1000 | RR 1.82 | 115 | ⊕⊝⊝⊝ |
| HCV antibody vs. placebo | |||||
| 90‐day mortality | 62 per 1000 | 43 per 1000 | RR 0.69 | 53 | ⊕⊝⊝⊝ |
| HCV antibody (high dose) vs. HCV antibody (low dose) | |||||
| 90‐day mortality | 59 per 1000 | 162 per 1000 | RR 2.75 | 31 | ⊕⊝⊝⊝ |
| *The basis for the assumed risk is the control group risk across studies. The corresponding risk (and its 95% confidence interval) is based on the assumed risk in the comparison group and the relative effect of the intervention (and its 95% CI). | |||||
| GRADE Working Group grades of evidence | |||||
| 1 The trial(s) was (were) of high risk of bias. | |||||
| Retransplantation | |||||
| Patient or population: patients undergoing liver transplantation for chronic hepatitis C viral infection. | |||||
| Outcomes | Illustrative comparative risks* (95% CI) | Relative effect | No of participants | Quality of the evidence | |
| Assumed risk | Corresponding risk | ||||
| Control | Intervention | ||||
| Interferon vs. control | |||||
| Retransplantation at maximal follow‐up | 34 per 1000 | 40 per 1000 | RR 1.17 | 105 | ⊕⊝⊝⊝ |
| HCV antibody vs. placebo | |||||
| 90‐day retransplantation | 30 per 1000 | 51 per 1000 | RR 1.71 | 18 | ⊕⊝⊝⊝ |
| HCV antibody (high dose) vs. HCV antibody (low dose) | |||||
| 90‐day retransplantation | 30 per 1000 | 90 per 1000 | RR 3 | 12 | ⊕⊝⊝⊝ |
| *The basis for the assumed risk for interferon versus control was the control group risk in the studies. There were no events in the control group for the other two comparisons. So, the control group risk in the interferon versus control comparison was used as the assumed risk. The corresponding risk (and its 95% confidence interval) is based on the assumed risk in the comparison group and the relative effect of the intervention (and its 95% CI). | |||||
| GRADE Working Group grades of evidence | |||||
| 1 The trial(s) was (were) of high risk of bias. | |||||
| Outcome or subgroup title | No. of studies | No. of participants | Statistical method | Effect size |
| 1 90‐day mortality Show forest plot | 5 | Risk Ratio (M‐H, Fixed, 95% CI) | Subtotals only | |
| 1.1 Interferon vs. no intervention | 1 | 81 | Risk Ratio (M‐H, Fixed, 95% CI) | 1.31 [0.41, 4.19] |
| 1.2 Pegylated interferon plus ribavirin vs. no intervention | 1 | 115 | Risk Ratio (M‐H, Fixed, 95% CI) | 1.82 [0.46, 7.25] |
| 1.3 HCV antibody vs. placebo | 3 | 53 | Risk Ratio (M‐H, Fixed, 95% CI) | 0.69 [0.15, 3.11] |
| 1.4 HCV antibody (high dose) vs. HCV antibody (low dose) | 2 | 31 | Risk Ratio (M‐H, Fixed, 95% CI) | 2.75 [0.30, 25.35] |
| 2 Mortality at maximal follow‐up Show forest plot | 3 | Risk Ratio (M‐H, Fixed, 95% CI) | Subtotals only | |
| 2.1 Interferon vs. no intervention | 2 | 105 | Risk Ratio (M‐H, Fixed, 95% CI) | 0.86 [0.36, 2.08] |
| 2.2 Pegylated interferon vs. no intervention | 1 | 54 | Risk Ratio (M‐H, Fixed, 95% CI) | 0.54 [0.05, 5.59] |
| 3 Mortality (hazard ratio) Show forest plot | 1 | Hazard Ratio (Fixed, 95% CI) | Subtotals only | |
| 3.1 Interferon vs. no intervention | 1 | Hazard Ratio (Fixed, 95% CI) | 0.45 [0.13, 1.56] | |
| 4 90‐day retransplantation Show forest plot | 1 | Risk Ratio (M‐H, Fixed, 95% CI) | Subtotals only | |
| 4.1 HCV antibody vs. placebo | 1 | 18 | Risk Ratio (M‐H, Fixed, 95% CI) | 1.71 [0.09, 32.93] |
| 4.2 HCV antibody (high dose) vs. HCV antibody (low dose) | 1 | 12 | Risk Ratio (M‐H, Fixed, 95% CI) | 3.0 [0.15, 61.74] |
| 5 Retransplantation at maximal follow‐up Show forest plot | 2 | Risk Ratio (M‐H, Fixed, 95% CI) | Subtotals only | |
| 5.1 Interferon vs. no intervention | 2 | 105 | Risk Ratio (M‐H, Fixed, 95% CI) | 1.17 [0.22, 6.20] |
| 6 Serious adverse events Show forest plot | 3 | Risk Ratio (M‐H, Fixed, 95% CI) | Subtotals only | |
| 6.1 Pegylated interferon vs. no intervention | 1 | 54 | Risk Ratio (M‐H, Fixed, 95% CI) | 0.97 [0.47, 2.00] |
| 6.2 Pegylated interferon plus ribavirin vs. no intervention | 1 | 115 | Risk Ratio (M‐H, Fixed, 95% CI) | 1.79 [1.03, 3.12] |
| 6.3 HCV antibody vs. placebo | 1 | 11 | Risk Ratio (M‐H, Fixed, 95% CI) | 0.21 [0.03, 1.31] |
| 7 Anaemia Show forest plot | 4 | Risk Ratio (M‐H, Fixed, 95% CI) | Subtotals only | |
| 7.1 Interferon plus ribavirin vs. no intervention | 1 | 32 | Risk Ratio (M‐H, Fixed, 95% CI) | 13.64 [0.88, 210.72] |
| 7.2 Pegylated interferon vs. no intervention | 1 | 54 | Risk Ratio (M‐H, Fixed, 95% CI) | 0.43 [0.09, 2.03] |
| 7.3 Pegylated interferon plus ribavirin vs. no intervention | 1 | 100 | Risk Ratio (M‐H, Fixed, 95% CI) | 11.07 [1.51, 81.47] |
| 7.4 Ribavirin vs. no intervention | 1 | 19 | Risk Ratio (M‐H, Fixed, 95% CI) | 6.75 [0.41, 110.01] |
| 8 Leukopenia Show forest plot | 4 | Risk Ratio (M‐H, Fixed, 95% CI) | Subtotals only | |
| 8.1 Interferon vs. no intervention | 1 | 24 | Risk Ratio (M‐H, Fixed, 95% CI) | 5.0 [0.27, 94.34] |
| 8.2 Pegylated interferon vs. no intervention | 1 | 54 | Risk Ratio (M‐H, Fixed, 95% CI) | 1.29 [0.45, 3.73] |
| 8.3 Pegylated interferon plus ribavirin vs. no intervention | 1 | 100 | Risk Ratio (M‐H, Fixed, 95% CI) | 3.98 [1.22, 12.98] |
| 8.4 HCV monoclonal antibody vs. placebo | 1 | 11 | Risk Ratio (M‐H, Fixed, 95% CI) | 0.21 [0.03, 1.31] |
| 9 Graft rejection requiring retransplantation Show forest plot | 1 | Risk Ratio (M‐H, Fixed, 95% CI) | Subtotals only | |
| 9.1 Interferon vs. no intervention | 1 | 31 | Risk Ratio (M‐H, Fixed, 95% CI) | 0.0 [0.0, 0.0] |
| 9.2 Interferon plus ribavirin vs. no intervention | 1 | 32 | Risk Ratio (M‐H, Fixed, 95% CI) | 0.0 [0.0, 0.0] |
| 9.3 Ribavirin plus interferon vs. interferon | 1 | 43 | Risk Ratio (M‐H, Fixed, 95% CI) | 0.0 [0.0, 0.0] |
| 10 Graft rejection requiring steroids or equivalent drugs Show forest plot | 4 | Risk Ratio (M‐H, Fixed, 95% CI) | Subtotals only | |
| 10.1 Interferon vs. no intervention | 3 | 136 | Risk Ratio (M‐H, Fixed, 95% CI) | 1.02 [0.68, 1.51] |
| 10.2 Interferon plus ribavirin vs. no intervention | 1 | 32 | Risk Ratio (M‐H, Fixed, 95% CI) | 0.0 [0.0, 0.0] |
| 10.3 Pegylated interferon vs. no intervention | 1 | 54 | Risk Ratio (M‐H, Fixed, 95% CI) | 0.81 [0.20, 3.27] |
| 10.4 Ribavirin plus interferon vs. interferon | 1 | 43 | Risk Ratio (M‐H, Fixed, 95% CI) | 0.0 [0.0, 0.0] |
| 11 Graft rejection (others) Show forest plot | 4 | Risk Ratio (M‐H, Fixed, 95% CI) | Subtotals only | |
| 11.1 Interferon vs. no intervention | 1 | 31 | Risk Ratio (M‐H, Fixed, 95% CI) | 0.0 [0.0, 0.0] |
| 11.2 Interferon plus ribavirin vs. no intervention | 1 | 32 | Risk Ratio (M‐H, Fixed, 95% CI) | 0.0 [0.0, 0.0] |
| 11.3 Pegylated interferon vs. no intervention | 1 | 54 | Risk Ratio (M‐H, Fixed, 95% CI) | 0.21 [0.01, 4.28] |
| 11.4 Pegylated interferon plus ribavirin vs. no intervention | 1 | 115 | Risk Ratio (M‐H, Fixed, 95% CI) | 1.64 [0.49, 5.49] |
| 11.5 Ribavirin vs. no intervention | 1 | 19 | Risk Ratio (M‐H, Fixed, 95% CI) | 1.09 [0.23, 5.09] |
| 11.6 Ribavirin plus interferon vs. interferon | 1 | 43 | Risk Ratio (M‐H, Fixed, 95% CI) | 0.0 [0.0, 0.0] |
| 12 Fibrosis worsening Show forest plot | 1 | Risk Ratio (M‐H, Fixed, 95% CI) | Subtotals only | |
| 12.1 HCV antibody vs. placebo | 1 | 18 | Risk Ratio (M‐H, Fixed, 95% CI) | 0.86 [0.17, 4.43] |
| 12.2 HCV antibody (high dose) vs. HCV antibody (low dose) | 1 | 12 | Risk Ratio (M‐H, Fixed, 95% CI) | 0.33 [0.02, 6.86] |
| 13 Recurrence (hazard ratio) Show forest plot | 2 | Hazard Ratio (Fixed, 95% CI) | Subtotals only | |
| 13.1 Interferon vs. no intervention | 2 | Hazard Ratio (Fixed, 95% CI) | 0.87 [0.61, 1.24] | |