انجام زایمان سزارین برنامهریزی شده برای زنان با بارداری دوقلویی
Referencias
منابع مطالعات واردشده در این مرور
منابع مطالعات خارجشده از این مرور
منابع مطالعات در انتظار ارزیابی
منابع اضافی
منابع دیگر نسخههای منتشرشده این مرور
Characteristics of studies
Characteristics of included studies [ordered by study ID]
| Methods | Randomised controlled trial. | |
| Participants | Setting: recruitment between Dec 2003‐April 2011, 2804 women randomised in 106 centres in 25 countries. Participating centres assessed fetal growth and well‐being with the use of ultrasonography at least every 4 weeks and with the use of non‐stress or biophysical profile tests twice weekly if needed; were prepared to perform a CS within 30 minutes if necessary; and had anaesthetic, obstetrical, and nursing staff available in the hospital at the time of planned vaginal delivery. Inclusion criteria: women with twin pregnancy between 32 weeks’ and 38 weeks 6 days gestation. First twin cephalic, both twins alive and weight estimated between 1500 g and 4000 g confirmed by ultrasound. Exclusion: monoamniotic twins, fetal reduction at 13 or more weeks, lethal anomaly, contraindication to VB or previous participation in the twin birth study. | |
| Interventions | Experimental intervention: 1398 women (2795 fetuses) randomised to planned lower segment caesarean delivery. If the first twin delivered vaginally in this group, then CS was attempted with the second twin if this was feasible. Control/comparison intervention: 1406 women (2812 fetuses) randomised to planned vaginal delivery with induction of labour between 37 weeks 5 days and 38 weeks 6 days. (Use of continuous electronic monitoring, epidural and oxytocin at the discretion of the obstetrician. Women were attended by obstetricians experienced in managing vaginal delivery of twins.) | |
| Outcomes | Primary outcome: fetal or neonatal mortality or serious neonatal morbidity. (Neonatal morbidity 0‐27 days) Serious morbidity defined. Maternal death or serious maternal morbidity before 28 days postpartum (defined). Secondary outcomes, infant or child death or poor neurodevelopmental outcome up to 2 years. Maternal satisfaction with mode of delivery, breastfeeding, quality of life, fatigue or depression. | |
| Notes | ||
| Risk of bias | ||
| Bias | Authors' judgement | Support for judgement |
| Random sequence generation (selection bias) | Low risk | Centrally‐controlled randomisation by computer with stratification for parity and gestational age using random block sizes. |
| Allocation concealment (selection bias) | Low risk | See above. Centralised randomisation. |
| Blinding of participants and personnel (performance bias) | High risk | Blinding of women and staff is not feasible for this type of intervention. Lack of blinding could possibly lead to changes in management that might affect outcomes. |
| Blinding of outcome assessment (detection bias) | Unclear risk | There was an attempt to blind assessors for the primary outcome. It was not clear if this was successful. |
| Incomplete outcome data (attrition bias) | Low risk | There was very limited loss to follow‐up for the primary outcomes (2783/ 2795 fetuses included in analysis of primary outcome in the intervention group and 2782/2812 in the control group). Loss balanced in intervention and control groups. There was some further loss to follow‐up for longer‐term maternal outcomes. ITT analysis. |
| Selective reporting (reporting bias) | Low risk | Protocol available as supplementary information and all outcomes appeared to be reported. |
| Other bias | Low risk | There was no evidence of baseline imbalance. The analysis took account of correlation between outcomes for twins. |
| Methods | 'Randomized control trial.' | |
| Participants | Inclusion criteria: twin pregnancy, induced or spontaneous labour, both alive. 1st vertex, 2nd breech or transverse, 35‐42 weeks estimated gestational age, no known fetal anomaly, no signs of acute placental insufficiency or abruption, normal amniotic fluid volume, normal FHR testing, no maternal or obstetric indications for a specific route of delivery, cervix < 7 cm dilated. 60 women randomised. | |
| Interventions | Experimental intervention: planned lower segment CS, preferably with epidural analgesia, but dependent on preference of anaesthetist. Control/comparison intervention: planned VB following evaluation of labour progress using ‘Friedman curve’; continuous electronic fetal monitoring of both babies; lie of 2nd twin confirmed clinically or with ultrasound; if breech, assisted breech delivery planned; of fetal distress or poor progress despite oxytocin, total breech extraction done; artificial rupture of second sac as late as possible; if second twin in oblique or transverse lie, internal version and complete breech extraction under general analgesia or epidural analgesia if in place; routine episiotomy. | |
| Outcomes | Method of delivery; birthweight, Apgar scores, neonatal and maternal complications. | |
| Notes | Setting: Chaim Sheba Medical Centre labour ward. | |
| Risk of bias | ||
| Bias | Authors' judgement | Support for judgement |
| Random sequence generation (selection bias) | Unclear risk | Allocation “changed randomly by a non‐involved person without prior notice on a time basis”. 20% difference in group sizes not accounted for (27 vs 33). |
| Allocation concealment (selection bias) | High risk | See above. |
| Blinding of participants and personnel (performance bias) | High risk | Blinding not feasible. |
| Blinding of outcome assessment (detection bias) | Unclear risk | Not mentioned whether neonatal assessments blinded. |
| Incomplete outcome data (attrition bias) | High risk | 6 women allocated to planned VB excluded from primary analysis for delivery not according to protocol (2 CS and 4 vertex VBs). Analysis was not conducted on an ITT basis. Only categorical neonatal data have been included in the review as data given separately for the 6 excluded women and could be added to the primary data, thus low risk of bias for these outcomes. |
| Selective reporting (reporting bias) | Unclear risk | No pre‐published protocol available to check predefined outcome reporting. |
| Other bias | High risk | Baseline imbalance: CS n = 27 vs vaginal n = 33. |
CS: caesarean section
FHR: fetal heart rate
ITT: intention‐to‐treat
VB: vaginal birth
vs: versus
Characteristics of excluded studies [ordered by study ID]
| Study | Reason for exclusion |
| No numerical data given in abstract. Might be included when full report available. |
Characteristics of studies awaiting assessment [ordered by study ID]
| Methods | 'Randomized.' |
| Participants | Women with twin pregnancy 32 to 38 weeks 6 days. |
| Interventions | Planned CS vs planned VB. |
| Outcomes | No data given in published abstract. |
| Notes | Full report awaited. |
CS: caesarean section
VB: vaginal birth
vs: versus
Data and analyses
| Outcome or subgroup title | No. of studies | No. of participants | Statistical method | Effect size |
| 1 Maternal death or serious maternal morbidity Show forest plot | 2 | 2844 | Risk Ratio (M‐H, Fixed, 95% CI) | 0.86 [0.67, 1.11] |
| Analysis 1.1  Comparison 1 Planned caesarean section versus planned vaginal birth, Outcome 1 Maternal death or serious maternal morbidity. | ||||
| 2 Perinatal or neonatal death or serious neonatal morbidity Show forest plot | 1 | 5565 | Risk Ratio (M‐H, Fixed, 95% CI) | 1.15 [0.80, 1.67] |
| Analysis 1.2  Comparison 1 Planned caesarean section versus planned vaginal birth, Outcome 2 Perinatal or neonatal death or serious neonatal morbidity. | ||||
| 3 Perinatal or infant death or disability in childhood | 0 | 0 | Risk Ratio (M‐H, Fixed, 95% CI) | 0.0 [0.0, 0.0] |
| 4 Perinatal or neonatal death Show forest plot | 2 | 5685 | Risk Ratio (M‐H, Fixed, 95% CI) | 1.41 [0.76, 2.62] |
| Analysis 1.4  Comparison 1 Planned caesarean section versus planned vaginal birth, Outcome 4 Perinatal or neonatal death. | ||||
| 5 Serious neonatal morbidity Show forest plot | 2 | 5644 | Risk Ratio (M‐H, Fixed, 95% CI) | 1.03 [0.65, 1.64] |
| Analysis 1.5  Comparison 1 Planned caesarean section versus planned vaginal birth, Outcome 5 Serious neonatal morbidity. | ||||
| 6 Apgar score less than eight at five minutes Show forest plot | 1 | 120 | Risk Ratio (M‐H, Fixed, 95% CI) | 1.22 [0.18, 8.39] |
| Analysis 1.6  Comparison 1 Planned caesarean section versus planned vaginal birth, Outcome 6 Apgar score less than eight at five minutes. | ||||
| 7 Apgar score less than four at five minutes Show forest plot | 2 | 5644 | Risk Ratio (M‐H, Fixed, 95% CI) | 0.29 [0.06, 1.38] |
| Analysis 1.7  Comparison 1 Planned caesarean section versus planned vaginal birth, Outcome 7 Apgar score less than four at five minutes. | ||||
| 8 Neonatal encephalopathy, as defined by trial authors Show forest plot | 1 | 120 | Risk Ratio (M‐H, Fixed, 95% CI) | 0.0 [0.0, 0.0] |
| Analysis 1.8  Comparison 1 Planned caesarean section versus planned vaginal birth, Outcome 8 Neonatal encephalopathy, as defined by trial authors. | ||||
| 9 Birth trauma, as defined by trial authors Show forest plot | 2 | 5644 | Risk Ratio (M‐H, Fixed, 95% CI) | 0.57 [0.17, 1.95] |
| Analysis 1.9  Comparison 1 Planned caesarean section versus planned vaginal birth, Outcome 9 Birth trauma, as defined by trial authors. | ||||
| 10 Nerve palsy (including brachial plexus injury) Show forest plot | 1 | 120 | Risk Ratio (M‐H, Fixed, 95% CI) | 0.0 [0.0, 0.0] |
| Analysis 1.10  Comparison 1 Planned caesarean section versus planned vaginal birth, Outcome 10 Nerve palsy (including brachial plexus injury). | ||||
| 11 Subdural or intracerebral haemorrhage Show forest plot | 2 | 5644 | Risk Ratio (M‐H, Fixed, 95% CI) | 3.01 [0.31, 28.89] |
| Analysis 1.11  Comparison 1 Planned caesarean section versus planned vaginal birth, Outcome 11 Subdural or intracerebral haemorrhage. | ||||
| 12 Intraventricular haemorrhage: grade III or IV Show forest plot | 1 | 120 | Risk Ratio (M‐H, Fixed, 95% CI) | 0.0 [0.0, 0.0] |
| Analysis 1.12 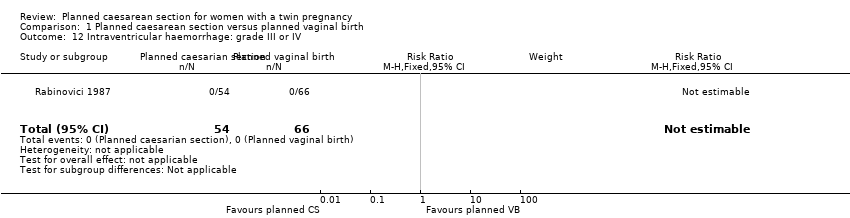 Comparison 1 Planned caesarean section versus planned vaginal birth, Outcome 12 Intraventricular haemorrhage: grade III or IV. | ||||
| 13 Cystic periventricular leukomalacia Show forest plot | 1 | 5524 | Risk Ratio (M‐H, Fixed, 95% CI) | 5.01 [0.24, 104.33] |
| Analysis 1.13  Comparison 1 Planned caesarean section versus planned vaginal birth, Outcome 13 Cystic periventricular leukomalacia. | ||||
| 14 Neonatal sepsis up to 72 hours Show forest plot | 1 | 5524 | Risk Ratio (M‐H, Fixed, 95% CI) | 0.50 [0.05, 5.52] |
| Analysis 1.14  Comparison 1 Planned caesarean section versus planned vaginal birth, Outcome 14 Neonatal sepsis up to 72 hours. | ||||
| 15 Necrotising enterocolitis Show forest plot | 1 | 5524 | Risk Ratio (M‐H, Fixed, 95% CI) | 0.33 [0.03, 3.21] |
| Analysis 1.15  Comparison 1 Planned caesarean section versus planned vaginal birth, Outcome 15 Necrotising enterocolitis. | ||||
| 16 Assisted ventilation for 24 hours or more Show forest plot | 1 | 5524 | Risk Ratio (M‐H, Fixed, 95% CI) | 1.59 [0.87, 2.91] |
| Analysis 1.16  Comparison 1 Planned caesarean section versus planned vaginal birth, Outcome 16 Assisted ventilation for 24 hours or more. | ||||
| 17 Short‐term maternal outcomes: caesarean section Show forest plot | 2 | 2845 | Risk Ratio (M‐H, Random, 95% CI) | 4.77 [0.76, 30.00] |
| Analysis 1.17 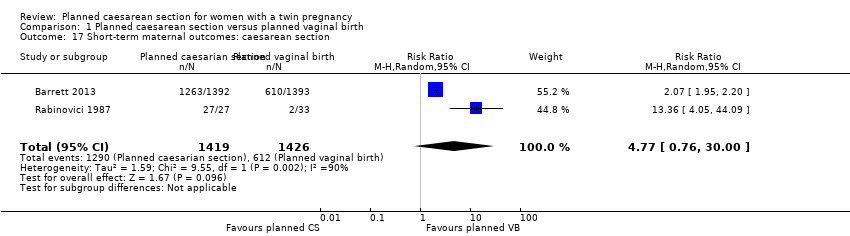 Comparison 1 Planned caesarean section versus planned vaginal birth, Outcome 17 Short‐term maternal outcomes: caesarean section. | ||||
| 18 Short‐term maternal outcomes: mortality Show forest plot | 2 | 2844 | Risk Ratio (M‐H, Fixed, 95% CI) | 1.0 [0.06, 15.97] |
| Analysis 1.18  Comparison 1 Planned caesarean section versus planned vaginal birth, Outcome 18 Short‐term maternal outcomes: mortality. | ||||
| 19 Short‐term maternal outcomes: serious maternal morbidity Show forest plot | 2 | 2842 | Risk Ratio (M‐H, Fixed, 95% CI) | 0.86 [0.67, 1.11] |
| Analysis 1.19  Comparison 1 Planned caesarean section versus planned vaginal birth, Outcome 19 Short‐term maternal outcomes: serious maternal morbidity. | ||||
| 20 Short‐term maternal outcomes: thromboembolism requiring anticoagulant therapy Show forest plot | 1 | 2782 | Risk Ratio (M‐H, Fixed, 95% CI) | 2.5 [0.49, 12.86] |
| Analysis 1.20  Comparison 1 Planned caesarean section versus planned vaginal birth, Outcome 20 Short‐term maternal outcomes: thromboembolism requiring anticoagulant therapy. | ||||
| 21 Short‐term maternal outcomes: wound infection Show forest plot | 1 | 2782 | Risk Ratio (M‐H, Fixed, 95% CI) | 1.5 [0.83, 2.71] |
| Analysis 1.21  Comparison 1 Planned caesarean section versus planned vaginal birth, Outcome 21 Short‐term maternal outcomes: wound infection. | ||||
| 22 Short‐term maternal outcomes: systemic infection Show forest plot | 1 | 2782 | Risk Ratio (M‐H, Fixed, 95% CI) | 1.39 [0.76, 2.53] |
| Analysis 1.22  Comparison 1 Planned caesarean section versus planned vaginal birth, Outcome 22 Short‐term maternal outcomes: systemic infection. | ||||
| 23 Short‐term maternal outcomes: disseminated intravascular coagulation Show forest plot | 1 | 2782 | Risk Ratio (M‐H, Fixed, 95% CI) | 5.0 [0.24, 104.05] |
| Analysis 1.23  Comparison 1 Planned caesarean section versus planned vaginal birth, Outcome 23 Short‐term maternal outcomes: disseminated intravascular coagulation. | ||||
| 24 Short‐term maternal outcomes: amniotic fluid embolism Show forest plot | 1 | 2782 | Risk Ratio (M‐H, Fixed, 95% CI) | 3.0 [0.12, 73.58] |
| Analysis 1.24  Comparison 1 Planned caesarean section versus planned vaginal birth, Outcome 24 Short‐term maternal outcomes: amniotic fluid embolism. | ||||
| 25 Short‐term maternal outcomes: postpartum haemorrhage Show forest plot | 1 | 2782 | Risk Ratio (M‐H, Fixed, 95% CI) | 0.78 [0.59, 1.02] |
| Analysis 1.25  Comparison 1 Planned caesarean section versus planned vaginal birth, Outcome 25 Short‐term maternal outcomes: postpartum haemorrhage. | ||||
| 26 Short‐term maternal outcomes: blood transfusion Show forest plot | 1 | 2782 | Risk Ratio (M‐H, Fixed, 95% CI) | 0.88 [0.64, 1.21] |
| Analysis 1.26  Comparison 1 Planned caesarean section versus planned vaginal birth, Outcome 26 Short‐term maternal outcomes: blood transfusion. | ||||
| 27 Longer‐term maternal outcomes: failure to breastfeed Show forest plot | 1 | 2570 | Risk Ratio (M‐H, Fixed, 95% CI) | 1.14 [0.95, 1.38] |
| Analysis 1.27  Comparison 1 Planned caesarean section versus planned vaginal birth, Outcome 27 Longer‐term maternal outcomes: failure to breastfeed. | ||||
| 28 Longer‐term maternal outcomes: urinary incontinence Show forest plot | 1 | 2570 | Risk Ratio (M‐H, Fixed, 95% CI) | 0.87 [0.64, 1.18] |
| Analysis 1.28  Comparison 1 Planned caesarean section versus planned vaginal birth, Outcome 28 Longer‐term maternal outcomes: urinary incontinence. | ||||
| 29 Longer‐term maternal outcomes: flatus incontinence Show forest plot | 1 | 2570 | Risk Ratio (M‐H, Fixed, 95% CI) | 0.92 [0.77, 1.09] |
| Analysis 1.29  Comparison 1 Planned caesarean section versus planned vaginal birth, Outcome 29 Longer‐term maternal outcomes: flatus incontinence. | ||||
| 30 Longer‐term maternal outcomes: faecal incontinence Show forest plot | 1 | 2570 | Risk Ratio (M‐H, Fixed, 95% CI) | 1.02 [0.69, 1.51] |
| Analysis 1.30  Comparison 1 Planned caesarean section versus planned vaginal birth, Outcome 30 Longer‐term maternal outcomes: faecal incontinence. | ||||
| 31 Longer‐term maternal outcomes: postnatal depression, as defined by trial authors (EPDS > 12) Show forest plot | 1 | 2570 | Risk Ratio (M‐H, Fixed, 95% CI) | 0.95 [0.78, 1.14] |
| Analysis 1.31  Comparison 1 Planned caesarean section versus planned vaginal birth, Outcome 31 Longer‐term maternal outcomes: postnatal depression, as defined by trial authors (EPDS > 12). | ||||
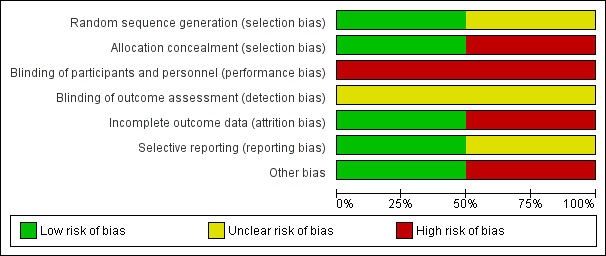
'Risk of bias' graph: review authors' judgements about each risk of bias item presented as percentages across all included studies.

'Risk of bias' summary: review authors' judgements about each risk of bias item for each included study.

Comparison 1 Planned caesarean section versus planned vaginal birth, Outcome 1 Maternal death or serious maternal morbidity.
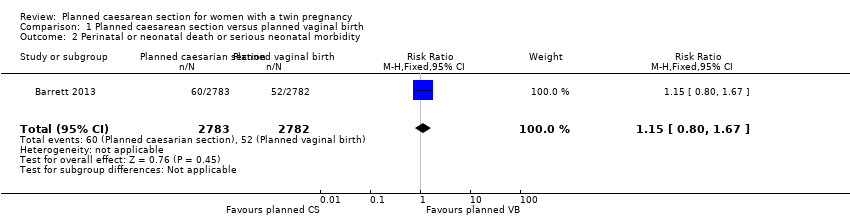
Comparison 1 Planned caesarean section versus planned vaginal birth, Outcome 2 Perinatal or neonatal death or serious neonatal morbidity.

Comparison 1 Planned caesarean section versus planned vaginal birth, Outcome 4 Perinatal or neonatal death.

Comparison 1 Planned caesarean section versus planned vaginal birth, Outcome 5 Serious neonatal morbidity.

Comparison 1 Planned caesarean section versus planned vaginal birth, Outcome 6 Apgar score less than eight at five minutes.
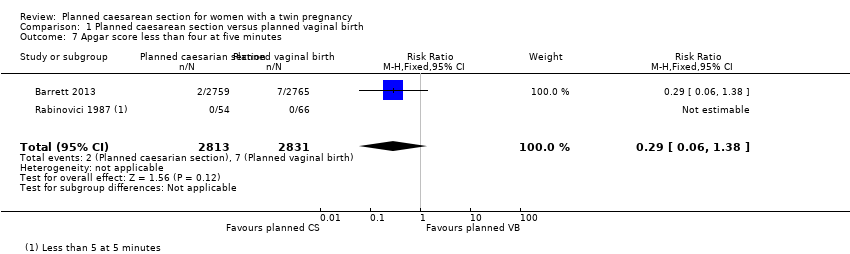
Comparison 1 Planned caesarean section versus planned vaginal birth, Outcome 7 Apgar score less than four at five minutes.

Comparison 1 Planned caesarean section versus planned vaginal birth, Outcome 8 Neonatal encephalopathy, as defined by trial authors.

Comparison 1 Planned caesarean section versus planned vaginal birth, Outcome 9 Birth trauma, as defined by trial authors.

Comparison 1 Planned caesarean section versus planned vaginal birth, Outcome 10 Nerve palsy (including brachial plexus injury).

Comparison 1 Planned caesarean section versus planned vaginal birth, Outcome 11 Subdural or intracerebral haemorrhage.

Comparison 1 Planned caesarean section versus planned vaginal birth, Outcome 12 Intraventricular haemorrhage: grade III or IV.

Comparison 1 Planned caesarean section versus planned vaginal birth, Outcome 13 Cystic periventricular leukomalacia.

Comparison 1 Planned caesarean section versus planned vaginal birth, Outcome 14 Neonatal sepsis up to 72 hours.
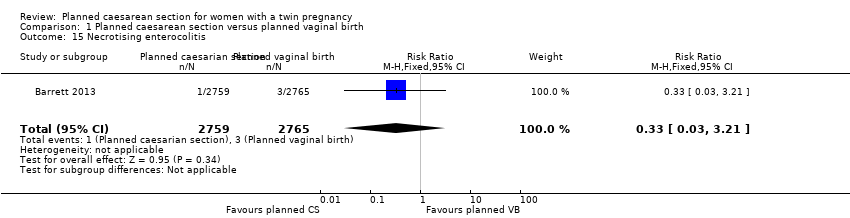
Comparison 1 Planned caesarean section versus planned vaginal birth, Outcome 15 Necrotising enterocolitis.
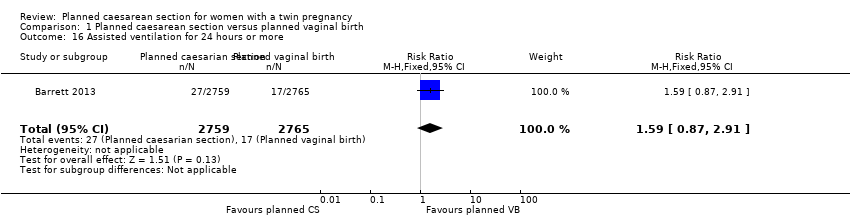
Comparison 1 Planned caesarean section versus planned vaginal birth, Outcome 16 Assisted ventilation for 24 hours or more.

Comparison 1 Planned caesarean section versus planned vaginal birth, Outcome 17 Short‐term maternal outcomes: caesarean section.

Comparison 1 Planned caesarean section versus planned vaginal birth, Outcome 18 Short‐term maternal outcomes: mortality.

Comparison 1 Planned caesarean section versus planned vaginal birth, Outcome 19 Short‐term maternal outcomes: serious maternal morbidity.

Comparison 1 Planned caesarean section versus planned vaginal birth, Outcome 20 Short‐term maternal outcomes: thromboembolism requiring anticoagulant therapy.

Comparison 1 Planned caesarean section versus planned vaginal birth, Outcome 21 Short‐term maternal outcomes: wound infection.

Comparison 1 Planned caesarean section versus planned vaginal birth, Outcome 22 Short‐term maternal outcomes: systemic infection.

Comparison 1 Planned caesarean section versus planned vaginal birth, Outcome 23 Short‐term maternal outcomes: disseminated intravascular coagulation.

Comparison 1 Planned caesarean section versus planned vaginal birth, Outcome 24 Short‐term maternal outcomes: amniotic fluid embolism.
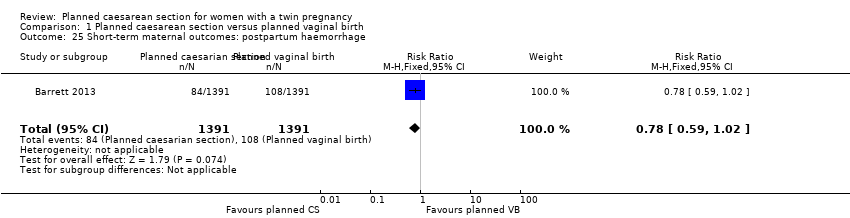
Comparison 1 Planned caesarean section versus planned vaginal birth, Outcome 25 Short‐term maternal outcomes: postpartum haemorrhage.
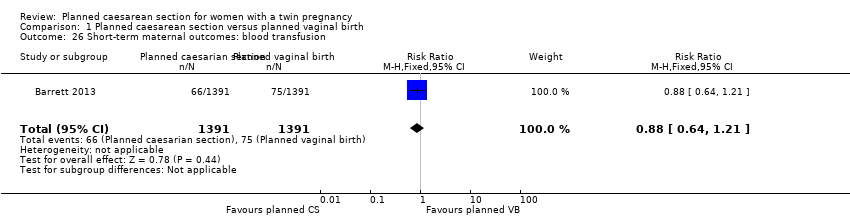
Comparison 1 Planned caesarean section versus planned vaginal birth, Outcome 26 Short‐term maternal outcomes: blood transfusion.

Comparison 1 Planned caesarean section versus planned vaginal birth, Outcome 27 Longer‐term maternal outcomes: failure to breastfeed.

Comparison 1 Planned caesarean section versus planned vaginal birth, Outcome 28 Longer‐term maternal outcomes: urinary incontinence.

Comparison 1 Planned caesarean section versus planned vaginal birth, Outcome 29 Longer‐term maternal outcomes: flatus incontinence.
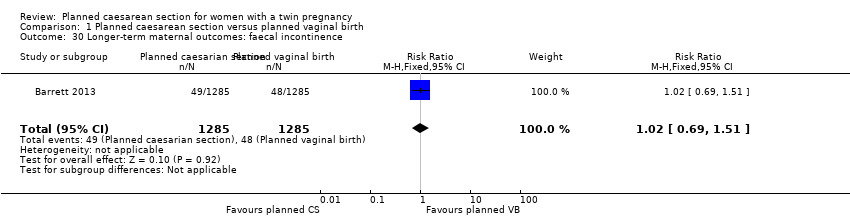
Comparison 1 Planned caesarean section versus planned vaginal birth, Outcome 30 Longer‐term maternal outcomes: faecal incontinence.

Comparison 1 Planned caesarean section versus planned vaginal birth, Outcome 31 Longer‐term maternal outcomes: postnatal depression, as defined by trial authors (EPDS > 12).
| Planned caesarean section versus planned vaginal birth for women with a twin pregnancy | ||||||
| Patient or population: women with a twin pregnancy | ||||||
| Outcomes | Anticipated absolute effects* (95% CI) | Relative effect | № of participants | Quality of the evidence | Comments | |
| Risk with planned vaginal birth | Risk with Planned caesarean section | |||||
| Maternal death or serious maternal morbidity | Study population | RR 0.86 | 2844 | ⊕⊕⊕⊝ | ||
| 83 per 1000 | 71 per 1000 | |||||
| Moderate | ||||||
| 42 per 1000 | 36 per 1000 | |||||
| Perinatal or neonatal death or serious neonatal morbidity | Study population | RR 1.15 | 5565 | ⊕⊕⊕⊝ | ||
| 19 per 1000 | 21 per 1000 | |||||
| Disability in childhood | Study population | not pooled | 0 | No data were available for this outcome | ||
| not pooled | not pooled | |||||
| Perinatal or neonatal death | Study population | RR 1.41 | 5685 | ⊕⊕⊕⊝ | ||
| 6 per 1000 | 8 per 1000 | |||||
| Moderate | ||||||
| 3 per 1000 | 4 per 1000 | |||||
| Serious neonatal morbidity | Study population | RR 1.03 | 5644 | ⊕⊕⊕⊝ | ||
| 12 per 1000 | 13 per 1000 | |||||
| Moderate | ||||||
| 6 per 1000 | 6 per 1000 | |||||
| Longer‐term maternal outcomes: failure to breastfeed | Study population | RR 1.14 | 2570 | ⊕⊕⊕⊝ | ||
| 136 per 1000 | 155 per 1000 | |||||
| Longer‐term maternal outcomes: postnatal depression, as defined by trial authors (EPDS > 12) | Study population | RR 0.95 | 2570 | ⊕⊕⊕⊝ | ||
| 148 per 1000 | 140 per 1000 | |||||
| *The risk in the intervention group (and its 95% confidence interval) is based on the assumed risk in the comparison group and the relative effect of the intervention (and its 95% CI). | ||||||
| GRADE Working Group grades of evidence | ||||||
| 1 Wide 95% CI crossing the line of no effect | ||||||
| Outcome or subgroup title | No. of studies | No. of participants | Statistical method | Effect size |
| 1 Maternal death or serious maternal morbidity Show forest plot | 2 | 2844 | Risk Ratio (M‐H, Fixed, 95% CI) | 0.86 [0.67, 1.11] |
| 2 Perinatal or neonatal death or serious neonatal morbidity Show forest plot | 1 | 5565 | Risk Ratio (M‐H, Fixed, 95% CI) | 1.15 [0.80, 1.67] |
| 3 Perinatal or infant death or disability in childhood | 0 | 0 | Risk Ratio (M‐H, Fixed, 95% CI) | 0.0 [0.0, 0.0] |
| 4 Perinatal or neonatal death Show forest plot | 2 | 5685 | Risk Ratio (M‐H, Fixed, 95% CI) | 1.41 [0.76, 2.62] |
| 5 Serious neonatal morbidity Show forest plot | 2 | 5644 | Risk Ratio (M‐H, Fixed, 95% CI) | 1.03 [0.65, 1.64] |
| 6 Apgar score less than eight at five minutes Show forest plot | 1 | 120 | Risk Ratio (M‐H, Fixed, 95% CI) | 1.22 [0.18, 8.39] |
| 7 Apgar score less than four at five minutes Show forest plot | 2 | 5644 | Risk Ratio (M‐H, Fixed, 95% CI) | 0.29 [0.06, 1.38] |
| 8 Neonatal encephalopathy, as defined by trial authors Show forest plot | 1 | 120 | Risk Ratio (M‐H, Fixed, 95% CI) | 0.0 [0.0, 0.0] |
| 9 Birth trauma, as defined by trial authors Show forest plot | 2 | 5644 | Risk Ratio (M‐H, Fixed, 95% CI) | 0.57 [0.17, 1.95] |
| 10 Nerve palsy (including brachial plexus injury) Show forest plot | 1 | 120 | Risk Ratio (M‐H, Fixed, 95% CI) | 0.0 [0.0, 0.0] |
| 11 Subdural or intracerebral haemorrhage Show forest plot | 2 | 5644 | Risk Ratio (M‐H, Fixed, 95% CI) | 3.01 [0.31, 28.89] |
| 12 Intraventricular haemorrhage: grade III or IV Show forest plot | 1 | 120 | Risk Ratio (M‐H, Fixed, 95% CI) | 0.0 [0.0, 0.0] |
| 13 Cystic periventricular leukomalacia Show forest plot | 1 | 5524 | Risk Ratio (M‐H, Fixed, 95% CI) | 5.01 [0.24, 104.33] |
| 14 Neonatal sepsis up to 72 hours Show forest plot | 1 | 5524 | Risk Ratio (M‐H, Fixed, 95% CI) | 0.50 [0.05, 5.52] |
| 15 Necrotising enterocolitis Show forest plot | 1 | 5524 | Risk Ratio (M‐H, Fixed, 95% CI) | 0.33 [0.03, 3.21] |
| 16 Assisted ventilation for 24 hours or more Show forest plot | 1 | 5524 | Risk Ratio (M‐H, Fixed, 95% CI) | 1.59 [0.87, 2.91] |
| 17 Short‐term maternal outcomes: caesarean section Show forest plot | 2 | 2845 | Risk Ratio (M‐H, Random, 95% CI) | 4.77 [0.76, 30.00] |
| 18 Short‐term maternal outcomes: mortality Show forest plot | 2 | 2844 | Risk Ratio (M‐H, Fixed, 95% CI) | 1.0 [0.06, 15.97] |
| 19 Short‐term maternal outcomes: serious maternal morbidity Show forest plot | 2 | 2842 | Risk Ratio (M‐H, Fixed, 95% CI) | 0.86 [0.67, 1.11] |
| 20 Short‐term maternal outcomes: thromboembolism requiring anticoagulant therapy Show forest plot | 1 | 2782 | Risk Ratio (M‐H, Fixed, 95% CI) | 2.5 [0.49, 12.86] |
| 21 Short‐term maternal outcomes: wound infection Show forest plot | 1 | 2782 | Risk Ratio (M‐H, Fixed, 95% CI) | 1.5 [0.83, 2.71] |
| 22 Short‐term maternal outcomes: systemic infection Show forest plot | 1 | 2782 | Risk Ratio (M‐H, Fixed, 95% CI) | 1.39 [0.76, 2.53] |
| 23 Short‐term maternal outcomes: disseminated intravascular coagulation Show forest plot | 1 | 2782 | Risk Ratio (M‐H, Fixed, 95% CI) | 5.0 [0.24, 104.05] |
| 24 Short‐term maternal outcomes: amniotic fluid embolism Show forest plot | 1 | 2782 | Risk Ratio (M‐H, Fixed, 95% CI) | 3.0 [0.12, 73.58] |
| 25 Short‐term maternal outcomes: postpartum haemorrhage Show forest plot | 1 | 2782 | Risk Ratio (M‐H, Fixed, 95% CI) | 0.78 [0.59, 1.02] |
| 26 Short‐term maternal outcomes: blood transfusion Show forest plot | 1 | 2782 | Risk Ratio (M‐H, Fixed, 95% CI) | 0.88 [0.64, 1.21] |
| 27 Longer‐term maternal outcomes: failure to breastfeed Show forest plot | 1 | 2570 | Risk Ratio (M‐H, Fixed, 95% CI) | 1.14 [0.95, 1.38] |
| 28 Longer‐term maternal outcomes: urinary incontinence Show forest plot | 1 | 2570 | Risk Ratio (M‐H, Fixed, 95% CI) | 0.87 [0.64, 1.18] |
| 29 Longer‐term maternal outcomes: flatus incontinence Show forest plot | 1 | 2570 | Risk Ratio (M‐H, Fixed, 95% CI) | 0.92 [0.77, 1.09] |
| 30 Longer‐term maternal outcomes: faecal incontinence Show forest plot | 1 | 2570 | Risk Ratio (M‐H, Fixed, 95% CI) | 1.02 [0.69, 1.51] |
| 31 Longer‐term maternal outcomes: postnatal depression, as defined by trial authors (EPDS > 12) Show forest plot | 1 | 2570 | Risk Ratio (M‐H, Fixed, 95% CI) | 0.95 [0.78, 1.14] |