Cesárea programada para mujeres con embarazo gemelar
Información
- DOI:
- https://doi.org/10.1002/14651858.CD006553.pub3Copiar DOI

- Base de datos:
-
- Cochrane Database of Systematic Reviews
- Versión publicada:
-
- 19 diciembre 2015see what's new
- Tipo:
-
- Intervention
- Etapa:
-
- Review
- Grupo Editorial Cochrane:
-
Grupo Cochrane de Embarazo y parto
- Copyright:
-
- Copyright © 2019 The Cochrane Collaboration. Published by John Wiley & Sons, Ltd.
Cifras del artículo
Altmetric:
Citado por:
Autores
Contributions of authors
CA Crowther prepared a previous version of this review, limited to twin pregnancies with non‐vertex second twin (Caesarean delivery for the second twin ‐ seeCrowther 1996), and contributed to the development of this protocol and review.
JF Barrett reviewed the topic, prepared a first draft of the background, and contributed to the protocol and review development.
GJ Hofmeyr prepared the first draft of the protocol and of the review, and is the guarantor of the review.
Sources of support
Internal sources
-
(GJH) Effective Care Research Unit, University of the Witwatersrand, University of Fort Hare, Eastern Cape Department of Health, South Africa.
-
(CC) ARCH: Australian Research Centre for Health of Women and Babies, Robinson Research Institute, The University of Adelaide, Australia.
External sources
-
(GJH) HRP‐UNDP/UNFPA/WHO/World Bank Special Programme in Human Reproduction, Geneva, Switzerland.
-
(CC) National Health and Medical Research Council, Australia Funding for the PCG Australian and New Zealand Satellite, Australia.
-
National Institute for Health Research (NIHR), UKNIHR Cochrane Programme Grant Project: 13/89/05 – Pregnancy and childbirth systematic reviews to support clinical guidelines, UK.
Declarations of interest
JF Barrett is principal investigator for Barrett 2013. He did not participate in decisions relating to that study.
Justus Hofmeyr receives royalties from UpToDate for chapters related to breech pregnancy, delivery of a baby in breech presentation and external cephalic version. UpToDate is an electronic publication by Wolters Kluwer to disseminate evidence‐based medicine (such as Cochrane reviews).
Acknowledgements
For this update, Therese Dowswell (TD) (Cochrane Pregnancy and Childbirth Group) provided assistance in data extraction and entry and in grading the evidence for the 'Summary of findings' table. TD is supported by the NIHR Cochrane Programme Grant Project: 13/89/05 – Pregnancy and childbirth systematic reviews to support clinical guidelines.
This project was supported by the National Institute for Health Research, via Cochrane Infrastructure and Cochrane programme Grant funding to Cochrane Pregnancy and Childbirth. The views and opinions expressed therein are those of the authors and do not necessarily reflect those of the Systematic Reviews Programme, NIHR, NHS or the Department of Health.
Stephen Milan for assistance with data extraction and compiling a previous version of the review; Sonja Henderson and the Cochrane Pregnancy and Childbirth Group team for administrative support.
Version history
| Published | Title | Stage | Authors | Version |
| 2015 Dec 19 | Planned caesarean section for women with a twin pregnancy | Review | G Justus Hofmeyr, Jon F Barrett, Caroline A Crowther | |
| 2011 Dec 07 | Planned caesarean section for women with a twin pregnancy | Review | G Justus Hofmeyr, Jon F Barrett, Caroline A Crowther | |
| 2007 Apr 18 | Planned caesarean section for women with a twin pregnancy | Protocol | G Justus Hofmeyr, Jon F Barrett, Caroline A Crowther | |
Differences between protocol and review
The methods section has been updated to reflect the Pregnancy and Childbirth Group's updated methods text and the latest Cochrane Handbook (Higgins 2011). A 'Summary of findings' table has been incorporated for this update and the quality of the evidence assessed using the GRADE approach.
Keywords
MeSH
Medical Subject Headings (MeSH) Keywords
Medical Subject Headings Check Words
Female; Humans; Infant, Newborn; Pregnancy;
PICO
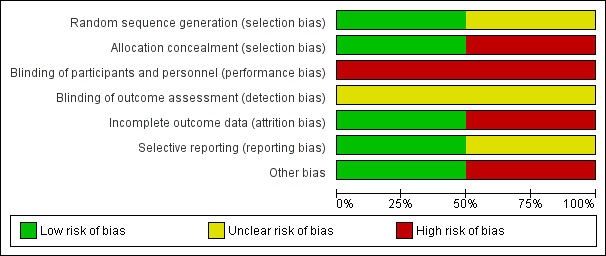
'Risk of bias' graph: review authors' judgements about each risk of bias item presented as percentages across all included studies.

'Risk of bias' summary: review authors' judgements about each risk of bias item for each included study.

Comparison 1 Planned caesarean section versus planned vaginal birth, Outcome 1 Maternal death or serious maternal morbidity.
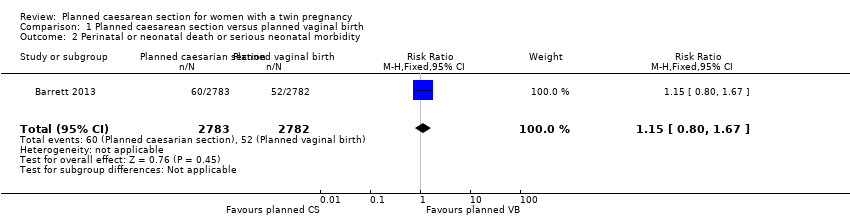
Comparison 1 Planned caesarean section versus planned vaginal birth, Outcome 2 Perinatal or neonatal death or serious neonatal morbidity.

Comparison 1 Planned caesarean section versus planned vaginal birth, Outcome 4 Perinatal or neonatal death.

Comparison 1 Planned caesarean section versus planned vaginal birth, Outcome 5 Serious neonatal morbidity.

Comparison 1 Planned caesarean section versus planned vaginal birth, Outcome 6 Apgar score less than eight at five minutes.
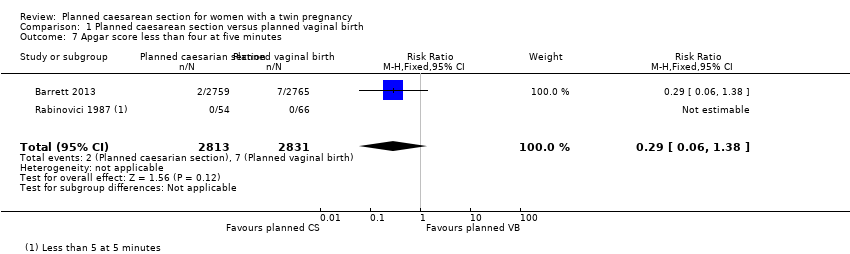
Comparison 1 Planned caesarean section versus planned vaginal birth, Outcome 7 Apgar score less than four at five minutes.

Comparison 1 Planned caesarean section versus planned vaginal birth, Outcome 8 Neonatal encephalopathy, as defined by trial authors.

Comparison 1 Planned caesarean section versus planned vaginal birth, Outcome 9 Birth trauma, as defined by trial authors.

Comparison 1 Planned caesarean section versus planned vaginal birth, Outcome 10 Nerve palsy (including brachial plexus injury).

Comparison 1 Planned caesarean section versus planned vaginal birth, Outcome 11 Subdural or intracerebral haemorrhage.
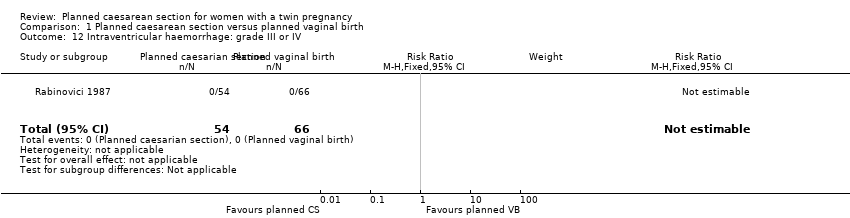
Comparison 1 Planned caesarean section versus planned vaginal birth, Outcome 12 Intraventricular haemorrhage: grade III or IV.

Comparison 1 Planned caesarean section versus planned vaginal birth, Outcome 13 Cystic periventricular leukomalacia.

Comparison 1 Planned caesarean section versus planned vaginal birth, Outcome 14 Neonatal sepsis up to 72 hours.
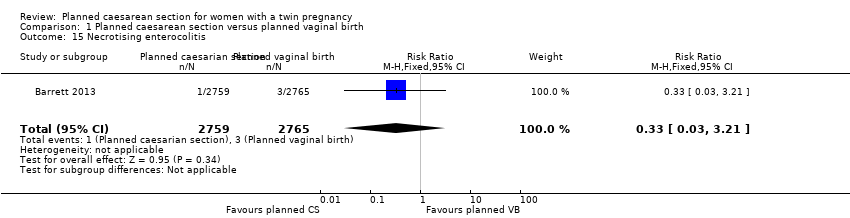
Comparison 1 Planned caesarean section versus planned vaginal birth, Outcome 15 Necrotising enterocolitis.
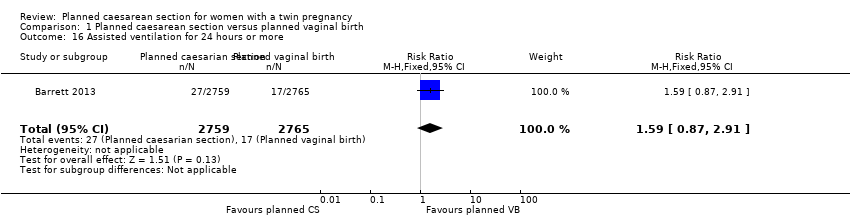
Comparison 1 Planned caesarean section versus planned vaginal birth, Outcome 16 Assisted ventilation for 24 hours or more.

Comparison 1 Planned caesarean section versus planned vaginal birth, Outcome 17 Short‐term maternal outcomes: caesarean section.

Comparison 1 Planned caesarean section versus planned vaginal birth, Outcome 18 Short‐term maternal outcomes: mortality.

Comparison 1 Planned caesarean section versus planned vaginal birth, Outcome 19 Short‐term maternal outcomes: serious maternal morbidity.

Comparison 1 Planned caesarean section versus planned vaginal birth, Outcome 20 Short‐term maternal outcomes: thromboembolism requiring anticoagulant therapy.

Comparison 1 Planned caesarean section versus planned vaginal birth, Outcome 21 Short‐term maternal outcomes: wound infection.

Comparison 1 Planned caesarean section versus planned vaginal birth, Outcome 22 Short‐term maternal outcomes: systemic infection.

Comparison 1 Planned caesarean section versus planned vaginal birth, Outcome 23 Short‐term maternal outcomes: disseminated intravascular coagulation.

Comparison 1 Planned caesarean section versus planned vaginal birth, Outcome 24 Short‐term maternal outcomes: amniotic fluid embolism.
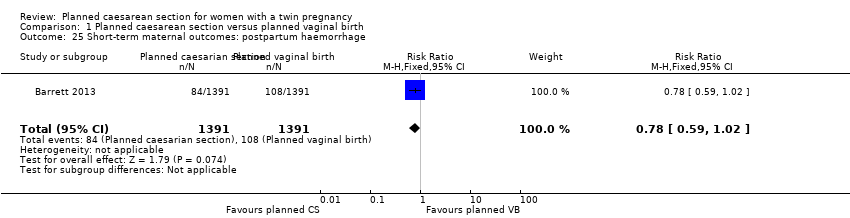
Comparison 1 Planned caesarean section versus planned vaginal birth, Outcome 25 Short‐term maternal outcomes: postpartum haemorrhage.
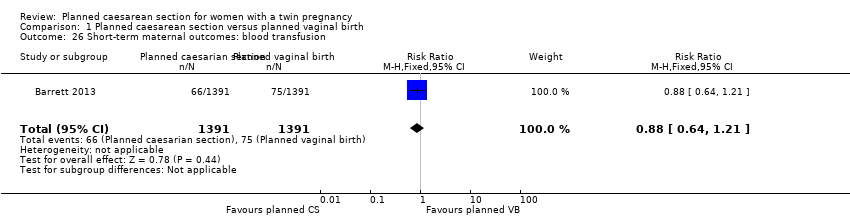
Comparison 1 Planned caesarean section versus planned vaginal birth, Outcome 26 Short‐term maternal outcomes: blood transfusion.

Comparison 1 Planned caesarean section versus planned vaginal birth, Outcome 27 Longer‐term maternal outcomes: failure to breastfeed.

Comparison 1 Planned caesarean section versus planned vaginal birth, Outcome 28 Longer‐term maternal outcomes: urinary incontinence.

Comparison 1 Planned caesarean section versus planned vaginal birth, Outcome 29 Longer‐term maternal outcomes: flatus incontinence.
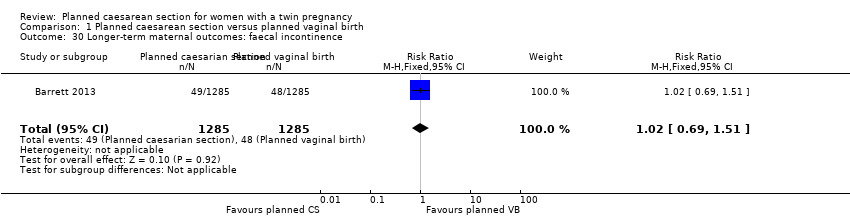
Comparison 1 Planned caesarean section versus planned vaginal birth, Outcome 30 Longer‐term maternal outcomes: faecal incontinence.

Comparison 1 Planned caesarean section versus planned vaginal birth, Outcome 31 Longer‐term maternal outcomes: postnatal depression, as defined by trial authors (EPDS > 12).
| Planned caesarean section versus planned vaginal birth for women with a twin pregnancy | ||||||
| Patient or population: women with a twin pregnancy | ||||||
| Outcomes | Anticipated absolute effects* (95% CI) | Relative effect | № of participants | Quality of the evidence | Comments | |
| Risk with planned vaginal birth | Risk with Planned caesarean section | |||||
| Maternal death or serious maternal morbidity | Study population | RR 0.86 | 2844 | ⊕⊕⊕⊝ | ||
| 83 per 1000 | 71 per 1000 | |||||
| Moderate | ||||||
| 42 per 1000 | 36 per 1000 | |||||
| Perinatal or neonatal death or serious neonatal morbidity | Study population | RR 1.15 | 5565 | ⊕⊕⊕⊝ | ||
| 19 per 1000 | 21 per 1000 | |||||
| Disability in childhood | Study population | not pooled | 0 | No data were available for this outcome | ||
| not pooled | not pooled | |||||
| Perinatal or neonatal death | Study population | RR 1.41 | 5685 | ⊕⊕⊕⊝ | ||
| 6 per 1000 | 8 per 1000 | |||||
| Moderate | ||||||
| 3 per 1000 | 4 per 1000 | |||||
| Serious neonatal morbidity | Study population | RR 1.03 | 5644 | ⊕⊕⊕⊝ | ||
| 12 per 1000 | 13 per 1000 | |||||
| Moderate | ||||||
| 6 per 1000 | 6 per 1000 | |||||
| Longer‐term maternal outcomes: failure to breastfeed | Study population | RR 1.14 | 2570 | ⊕⊕⊕⊝ | ||
| 136 per 1000 | 155 per 1000 | |||||
| Longer‐term maternal outcomes: postnatal depression, as defined by trial authors (EPDS > 12) | Study population | RR 0.95 | 2570 | ⊕⊕⊕⊝ | ||
| 148 per 1000 | 140 per 1000 | |||||
| *The risk in the intervention group (and its 95% confidence interval) is based on the assumed risk in the comparison group and the relative effect of the intervention (and its 95% CI). | ||||||
| GRADE Working Group grades of evidence | ||||||
| 1 Wide 95% CI crossing the line of no effect | ||||||
| Outcome or subgroup title | No. of studies | No. of participants | Statistical method | Effect size |
| 1 Maternal death or serious maternal morbidity Show forest plot | 2 | 2844 | Risk Ratio (M‐H, Fixed, 95% CI) | 0.86 [0.67, 1.11] |
| 2 Perinatal or neonatal death or serious neonatal morbidity Show forest plot | 1 | 5565 | Risk Ratio (M‐H, Fixed, 95% CI) | 1.15 [0.80, 1.67] |
| 3 Perinatal or infant death or disability in childhood | 0 | 0 | Risk Ratio (M‐H, Fixed, 95% CI) | 0.0 [0.0, 0.0] |
| 4 Perinatal or neonatal death Show forest plot | 2 | 5685 | Risk Ratio (M‐H, Fixed, 95% CI) | 1.41 [0.76, 2.62] |
| 5 Serious neonatal morbidity Show forest plot | 2 | 5644 | Risk Ratio (M‐H, Fixed, 95% CI) | 1.03 [0.65, 1.64] |
| 6 Apgar score less than eight at five minutes Show forest plot | 1 | 120 | Risk Ratio (M‐H, Fixed, 95% CI) | 1.22 [0.18, 8.39] |
| 7 Apgar score less than four at five minutes Show forest plot | 2 | 5644 | Risk Ratio (M‐H, Fixed, 95% CI) | 0.29 [0.06, 1.38] |
| 8 Neonatal encephalopathy, as defined by trial authors Show forest plot | 1 | 120 | Risk Ratio (M‐H, Fixed, 95% CI) | 0.0 [0.0, 0.0] |
| 9 Birth trauma, as defined by trial authors Show forest plot | 2 | 5644 | Risk Ratio (M‐H, Fixed, 95% CI) | 0.57 [0.17, 1.95] |
| 10 Nerve palsy (including brachial plexus injury) Show forest plot | 1 | 120 | Risk Ratio (M‐H, Fixed, 95% CI) | 0.0 [0.0, 0.0] |
| 11 Subdural or intracerebral haemorrhage Show forest plot | 2 | 5644 | Risk Ratio (M‐H, Fixed, 95% CI) | 3.01 [0.31, 28.89] |
| 12 Intraventricular haemorrhage: grade III or IV Show forest plot | 1 | 120 | Risk Ratio (M‐H, Fixed, 95% CI) | 0.0 [0.0, 0.0] |
| 13 Cystic periventricular leukomalacia Show forest plot | 1 | 5524 | Risk Ratio (M‐H, Fixed, 95% CI) | 5.01 [0.24, 104.33] |
| 14 Neonatal sepsis up to 72 hours Show forest plot | 1 | 5524 | Risk Ratio (M‐H, Fixed, 95% CI) | 0.50 [0.05, 5.52] |
| 15 Necrotising enterocolitis Show forest plot | 1 | 5524 | Risk Ratio (M‐H, Fixed, 95% CI) | 0.33 [0.03, 3.21] |
| 16 Assisted ventilation for 24 hours or more Show forest plot | 1 | 5524 | Risk Ratio (M‐H, Fixed, 95% CI) | 1.59 [0.87, 2.91] |
| 17 Short‐term maternal outcomes: caesarean section Show forest plot | 2 | 2845 | Risk Ratio (M‐H, Random, 95% CI) | 4.77 [0.76, 30.00] |
| 18 Short‐term maternal outcomes: mortality Show forest plot | 2 | 2844 | Risk Ratio (M‐H, Fixed, 95% CI) | 1.0 [0.06, 15.97] |
| 19 Short‐term maternal outcomes: serious maternal morbidity Show forest plot | 2 | 2842 | Risk Ratio (M‐H, Fixed, 95% CI) | 0.86 [0.67, 1.11] |
| 20 Short‐term maternal outcomes: thromboembolism requiring anticoagulant therapy Show forest plot | 1 | 2782 | Risk Ratio (M‐H, Fixed, 95% CI) | 2.5 [0.49, 12.86] |
| 21 Short‐term maternal outcomes: wound infection Show forest plot | 1 | 2782 | Risk Ratio (M‐H, Fixed, 95% CI) | 1.5 [0.83, 2.71] |
| 22 Short‐term maternal outcomes: systemic infection Show forest plot | 1 | 2782 | Risk Ratio (M‐H, Fixed, 95% CI) | 1.39 [0.76, 2.53] |
| 23 Short‐term maternal outcomes: disseminated intravascular coagulation Show forest plot | 1 | 2782 | Risk Ratio (M‐H, Fixed, 95% CI) | 5.0 [0.24, 104.05] |
| 24 Short‐term maternal outcomes: amniotic fluid embolism Show forest plot | 1 | 2782 | Risk Ratio (M‐H, Fixed, 95% CI) | 3.0 [0.12, 73.58] |
| 25 Short‐term maternal outcomes: postpartum haemorrhage Show forest plot | 1 | 2782 | Risk Ratio (M‐H, Fixed, 95% CI) | 0.78 [0.59, 1.02] |
| 26 Short‐term maternal outcomes: blood transfusion Show forest plot | 1 | 2782 | Risk Ratio (M‐H, Fixed, 95% CI) | 0.88 [0.64, 1.21] |
| 27 Longer‐term maternal outcomes: failure to breastfeed Show forest plot | 1 | 2570 | Risk Ratio (M‐H, Fixed, 95% CI) | 1.14 [0.95, 1.38] |
| 28 Longer‐term maternal outcomes: urinary incontinence Show forest plot | 1 | 2570 | Risk Ratio (M‐H, Fixed, 95% CI) | 0.87 [0.64, 1.18] |
| 29 Longer‐term maternal outcomes: flatus incontinence Show forest plot | 1 | 2570 | Risk Ratio (M‐H, Fixed, 95% CI) | 0.92 [0.77, 1.09] |
| 30 Longer‐term maternal outcomes: faecal incontinence Show forest plot | 1 | 2570 | Risk Ratio (M‐H, Fixed, 95% CI) | 1.02 [0.69, 1.51] |
| 31 Longer‐term maternal outcomes: postnatal depression, as defined by trial authors (EPDS > 12) Show forest plot | 1 | 2570 | Risk Ratio (M‐H, Fixed, 95% CI) | 0.95 [0.78, 1.14] |